Article

HBIM-GIS Integration: From IFC to CityGML Standard for Damaged Cultural Heritage in a Multiscale 3D GIS

Department of Environment, Land and Infrastructure Engineering (DIATI), Politecnico di Torino, Corso Duca degli Abruzzi 24, 10129 Turin, Italy
*
Author to whom correspondence should be addressed.
Appl. Sci. 2020, 10(4), 1356; https://doi.org/10.3390/app10041356
Submission received: 21 January 2020 / Revised: 9 February 2020 / Accepted: 13 February 2020 / Published: 17 February 2020
(This article belongs to the Special Issue BIM and HBIM: Standardisation and interoperability)

Abstract

:
This study describes the technical-systemic and conceptual-informative interoperability tests for the integration of a Historic Building Information Modeling (HBIM) model in a 3D Geographic Information System (GIS) environment aimed to provide complete and useful documentation for multiscale analyses on cultural heritage particularly exposed to risks. The case study of the San Lorenzo Church in Norcia (Italy) has been chosen given the urgent need to update the existing documentation for its protection and conservation issues, due to the extensive damage suffered after the series of earthquakes that occurred in central Italy starting from summer 2016. Different tests to evaluate two levels of conceptual interoperability (technical and semantic) when importing the HBIM model into a GIS environment were performed, whether with commercial software or with open source ones (ArcGIS Pro and QGIS, respectively). A data integration platform (Feature Manipulation Engine, FME) has been used for converting the IFC (Industry Foundation Classes) data format into the GML (Geography Markup Language) format, in order to obtain a unique and unified model and vocabulary for the 3D GIS project, structured with different levels of detail, according to CityGML standard. Finally, as HBIM-GIS integration is considered, the loss of geometric and informative data has been taken into account and evaluated.

1. Introduction

Within the AEC (architecture, engineering, construction) industry, the BIM (Building Information Modeling) approach represents an increasingly widespread as much as necessary methodology. Being an interactive data archive [1,2], these models contain geometric data but also non-graphic information, such as materials, thermal characteristics, costs and maintenance instructions, thus they consist in the creation of a central informative and shared model, integrated among every project participant, and it is configured as a dynamic system particularly helpful for the building’s facility management (FM). On the other hand, the use of a GIS (Geographic Information System) is well stated in the literature for its usefulness when managing territorial and urban data, with a variety of different purposes and professional figures involved. The integration between these two domains and the complementary nature of the information provided by each technology could, therefore, lead to have a new data flow and a highly detailed and holistic picture of a project.
Moreover, the latest technological developments, especially in the field of surveying and geomatics, encouraged the large acquisition of point clouds, thus speeding up the Scan-to-BIM process and contributing to the application of the BIM methodology also to the cultural heritage (CH) field. In this regard, the tendency to realize digital 3D models of CH, where historical data are associated to complex geometries, is growing. The aim is to support the conservation and management of built heritage, using the HBIM (Historic Building Information Modeling) approach, that mainly consists of mapping BIM objects over the dense point cloud and then configure the model as a digital data archive, collecting several existing kinds of documentation (historical, archival, iconographical and graphical), often fragmented, sectoral and not updated.
In some specific cases, however, it is necessary to broaden the analysis scale, also including territorial data relating to the context in which the asset is inserted. This solution is particularly useful in the case of historical buildings subject to particularly vulnerable conditions or specific risks such as seismic risk. With respect to this matter, the integration of HBIM models in the GIS environment allows analysis to be carried out at different levels of detail (LoD), starting from the urban scale up to the architectural one, according to the objective and needs.
In this framework, a multiscale project in which the different domains of BIM and GIS are integrated has been set up to ensure complete documentation of an architectural asset damaged by an earthquake. This research proposes therefore to analyze HBIM-GIS interoperability following two different integration methods: the first one relies on the use of commercial software with proprietary format, while the second one takes advantage of the IFC (Industry Foundation Classes) and CityGML (Geography Markup Language) standard formats, compliant with open source software. In detail, a focus on technical and semantic interoperability levels is carried out, investigating the loss of geometric and informative data, in addition to evaluate the results coming from the conversion of the HBIM model into a LoD 3 CityGML.

State of the Art on HBIM-GIS integration: IFC and CityGML Standards

The research interest on the topic of BIM and GIS integration and harmonization has been increasing in the last years. The multitude of studies in the recent literature is due to the necessity of integration between these two different domains in order to express and communicate information on territory, urban areas and buildings at different scales. However, even if the main incompatibilities between BIM and GIS systems have been partially solved, most of the interoperability issues arise when it comes to data conversion between their standards and, most of all, when dealing with HBIM models [3]. In fact, these historical 3D digital models are mainly structured on non-standard categories and classes that have to be able to describe the complex geometries and a variety of attributes and peculiar elements typical of the CH domain. In this case, different solutions could be undertaken from the operator when structuring and defining a model or a project, not allowing a generalization of the methodology.
In general, when facing BIM-GIS integration, one of the main interests highlighted by the state-of-art is to study the various factors related to new buildings, which influence the context and the surrounding urban area [4,5] as shadow analyses [6] or flood damage that can occur [7]. In addition to investigating how to use the models to improve the environment, for example reducing energy consumption at a district level [8], supporting the sustainable urban development [9] or establishing networks for emergency response [10,11].
Despite numerous research over years having attempted to bridge the gap among BIM and GIS formats and standards in different ways [12,13,14], only a few studies have been focused on the integration of HBIM [15,16,17,18] in the GIS environment.
When considering the binomial HBIM/GIS, the studies usually try to manage the object-oriented model into the GIS environment in order to offer system support for planning and building, simplifying thematic analysis and synthetic elaborations, technical-economical evaluations, virtual restoration hypothesis and so on [19,20,21,22]. It has also to be considered that, as in this case we are facing with an existing building, it is fundamental not only to think about the integration between the standards, but also the geo-referencing accuracy of the existing building in a 3D GIS environment. This topic has been solved lately through different solutions as, for example, the “FME (Feature Manipulation Engine) Exporter for Revit” plugin [17,21], which allows to keep the spatial reference when exporting from Revit to ArcMap, ArcScene or QGIS, placing the building in the correct position.
However, even if the issue of the insertion of the HBIM model in the GIS environment has been solved, the problem of how to create an effective dialogue between the two standards, and the structuring of a model that can integrate a large amount of data describing a complex system such as a city or territory, with an adequate level of detail that goes up to the architectural scale for CH, has not been fully developed yet.
To fix these interoperability issues it is fundamental to consider the adoption of standards in order to allow an effective dialogue.
CityGML was developed in 2002 by the Special Interest Group 3D (SIG3D) of the “Geodata Infrastructure” initiative in North Rhine-Westphalia, Germany. In 2008 it was adopted by the Open Geospatial Consortium (OGC) as the official standard for modelling and exchanging 3D models of cities and landscapes and was quickly adopted internationally. It is structured to represent cities and buildings features with a different level of detail (LoD) (Table 1). LoD 0 is for regional and landscape level, LoD 1 for regional level, LoD 2 for city district and urban context, LoD 3 for the exterior architectural models and landmarks and finally LoD 4 for the interior architectural model [23]. However, this last LoD is not enough accurate for representing building information as well as BIM.
Moreover, it is a model that can be used to store and exchange 3D models of virtual cities. It is implemented as an application schema for Geography Markup Language version 3.1.1 (GML3), the extensible international standard for data exchange released from OGC and ISO TC211. It is a standard rich of semantic data in which are assigned unique IDs, names, and descriptions of the different building components. CityGML is a multi-scale representation standard, from which precision requirements derive.
On the other hand, the IFC open standard data, differently from CityGML, is based on the concept of LOD (Level Of Development). These are used to monitor the design phases of building construction and they are not related to the scale of visualization.
The IFC format is based on the EXPRESS language defined by the standard “ISO 10303-11: Industrial automation system integration—Product data representation and exchange—Part 11: Description methods: The EXPRESS language reference manual”. Being an EXPRESS-based standard, means that the entities are referred to each other by line number, whereas CityGML is an XML-based schema which uses the XML Schema Definition (XSD) to define the relationships between entities [26] and this different conceptual base makes difficult the interrelation with these two standards.
Starting from the standards, some researchers tried to develop an extension of CityGML to obtain semantic IFC data into a GIS context [27], using the IFC standard to convert both GIS and BIM data [28] and to convert the IFC into a geographic vector format, which includes spatial data [6]. In this context, an interesting contribution to the theme has been given by [29,30,31] with the Unified Building Model (UBM) that strives to avoid loss of information, redefines spatial relationships between the objects, after the evaluation of the overlapping concepts and data, and determines some extensions for both CityGML and IFC taking into account also the LoD concept.
In this research, the two standards are considered in the second methodological phase in order to allow the data conversion from BIM to GIS. The IFC open file format, which allows us to create symbols in a consistent way and ensures uniform use including interoperability, is here used for the data exchange, transforming the parametric model into the CityGML standard data model; in this way it is possible to guarantee a good level of interoperability, considering BIM features related to GIS objects.

2. Methodology

In order to realize a multiscale 3D GIS project, in which to test the interoperability levels (see Section 3), a methodology that considers the modeling phase according to the LoDs proposed by the CityGML standard and therefore intended as “levels of detail” has been adopted (for research purposes in this study we refer to LoD to the Level of Detail from CityGML standard, while LOD to the Level Of Development of the IFC standard).
It has to be clarified that when approaching HBIM the levels of development are, rather, treated as levels of detail as qualified in the CityGML standard, eventually associated to simple levels of abstraction (LoA) [32], where the objects to be modelled or exchanged according to the scale of representation are defined.
In the GIS environment, it is possible to visualize and query data from LoDs 0-1 in 2D or 2,5D, thanks to the integration of various cartographic data (both geometric and alphanumeric) from SDIs (spatial data infrastructures) and regional and national geoportals such as shapefiles, orthophotos and DEM (digital elevation model). On the other side, to reach the LoDs 2-3-4 it has been established to model the geometries in a specific software for building modeling. In particular, an object-oriented software of the BIM domain has been used with the subsequent insertion of this model into the GIS environment.
As mentioned above, two methods have been tested to assess the data integration between the domains (Figure 1). The first consists in using commercial solutions that can allow an easier import, but limiting the openness of the system, inserting the model in its BIM proprietary file format (.rvt from AutoDesk Revit, version 2019) directly into the ESRI ArcGIS Pro commercial software (version 2.4.3). While the second, properly developed for the present study, consists in converting the Revit model in a GIS standard file format (.GML) and then insert it into a GIS software. The open source QGIS software has been used (version QGIS 3.10.2 A Coruña).
A further study on the correspondence between the two standards’ data structure, in order to understand the association and relations for each entity of the IFC with those of the CityGML, divided by LoDs, has been conducted (see Section 3.2).

2.1. The Case Study: San Lorenzo Church in Norcia

Starting from the assumption that cultural heritage requires continuous monitoring (both ordinary and extraordinary) and updates, for the present research, a case study significant from the point of view of vulnerability, hazards and seismic risks was chosen.
The San Lorenzo Church in Norcia is a representative example of building damaged by the earthquakes that affected the centre of Italy starting from the summer of 2016.
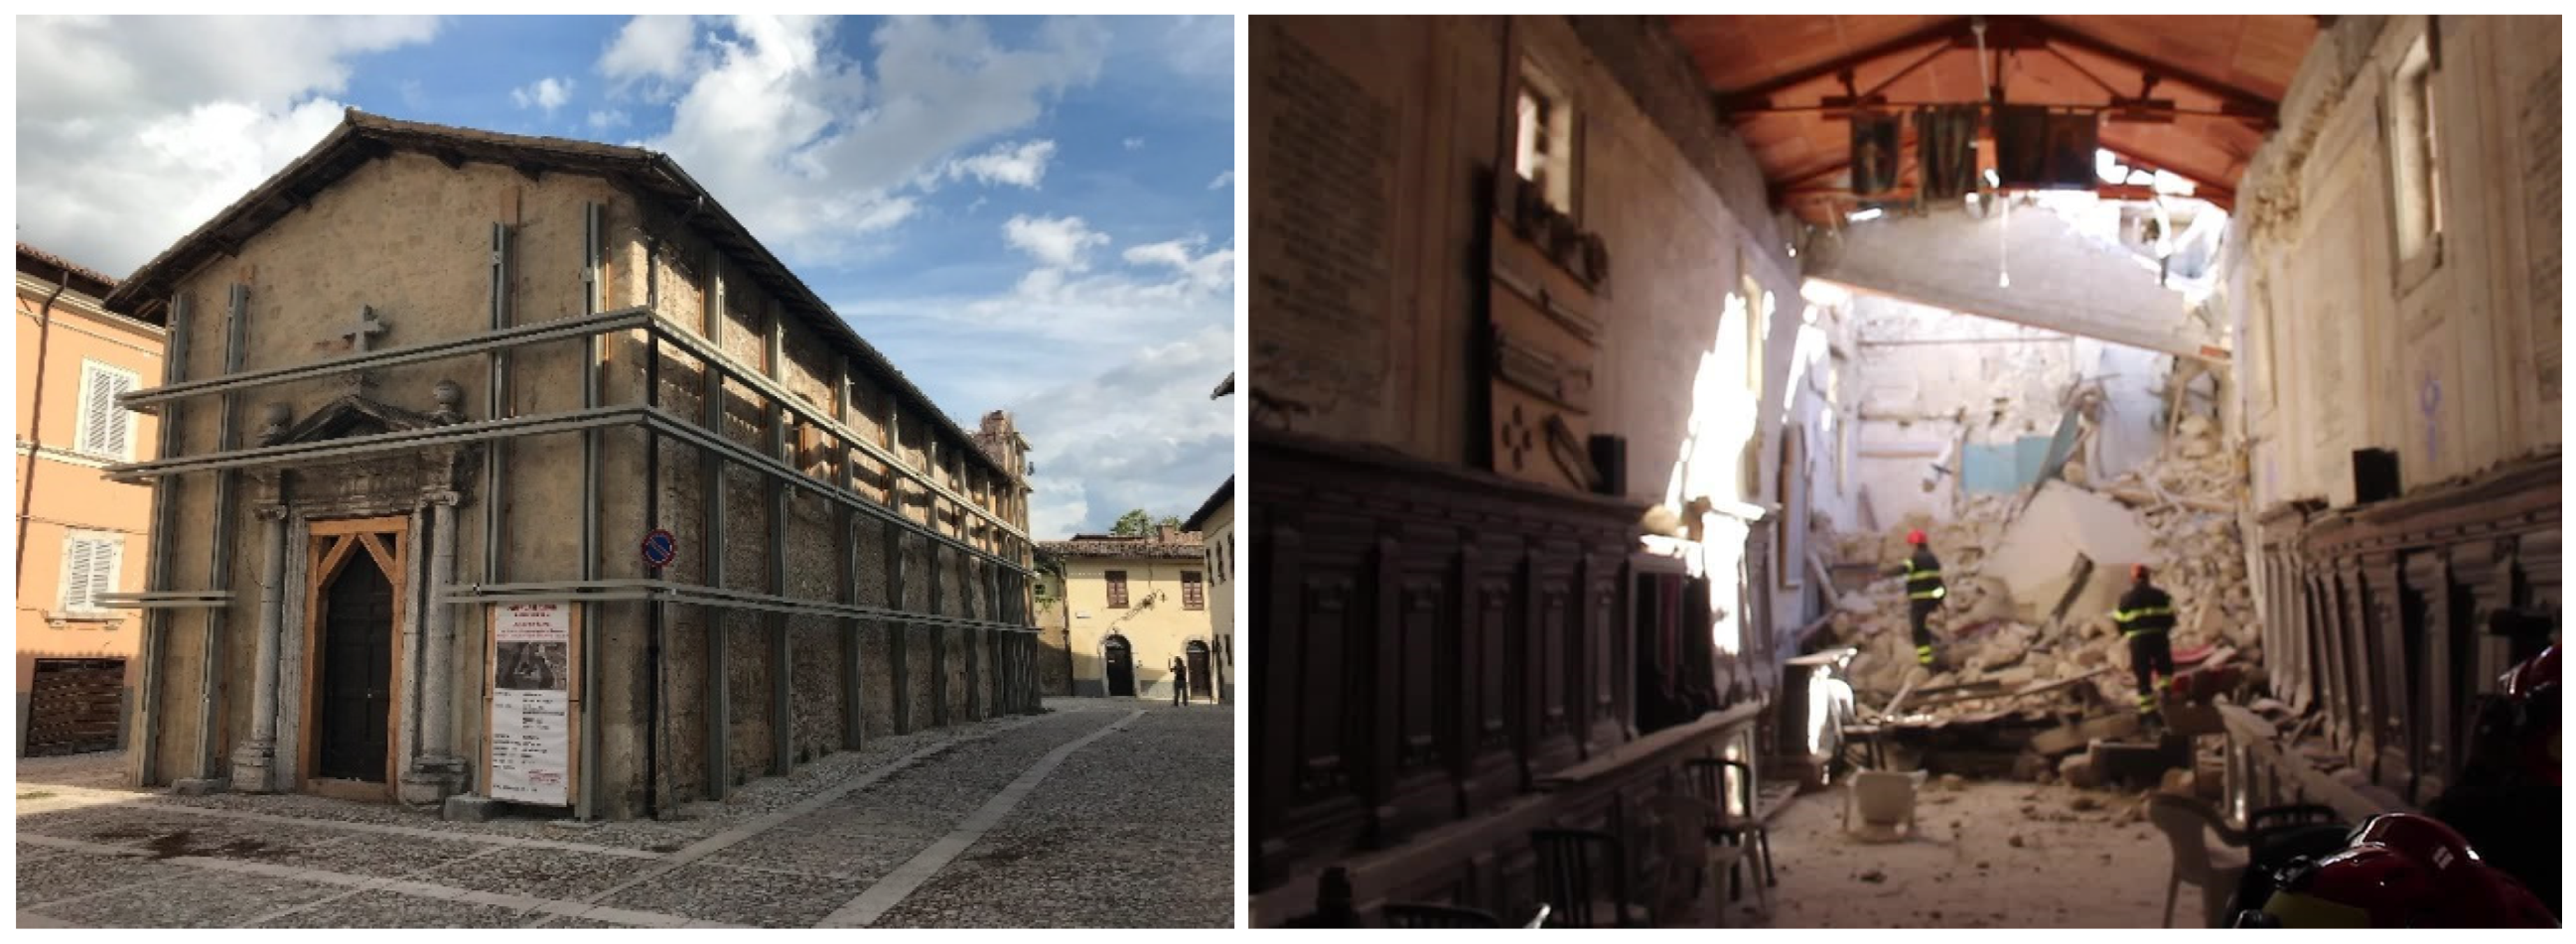
This ancient building, probably built on the ruins of a temple, was affected by many earthquakes during the years with the consequence of structural damage to the wooden ceiling in the 1950s. After the last event, on 30 October 2016, which damaged the bell-tower, the Church underwent security measures and required safety structures (Figure 2) of the entire building. It is currently still closed and the surrounding area is classified as a “Red Area”, identifying every city part damaged by the earthquake and temporary closed to the public for safety reasons.
In order to support the representation of the church with a digital 3D model and in a multi-scale project to monitor the damage and for future reconstruction purposes, an integrated 3D metric survey [33,34,35] was performed in September 2017 by the Geomatics group of the Politecnico di Torino.
The first steps have been based on the measurement of the topographic network in order to georeference all the different set of data. Then, close range and UAV (unmanned aerial vehicles) photogrammetric approach and TLS (terrestrial laser scanning) techniques were applied in order to obtain the whole 3D model of the church. A complete photogrammetric survey has been achieved combining images obtained from terrestrial photogrammetry with oblique and nadiral images from aerial photogrammetry. Photogrammetric data were post-processed with Structure from Motion (SfM) algorithms using the commercial software Agisoft MetaShape Professional (version 1.6.1). For the modelling purposes, the 3D dense cloud derived from the photogrammetric acquisition was considered due to the completeness of the point cloud including the roof geometries. Table 2 shows the acquisition and the post-processing data information of sensors used and point clouds generated.
After the merging phase of the two 3D dense point clouds the model has been filtered and the context has been excluded, considering only the building geometries. Then, the point cloud has been segmented in three different regions (roof, security elements and walls) (Figure 3), to simplify the modeling phase, and exported in .rcp data format supported by the BIM software used.

2.2. The Multi-Scale Project

2.2.1. Visualisation of LoD 0-1 in GIS Environment

In order to obtain an integrated and multi-scale model, the GIS project with the lower levels of detail (0 and 1) has been created. Thanks to the cartographic data available in the regional geoportal it has been possible to design the GIS project using both commercial and open-source software (ArcGIS Pro by ESRI and QGIS).
From the geoportal of the Umbria Region several dataset have been downloaded thanks to the WebGIS application. These are:
-
the CTR (technical regional map), 1:10 k–1:5 k (number 337024_G e 325143_G) with building and hydrography layers;
-
the DTM (digital terrain model), 1:5 k;
-
the geological regional dataset, 1:10 k for structural elements such as faults;
-
the seismic risk map, 1:10 k with linear and areal elements.
Moreover, the products derived from the 3D metric survey were considered as well as the orthophoto from UAV photogrammetry with a GSD (ground sample distance) of 3 cm/px and the DSM (digital surface model).
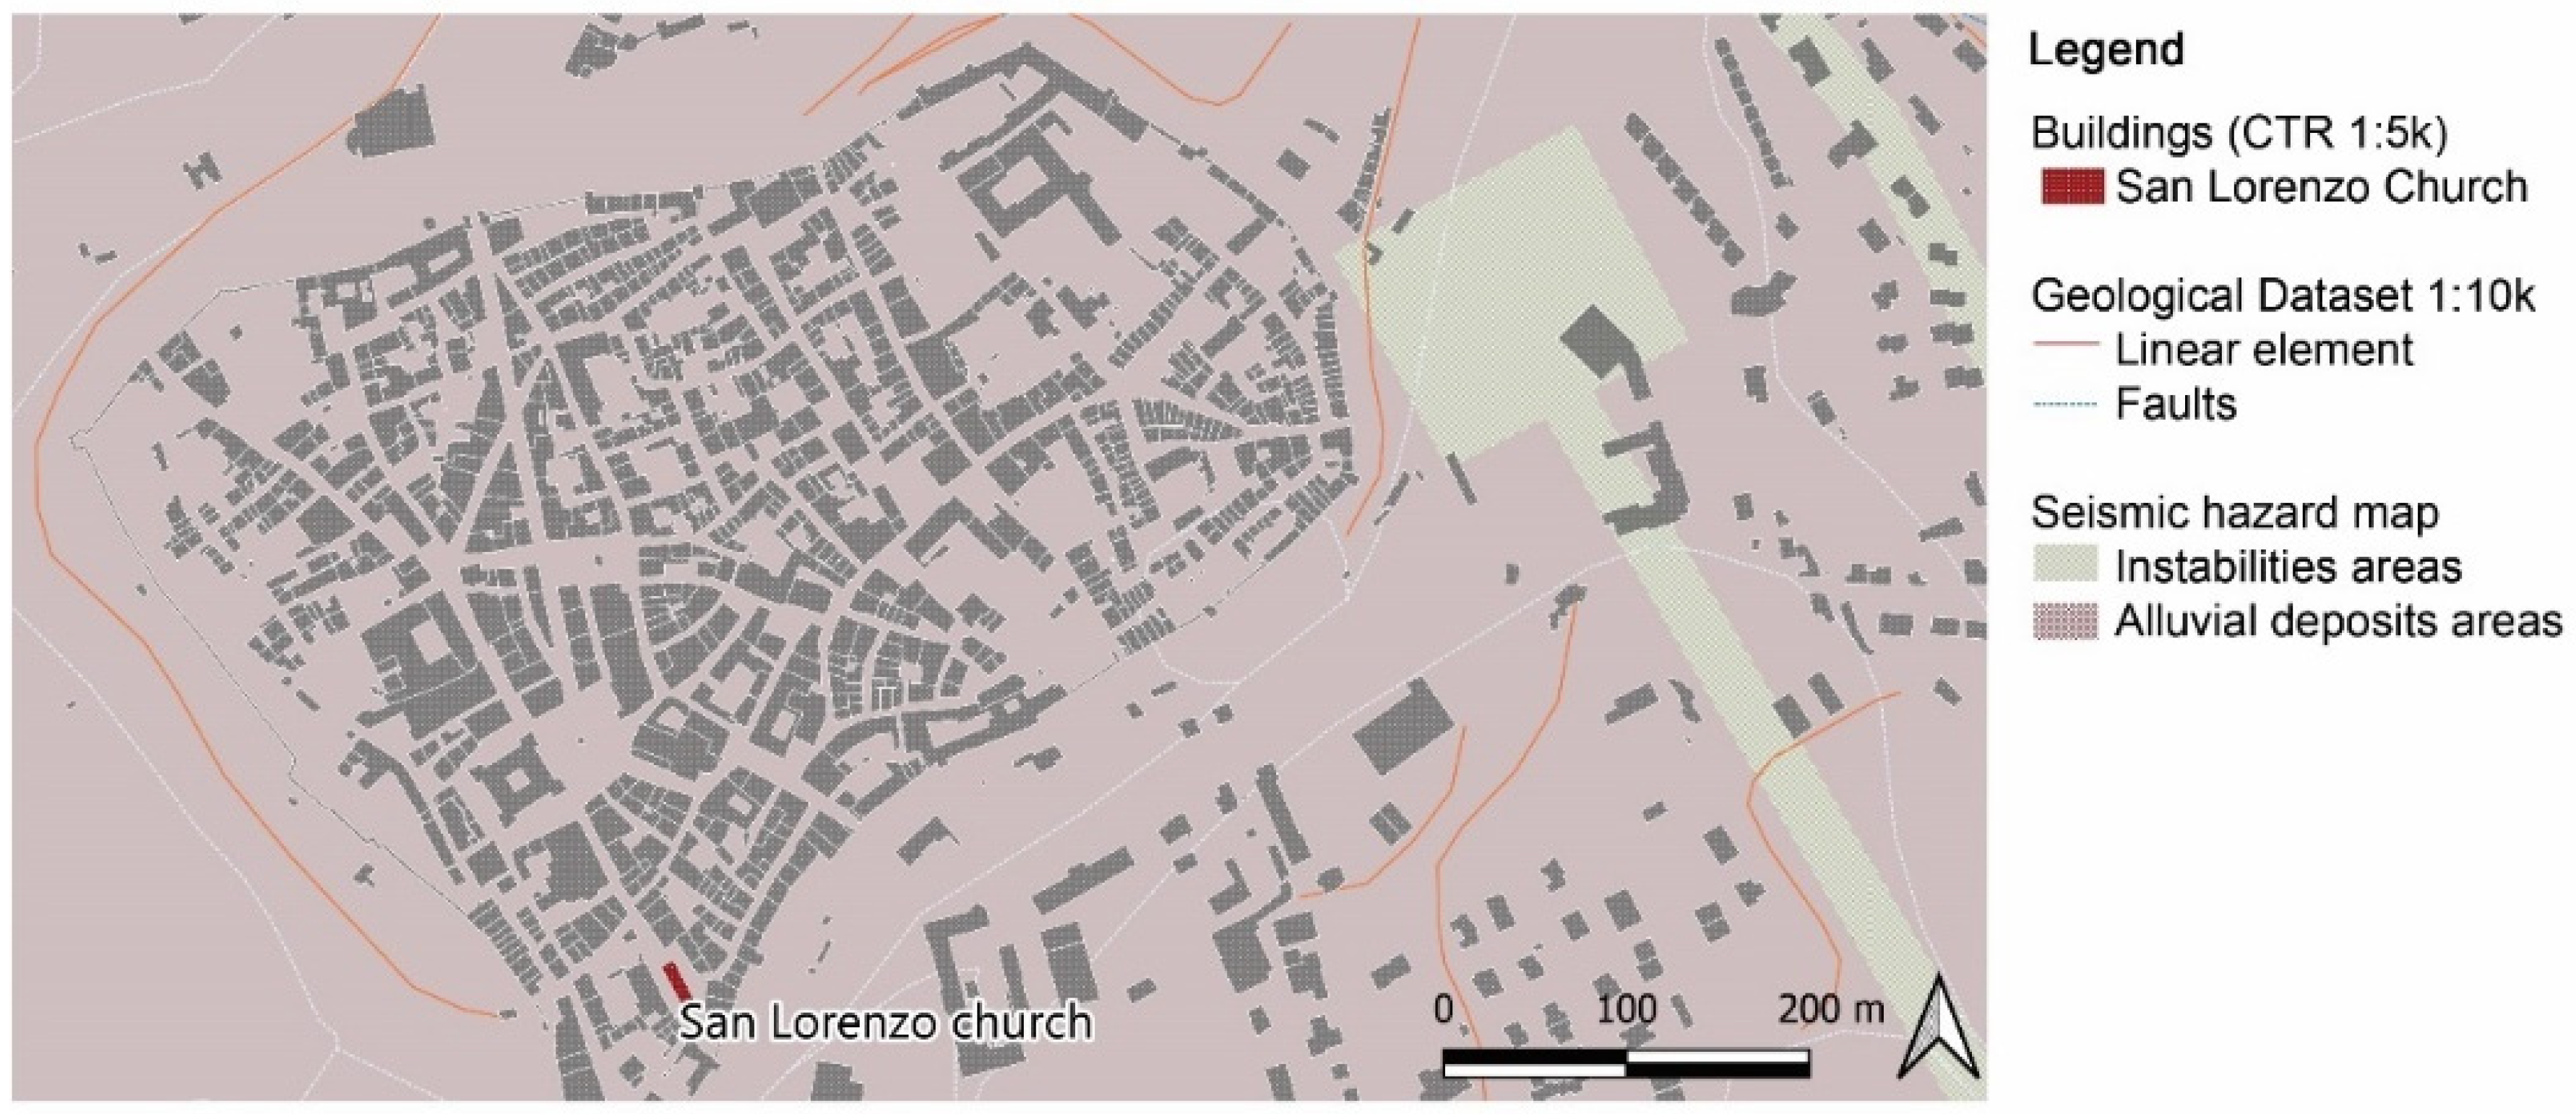
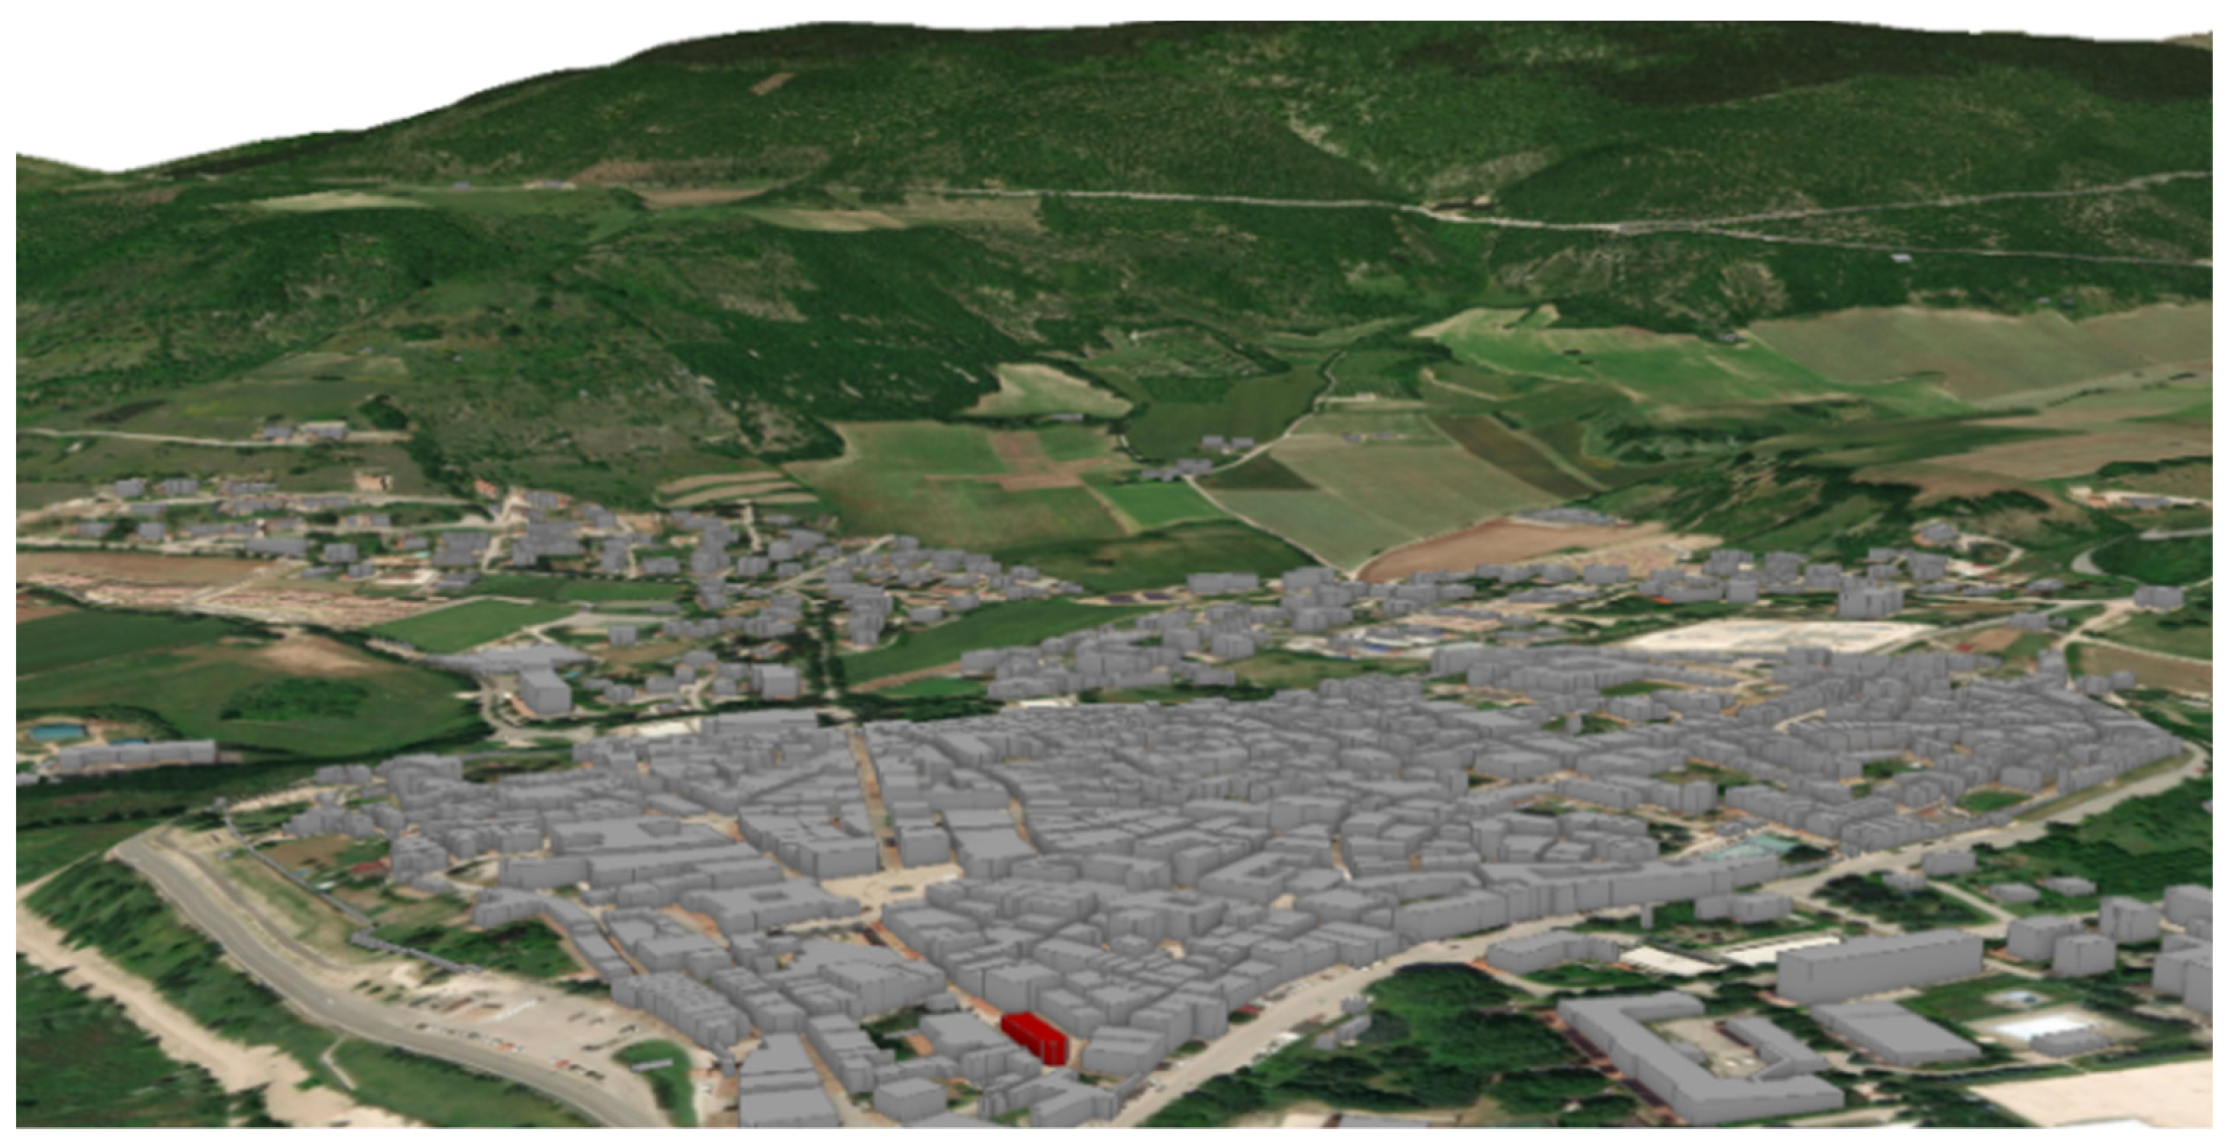
In the GIS project, firstly, it is possible to visualise the LoDs of San Lorenzo Church and its surroundings, starting from a general map overview of the urban context of the city of Norcia. The LoD 0 shows the regional DTM, roads, seismic risk elements and buildings (in 2D) (Figure 4). In the LoD 1 (Figure 5) the St Lorenzo Church and its context, are represented in 2.5D; these data derive from the DSM, elaborated after the aforementioned survey campaign of data acquisition. For this LoD, the UAV orthophoto is also considered.

2.2.2. Definition of LoD 2-3: HBIM Modeling

To deepen the level of detail it has been necessary to model the Church in a proper environment that could allow us to represent both the visible and invisible information, the geometry and the data related to it. In this regard, the HBIM models offer an adequate solution, although most of the time they still require formal simplification. In particular, in this case, elements such as the tapering of the nave walls or the arrangement of the ashlars in the collapsed part of the bell tower have not been intentionally represented as not useful for the purposes of this research. The aforementioned three segmented point clouds have, therefore, been imported in the Autodesk Revit software and used as the basis for the realization of LoD 3 of the HBIM model. To allow their use within the Revit workspace, however, it was necessary to truncate the coordinates. To correctly set the height and to facilitate modeling, the reference level has been moved from z = 0 to the point cloud altitude.
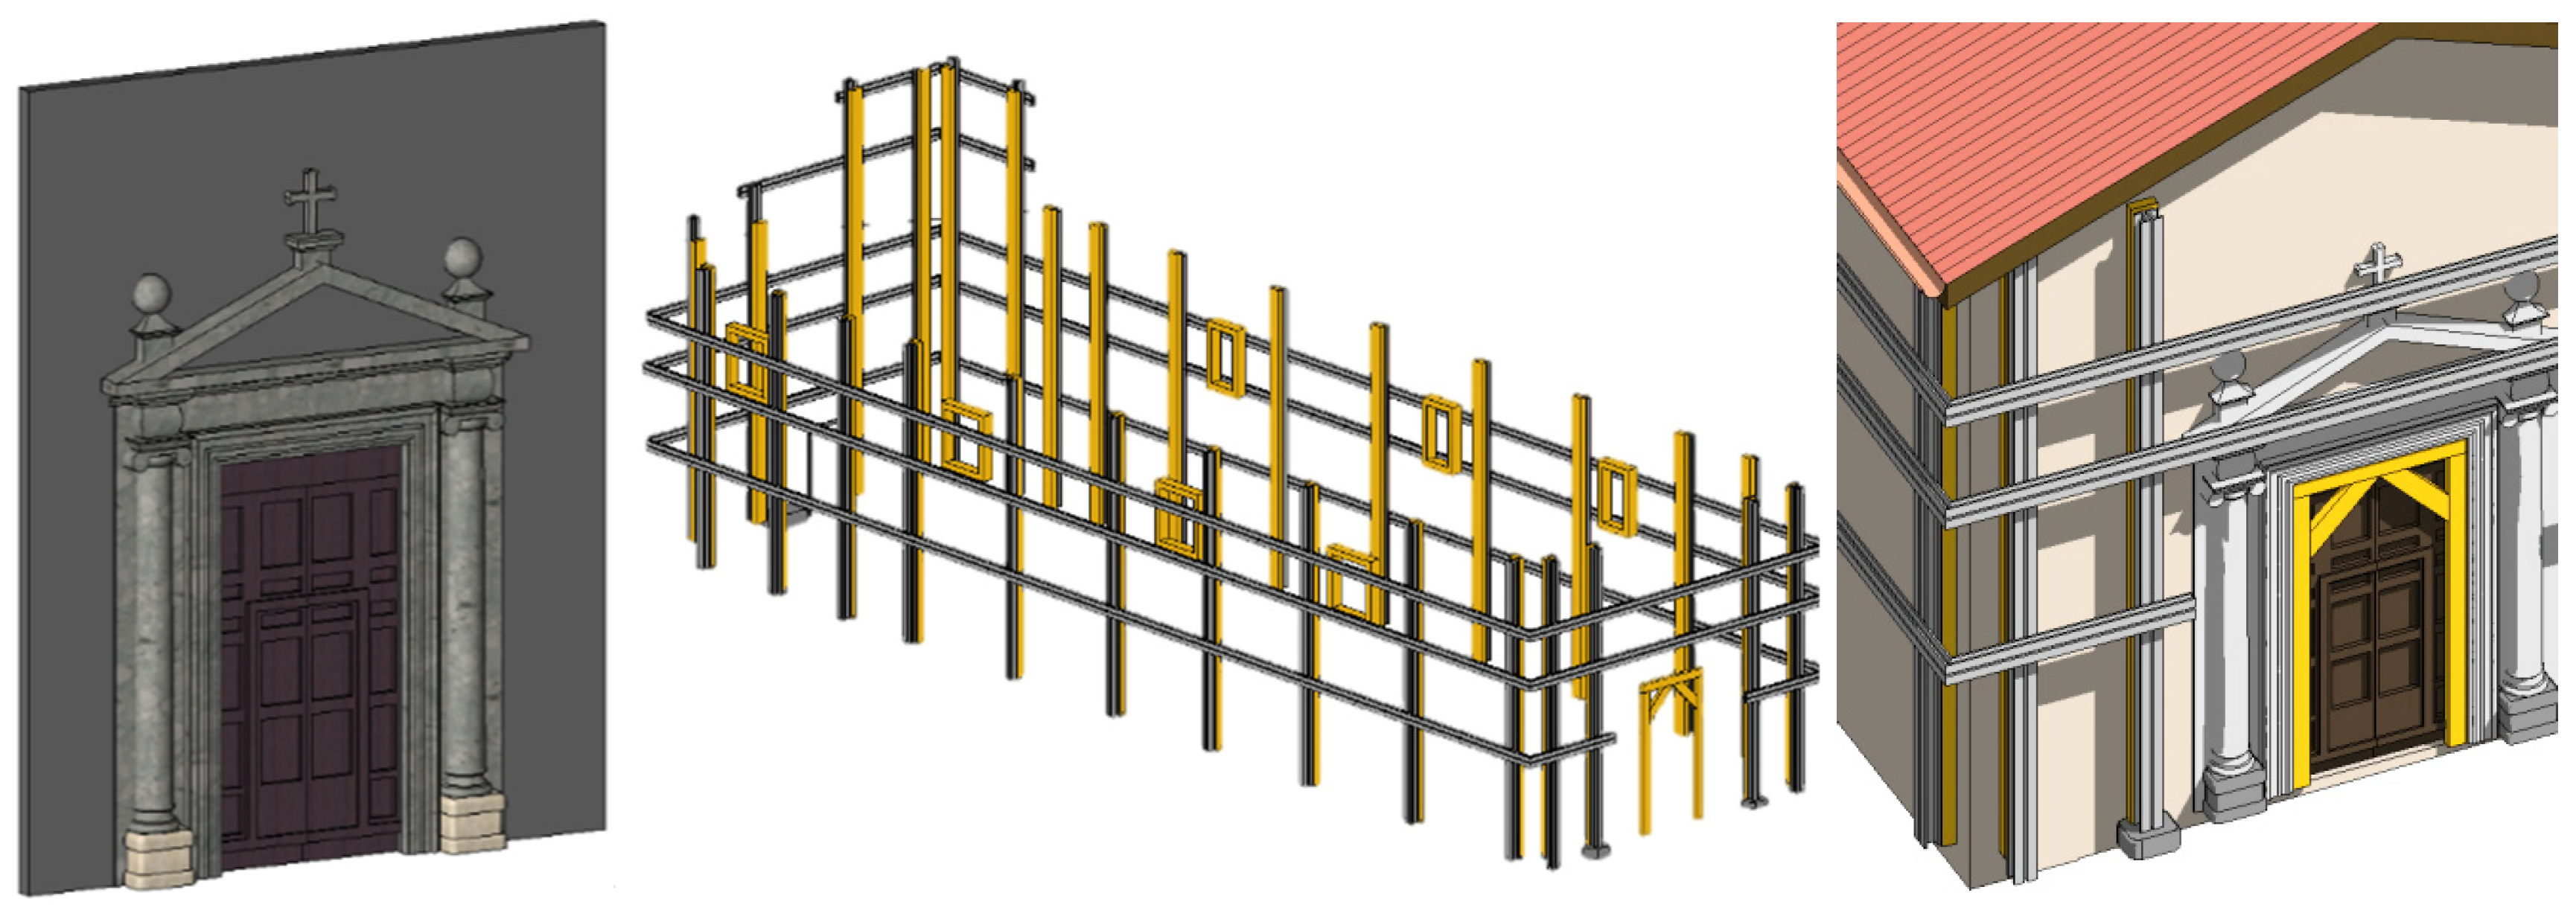
For the achievement of LoD 3, the visualization of window and door fixtures is required. Concerning historic buildings, these detailed architectural elements cannot be modelled using the default families provided by the object-oriented software, therefore customized families (.rfa) have been created starting from the default ones. Thus, for the representation of all those architectural elements, which are not part of the default Revit system families, such as the safety structures of walls, doors and windows (Figure 6), customized families have been used starting from metric generic model. Finally, they have been imported into the main project.
These models have been investigated in the subsequent import and interoperability analyses (Section 3.3.1 and Section 3.3.2), since they characterize most of the HBIM models unlike the BIM models, in which most of the architectural and structural elements are attributable to the families already present.
As verification of the correct modelling work, an analysis of the model deviation from the point cloud has been carried out using the “As Built” plug-in, which extends Revit tools on point clouds. From this analysis a model deviation has been detected from the point cloud of 20–30 cm in correspondence with the bell tower and the nearby damaged wall (Figure 7).
This problem is caused by the typical conformation of the historic building walls, usually tapered. To deal with it, Revit allows us to alter geometries by creating a component as a subtraction solid using a local model (Figure 8a,b). This solution has been adopted for the bell tower considering the uniqueness of the geometry to be represented.
Finally, for a correct import in the GIS environment, the geo-referencing operation was performed, associating the shared coordinates derived from the topographic survey to the model.

3. Interoperability Issues

Among the various Levels of Conceptual Interoperability [36], in this study we analyze the technical and semantic interoperability (L1 and L3) because they are the most relevant for the purposes of domain integration in the geographical data field. In fact, the pragmatic, dynamic and fully conceptual interoperability reach a higher level of abstraction for our purposes and could be investigated for future developments.
Moreover, to properly study the integration between the two standards, an in-depth analysis of their data structure is necessary.

3.1. IFC and CityGML Structure

The IFC structure is made up of entities (constructive, geometric or basic elements), rooted or not rooted, which the BIM software transforms into layers and subsequently into parameters. Rooted entities are part of the category IfcRoot and have a concept of identity, which is, a set of attributes such as name and description, while entities that are not rooted do not have an identity and their instances exist only if related to a rooted instance.
IfcRoot is divided into:
-
IfcObjectDefinition, that concerns presence and types of material objects;
-
IfcRelationship, that concerns relationship between objects;
-
IfcPropertyDefinition, that concerns properties dynamically extensible on objects.
IfcObjectDefinition is divided into:
-
IfcObject, concerning the presence of the object from a physical point of view;
-
IfcTypeObject, concerning information on the type of object.
They are both divided into six categories that answer the questions “Who? Why? What? Where? When?” and “How?”, namely IfcActor, IfcControl, IfcGroup, IfcProduct, IfcProcess, IfcResource. It is then the duty of IfcRelationship to identify the relationships between multiple objects.
In particular, IfcProduct represents entities by providing information on description, representation and spatial arrangements of the elements. Indeed it is divided into: ifcAnnotation, IfcElement, IfcGrid, IfcPort, IfcProxy, IfcSpatialElement, IfcStructuralActivity e IfcStructuralItem. IfcElement classifies elements into 10 categories, like IfcBuildingElement, IfcCivilElement, IfcElementComponent, and so on.
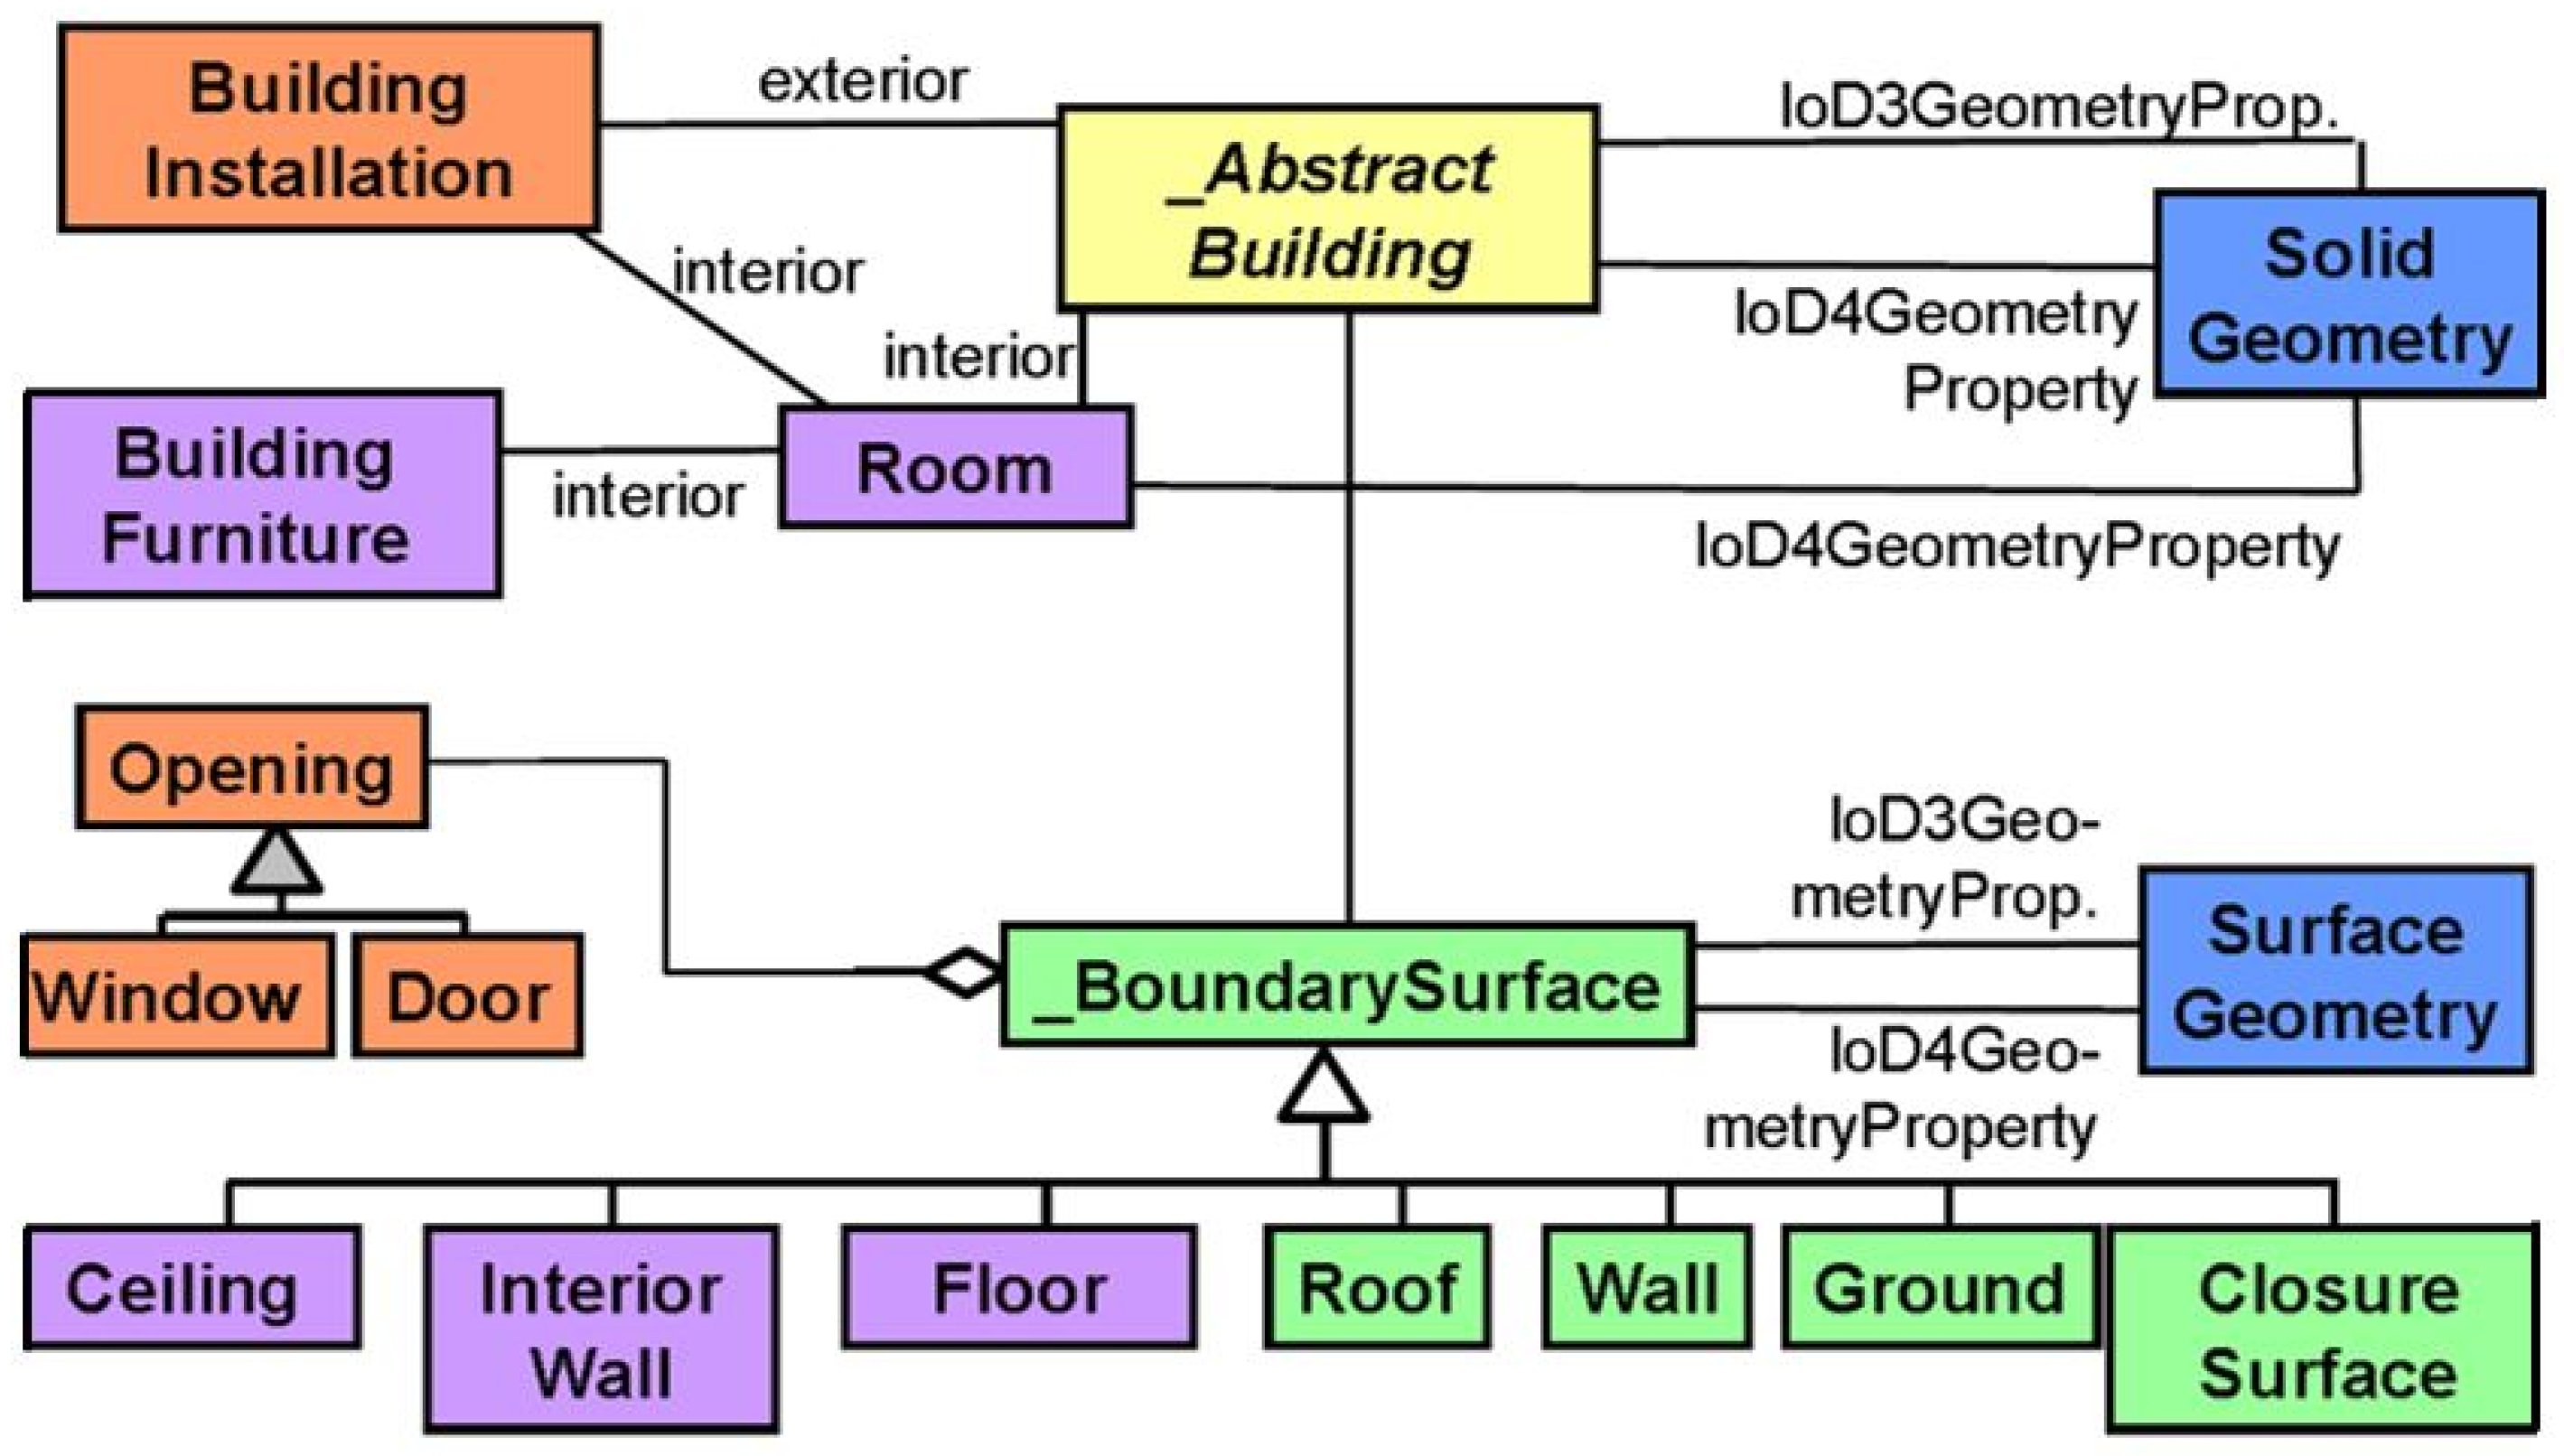
On the other hand, the scheme proposed by CityGML (Figure 9) consists in:
-
LoD 0 requires the creation of a 2.5D territorial information system. The city model is divided into buildings, transport, topography, hydrography and vegetation.
-
LoD 1 is meant for the creation of a 3D territorial information system. In this case a model composed only by blocks is required, without the roof structures. The CityGML scheme foresees the introduction of solid geometries.
-
LoD 2 is meant for the creation of a textured model, with differentiated roof structures. The scheme proposed by CityGML adds to the information on the solid geometries in LoD1, the information regarding the surfaces. The division into roofs and walls is thus obtained.
-
In order to model a building, LoD 3, which is composed by the construction of a nearly detailed architectural model, is required. The CityGML scheme for LoD 3 foresees the insertion of objects (CityObject), such as doors and windows, on surfaces.
Specifically, these objects are made up of primitive, complex and aggregate geometries and the latter ones are part of the “MultiSurface”.

3.2. Generating Correspondences between IFC and CityGML: Identification of Standard Common Entities

To generate associations between IFC and CityGML, according to their structure, the entities and the objects that identify the same component in the different models need to be compared. To verify these correspondences, a study regarding common entities between IFC and CityGML at different levels of detail has been carried out.
From the research of [38] a unified model which contains all the IFC and CityGML features has been taken into account considering every building element and its representation in the different LoDs. Moreover, starting from the study of [39], which describes how a CityGML input model is automatically reconstructed according to the IFC standard, the identification of common entities between IFC and CityGML standards at different levels of detail has been carried out (Table 3, “x” means not association available).
For the present test, the LoDs 2-3-4 are considered as the three levels in which the building elements could have a 3D representation and description both in GIS and BM environment.
Analysing the features mainly used in the construction of an architectural model in the IFC and CityGML standards, it was noticed that the relation of the classification, as it is possible to notice from the Table 3, is “1 to many”, namely for each class provided by CityGML different IFC elements correspond.
For example, in the case of the entity “Roof”, it has been noticed that IfcRoof corresponds to RoofSurface from LoD 2 to LoD 4. In addition, LoD 4 makes a further subdivision between interior and exterior surfaces, so CityGML differs CeilingSurface from RoofSurface, respectively.
Thanks to this test investigation, it has been possible to devise the correspondences of the San Lorenzo Church model useful for the data format and standard transformation, avoiding loss of geometries and information.

3.3. HBIM and GIS Integration: Semantic and Technical Interoperability

The main aim of the present research regards the conversion phase of the model from HBIM to GIS verifying the geometries and the attributes structure. In this regard, two different tests have been considered. In the first case a commercial software was chosen in order to test the possible geometric, semantic, georeferencing data loss from BIM to GIS data formats; secondly, an open source solution has been used to carry out the same test. In this last case, standard data formats have been considered, therefore the use of a data format conversion software has been necessary.

3.3.1. HBIM-GIS Integration Using a Recent Function in a GIS Commercial Solution

Starting from 2019, ArcGIS Pro allows us to directly insert the .rvt file in a GIS context without intermediate transformations of data format. This procedure has been tested with the case study of the church and after the import of the model, the geo-referencing was observed. For this phase, many steps are still required. For the automatic geo-referencing of the 3D parametric model in the geographic information software, it is necessary to have the .prj file containing the spatial projections, in this case UTM—WGS84 33N (EPSG:32633).
Finally, in the GIS environment it is possible to visualize the 3D model (Figure 10) and its contents, in addition to querying the geometries and to get information and characteristics of the building allowing different operations (maintenance phase, risk indicator, vulnerability parameters, management data…). Moreover, it is possible to view the church in its context adding the cartographic data from regional geoportal, surveys campaign and so on.
Once the format compatibility issue for the insertion of the HBIM model in the GIS environment is overcome, the next problem is focused on semantic interoperability, analysing the correspondence of the attribute and data, in order to verify the loss of information and the possibility to integrate entities with new parameters (adding information) and the relations among objects.
Different interoperability tests were performed in order to verify the completeness of the standard model and to integrate the information in a further phase of implementation. In particular, the verification of information belonging to IFC structure and not present in CityGML one and vice versa has been carried out.
For the assessment concerning the IFC structure, the element “Roof” was chosen. During the investigation of the IFC and CityGML classifications (Section 3.1) some differences have been noticed.
The IFC locates IfcRoof in the category IfcBuildingElement, that contains the primary elements for the construction of a building, so its structural and spatial subdivision system. Moreover, each element is subdivided into sub-elements with a series of properties such as Pset_Condition that contains “Assessment” adopted into the San Lorenzo Chuch model to assign the parameters ifcDate, IfcLabel and IfcText. Finally, Pset_ManufacturerTypeInformation was identified that contains “ProductionYear”. All these parameters are absent in the CityGML conceptual reference model structure.
The characteristics were compared with those of CityGML. It considers all the geometric features, but does not concern with information of building design and construction phase such as state of maintenance, materials and so on.
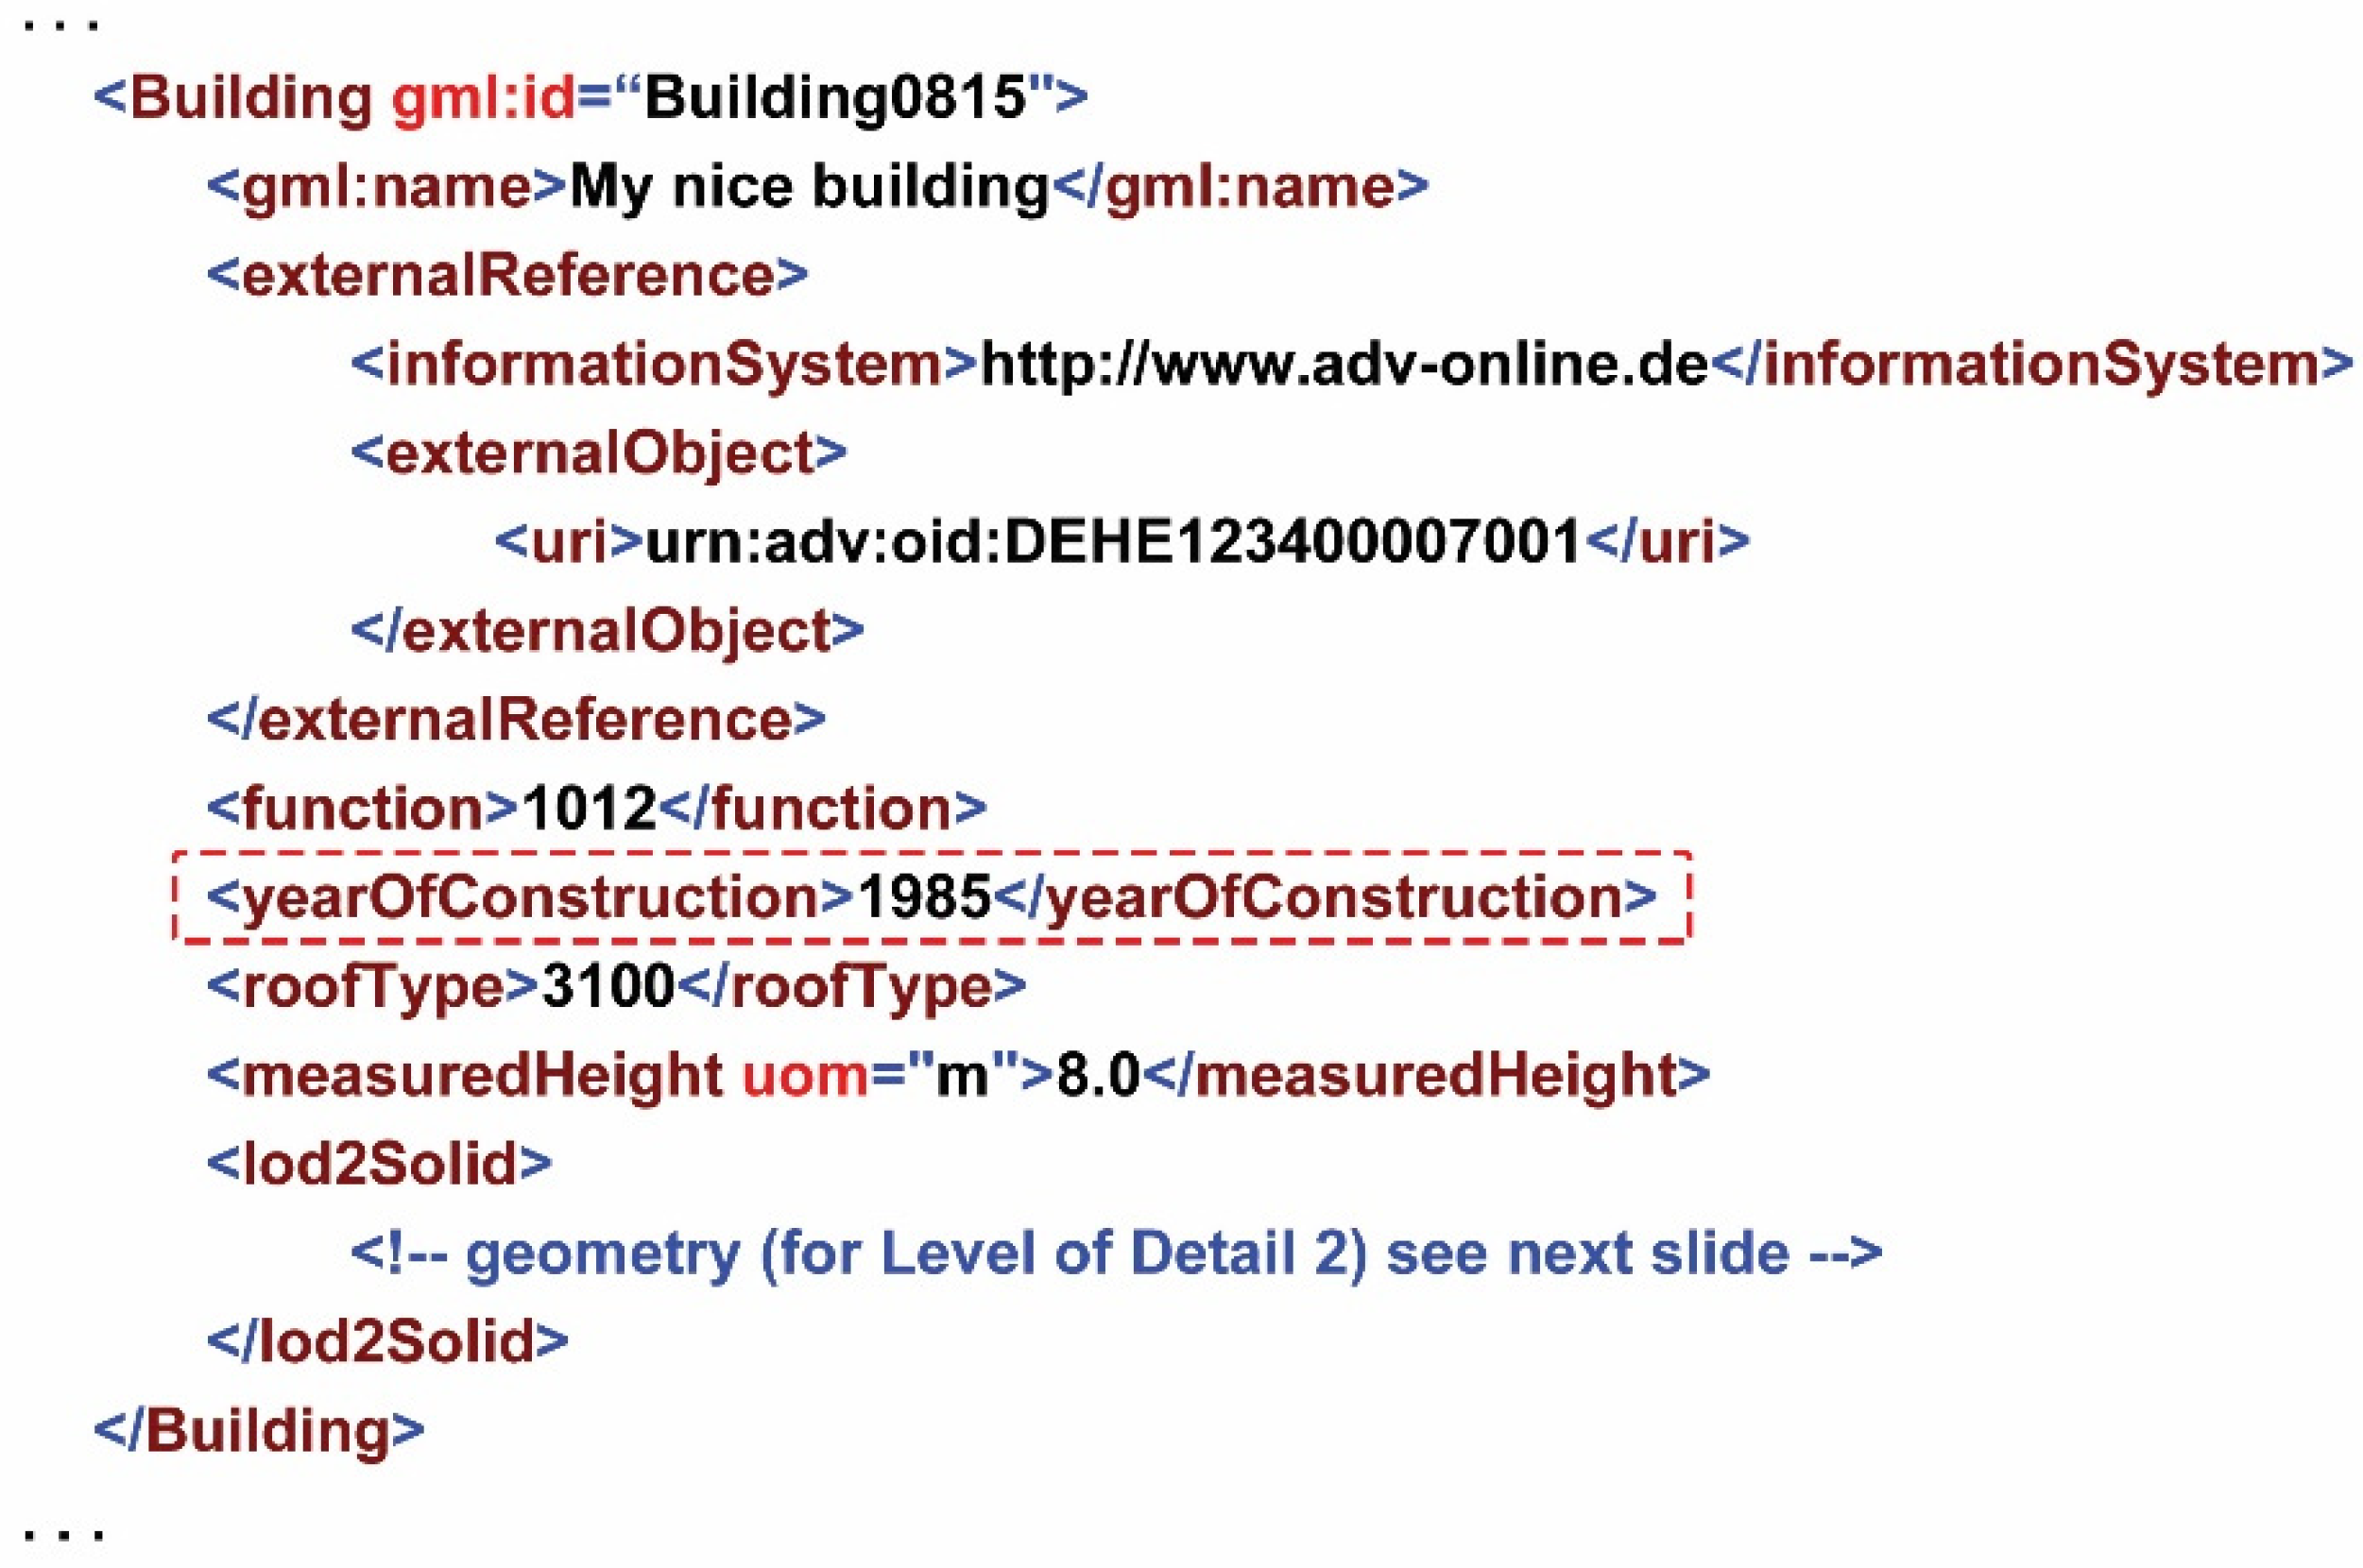
In a second evaluation phase, it has been observed that the only parameter corresponding both to IFC and CityGML classifications is the Year of construction, identified in the XML schema (Figure 11). The difference of this parameter in the two standards concerns the elements it identifies: in CityGML it is assigned at the whole building, in IFC it is a property of each part of the construction.
After having analysed the semantic interoperability, the IFC missing parameters were added into the GIS environment editing the attribute table of the HBIM model geometry. In this way, by querying the entities in the GIS model it could be possible to obtain all the useful information required in case of intervention on the artefact.
Regarding information present in the CityGML standard but not in IFC, as well as the Year of Maintenance, Intervention Typology and Years of Intervention, useful in risk or hazard situation, it was decided to provide them in the model in the Revit workspace, in the BIM environment. To assign these not-geometric information to the model, it is possible to use, in the Revit software, the Shared parameters, adding a .txt file that contains the new information. Figure 12 shows the new parameters connected to the damage event in Revit.

3.3.2. HBIM-GIS Integration Considering Standard Formats and Model Solutions

As mentioned before, for the second interoperability validation, the conversion between IFC and CityGML standards was considered.
Referring to these two international standards, a methodology based on the use of conversion data format software was chosen, thus FME (Feature Manipulation Engine by Safe Software, version 2019.1) was selected. It allows to create various workspaces, in which it is possible to specify the format of the input and output data and to use a special combination of transformers that let the data structure to be edited according to different needs.
In the FME project created for the present research, the input file (“Reader”) is the .IFC, the LoD 3 model exported from Revit. As output file, the .GML data format, compliant with the CityGML standard is set.
The .IFC file was set following the IFC hierarchical structure (explained in Section 3.1).
In this regard, it was necessary to insert two “Readers”: the first as “Single Merged Feature Type” and the second as “Individual Feature Type”. The first one is required to read all the IFC features and to populate the table containing the “id”, “parent_id” and “feature_type” field. The “BinaryEncoder” and “VariableSetter” transformers were used to code and to associate the values with the corresponding variable (Figure 13).
Since the second “Reader” is composed by both geometric and non-geometric data, the “GeometryRemover” transformer was used in order to remove geometries to non-geometric data (as “IfcBuilding”). Then the “AttributeRenamer”, which allows the manual association of the “Id” attributes of .IFC to those of .GML, was applied (Figure 14).
After that, for each geometric data (“IfcWindow”, “IfcBuildingElementProxy”, “IfcDoor”, “IfcRoof”, “IfcSlab”, “IfcWallStandardCase” and “IfcWall”) the same combination of transformers has been adopted. For example, the workspace created for the “IfcWindow” feature is shown (Figure 15).
Since in the IFC standard geometries are composed of “solids”, while they are represented as “multisurfaces” in CityGML, it was necessary to create an ad hoc transformer, called “ConvertGeometry” (Figure 16). This tranformer has allowed the correct conversion of the geometries.
Each custom transformer requires the creation of an additional workspace, containing a combination of transformers. In this case, “GeometryPartExtractor” to extract the geometries from the features, “GeometryCoercer” to make them “composite_surface” and “Deaggregator” to disaggregate them on several levels were used.
Subsequently, the “Aggregator” was employed to combine geometries into “multisurfaces” and the “GeometryRefiner” to perform “refinements” on features’ geometry.
After the conversion of the geometries, the “BinaryEncoder” and “VariableRetriever” were added in order to read the pre-set “_parent_id” variable and to attribute the corresponding “_parent_type “. With “AttributeRenamer” the “ifc_unique_id” field was renamed in “gml_id”. This step is useful to create a correspondence between the IFC and CityGML standards.
Successively, the hierarchy of each feature was tested using the “Tester” transformer. Then, a new ad hoc transformer named “GetGrandParentID” (Figure 17) was created, “_parent_id” field has been codified and the corresponding value has been assigned in the “_gparent_id” one, in turn decoded through the “BinaryDecoder”. In this way, it is possible to establish the correspondence between the two standards.
The last transformer considered in the workspace was the “CityGMLGeometrySetter” (Figure 18), created through the combination of “AttributeCreator”, which allowed the creation of the “citygml_lod_name” and “citygml_feature_role” attributes and “GeometryPropertySetter”, useful for the proper compilation of the attributes (considering the correspondences reported in the Safe Software Tutorial “Writing CityGML from FME”—Table 4).
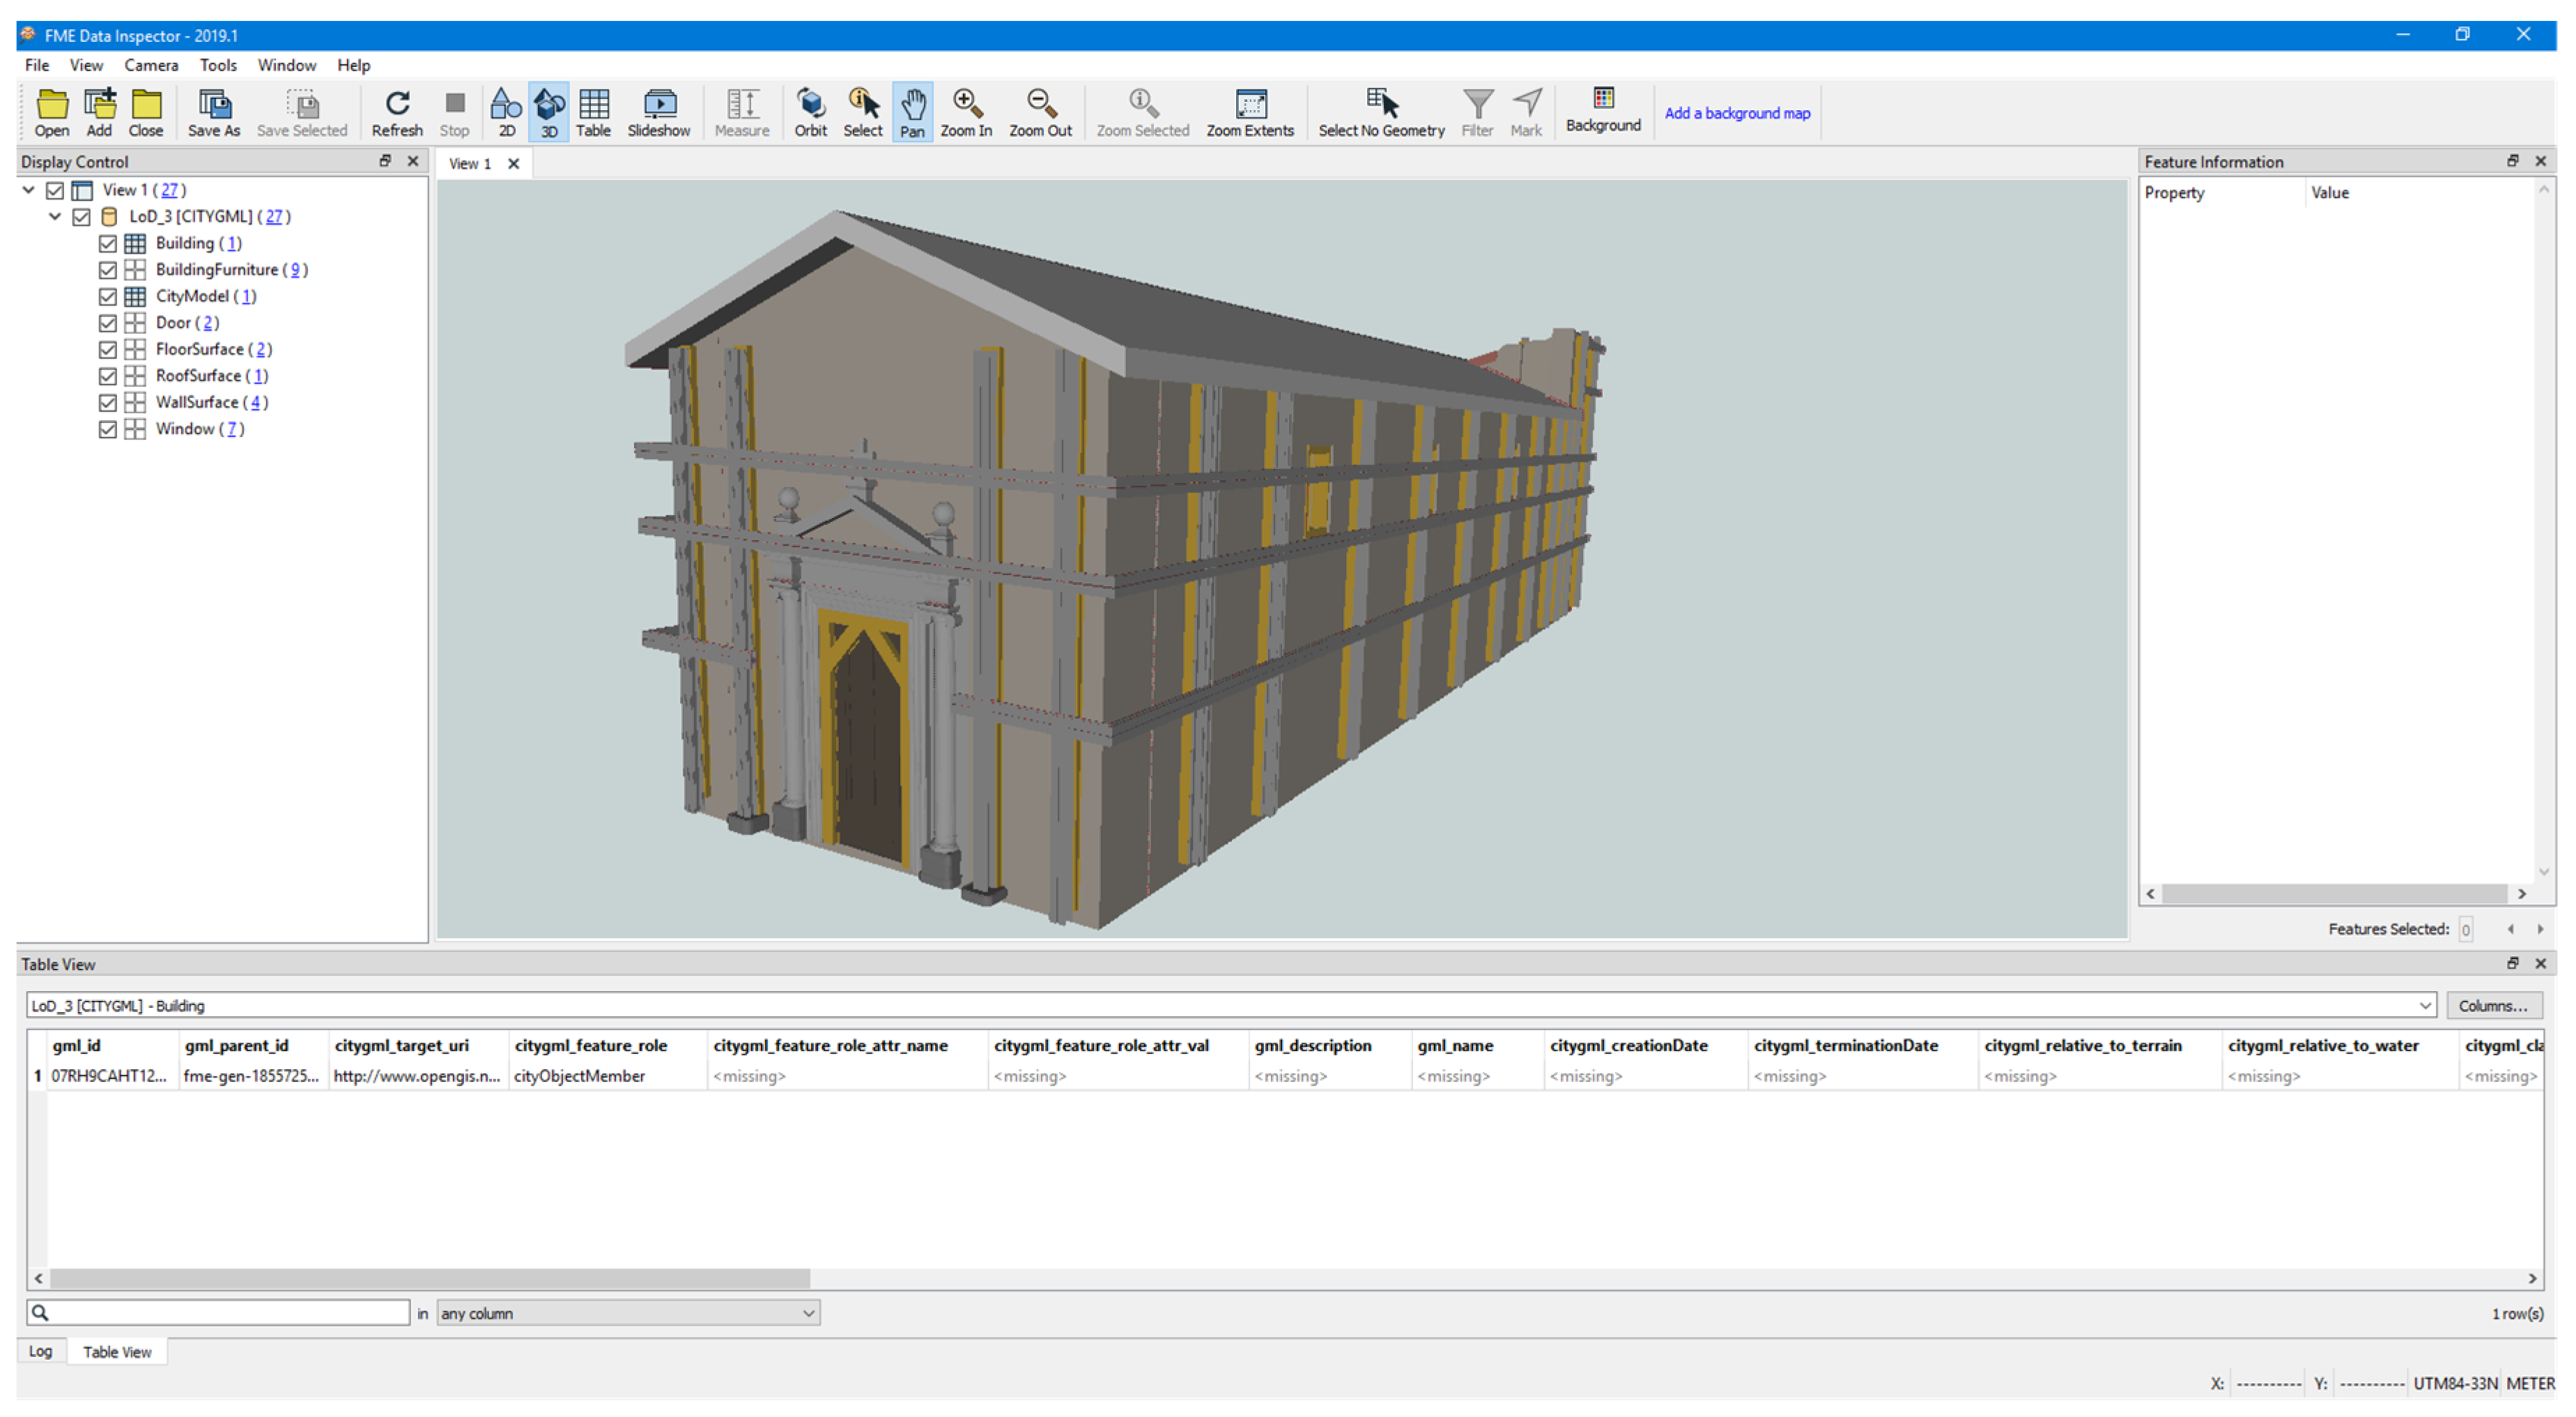
After having repeated the entire procedure for each feature, the whole workspace was finally run. The final result of the output file (.gml) could be visualised in the FME Data Inspector (a utility that allows the user to view and save data converted in any FME-supported format) (Figure 19).

4. Results

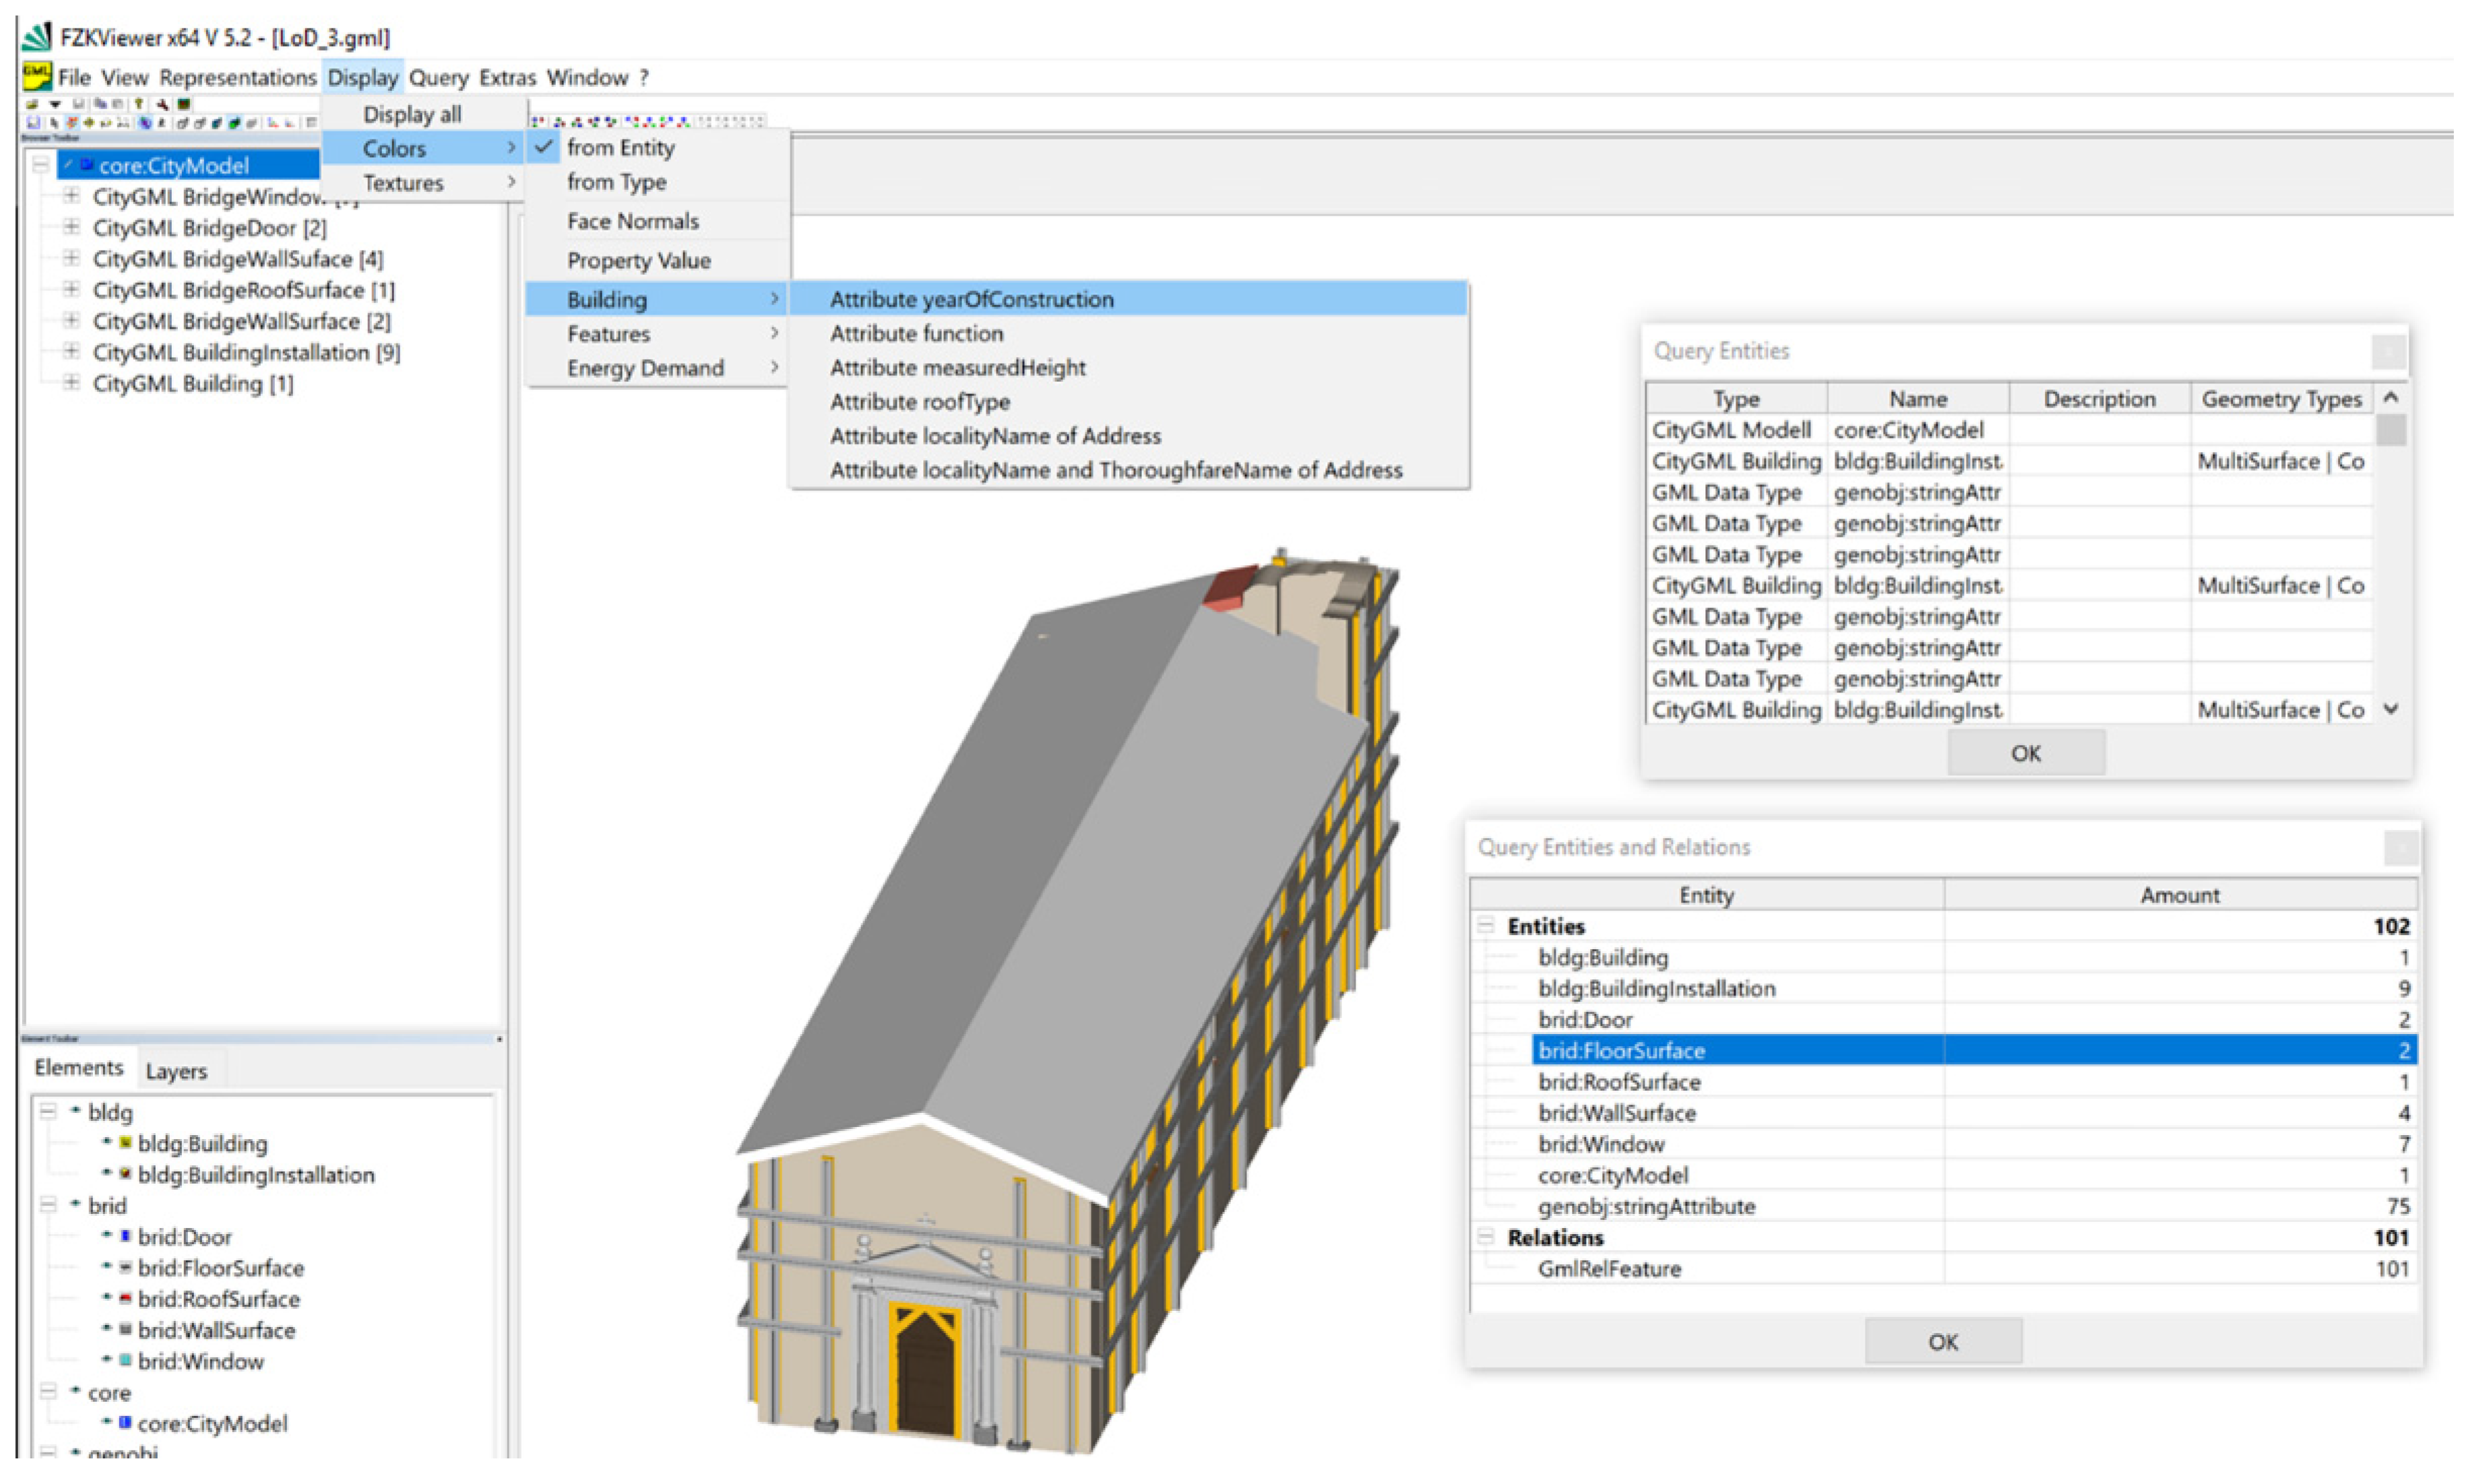
In order to verify and validate the correctness of the conversion methodology process, the model was firstly imported into the FZK Viewer. This free software, developed by KIT (Karlsruher Univerity of Techonology), allows the user to inset and query 3D CityGML models. As Figure 20 shows, here it is possible to visualize the .GML file with the IFC parameters and the CityGML characteristics.
In a second phase the .GML file was imported into the open source GIS software QGIS in order to visualize the building in its context and to query the geometries.
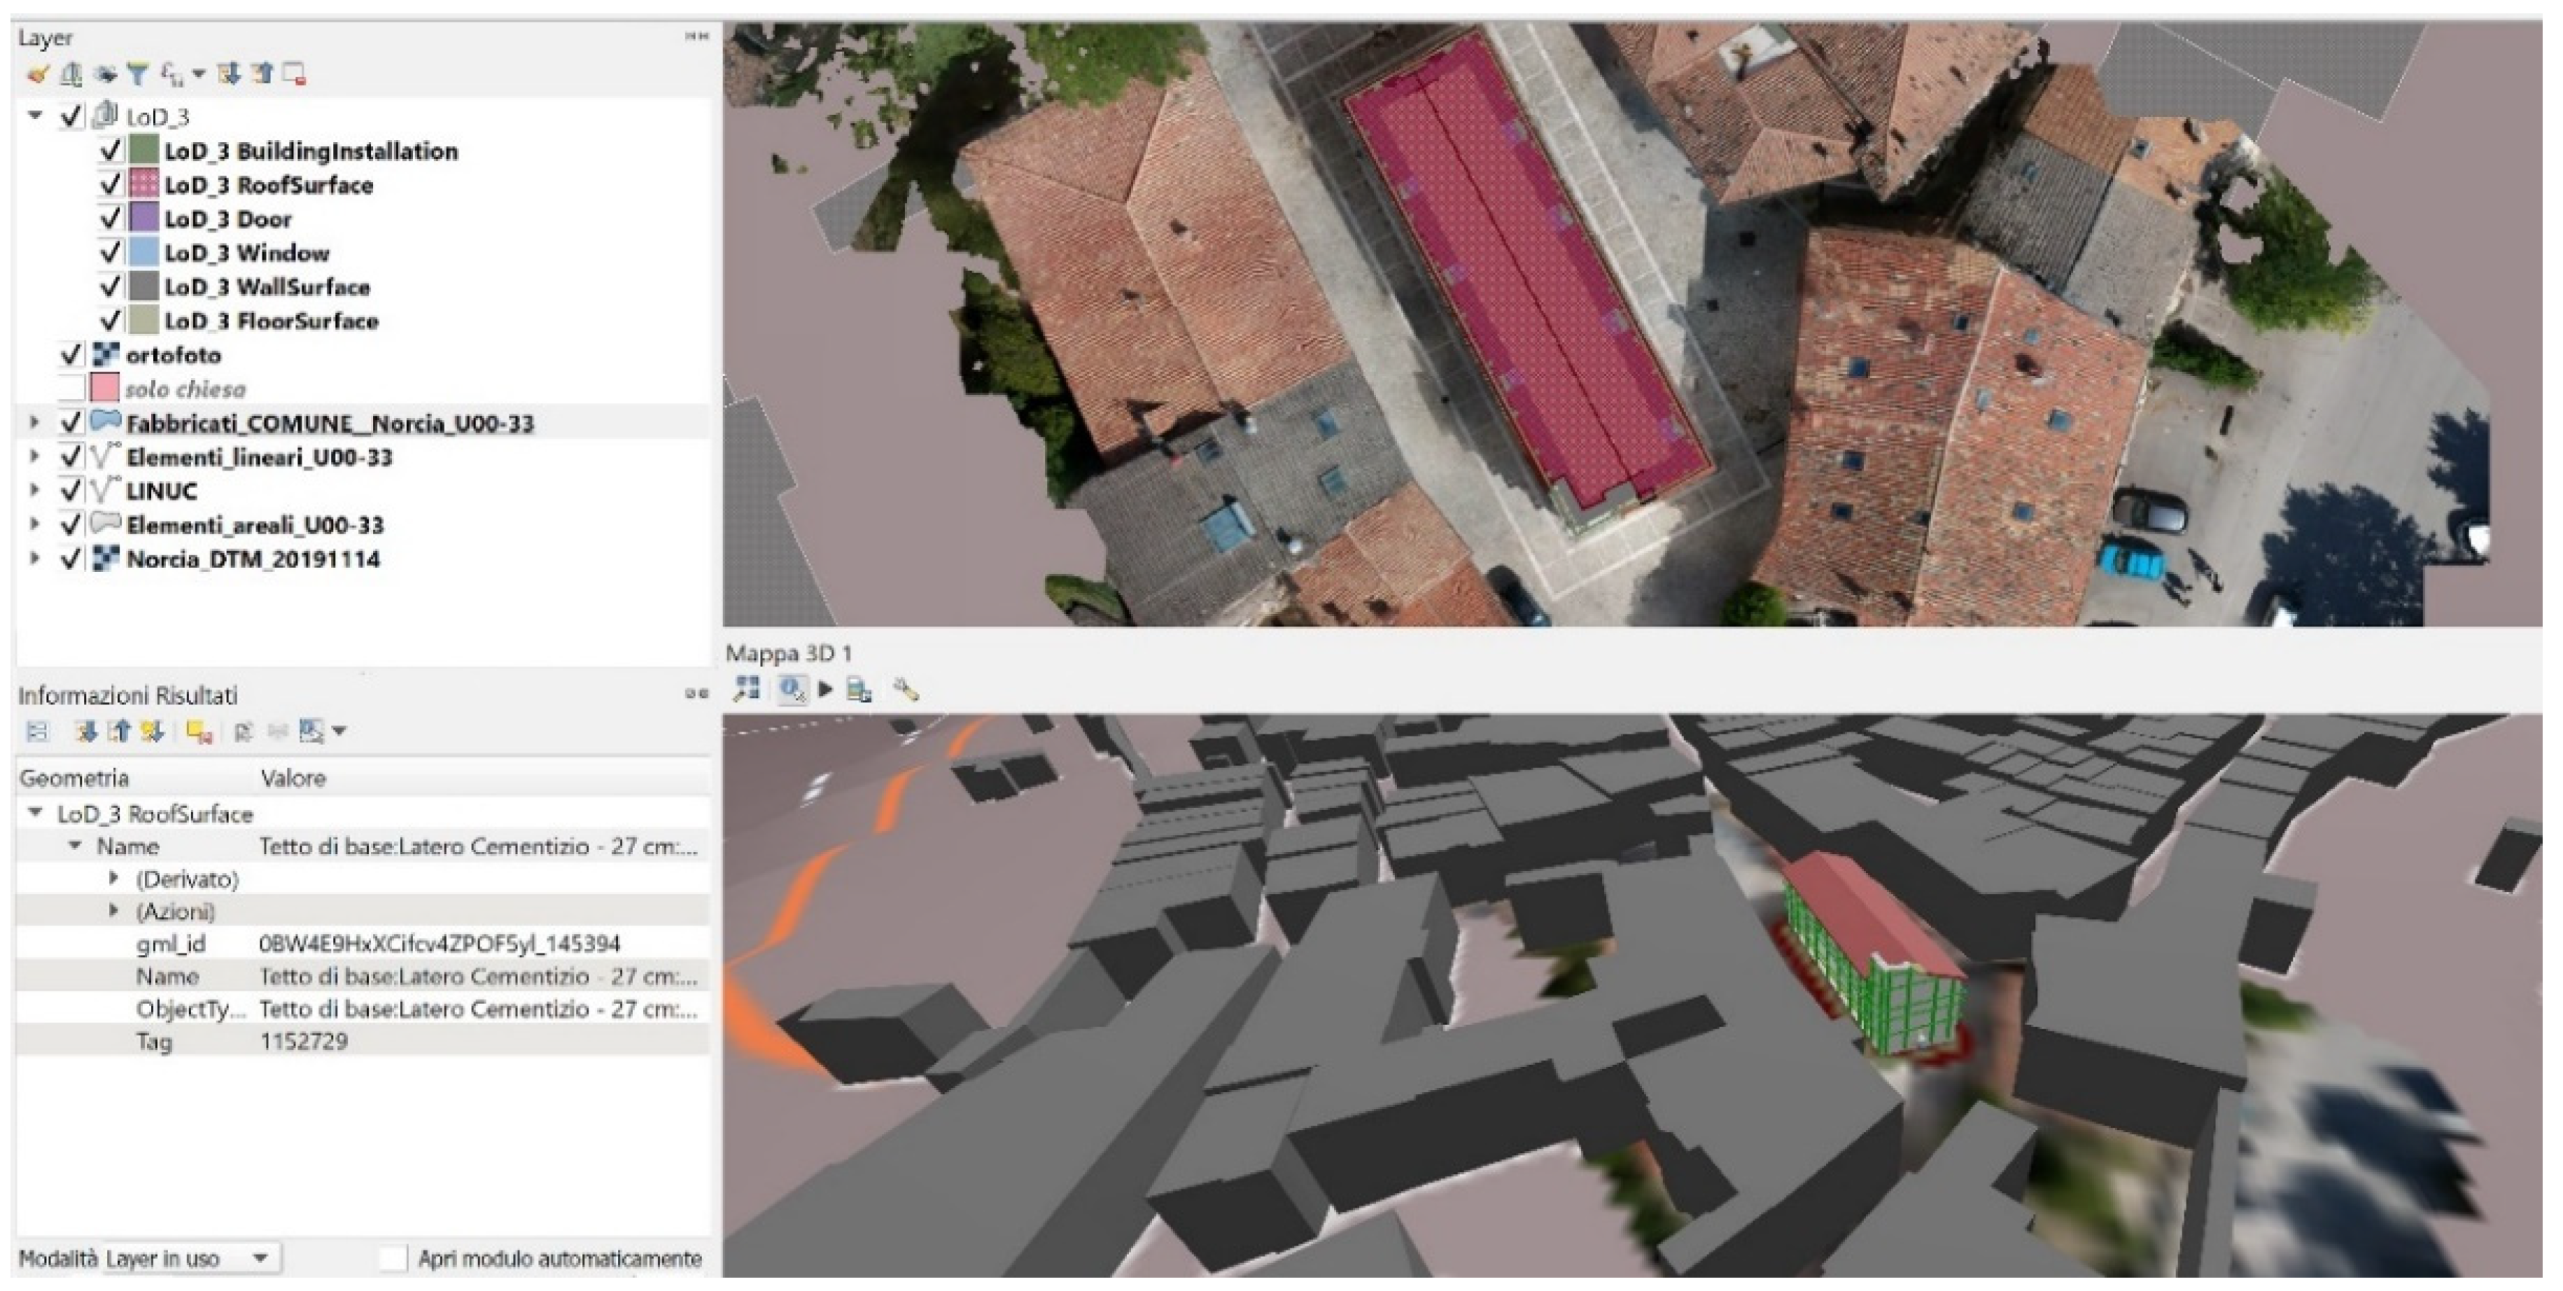
Thanks to the 3D Map developed in the QGIS software, it is possible to view the cartographic data such as buildings and DTM in 2.5D and 3D. In the Figure 21 the geometry “LOD_3RoofSurface” is selected and the related information are visualised.

5. Conclusions and Future Perspectives

Through the methodology proposed, a good level of interoperability is ensured, accomplishing the two levels of conceptual interoperability investigated. In fact, it is possible to convert an object-oriented model into the standard .GML format, through the IFC, keeping all the information related to geometry and semantics, even those typical of the HBIM models inserted, most of the time, as shared/project parameters.
Furthermore, the geo-referencing of the model is maintained in both the standards analysed and within both the solutions proposed, the commercial and the open source ones.
The first methodological phase (HBIM-GIS integration using a recent function in a GIS commercial solution) was aimed on importing a BIM model into the GIS environment. This test considered the native data format and represented the technical interoperability issue.
The second test (HBIM-GIS integration considering standard formats and models solutions) considered a standard data model for exchange purposes.
These solutions were chosen in order to allow a representation of the church and the city with a multi-scale approach (using CityGML Level of Detail). This method could allow the connection of the entire 3D model with other geographic information systems, SDIs, databases and linguistic and domain ontologies; in this way, interoperability (lexical, data, knowledge model and object) and sharing of information are ensured.
In the GIS environment, moreover, the BIM model and its data information could be related to other parameters performing risk analyses, comparing entities with raster data as well as risk maps (such as the Italian seismic earthquake zoning map). The potentiality of importing such a detailed 3D model into GIS regards the possibility to create a spatial/geo-database connecting all the entities included in the project (such as buildings, roads, services and other cartographic elements, vulnerability parameters and hazard maps).
A bottleneck of this methodology, using the standard data format, is the lack of a workflow where the attributes of the HBIM model are automatically maintained or managed after the conversion, without the need for manual insertion of transformers in FME (e.g., “AttributeExposer”, “Attribute Manager”, “AttributeRemover”). If we solely consider the visualization of the output file, it has been highlighted that on the one hand the commercial software ArcGIS Pro does not support the .GML format yet, on the other, the open source solution allows the model to be viewed, but a further theming is manually required. Finally, once the compliance test for the .GML format has been performed in the CityGML schema validator, the FME output file is not validated, therefore further studies should be needed.
Future developments of this research could be: the test of the further conversion of the .GML format of a historic building into INSPIRE via FME, based on the latest research in the state-of-art; a validation of the XML schema through various tests and validator, as the one developed by the TU Delft GeoBIM research group and recently tested in the framework of the GeoBIM benchmark 2019 [40]; insertion of data related to seismic vulnerability or risk/hazard parameters directly into the HBIM model to allow more specific analyses in the GIS environment; validate semantic interoperability with a consolidated structure such as ontologies for cultural heritage [41], ultimately it could be useful to deepen and investigate the other levels of interoperability that, in this study, have not been taken into account (syntactic and pragmatic).

Author Contributions

Conceptualization, E.C. and F.M; methodology, E.C., V.D.R., F.M. and G.R.; software, V.D.R. and G.R.; validation, E.C.; formal analysis, F.M.; investigation, V.D.R. and G.R.; resources, A.L.; data curation, E.C. and F.M.; writing—original draft preparation, E.C., V.D.R., F.M., G.R.; writing—review and editing, F.M.; visualization, E.C., V.D.R., F.M., G.R.; supervision, A.L.; project administration, A.L. All authors have read and agreed to the published version of the manuscript.

Funding

This research received no external funding.

Acknowledgments

The authors would like to thank the Team DIRECT of Politecnico di Torino (a voluntary student team that every year involves students from Architecture and Engineer organizing survey stage in emergency areas) involved in the survey campaign of September 2017 in the areas of the centre of Italy damaged by the earthquake.

Conflicts of Interest

The authors declare no conflict of interest.

References

  1. Munkley, J.; Kassem, M.; Dawood, N. Synchronous building information model-based collaboration in the cloud: A proposed low cost it platform and a case study. Comput. Civ. Build. Eng. 2014, 89–96. [Google Scholar] [CrossRef] [Green Version]
  2. Orr, K.; Shen, Z.; Juneja, P.K.; Snodgrass, N.; Kim, H. Intelligent facilities: Applicability and flexibility of open BIM standards for operations and maintenance. In Proceedings of the Construction Research Congress 2014: Construction in a Global Network, Atlanta, GA, USA, 19–21 May 2014; pp. 1951–1960. [Google Scholar]
  3. Brumana, R.; Della Torre, S.; Previtali, M.; Barazzetti, L.; Cantini, L.; Oreni, D.; Banfi, F. Generative HBIM modelling to embody complexity (LOD, LOG, LOA, LOI): Surveying, preservation, site intervention—The Basilica di Collemaggio (L’Aquila). Appl. Geomat. 2018, 10, 545–567. [Google Scholar] [CrossRef]
  4. Irizarry, J.; Karan, E.P.; Jalaei, F. Integrating BIM and GIS to improve the visual monitoring of construction supply chain management. Autom. Constr. 2013, 31, 241–254. [Google Scholar] [CrossRef]
  5. Jusuf, S.K.; Mousseau, B.; Godfroid, G.; Soh, J.H.V. Path to an Integrated Modelling between IFC and CityGML for Neighborhood Scale Modelling. Urban Sci. 2017, 1, 25. [Google Scholar] [CrossRef] [Green Version]
  6. Rafiee, A.; Dias, E.; Fruijtier, S.; Scholten, H. From BIM to geo-analysis: View coverage and shadow analysis by BIM/GIS integration. Procedia Environ. Sci. 2014, 22, 397–402. [Google Scholar] [CrossRef] [Green Version]
  7. Amirebrahimi, S.; Rajabifard, A.; Mendis, P.; Ngo, T. A BIM-GIS integration method in support of the assessment and 3D visualisation of flood damage to a building. J. Spat. Sci. 2016, 61, 317–350. [Google Scholar] [CrossRef]
  8. Del Giudice, M.; Osello, A.; Patti, E. BIM and GIS for district modeling. In Proceedings of the 10th European Conference on Product & Process Modelling (ECPPM 2014), Vienna, Austria, 17–19 September 2014. [Google Scholar]
  9. Torabi Moghadam, S.; Ugliotti, F.M.; Lombardi, P.; Mutani, G.; Osello, A. BIM-GIS modelling for sustainable urban development. NEWDIST 2016, 339–350. [Google Scholar]
  10. Boguslawski, P.; Mahdjoubi, L.; Zverovich, V.; Fadli, F.; Barki, H. BIM-GIS modelling in support of emergency response applications. WIT Trans. Built Environ. 2015, 149, 381–391. [Google Scholar]
  11. Teo, T.-A.; Cho, K.-H. BIM-oriented indoor network model for indoor and outdoor combined route planning. Adv. Eng. Inform. 2016, 30, 268–282. [Google Scholar] [CrossRef]
  12. Fosu, R.; Suprabhas, K.; Rathore, Z.; Cory, C. Integration of Building Information Modeling (BIM) and Geographic Information Systems (GIS)—A literature review and future needs. In Proceedings of the 32nd CIB W78 Conference, Eindhoven, The Netherlands, 27–29 October 2015; pp. 196–2014. [Google Scholar]
  13. Ma, Z.; Ren, Y. Integrated Application of BIM and GIS: An Overview. Procedia Eng. 2017, 196, 1072–1079. [Google Scholar] [CrossRef]
  14. Saygi, G.; Agugiaro, G.; Hamamcioglu-Turan, M.; Remondino, F. Evaluation of GIS and BIM roles for the information management of historical buildings. ISPRS Ann. Photogramm. Remote Sens. Spat. Inf. Sci. 2013, 2, 283–288. [Google Scholar] [CrossRef] [Green Version]
  15. Dore, C.; Murphy, M. Integration of HBIM and 3D GIS for Digital Heritage Modelling. In Proceedings of the Digital Documentation, Edinburgh, Scotland, 22–23 October 2012. [Google Scholar]
  16. Tobiáš, P. BIM, GIS and semantic models of cultural heritage buildings. Geoinf. FCE CTU 2016, 15, 27–41. [Google Scholar] [CrossRef] [Green Version]
  17. Vacca, G.; Quaquero, E.; Pili, D.; Brandolini, M. GIS-HBIM integration for the management of historical buildings. Int. Arch. Photogramm. Remote Sens. Spat. Inf. Sci. 2018, 42, 1129–1135. [Google Scholar] [CrossRef] [Green Version]
  18. Quattrini, R.; Pierdicca, R.; Morbidoni, C.; Malinverni, E.S. Conservation-oriented HBIM. The bimexplorer web tool. Int. Arch. Photogramm. Remote Sens. Spat. Inf. Sci. 2017, 42, 275–281. [Google Scholar] [CrossRef] [Green Version]
  19. Centofanti, M.; Continenza, R.; Brusaporci, S.; Trizio, I. The architectural information system SIArch3D-univaq for analysis and preservation of architectural heritage. Int. Arch. Photogramm. Remote Sens. Spat. Inf. Sci. 2011, 23, 9–14. [Google Scholar] [CrossRef] [Green Version]
  20. Baik, A.; Yaagoubi, R.; Boehm, J. Integration of Jeddah Historical BIM and 3D GIS for documentation and restoration of historical monument. Int. Arch. Photogramm. Remote Sens. Spat. Inf. Sci. 2015, 40, 29–34. [Google Scholar] [CrossRef] [Green Version]
  21. Matrone, F.; Colucci, E.; De Ruvo, V.; Lingua, A.; Spanò, A. HBIM in a semantic 3D GIS database. Int. Arch. Photogramm. Remote Sens. Spat. Inf. Sci. 2019, 42, 857–865. [Google Scholar] [CrossRef] [Green Version]
  22. Bitelli, G.; Balletti, C.; Brumana, R.; Barazzetti, L.; D’Urso, M.G.; Rinaudo, F.; Tucci, G. Metric documentation of cultural heritage: research directions from the italian GAMHER project. Int. Arch. Photogramm. Remote Sens. Spat. Inf. Sci. 2017, 42, 83–90. [Google Scholar] [CrossRef] [Green Version]
  23. Tolmer, C.-E.; Castaing, C.; Diab, Y.; Morand, D. CityGML and IFC: Going further than LOD. In Proceedings of the 2013 Digital Heritage International Congress (DigitalHeritage), Marseille, France, 28 October–1 November 2013; pp. 1–4. [Google Scholar]
  24. Albert, J.; Bachmann, M.; Hellmeier, A. Zielgruppen und Anwendungen für Digitale Stadtmodelle und Digitale Geländemodelle. Erhebung im Rahmen der SIG 3D der GDI NRW 2003, 1–5. [Google Scholar]
  25. Fan, H.C.; Meng, L.Q. Automatic derivation of different levels of detail for 3D buildings modelled by CityGML. In Proceedings of the 24th International Cartography Conference, Santiago, Chile, 15–21 November 2009; pp. 15–21. [Google Scholar]
  26. Deng, Y.; Cheng, J.; Anumba, C. Mapping between BIM and 3D GIS in different levels of detail using schema mediation and instance comparison. Autom. Constr. 2016, 67, 1–21. [Google Scholar] [CrossRef]
  27. De Laat, R.; Van Berlo, L. Integration of BIM and GIS: The development of the CityGML GeoBIM extension. In Advances in 3D Geo-Information Sciences; Springer: Berlin/Heidelberg, Germany, 2011; pp. 211–225. [Google Scholar]
  28. Shen, G.; Yuan, Z. Using IFC Standard to Integrate BIM Models and GIS. In Proceedings of the International Conference on Construction & Real Estate Management, Brisbane, Australia, 1–3 December 2010; pp. 224–229. [Google Scholar]
  29. El-Mekawy, M.; Östman, A. Semantic mapping: An ontology engineering method for integrating building models in IFC and CityGML. In Proceedings of the 3rd ISDE Digital Earth Summit, Nessebar, Bulgaria, 12–14 June 2010; pp. 12–14. [Google Scholar]
  30. El-Mekawy, M.; Östman, A. Ontology Engineering Method for Integrating Building Models: The Case of IFC and CityGML. In Universal Ontology of Geographic Space: Semantic Enrichment for Spatial Data; IGI Global: Hershey, PA, USA, 2012; pp. 151–185. [Google Scholar]
  31. El-Mekawy, M.; Östman, A.; Hijazi, I. A Unified Building Model for 3D Urban GIS. ISPRS Int. J. GeoInf. 2012, 1, 120–145. [Google Scholar] [CrossRef] [Green Version]
  32. Koutamanis, A. Building Information—Representation and Management—Fundamentals and Principles; Tu Delft Open: Delft, The Netherlands, 2019. [Google Scholar]
  33. Chiabrando, F.; Sammartano, G.; Spanò, A.; Spreafico, A. Hybrid 3D Models: When Geomatics Innovations Meet Extensive Built Heritage Complexes. ISPRS Int. J. GeoInf. 2019, 8, 124. [Google Scholar] [CrossRef] [Green Version]
  34. Tucci, G.; Bonora, V.; Conti, A.; Fiorini, L. Digital Workflow for the Acquisition and Elaboration of 3D Data in a Monumental Complex: The Fortress of Saint John the Babtist in Florence. ISPRS Int. Arch. Photogramm. Remote Sens. Spat. Inf. Sci. 2017, 42, 679–686. [Google Scholar] [CrossRef] [Green Version]
  35. Bitelli, G.; Dellapasqua, M.; Girelli, V.A.; Sanchini, E.; Tini, M.A. 3D Geomatics Techniques for an Integrated Approach to Cultural Heritage Knowledge: The Case of San Michele in Acerboli’s Church in Santarcangelo di Romagna. ISPRS Int. Arch. Photogramm. Remote Sens. Spat. Inf. Sci. 2017, 42, 291–296. [Google Scholar] [CrossRef] [Green Version]
  36. Tolk, A.; Turnitsa, G.D.; Diallo, S.Y. Ontological implications of the Levels of Conceptual Interoperability Model. Model. Simul. Vis. Eng. Fac. Publ. 2006, 33, 1–7. [Google Scholar]
  37. Kolbe, T.H. CityGML tutorial. Presented at the 1st Joint Workshop on the Sino-Germany Bundle Project: Interoperation of 3D Urban Geoinformation, Urumqi, China, 2007. [Google Scholar]
  38. El-Mekawy, M.; Östman, A.; Khurram, S. Towards interoperating CityGML and IFC building models: A unified model based approach. In Advances in 3D Geo-Information Sciences; Springer: Berlin/Heidelberg, Germany, 2011; pp. 73–93. [Google Scholar]
  39. Nagel, C.; Stadler, A.; Kolbe, T.H. Conceptual Requirements for the Automatic Reconstruction of Building Information Models from Uninterpreted 3D Models. In Proceedings of the Academic Track of Geoweb 2009-3D Cityscapes Conference, Vancouver, BC, Canada, 27–31 July 2009. [Google Scholar]
  40. Noardo, F.; Biljecki, F.; Agugiaro, G.; Ohori, K.; Ellul, C.; Harrie, L.; Stoter, J. GeoBIM benchmark 2019: Intermediate results. ISPRS Int. Arch. Photogramm. Remote Sens. Spat. Inf. Sci. 2019, 42, 47–52. [Google Scholar] [CrossRef] [Green Version]
  41. Acierno, M.; Cursi, S.; Simeone, D.; Fiorani, D. Architectural heritage knowledge modelling: An ontology-based framework for conservation process. J. Cult. Herit. Elsevier Masson 2016, 24, 124–133. [Google Scholar] [CrossRef]
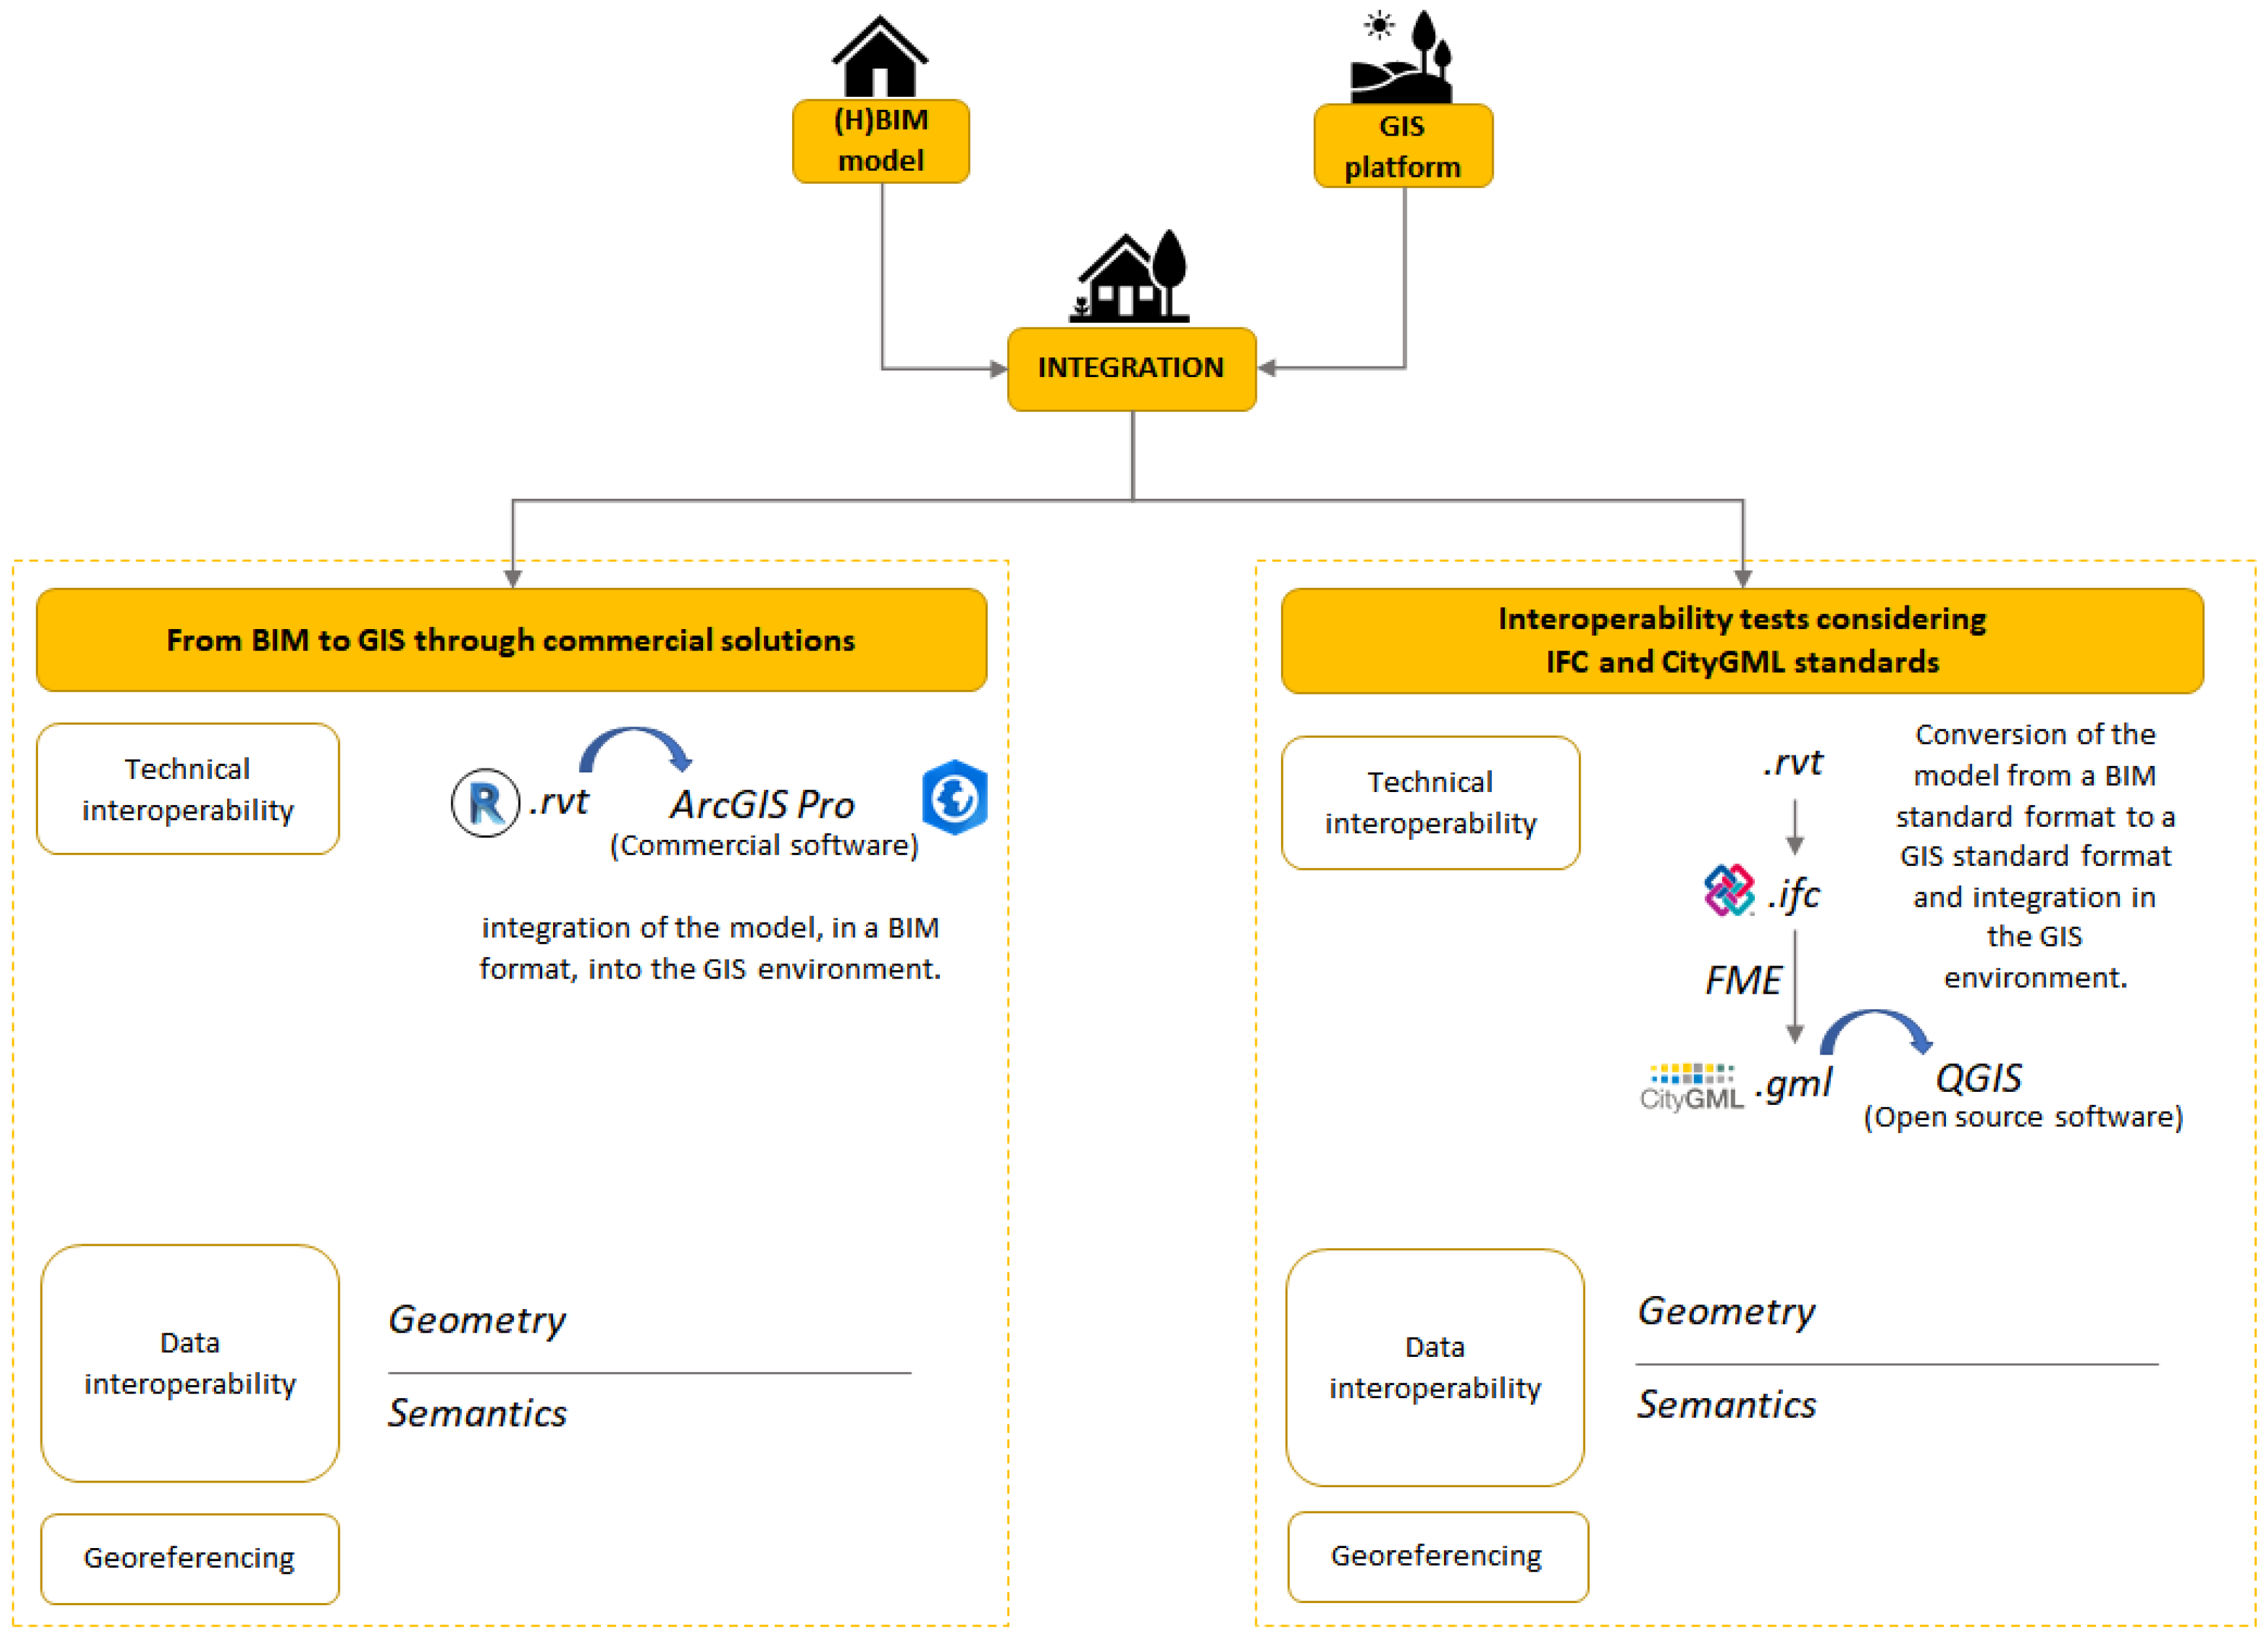
Figure 1. Methodological overview of the research.
Applsci 10 01356 g001
Figure 2. The Church of San Lorenzo in Norcia after the damage of the earthquake.
Applsci 10 01356 g002
Figure 3. Regions of point cloud segmentation (roof, security elements and walls).
Applsci 10 01356 g003
Figure 4. LoD 0 of the San Lorenzo Church and its context (in QGIS software).
Applsci 10 01356 g004
Figure 5. LoD1 and the 2.5 D visualization in ArcGIS Pro.
Applsci 10 01356 g005
Figure 6. Customized door family and the generic models for the safety structures.
Applsci 10 01356 g006
Figure 7. The deviation between the point cloud and the model. The highest deviation is noticeable on the damaged wall and bell tower (blue rectangle), in particular on the top of the side wall is due to the collapsed parts (ashlars and masonry) purposely not modelled.
Applsci 10 01356 g007
Figure 8. (a) The overlapped point cloud on the wall. (b) The subtraction of the volume for narrowing the thickness of the wall.
Applsci 10 01356 g008
Figure 9. CityGML building model in LoDs 0 to 4 [37].
Applsci 10 01356 g009
Figure 10. Three-dimensional visualization of LoD 3 in ArcGIS Pro.
Applsci 10 01356 g010
Figure 11. Structure of a simple building in CityGML [37].
Applsci 10 01356 g011
Figure 12. Population of new parameters connected to the damage event in Revit.
Applsci 10 01356 g012
Figure 13. Create parent/child lookup.
Applsci 10 01356 g013
Figure 14. Conversion to remove geometry from “IfcBuilding”.
Applsci 10 01356 g014
Figure 15. Example of workflow applied for windows, from “IfcWindow” to CityGML.
Applsci 10 01356 g015
Figure 16. “ConvertGeometry” custom transformer workflow.
Applsci 10 01356 g016
Figure 17. “GetGrandParentID” custom transformer workflow.
Applsci 10 01356 g017
Figure 18. “CityGMLGeometrySetter” custom transformer workflow.
Applsci 10 01356 g018
Figure 19. The .gml output file visualised in the FME Data Inspector.
Applsci 10 01356 g019
Figure 20. The 3D model CityGML file of the church visualised in the FZK Viewer.
Applsci 10 01356 g020
Figure 21. QGIS 3D visualisation of the .GML file of the church and its context.
Applsci 10 01356 g021
Table 1. Characterisitics of levels of detail 0–4 representations in CityGML—buildings [24,25].
LoD 0LoD 1LoD 2LoD 3LoD 4
Model scale descriptionRegional, landscapeCity, regionCity districtArchitectural models (outside), landmarkArchitectural model (interior)
Class of accuracyLowestLowMiddleHighVery high
Accuracy of position and heightLower than LoD 15 m2 m0.5 m0.2 m
Approximate representation scaleMaximal generalization1:25,000–1:10,0001:10,000–1:50001:2500–1:10001:1000–1:500
GeneralizationMaximal generalizationObject blocks as generalized features >6 × 6 mObjects as generalized features >4 × 4 mObject as real features >2 × 2 mConstructive elements and openings are represented
Building installationnonoyesRepresentative exterior effectsReal object form
Roof form/structureyesflatRoof type and orientationReal object formReal object form
Table 2. Photogrammetric data of acquisition and post-processing phase.
Photogrammetric AcquisitionDJI SPARK
Applsci 10 01356 i001
CANON EOS 5 DSR
Applsci 10 01356 i002
ACQUISITION DATASensor [CMOS]1/2.31, 7
Focal Length [mm]420
Flight height [≈m]30\
Total n° of images469142
GSD (Ground Sample Distance) [mm]100, 7
POST-PROCESSED DATADense Point Cloud Merged Point Cloud
n. of points620.049.832234.545.525295.147.711
RMSE [m]0,0240,01480,0188
Table 3. Correspondences between IFC and CityGML data objects.
IFCCityGML
LoD 2LoD 3LoD 4
IfcBuilding ElementIfcBuildingElementProxyxBuildingInstallationBuildingInstallationexterior
xxIntBuildingInstallationinterior
IfcBeamxBuildingInstallationBuildingInstallationexterior
xxIntBuildingInstallationinterior
IfcColumnxBuildingInstallationBuildingInstallationexterior
xxIntBuildingInstallationinterior
IfcDoorxDoorDoor
IfcRoofRoofSurfaceRoofSurfaceRoofSurfaceexterior
xxCeilingSurfaceinterior
IfcSlabGroundSurfaceGroundSurfaceGroundSurfaceexterior
xxFloorSurfaceinterior
IfcStairxBuildingInstallationBuildingInstallationexterior
xxIntBuildingInstallationinterior
IfcWallWallSurfaceWallSurfaceWallSurfaceexterior
xxIntWallSurfaceinterior
IfcWindowxWindowWindow
Table 4. Corresponces beetween IFC and CityGML features and geometries.
IFC Feature TypeCityGML Feature TypeCitygml_Lod_Name ValueCitygml_Feature_Role
IfcWindowWindowLod [3–4] Multisurfaceopening
IfcBuildingElementProxyBuildingInstallationLod [3–4] GeometryouterBuildingInstallation
IfcDoorDoorLod [3–4] Multisurfaceopening
IfcRoofRoofSurfaceLod [2–4] MultisurfaceboundedBy
IfcSlabFloorSurfaceLod [2–4] MultisurfaceboundedBy
IfcWallStandardCaseWallSurfaceLod [2–4] MultisurfaceboundedBy
IfcWall