A Comprehensive Peach Fruit Quality Evaluation Method for Grading and Consumption
Abstract
Featured Application
Abstract
1. Introduction
2. Materials and Methods
2.1. Experimental Materials and Instruments
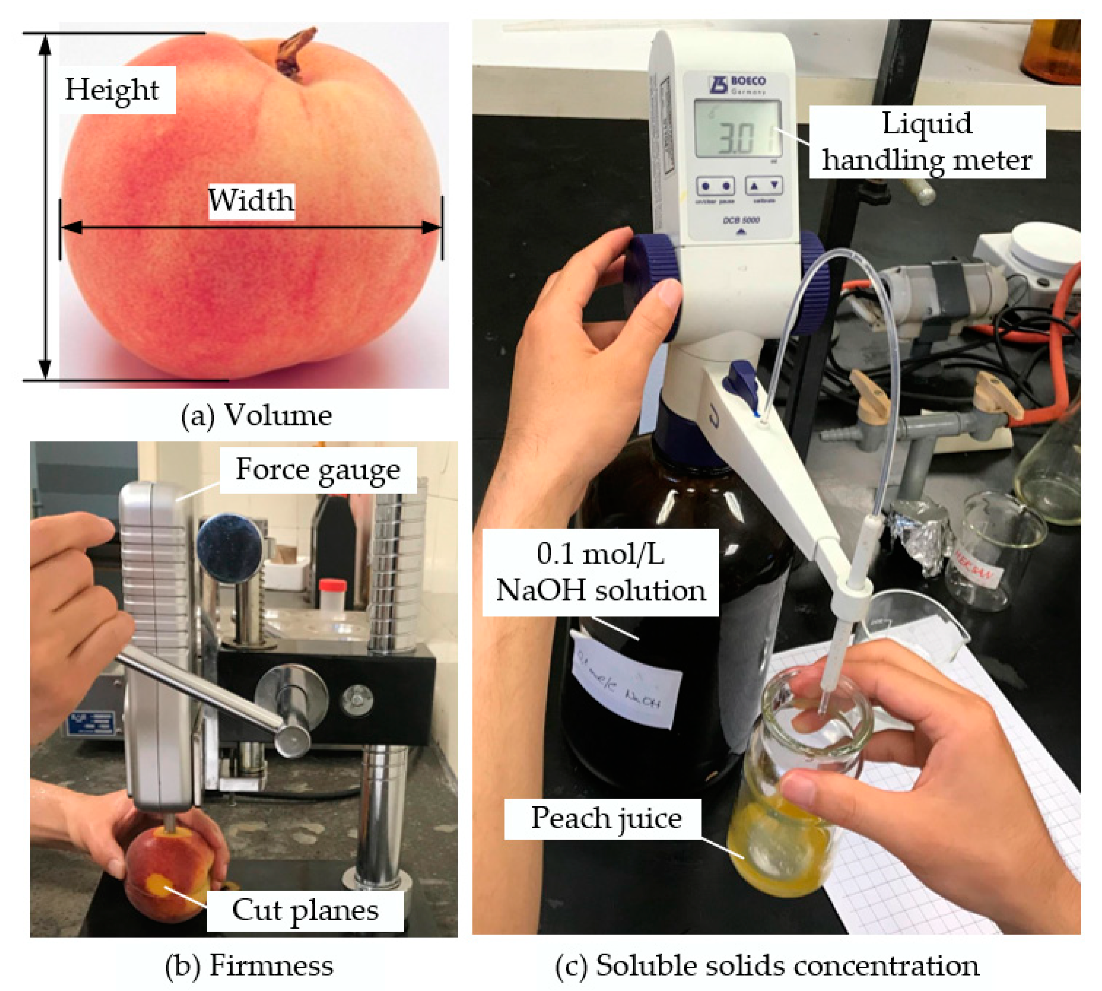
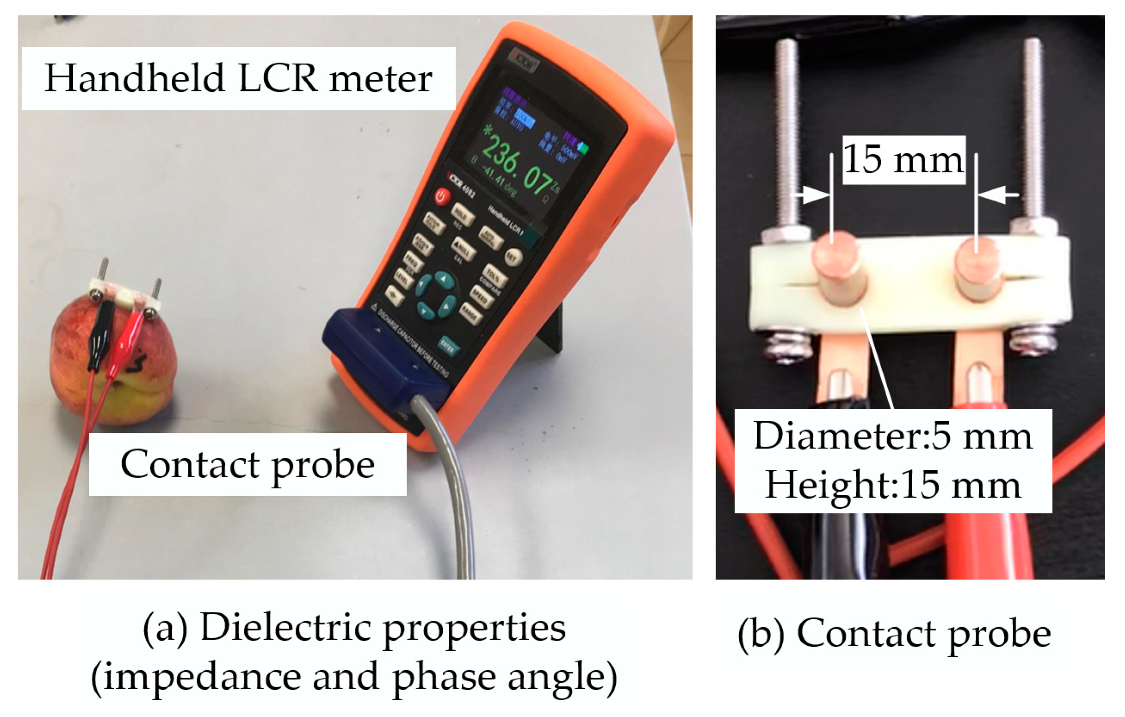
2.2. Determination of Indicators
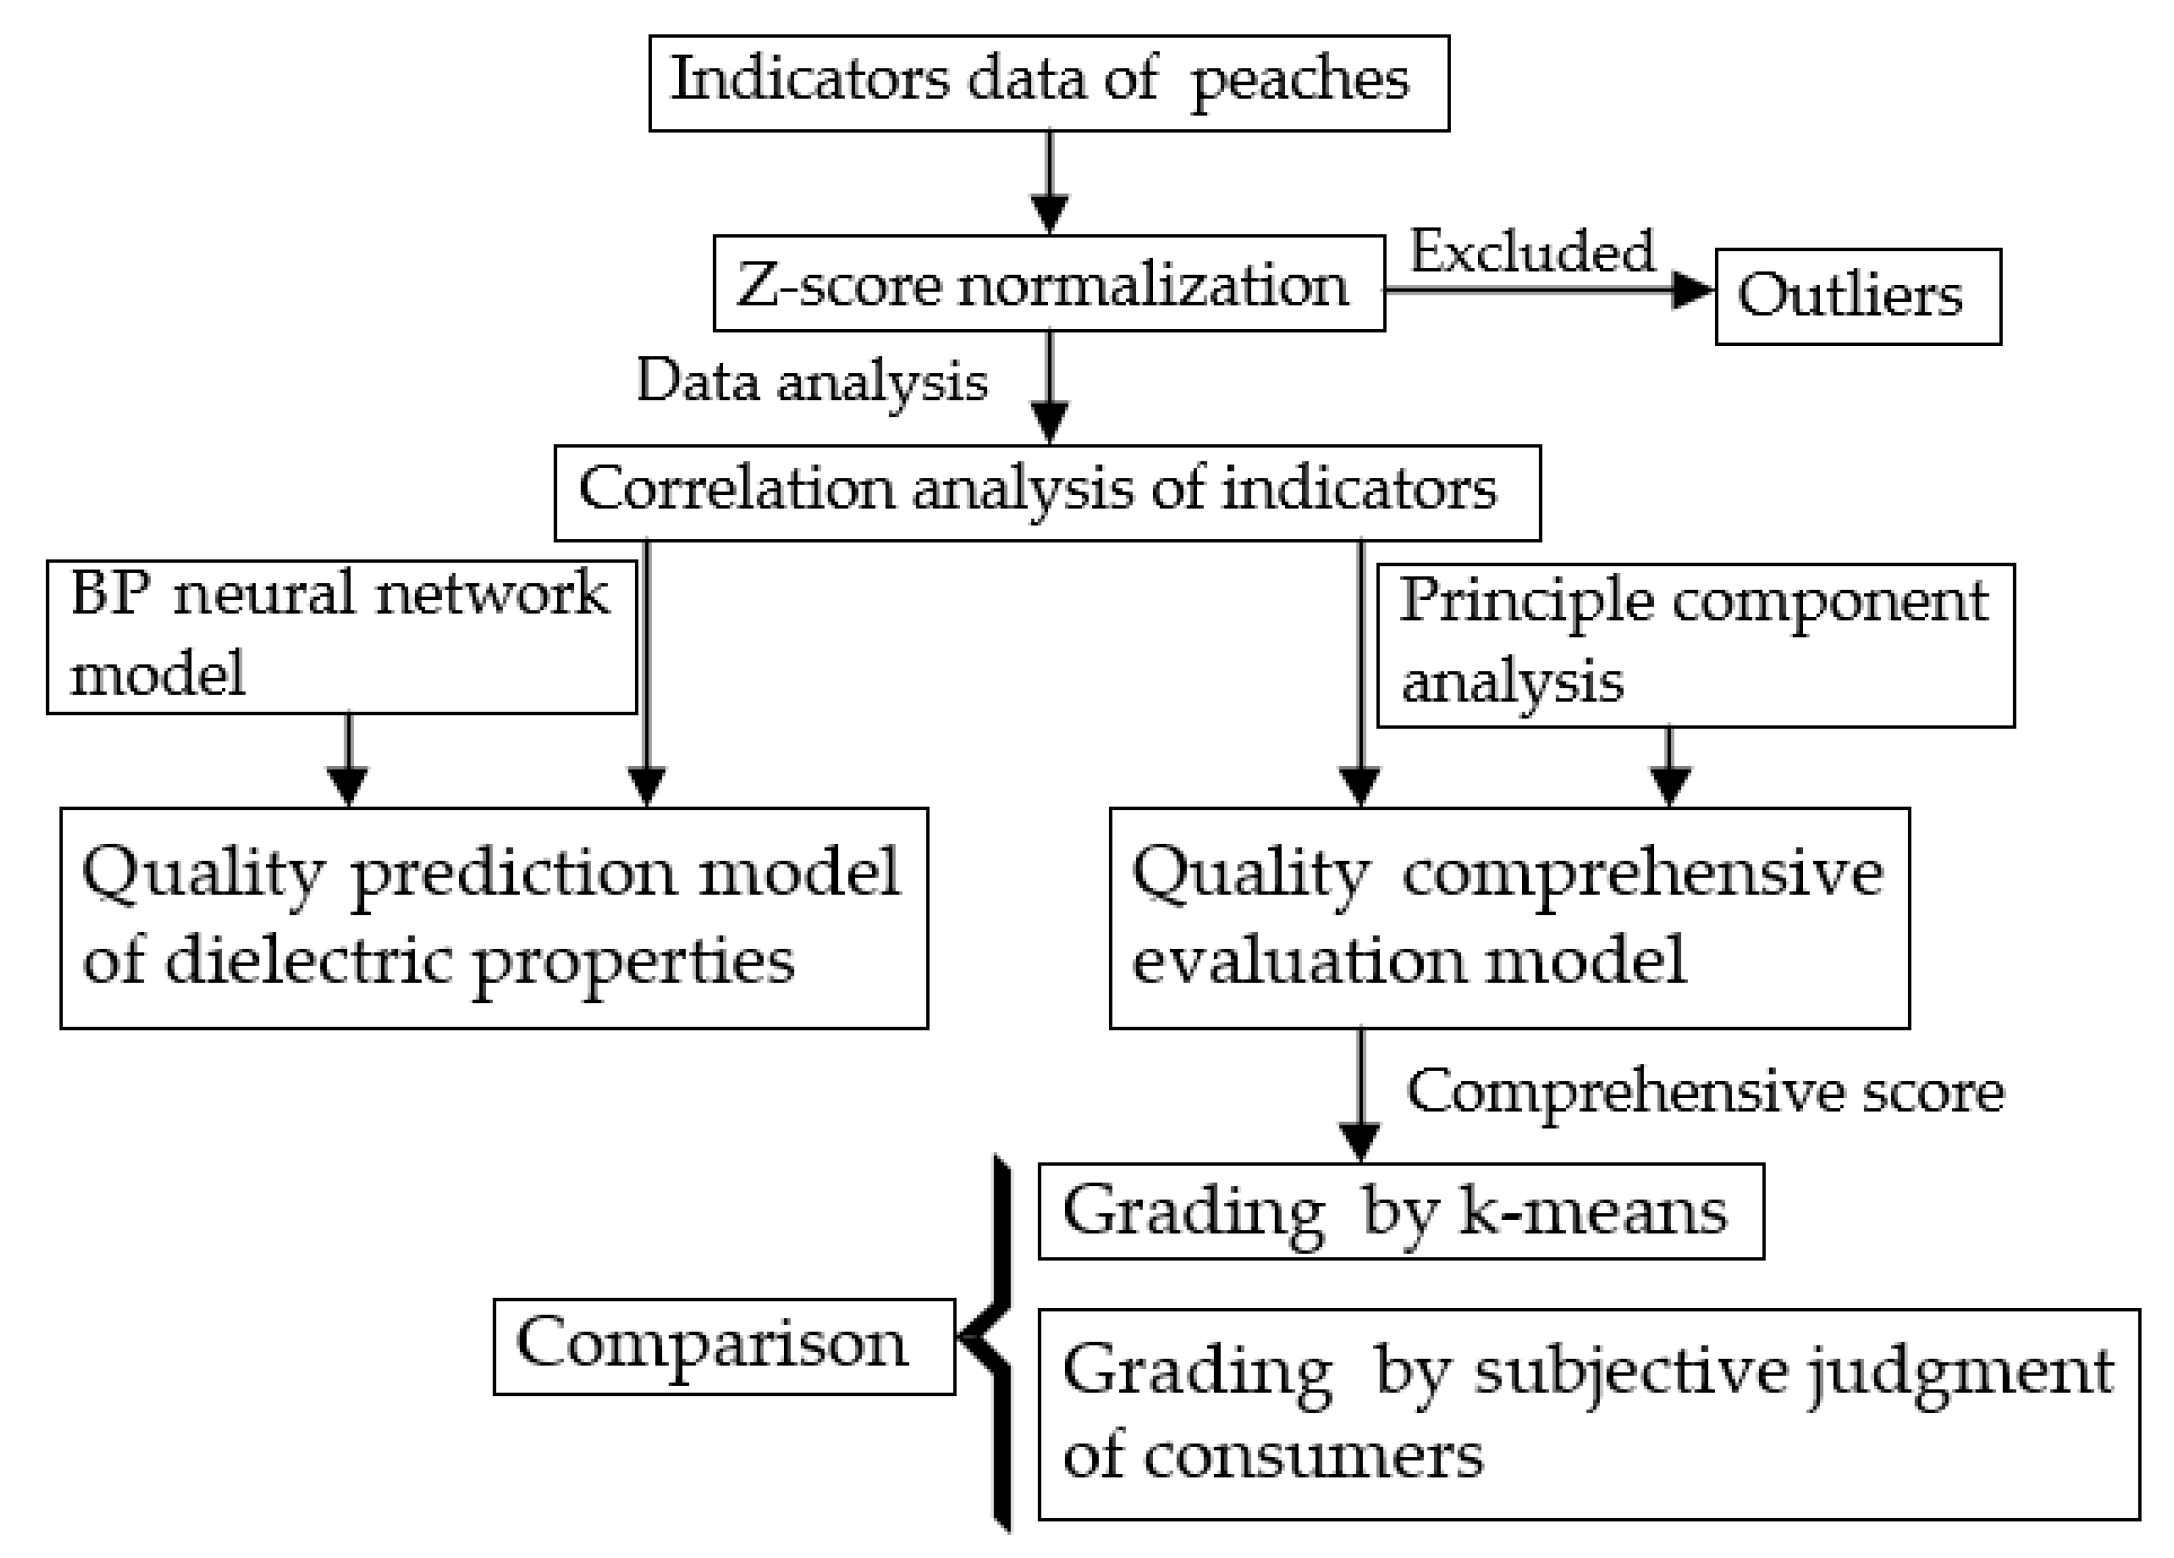
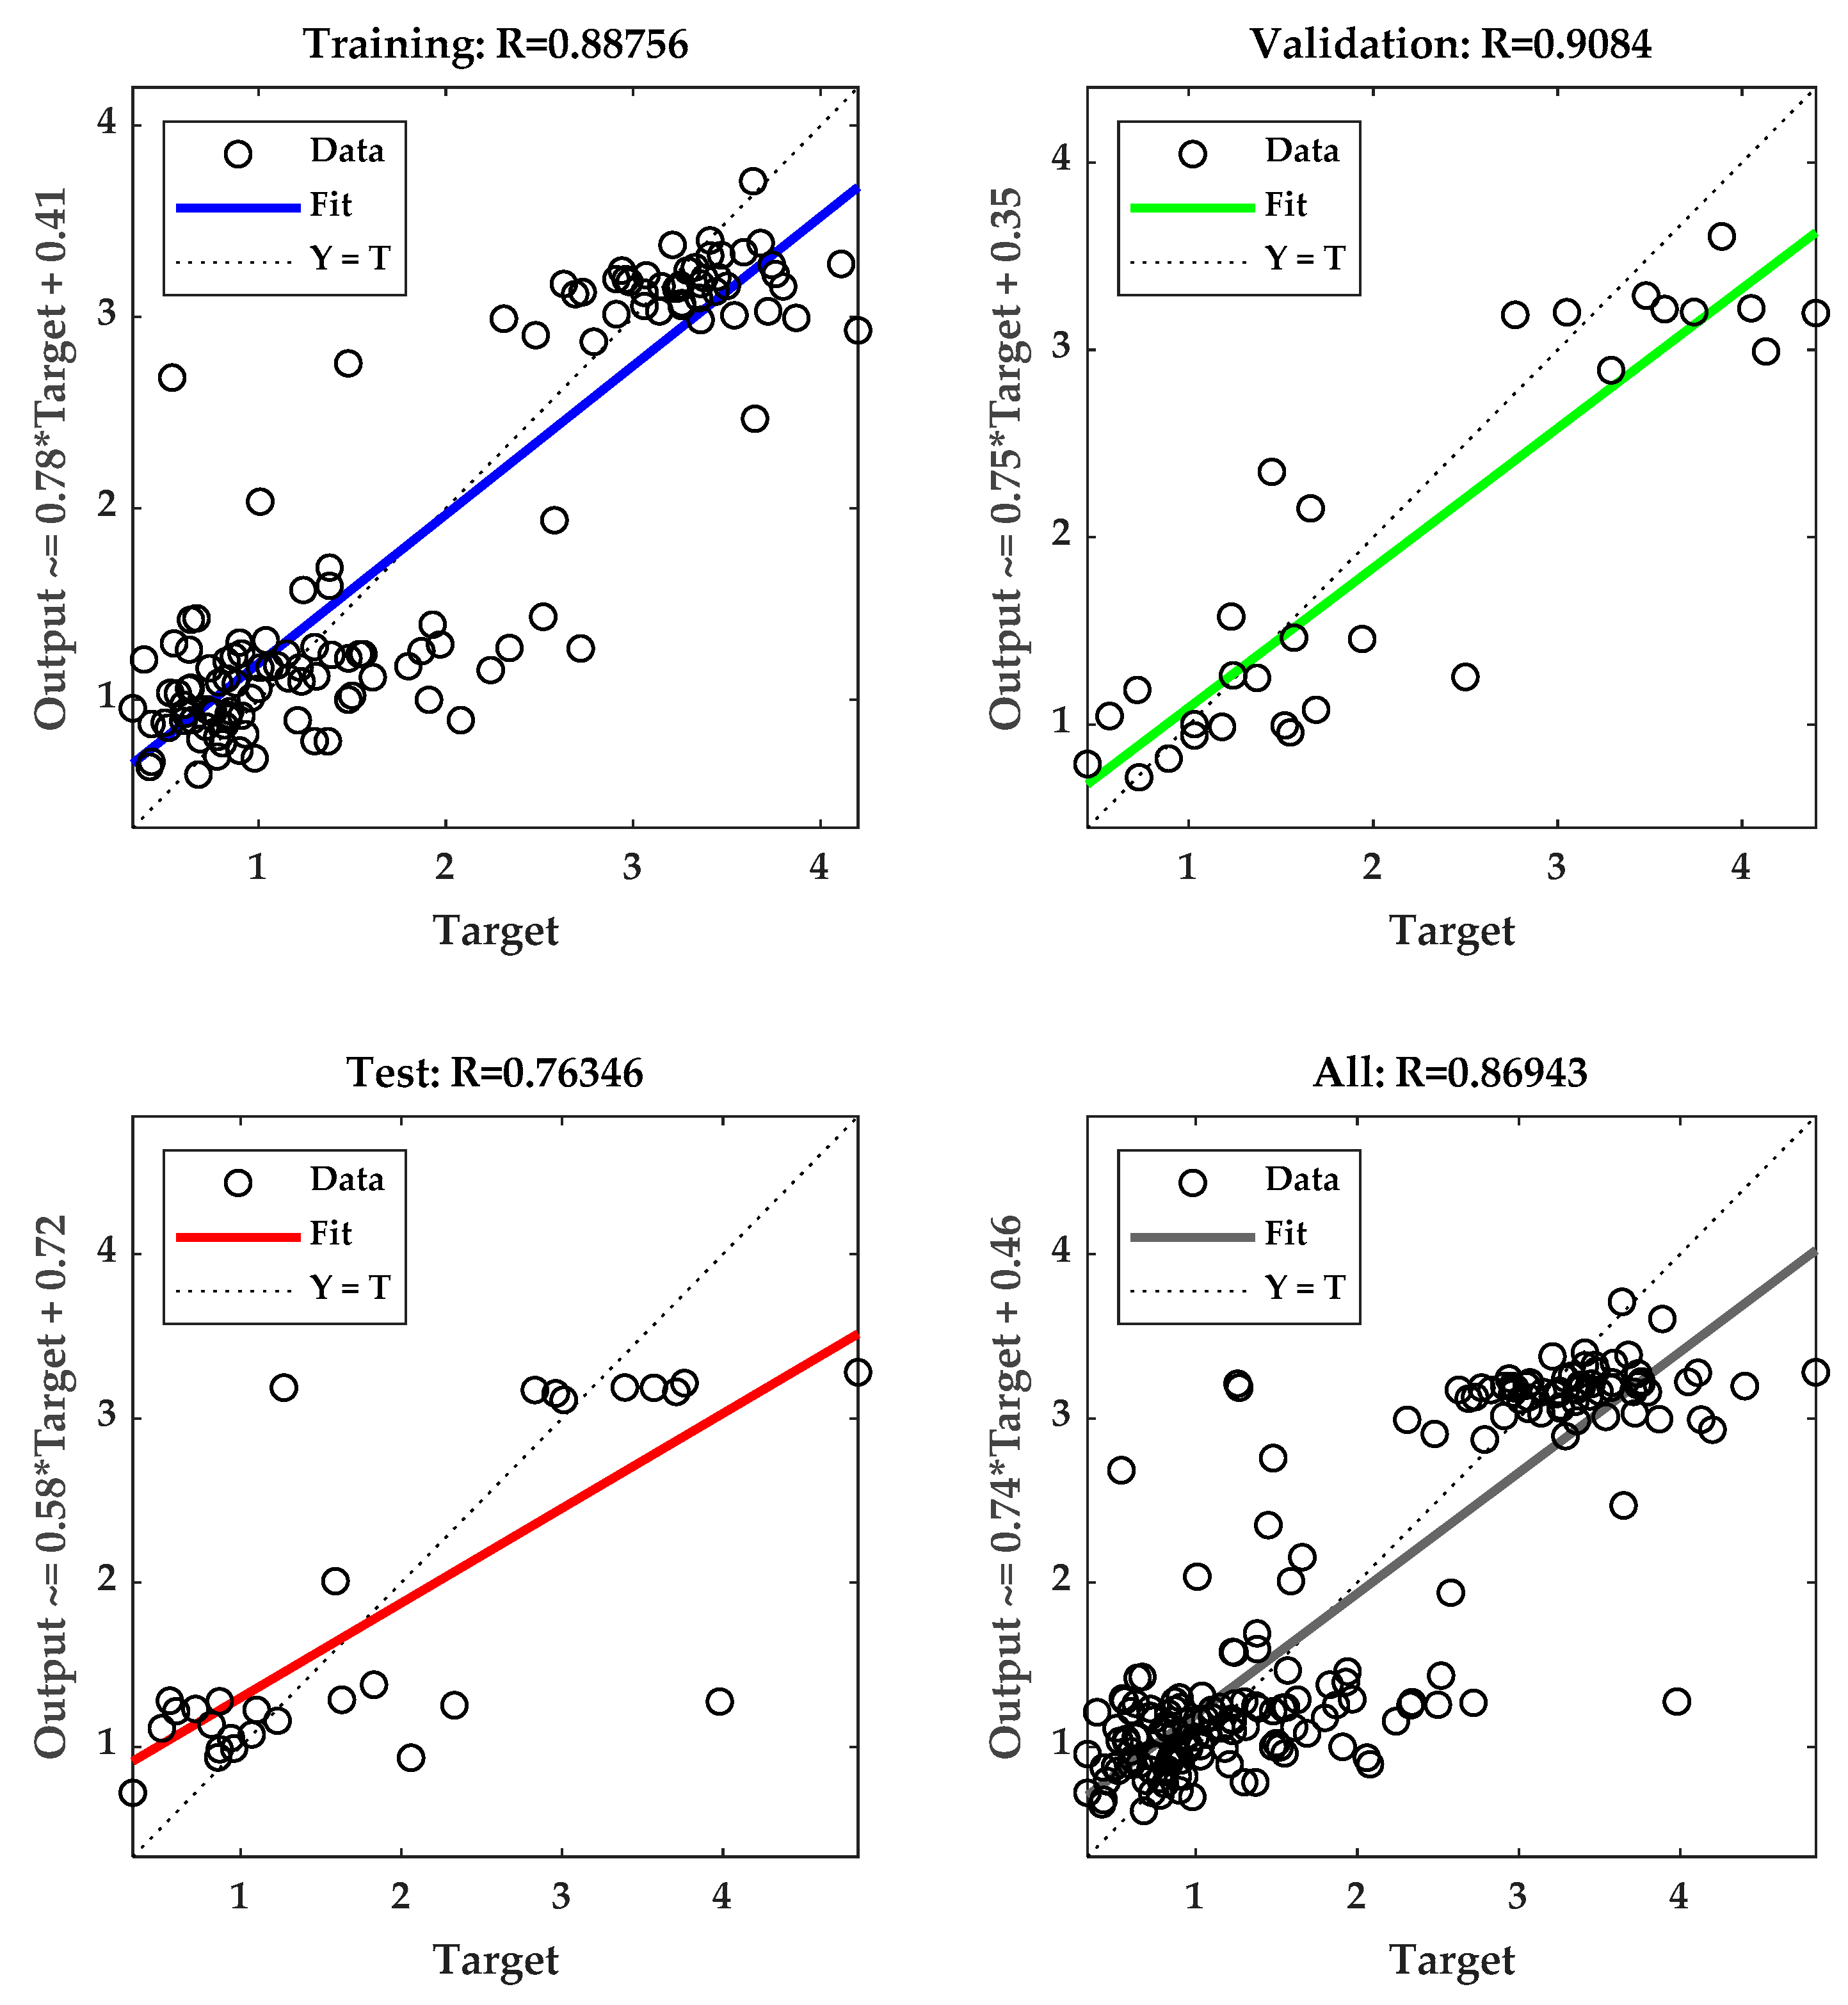
2.3. Data processing and Analysis
3. Results and Discussion
3.1. Correlation Analysis of Indicators
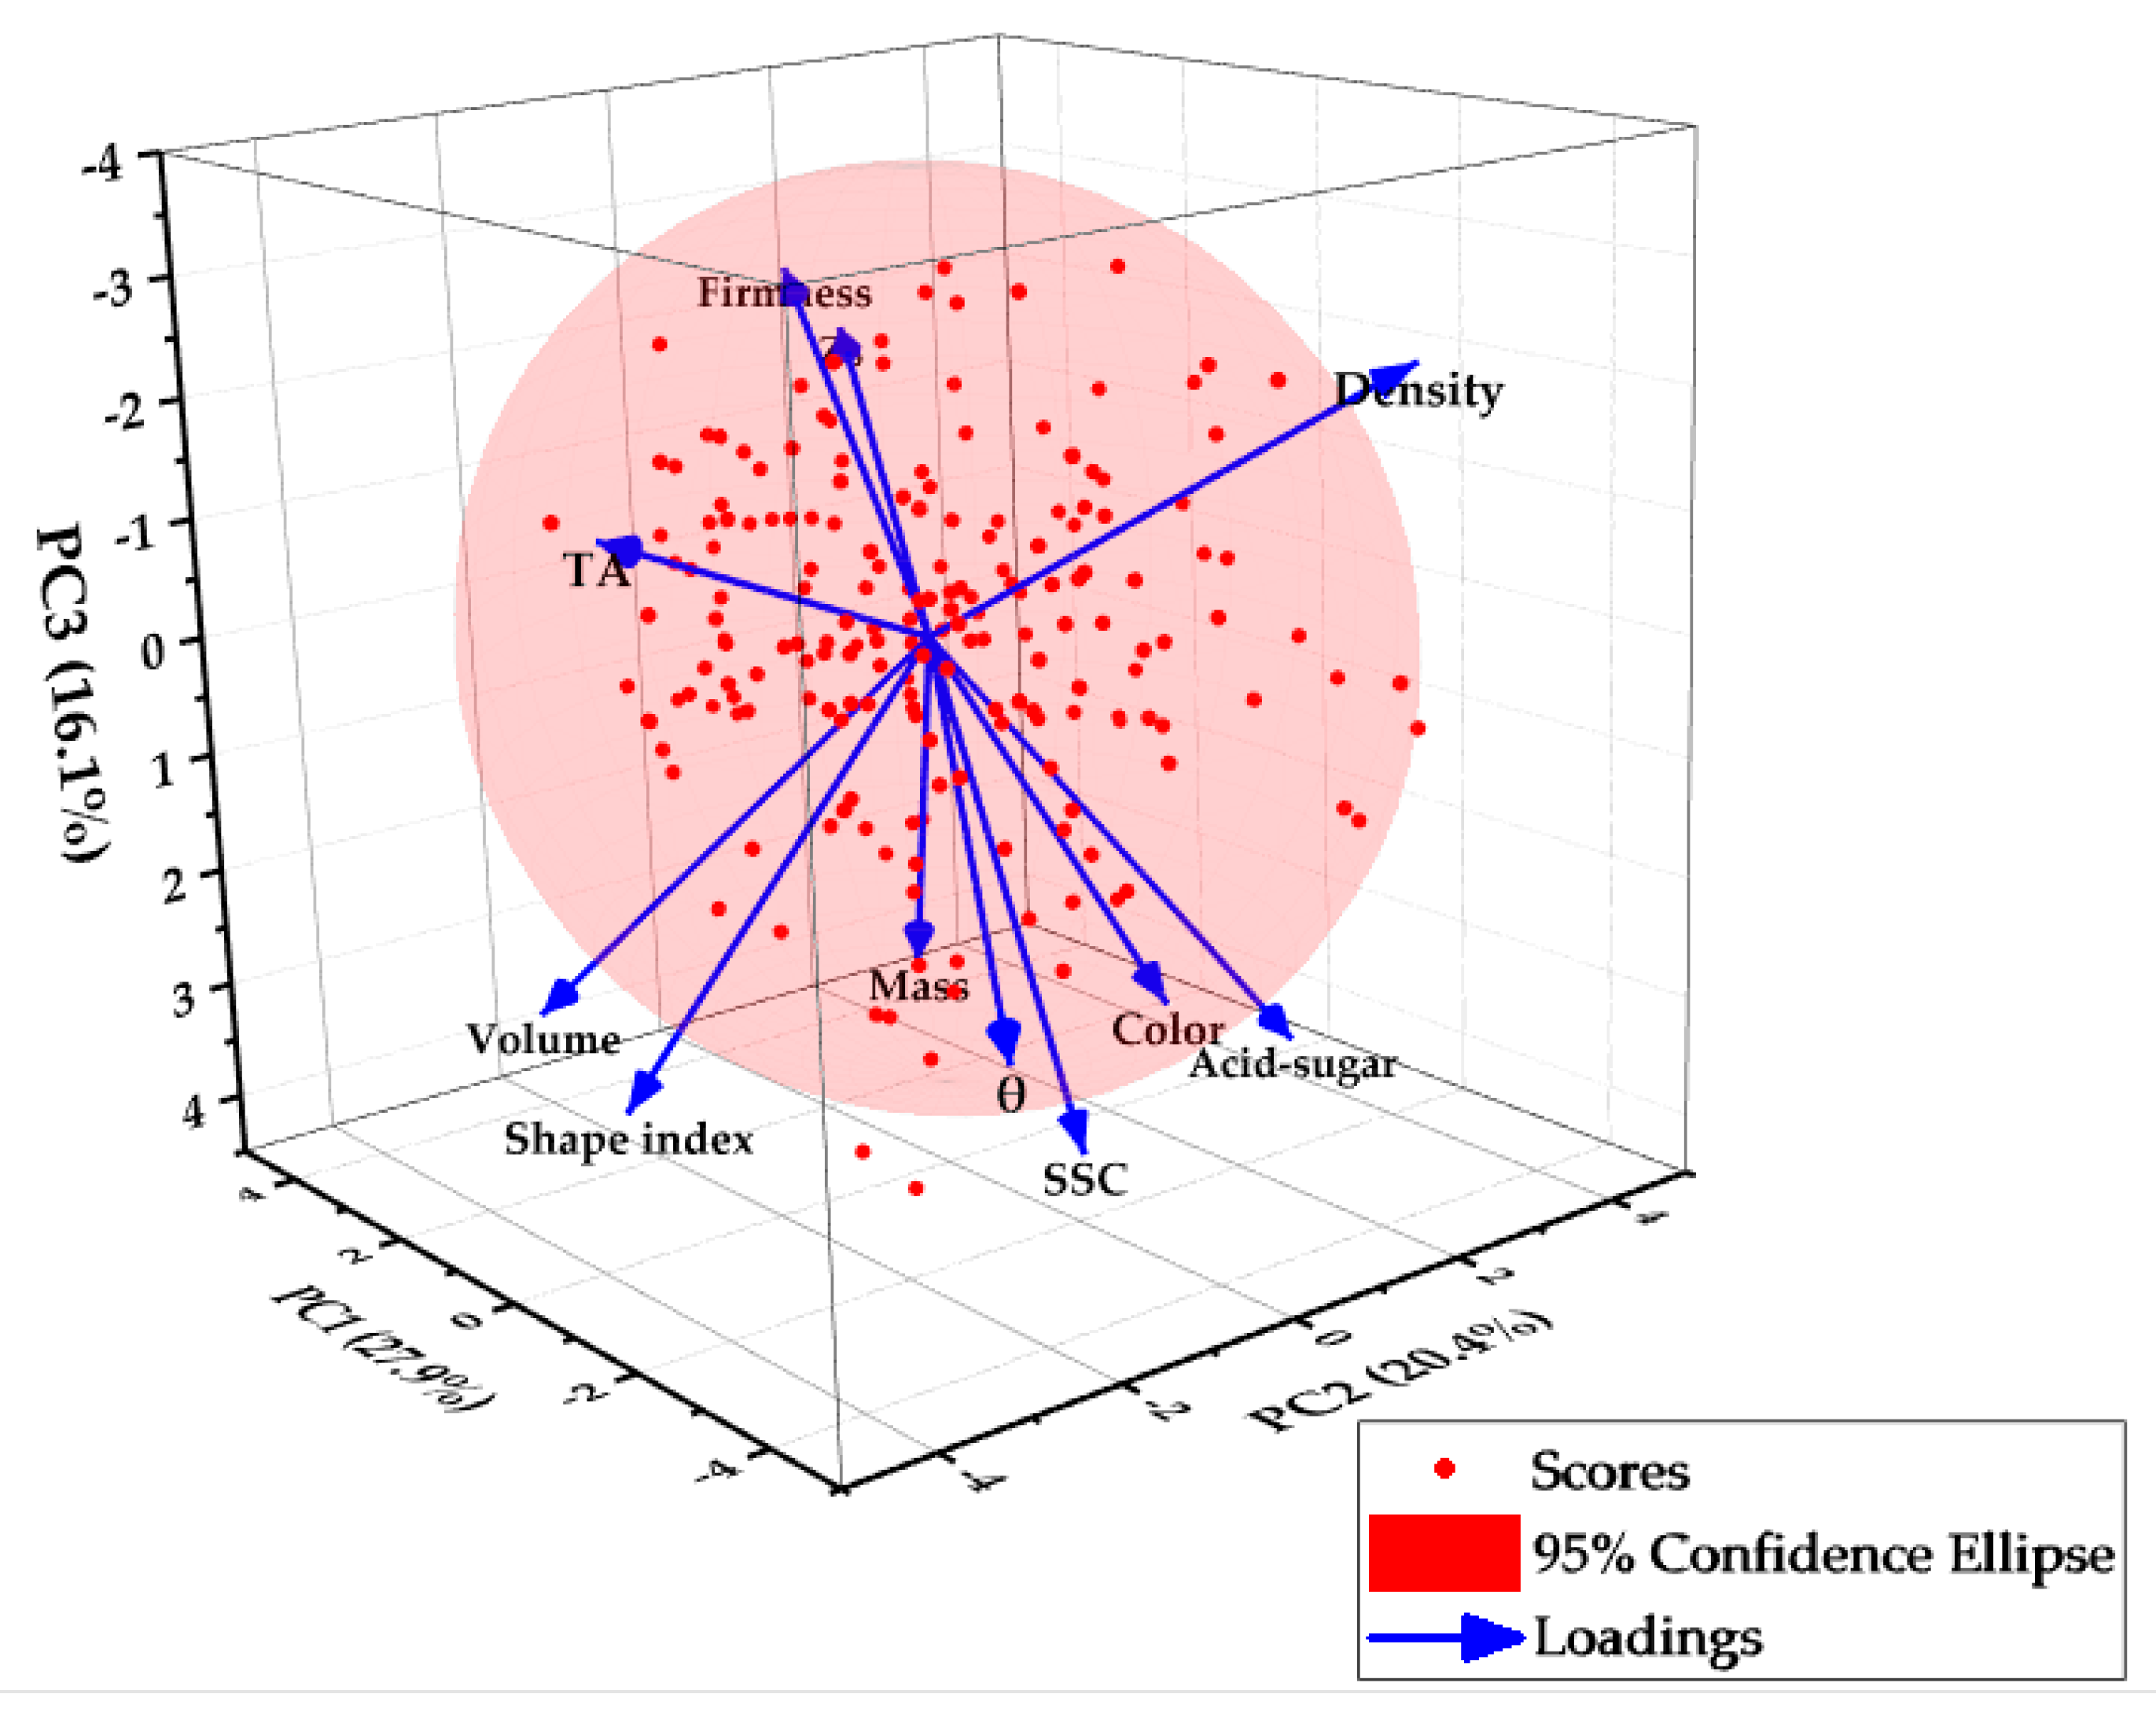
3.2. Principle Component Analysis of Indicators
3.3. Grading of Peaches by k-Means Clustering Analysis
4. Conclusions
Author Contributions
Funding
Acknowledgments
Conflicts of Interest
References
- Alipasandi, A.; Ghaffari, H.; Alibeyglu, S.Z. Classification of three varieties of peach fruit using artificial neural network assisted with image processing techniques. Int. J. Agron. Plant Prod. 2013, 4, 2179–2186. [Google Scholar]
- Fernandez, P.; Gabaldon, J.A.; Periago, M.J. Detection and quantification of Alicyclobacillus acidoterrestris by electrical impedance in apple juice. Food Microbiol. 2017, 68, 34–40. [Google Scholar] [CrossRef] [PubMed]
- Legua, P.; Hernandez, F.; Diaz-Mula, H.M.; Valero, D.; Serrano, M. Quality, Bioactive Compounds, and Antioxidant Activity of New Flat-Type Peach and Nectarine Cultivars: A Comparative Study. J. Food Sci. 2011, 76, C729–C735. [Google Scholar] [CrossRef] [PubMed]
- Gong, L.; Meng, X.; Liu, N.; Bi, J. Evaluation of apple quality based on principal component and hierarchical cluster analysis. Trans. Chin. Soc. Agric. Eng. 2014, 30, 276–285. [Google Scholar]
- Radomille de Santana, L.R.; Benedetti, B.C.; Monteiro Sigrist, J.M. Sensory profile of ‘Douradao’ peaches cold stored under controlled atmosphere. Ciencia E Tecnologia De Alimentos 2011, 31, 238–246. [Google Scholar] [CrossRef]
- Lee, D.J.; Schoenberger, R.; Archibald, J.; McCollum, S. Development of a machine vision system for automatic. date grading using digital reflective near-infrared imaging. J. Food Eng. 2008, 86, 388–398. [Google Scholar] [CrossRef]
- Nelson, S.O. Agricultural Applications of Dielectric Spectroscopy. J. Microw. Power Electromagn. Energy 2004, 39, 75–85. [Google Scholar] [CrossRef]
- Renshaw, R.C.; Dimitrakis, G.A.; Robinson, J.P.; Kingman, S.W. The relationship of dielectric response and water activity in food. J. Food Eng. 2019, 244, 80–90. [Google Scholar] [CrossRef]
- Zhang, Y.D.; Dong, Z.C.; Chen, X.Q.; Jia, W.J.; Du, S.D.; Muhammad, K.; Wang, S.H. Image based fruit category classification by 13-layer deep convolutional neural network and data augmentation. Multimed. Tools Appl. 2019, 78, 3613–3632. [Google Scholar] [CrossRef]
- Rajkumar, P.; Wang, N.; Elmasry, G.; Raghavan, G.S.V.; Gariepy, Y. Studies on banana fruit quality and maturity stages using hyperspectral imaging. J. Food Eng. 2012, 108, 194–200. [Google Scholar] [CrossRef]
- Keresztes, J.C.; Goodarzi, M.; Saeys, W. Real-time pixel based early apple bruise detection using short wave infrared hyperspectral imaging in combination with calibration and glare correction techniques. Food Control 2016, 66, 215–226. [Google Scholar] [CrossRef]
- Chong, V.K.; Nishi, T.; Kondo, N.; Ninomiya, K.; Monta, M.; Namba, K.; Zhang, Q.; Shimizu, H. Surface Gloss Measurement on Eggplant Fruit. Appl. Eng. Agric. 2008, 24, 877–883. [Google Scholar] [CrossRef]
- Soltani, M.; Alimardani, R.; Omid, M. Evaluating banana ripening status from measuring dielectric properties. J. Food Eng. 2011, 105, 625–631. [Google Scholar] [CrossRef]
- Ma, H.; Song, C.; Zhang, J.; Zhang, W.; Hu, F. Influence of Frequency of Electric Excitation Signal on Dielectric Property of Fuji Apples with Red-dot Disease. Trans. Chin. Soc. Agric. Mach. 2009, 40, 97. [Google Scholar]
- Du, G.; Tang, Y.; Guo, A.; Zhang, J. Influence of Frequency Signal on Electrical Property of Peach Fruits. Food Sci. 2013, 34, 11–15. [Google Scholar]
- Arvanitoyannis, I.S.; Tsitsika, E.V.; Panagiotaki, P. Implementation of quality control methods (physico-chemical, microbiological and sensory) in conjunction with multivariate analysis towards fish authenticity. Int. J. Food Sci. Technol. 2005, 40, 237–263. [Google Scholar] [CrossRef]
- Strydom, P.E. Quality related principles of the South African beef classification system in relation to grading and classification systems of the world. S. Afr. J. Anim. Sci. 2011, 41, 177–193. [Google Scholar] [CrossRef][Green Version]
- Birla, S.L.; Wang, S.; Tang, J.; Tiwari, G. Characterization of radio frequency heating of fresh fruits influenced by dielectric properties. J. Food Eng. 2008, 89, 390–398. [Google Scholar] [CrossRef]
- Sanaeifar, A.; Jafari, A.; Golmakani, M.T. Fusion of dielectric spectroscopy and computer vision for quality characterization of olive oil during storage. Comput. Electron. Agric. 2018, 145, 142–152. [Google Scholar] [CrossRef]
- Das, C.; Chakraborty, S.; Acharya, K.; Bera, N.K.; Chattopadhyay, D.; Karmakar, A.; Chattopadhyay, S. FT-MIR supported Electrical Impedance Spectroscopy based study of sugar adulterated honeys from different floral origin. Talanta 2017, 171, 327–334. [Google Scholar] [CrossRef]
- Lubinska-Szczygel, M.; Pudlak, D.; Dymerski, T.; Namiesnik, J. Rapid assessment of the authenticity of limequat fruit using the electronic nose and gas chromatography coupled with mass spectrometry. Mon. Chem. 2018, 149, 1605–1614. [Google Scholar] [CrossRef]
- Wang, X.; Matetic, M.; Zhou, H.J.; Zhang, X.S.; Jemric, T. Postharvest Quality Monitoring and Variance Analysis of Peach and Nectarine Cold Chain with Multi-Sensors Technology. Appl. Sci.-Basel 2017, 7, 13. [Google Scholar]
- Zhang, H.; Han, T.; Wang, Y.; Li, L. Selection of factors for evaluating peach (Prunus persica) fruit quality. Trans. Chin. Soc. Agric. Eng. 2006, 22, 235–239. [Google Scholar]
- Zhu, N.; Lin, M.H.; Nie, Y.T.; Wu, D.; Chen, K.S. Study on the quantitative measurement of firmness distribution maps at the pixel level inside peach pulp. Comput. Electron. Agric. 2016, 130, 48–56. [Google Scholar] [CrossRef]
- Sharma, G.; Wu, W.C.; Daa, E.N. The CIEDE2000 color-difference formula: Implementation notes, supplementary test data, and mathematical observations. Color Res. Appl. 2005, 30, 21–30. [Google Scholar] [CrossRef]
- Agnihotry, A.; Gill, K.S.; Singhal, D.; Fedorowicz, Z.; Dash, S.; Pedrazzi, V. A comparison of the bleaching effectiveness of chlorine dioxide and hydrogen peroxide on dental composite. Braz. Dent. J. 2014, 25, 524–527. [Google Scholar] [CrossRef]
- Gasic, K.; Reighard, G.L.; Windham, J.; Ognjanov, M. Relationship between fruit maturity at harvest and fruit quality in peach. Acta Hortic. 2015, 1084, 643–648. [Google Scholar] [CrossRef]
- Guo, W.; Zhu, X.; Guo, K.; Wang, Z. Electrical Properties of Peaches and Its Application in Sensing Freshness. Trans. Chin. Soc. Agric. Mach. 2007, 38, 112–115. [Google Scholar]
- Lombardo, R.; Rubino, T.; Cammalleri, M. Dielectric Characterization of Fruit Nectars at Low RF Frequencies. Int. J. Food Prop. 2015, 18, 2312–2326. [Google Scholar] [CrossRef]
- Guo, W.; Hen, K. Relationship between Dielectric Properties from 10 to 4500MHz and Internal Quality of Peaches. Trans. Chin. Soc. Agric. Mach. 2010, 41, 134–138. [Google Scholar]
- Zhang, G.X.; Huang, X.Y.; Fu, Z.T.; Jilani, M.T.; Luo, H.L.; Li, X.X. Correlation between physical properties and freshness of chilled mutton in China. J. Food Process. Preserv. 2019, 43, 9. [Google Scholar] [CrossRef]
- Meng, Y.; Zhang, Y.; Wang, X.; Wei, L.; Ma, Y.; Deng, H.; Guo, Y. Establishing comprehensive evalution system of American No.8 fresh apples based on principal component analysis. Sci. Technol. Food Ind. 2015, 36, 296–300. [Google Scholar]
- Shang, L.; Gu, J.; Guo, W. Non-destructively detecting sugar content of nectarines based on dielectric properties and ANN. Trans. Chin. Soc. Agric. Eng. 2013, 29, 257–264. [Google Scholar]
- Fu, Z.T.; Zhao, S.; Zhang, X.S.; Polovka, M.; Wang, X. Quality Characteristics Analysis and Remaining Shelf Life Prediction of Fresh Tibetan Tricholoma matsutake under Modified Atmosphere Packaging in Cold Chain. Foods 2019, 8, 14. [Google Scholar] [CrossRef]

| Correlation Matrix | ||||||||||||
|---|---|---|---|---|---|---|---|---|---|---|---|---|
| Correlation | ZX1 | ZX2 | ZX3 | ZX4 | ZX5 | ZX6 | ZX7 | ZX8 | ZX9 | ZX10 | ZX11 | |
| Shape index | ZX1 | 1.000 | ||||||||||
| Volume | ZX2 | 0.477 | 1.000 | |||||||||
| Mass | ZX3 | −0.027 | 0.486 | 1.000 | ||||||||
| Density | ZX4 | −0.545 | −0.869 | 0.006 | 1.000 | |||||||
| Firmness | ZX5 | 0.040 | 0.270 | 0.068 | −0.274 | 1.000 | ||||||
| Color | ZX6 | −0.019 | −0.108 | 0.074 | 0.166 | −0.136 | 1.000 | |||||
| Zs | ZX7 | 0.079 | 0.250 | 0.085 | −0.235 | 0.752 | −0.092 | 1.000 | ||||
| θ | ZX8 | 0.050 | −0.217 | −0.131 | 0.173 | −0.746 | 0.035 | −0.812 | 1.000 | |||
| SSC | ZX9 | 0.158 | −0.061 | 0.089 | 0.124 | −0.106 | 0.262 | −0.077 | 0.072 | 1.000 | ||
| TA | ZX10 | 0.139 | 0.040 | −0.106 | −0.106 | −0.083 | −0.135 | −0.200 | 0.145 | 0.232 | 1.000 | |
| Acid–sugar ratio | ZX11 | −0.029 | −0.092 | 0.151 | 0.194 | −0.018 | 0.287 | 0.121 | −0.073 | 0.460 | −0.744 | 1.000 |
| Component | Initial Eigenvalues | ||
|---|---|---|---|
| Total | % of Variance | Cumulative % | |
| 1 | 3.064 | 27.9 | 27.9 |
| 2 | 2.241 | 20.4 | 48.3 |
| 3 | 1.776 | 16.1 | 64.4 |
| 4 | 1.206 | 11.0 | 75.4 |
| 5 | 1.058 | 9.6 | 85.0 |
| 6 | 0.777 | 7.1 | 92.1 |
| 7 | 0.438 | 4.0 | 96.1 |
| 8 | 0.258 | 2.3 | 98.4 |
| 9 | 0.170 | 1.5 | 99.9 |
| 10 | 0.010 | 0.090 | 100.0 |
| 11 | 0.002 | 0.016 | 100.0 |
| Component | |||||
|---|---|---|---|---|---|
| 1 | 2 | 3 | 4 | 5 | |
| ZX1 | 0.354 | −0.441 | 0.508 | 0.145 | −0.405 |
| ZX2 | 0.723 | −0.387 | 0.463 | −0.231 | 0.175 |
| ZX3 | 0.256 | 0.131 | 0.408 | −0.248 | 0.803 |
| ZX4 | −0.681 | 0.516 | −0.294 | 0.129 | 0.245 |
| ZX5 | 0.785 | 0.267 | −0.303 | 0.213 | 0.002 |
| ZX6 | −0.209 | 0.336 | 0.417 | 0.244 | 0.053 |
| ZX7 | 0.791 | 0.391 | −0.224 | 0.187 | −0.063 |
| ZX8 | −0.750 | −0.415 | 0.280 | −0.226 | −0.086 |
| ZX9 | −0.168 | 0.173 | 0.567 | 0.701 | 0.067 |
| ZX10 | −0.088 | −0.706 | −0.187 | 0.604 | 0.299 |
| ZX11 | −0.051 | 0.759 | 0.547 | −0.080 | −0.228 |
| Cluster | |||||
|---|---|---|---|---|---|
| 1 | 2 | 3 | 4 | 5 | |
| ZX1 | 0.227 | 0.756 | −0.715 | −0.883 | 0.362 |
| ZX2 | 0.773 | 0.408 | −0.650 | −0.972 | 0.360 |
| ZX3 | 0.401 | 0.237 | −0.283 | −0.098 | −0.267 |
| ZX4 | −0.645 | −0.346 | 0.550 | 10.039 | −0.550 |
| ZX5 | 0.947 | −0.724 | 0.812 | −0.834 | −0.317 |
| ZX6 | −0.358 | 0.586 | 0.677 | −0.056 | −0.346 |
| ZX7 | 1.068 | −0.724 | 0.942 | −0.918 | −0.373 |
| ZX8 | −0.993 | 0.918 | −1.103 | 0.793 | 0.301 |
| ZX9 | −0.310 | 0.668 | 0.316 | −0.066 | −0.370 |
| ZX10 | −0.149 | −0.116 | −0.548 | −0.002 | 0.914 |
| ZX11 | −0.127 | 0.472 | 0.688 | −0.041 | −0.976 |
| Clustering Center | Number of Samples | Average Comprehensive Score | Red Area on the Surface | Number of Samples | Average Comprehensive Score | |
|---|---|---|---|---|---|---|
| Cluster | 1 | 47 (24.7%) | 1.019 | 25%–50% | 3 (1.6%) | 0.327 |
| 2 | 36 (19%) | −0.149 | 50%–70% | 37 (19.4%) | −0.082 | |
| 3 | 27 (14.2%) | 0.809 | 70%–80% | 64 (33.7%) | −0.174 | |
| 4 | 41 (21.6%) | −1.072 | 80%–90% | 56 (29.5%) | 0.163 | |
| 5 | 39 (20.5%) | −0.566 | 90%–100% | 30 (15.8%) | −0.575 | |
| Valid | 190 (100%) | 190 (100%) | ||||
| Missing | 0 (0%) | 0 (0%) | ||||
© 2020 by the authors. Licensee MDPI, Basel, Switzerland. This article is an open access article distributed under the terms and conditions of the Creative Commons Attribution (CC BY) license (http://creativecommons.org/licenses/by/4.0/).
Share and Cite
Zhang, G.; Fu, Q.; Fu, Z.; Li, X.; Matetić, M.; Brkic Bakaric, M.; Jemrić, T. A Comprehensive Peach Fruit Quality Evaluation Method for Grading and Consumption. Appl. Sci. 2020, 10, 1348. https://doi.org/10.3390/app10041348
Zhang G, Fu Q, Fu Z, Li X, Matetić M, Brkic Bakaric M, Jemrić T. A Comprehensive Peach Fruit Quality Evaluation Method for Grading and Consumption. Applied Sciences. 2020; 10(4):1348. https://doi.org/10.3390/app10041348
Chicago/Turabian StyleZhang, Guoxiang, Qiqi Fu, Zetian Fu, Xinxing Li, Maja Matetić, Marija Brkic Bakaric, and Tomislav Jemrić. 2020. "A Comprehensive Peach Fruit Quality Evaluation Method for Grading and Consumption" Applied Sciences 10, no. 4: 1348. https://doi.org/10.3390/app10041348
APA StyleZhang, G., Fu, Q., Fu, Z., Li, X., Matetić, M., Brkic Bakaric, M., & Jemrić, T. (2020). A Comprehensive Peach Fruit Quality Evaluation Method for Grading and Consumption. Applied Sciences, 10(4), 1348. https://doi.org/10.3390/app10041348


