Featured Application
Erosion protection in the Marine piping system of polar ships.
Abstract
Under the erosion of seawater–ice two-phase flow, seawater in pipelines of polar ships can cause the pipeline failures that threaten the safety of navigations. The discrete phase model (DPM) and erosion wear model (EWM) were established by using the computational fluid dynamics (CFD) method for numerical analysis of the 90° elbow with relatively severe erosion. This paper explores the erosion effect of pipelines under different conditions and puts forward optimal measures for pipeline protection. Compared with the existing multiphase flow research, the novelty of this study is that vibration conditions are considered and parameters such as two-phase flow velocity, ice packing factor (IPF), ice particle diameter and ice particle rotation characteristics are combined with vibration conditions. Combined with the comprehensive analysis of erosion effects of static pipelines, a general law of seawater pipeline wear under vibration is obtained. The results show that pipeline wear under vibration is more serious than under static conditions. Under static conditions, the wear of the same section in the pipeline increases with the increases of two-phase flow velocity and IPF. However, under vibration conditions, when the velocity is less than 3 m/s, the wear of the pipeline has no significant change, while when the velocity is over 3 m/s, the wear rate increases significantly. The particle diameter has little effect on the wear of static pipes, but under the vibration condition, the pipe wear rate decreases with the increase of particle diameter, and it starts to stabilize when the diameter exceeds 0.3 mm. If the rotation characteristics of ice particles are taken into account, the wear rate along the pipeline is significantly higher than that without particle rotation.
1. Introduction
Marine pipelines carry fluids for different mechanical equipment. Seawater is an important cooling medium [1] for power systems, and it enters marine pipelines through subsea valves [2]. The flowing seawater erodes the pipeline at different levels, which is one of the main reasons for the failure of the pipe fittings [3]. In serious cases, the main and auxiliary engines in the power system cannot be cooled, threatening the safe navigation of the ship [4]. In addition, unlike low-latitude single-phase seawater, there is a large amount of sea ice floating in polar seas [5]. When a ship breaks through the ice, fine ice slag and ice debris can pass through the filter and enter the seawater pipeline, forming a two-phase flow of seawater–ice in the pipe, and the presence of particles will increase the erosion and wear of the pipeline [6]. At present, pipeline erosion exists in many fields such as petroleum, building materials, energy, shipbuilding, metallurgy, etc., and is a form of local corrosion that can cause great damage [7]. There have been many studies on pipeline erosion, but most of them assume static working conditions. However, for a ship in operation, the impact of ramming during ice breaking, high-load operation of the power system; fluid pulsation in the pipe; and other factors will also cause low-frequency vibration of the pipe [8]. Vibration may change the movement trajectory of particles in the pipe and the impact strength of particles on the pipe wall, thus affecting the degree of abrasion of the pipeline [9]. In addition, due to layout constraints, 90° elbows are common in ship pipelines [10]. During the transport of fluid media, the fluid experiences sudden changes in flow direction at the corners. The direct erosion of the pipe wall by the particles in the pipe due to inertial force and secondary flow cause erosion at corners to be dozens of times more severe than that of straight pipes [11]. Therefore, it is highly necessary to study the abrasion of elbows under vibration.
At present, the erosion of pipelines by multiphase flow is a difficult problem and a hotspot in research [12], especially pipeline wear caused by solid–liquid two-phase flow [13]. The research methods mainly include experimental tests and computational fluid dynamics (CFD) simulation [14]. Through a large number of experiments and repeated observations, early scholars found that when solid particle mixed fluid flowed in the pipe, it had an erosion effect on the wall [15]. Thus, many theoretical foundations were gradually formed to provide reference for future research, such as the micro-cutting theory proposed by Finnic [16], the deformation and wear theory used by Bitter [17,18], the secondary erosion theory mentioned by Tilly [11], and the forging extrusion theory proposed by Robert [19], which proposed to resolve the deficiencies of the micro-cutting theory. These theoretical studies revealed the basic law of two-phase flow erosion wear. Later, Finnie and Kabil also found that the degree of wear of the pipeline was related to the impact angle of the solid particles and the flow velocity of the fluid [20]. Kaimal and Devanathan [21] studied the erosion effect of two-phase flow on pipes at 90° elbows and found that the degree of wear was not only related to the flow velocity, but also to the solid particle concentration. In addition, Tilly found that the erosion effect of particles on the pipe wall at the elbow was much greater than that of the straight pipe [11]. Later, Blanchard and others tested the wear process of the 90° elbow, predicted the wear size, and determined the maximum wear position, but did not consider the effect of secondary flow; thus, the experimental results were limited.
With the continuous progress of computer science and the rise of fluid simulation technology, the CFD numerical simulation method [22] is increasingly favored by scholars. Moreover, numerical simulation can reduce the experimental cost and overcome the limitations of experimental methods [23], and is widely used in the field of modern engineering technology. Related achievements include use of the k–epsilon turbulence model by Nie [24], who numerically simulated the erosion of two-phase flow in a straight pipe and developed the rule of particle–wall interaction under turbulent conditions. Wallace [25] simulated the effect of sand particles on fluids during oil and gas production based on CFD technology and provided a solution for valve manufacturers to reduce the sensitivity of particle corrosion. In addition, Sen [26] used the CFD method, coupling discrete element model (DEM), population balance model (PBM), etc., to study the impact of particle collision frequency and particle velocity on the erosion of the pipeline, which enriched the research on pipeline erosion problems using Numerical simulation methods. In order to further explore the influence of pipe diameter and solid particle diameter on the erosion of pipes, Kriebitzsch [27] proposed a baseline model suitable for adiabatic bubbles; Nguyen [28] found that there was a sudden change in particle size; as the particle size increased, the wear rate decreased. Karimi et al. [29], in their analysis of the corrosion of oil and gas pipelines, pointed out that small particles can cause more severe erosion of pipelines. In terms of model selection, Zhou [30] compared the advantages and disadvantages of the Euler model and the Lagrangian model; Guher [31] compared and analyzed the Lagrangian method and the Euler solution of the Euler equation. Recently, Lain and Sommerfeld [32] also predicted the erosion depth of the pipe elbow after being impacted by particles, taking into account the particle rotation characteristics under static conditions; however, they did not consider the influence of vibration conditions; Marrah [33] and Jashanpreet [34] combined the CFD method and k–epsilon and k–omega models to study the influence of pipeline particle size, pipe diameter, flow rate, carrier viscosity, impact surface materials and other potential factors on pipeline erosion characteristics. Unfortunately, none of their studies considered the effects of vibration conditions. Although Xu et al. [35] studied the wear characteristics of seawater pipes at different vibration frequencies and vibration ranges, they did not study coupling factors such as particle size and particle rotation. Therefore, it is necessary to continue to study the influence of different potential factors on pipeline erosion when coupled with vibration. In this study, the seawater pipeline of polar ships was selected as the research object, and the effects of solid particles and vibration conditions were taken into account. The DPM discrete model and erosion wear model were used for the numerical analysis of pipeline erosion, where the amplitude and vibration frequency were set in the range of 0.5–1.5 mm and 0–80 Hz, respectively [36]. Factors such as sea ice particle diameter, two-phase flow velocity, particle rotation characteristics and ice packing factor (IPF) were coupled with the natural vibration of the ship’s hull. The wear of the pipeline under static conditions was compared, and the erosion law of the seawater pipeline was analyzed. Finally, the optimal measures for pipeline vibration protection were proposed.
2. Materials and Methods
By taking the interaction between ice particles and seawater into consideration, the movement trajectory of ice particles can be better simulated. In this work, the Euler–Lagrangian model was selected [30], and seawater was treated as a continuous phase, while sea ice particles were regarded as discrete phases, and a two-phase flow solution composed of sea ice and seawater in a pipeline was regarded as an incompressible Newtonian fluid [37].
2.1. Continuity Equation and Navier–Stokes Equation
In this study, the heat exchange capacity was very small; therefore, the influence of the energy equation on the research results was ignored. The conservation equations of mass and momentum in a fluid medium are as follows:
where is the volume fraction of each phase (seawater and ice particles), is the velocity of each phase in m/s, is the density of each phase in kg/m3, is the Laplace operator and i = l and i = s refer to seawater and ice particles, respectively. The Navier–Stokes (n–s) equation of viscous incompressible seawater [30] is as follows:
where is acceleration of gravity in m/s2, is the shear stress of the seawater in Pa, is the static pressure of the seawater in Pa, is the interphase force between ice and seawater phases in kg/m·s2, is shear viscosity in kg/m·s, is seawater viscosity in kg/m·s and is unit tensor.
2.2. Discrete Phase Model
The Euler–Lagrangian model is a classical model that treats particles as discrete phases [31]. Assuming that the motion of sea ice particles follows Newton’s second law [38], the equation of particle motion can be written as follows:
where is the acceleration of gravity in m/s2, is the ice particle diameter in mm, and are the velocity of the seawater and the velocity of ice particles in m/s, respectively, is the dimensionless drag coefficient, is the relative Reynolds number of ice particles and and are the density of ice particles and seawater in kg/m3, respectively. The mathematical expression of the drag force coefficient [39] () is
With simplified calculation, the equation of drag force was obtained as follows:
2.3. Wall Collision Recovery Equation
Particle impacts on the wall of the pipeline are accompanied by energy transfer and loss, resulting in the particle rebound velocity being less than the incident impact velocity [30]. When the particles bounce back from the collision with the wall, the particle velocity can be decomposed into normal and tangential vectors. If the ratio of the velocities in the two decomposition directions is defined as the rebound recovery coefficient, the magnitude of the rebound recovery coefficient is closely related to the properties of the seawater, the properties of the ice particles, the impact angle and the properties of the wall materials. Thus, the relationship between the velocities before and after the collision is written as
The rebound coefficient equation adopts the empirical equation obtained through experiments of Tabakoff [38], who studied the two-phase flow problem. The specific expression is as follows:
where the subscripts and represent the normal and tangential directions of decomposition, respectively, and are the normal velocity of ice particles before and after impact, respectively, in m/s, and are the tangential velocity of ice particles before and after impact, respectively, in m/s and is the angle of impact of ice particles in degrees.
2.4. Erosion Models
This paper studies the flow of seawater–ice two-phase flow in a 90° elbow. It is assumed that ice particles are regular, hard spherical particles with volume fractions within 10%. The abrasion model proposed by Huster has strong adaptability [40], so the model is applied to the vibration pipeline to complete the numerical calculation. The model expression is written as follows:
where is wall wear rate in kg/(m2·s), is the mass flow rate of injected flow field particles in kg/s, is the impact angle function, is ice particle velocity in m/s, is a function of velocity with the experience value of 2.41, is the pipe wall area in m2, is the particle size function, is the number of ice particles that hit the wall and is the angle of impact of the particles in degrees. The schematic diagram of pipeline wall erosion and wear are shown in Figure 1.
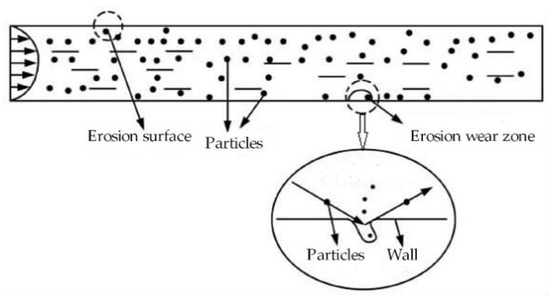
Figure 1.
Schematic diagram of pipeline wall erosion and wear.
2.5. Equation of Wall Vibration and Particle Rotation
The vibrations of ships’ seawater pipes are very complicated. On one hand, the switching of pumps, valves, etc., cause the fluid pulsation inside the pipe to cause vibration. On the other hand, the shaking of the hull caused by impact can also cause pipe vibration. In this paper, the vibration studied is simplified to periodic sinusoidal motion. The vibration equation of the circular pipe is defined as . From the law of simple harmonic motion, the displacement, velocity and acceleration of the circular pipe during vibration are written, respectively, as follows:
where is the initial phase angle of the sinusoidal vibration and is set as 0. The mathematical model diagram of sinusoidal vibration is shown in Figure 2.
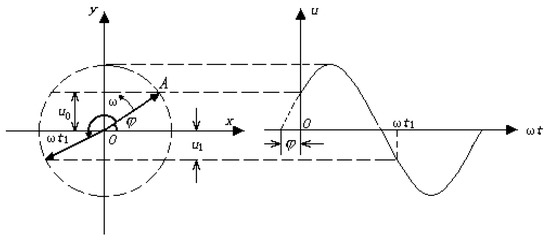
Figure 2.
The mathematical model diagram of sinusoidal vibration.
The process of particles hitting the wall is very complicated, and a simplified treatment method is adopted to establish the relevant impact model (Figure 3). At present, the highly recognized model is the drag force equation of rotating particles proposed by Dennis [41]. In this study, this model is introduced under the vibration condition. The lift force of particle rotation is obtained as follows:
where is the moment of inertia of ice particles in kg·m2, is ice particle velocity in m/s, is viscosity of seawater and is a constant coefficient associated with the Reynolds number. For spherical particles, the equation of inertial force in the flow process is as follows:
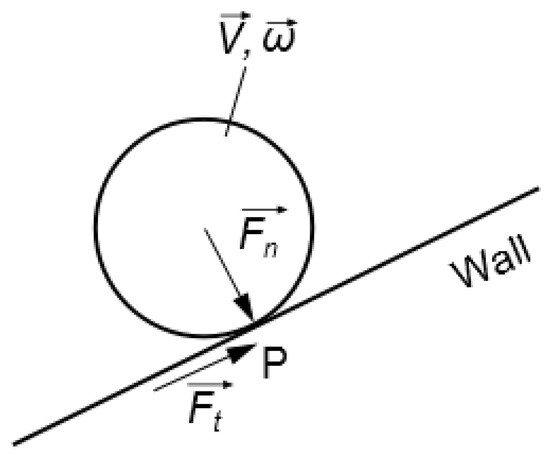
Figure 3.
Rotation diagram of particle collision wall.
3. Physical Model and Parameter Settings
3.1. The Physical Model
According to the design specification for the seawater piping of polar ships [42], the carbon steel seawater pipe DN100 was selected as the research object. The physical model was created using the following parameters: D = 114 mm, radius of curvature of 90° elbow R = 1.5 d and the flow direction was Horizontal–Horizontal (H–H). The gravity was 9.8 m/s2 along the negative direction of the y-axis. In order to reduce the inlet effect of the pipe and ensure the full development of inlet and outlet fluids, the lengths of inlet and outlet pipes were set as 30D and 20D, respectively.
The meshing of the 90° elbow and the global geometric model of the pipe are shown in Figure 4 and Figure 5, respectively. With the help of ICEM software, hexahedral structured mesh was adopted to divide the whole block. Next to the wall of the pipeline, the structured boundary layer grid was divided by setting nodes, where the number of nodes was set to 21, the first percent of the cell height of the first layer was 10%, and the growth factor was 1.3. Then, the structured grid was transformed into an unstructured grid and imported into ANSYS Fluent software to set the solver [32].
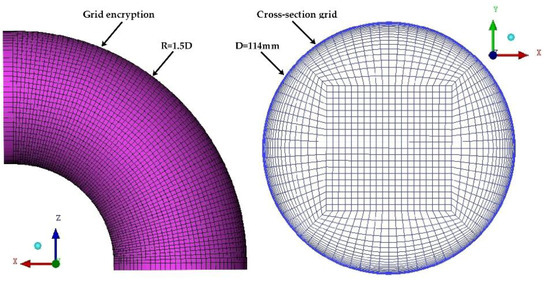
Figure 4.
The meshing of the 90° elbow.

Figure 5.
The global geometric model of the pipe.
3.2. Parameter Settings
In this study, the relevant parameters of polar seawater and sea ice were based on the Arctic field navigation in 2013–2015 provided by ‘Yong-Sheng’ ships [42]. The salinity of seawater was set at 3.5 wt.%. Relevant parameters of sea ice and seawater at standard atmospheric pressure are shown in Table 1.

Table 1.
Related parameters of two-phase flow.
3.3. Vibration and Boundary Conditions
The emphasis of this paper is on the wear of pipes by the coupling of particles and vibrations. Previous studies have been made on the wear of seawater pipes by different vibration frequencies and amplitudes [35]. This paper analyzes the effects of different velocities, particle diameters and rotational characteristics on pipeline wear under the same vibration levels. In terms of initial boundary conditions, when seawater and ice particles are mixed and pumped into seawater pipes by centrifugal pumps, the velocities of ice particles at the inlet are the same as that of seawater, so the initial velocities of solid and liquid phases are the same. The particles are assumed to be homogeneous spherical particles with no-slip on the pipe wall. The boundary condition settings in FLUENT are shown in Table 2.

Table 2.
Initial boundary conditions in FLUENT.
In order to ensure the reliability of the simulation process, the control variable method was used to set the parameters of each physical property. When the vibration was coupled with other factors, the vibration condition was set as f = 40 Hz and A = 1 mm (the results of Sun’s study [35] on the influence of vibration amplitude and vibration frequency on pipeline wear were taken into consideration). The specific parameter values are shown in Table 3.

Table 3.
Values of different vibration conditions.
4. Results and Discussion
4.1. Effects of Flow Velocity
The effects of velocity change on pressure drop in the static state and vibration state were explored under the H–H direction velocity. The simulation results showed that the pressure drop in the straight pipe increased proportionally with the flow velocity, which was consistent with those of Safaei’s study [43]. After further analysis, it was found that when the inertial force of the particle was much less than the buoyancy force at the velocity of 1 m/s, the particles floated on the top of the pipe and flowed in layers (Figure 6A). Once vibration was introduced, the pressure drop curve significantly changed when the velocity was over 3 m/s. By comparing the variation of wear rate with and without vibration, it could be determined that the pipeline vibration played a major role in flow resistance within the velocity range of 0–3 m/s, while the velocity began to play a major role once velocity exceeded 3 m/s. At the same flow rate, the pressure drop under vibration was always greater than that of the static pipe. In the static state, the abrasion increased with the increase of velocity when the speed was less than 3 m/s. The growth rate of abrasion was not high, possibly because at this point, ice particles had poor follow ability, and buoyancy played a major role. The accumulation of ice particles on the top of the pipe could affect wear on the top of the pipe. As the flow continued to increase, the ice particles pulled by the water were strongly pulled into the flow and gradually formed a mixed and even suspension. The greater the flow velocity, the greater the direct impact strength on the outer wall of the pipe and the higher the wear rate (Figure 6B). Then, the relationship between the curve of maximum wear rate at different angle sections of the 90° elbow with flow rate was further explored. At the same angular section, the wear rate increased with the increase of the flow rate. It increased slowly at velocities under 3 m/s and began to increase significantly after exceeding 3 m/s (Figure 6C). Moreover, after exceeding 3 m/s, the wear rates of 30° and 90° sections at the same velocity were higher than those of other angular sections. Combined with Figure 6B, C, it can be seen that, within a certain velocity range (1–3 m/s), the wear of the bend was relatively low, and vibration was the main factor that affected the erosion of the wall of the pipe by sea ice particles. When the velocity of flow exceeded this range, the inertia of sea ice particles increased, gradually overcoming the floating lift and vibration rebound force, and the impact cutting amount on the pipe increased, and the abrasion increased accordingly. The 30° cross-section and 90° cross-section were affected by the direct impact of ice particles and the effect on secondary flow, respectively, leading to these two sections having the most serious wear and tear.

Figure 6.
The effects of flow velocity on pressure drop (A) and the maximum wear rate (B,C).
Particles at a velocity of 1 m/s had very disordered trajectories under the influence of vibration in the pipeline and collided back and forth with the wall surface, resulting in a large wear rate at this velocity (Figure 7). With the increase in velocity, as the ice crystals were subjected to the drag of the seawater, the particle flowability gradually increased, and the particle trajectory gradually coincided with the streamline. When the velocity reached 3 m/s or above, the inertia force of the ice particles increased, the strength acting on the wall increased, and the abrasion increased correspondingly. By comparison with the static state, it was found that the particle movement trajectory under the action of vibration was firstly disordered and then tended to become stable, but the particle trajectory was still in an unstable state at the 90° elbow. The trajectory of particles inside the static pipe was always smooth, and there was a particle isolation zone inside the elbow.
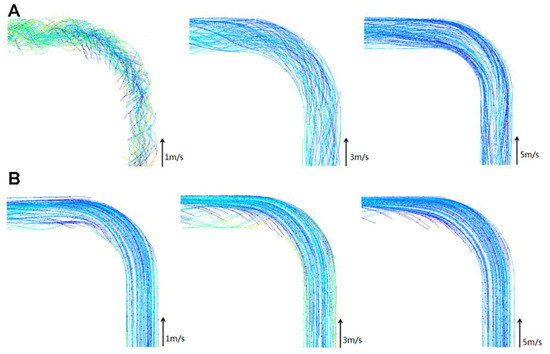
Figure 7.
The trajectory of particles at the elbow: (A) represents static state and (B) represents vibration.
4.2. Pressure Drop and Wear Rate of IPF Coupled Vibration
The effects of IPF on pressure drop and wear rate were investigated at the flow rate of 3 m/s. The results showed that the pressure drop in the straight pipe segment hardly changed with IPF at the static state (Figure 8A). However, after the vibration was applied, the pressure drop increased with the increase of IPF. Compared with the non-vibration of the same IPF, the pressure drop with vibration coupling was always greater than that with the static pipe, which indicated that both vibration and IPF affected the pressure drop. The relationship between the curve of maximum wear rate and IPF was also explored. In the static state, the maximum wear rate was proportional to IPF along the path, and the maximum erosion rate increased gradually with the increase of particle flow (Figure 8B). However, after the vibration was applied, the change rate of the maximum wear rate increased greatly when the IPF was more than 8%, and the vibration condition was always greater than the corresponding static condition. This indicated that the vibration increased the flow resistance of the pipe. At the same angle section, the maximum wear rate increased with the increase of IPF, and the growth trend was similar (Figure 8C). At the same IPF, the maximum wear rate between different angles was not significantly different, indicating that the wear distribution was relatively uniform. With the increase of IPF, the ice crystals’ flowability began to decline, and collisions between ice particles resulted in energy loss, resulting in a decrease in the frequency and intensity of interactions between particles and wall surfaces. However, the vibration acting on the particle reduced the carrying effect of the fluid, and the collision with the wall surface was more pronounced. The larger the IPF, the more significant the effect of vibration.

Figure 8.
The effect of IPF on pressure drop (A), and maximum wear rate at each angle section of elbow (B,C).
4.3. Effect of Particle Diameter
The pressure drop of the straight pipe hardly varied with the particle diameter at the static state (Figure 9A). After vibration, the pressure drop decreased with the increase of particle diameter, showing a nonlinear relationship. The analysis led to the following reasons for this phenomenon: the smaller the particle diameter, the more particles entered the flow field under the same IPF conditions, and the disturbance was larger after particles were subjected to vibration, resulting in more chaotic movement. Combined with Figure 8, it can be seen that vibration was the main reason for the increase of pressure drop, and vibration increased the flow resistance. For small particles (0.1–0.3 mm), the 0° and 90° section wear rates were relatively high. The vibration led to irregular rebound of small particles in the straight section, and the secondary flow played a significant role; the large number of particles and frequent impacts led to serious wear in straight pipe segment (Figure 9B). For large diameter particles (0.3–1.0 mm), the effect of vibration and secondary flow on the particles on the inertial force was greatly reduced, resulting in uniform wear distribution at the pipe elbow and small differences in the maximum wear rate (Figure 9B). In summary, the trajectory of large particles was controlled by equilibrium forces with the increase of particle diameter to a critical value. The variation trend of the maximum wear rate at each angle section was the same as that along the path (Figure 9B,C). The vibration action was dominant when the particle size was within the range of 0.1–0.3 mm. Particles collided with the side wall of the straight pipe frequently, and the abrasion rate was relatively high at the 0° and 90° sections. Once the particle size exceeded 0.3 mm, the inertia force, buoyancy force and vibration at the elbow reached a balance, and the influence of secondary flow was weakened, resulting in uniform abrasion distribution at the elbow, and the wear rate at the cross section of 90° was not as large as that at the cross section of the small angle.

Figure 9.
The effect of particle diameter on pressure drop (A) and maximum wear rate (B,C) at different cross-sections.
4.4. The Effect of Particle Rotation Factor
The velocity distribution was more uniform, and the wear was more dispersed due to the effect of vibration without considering particle rotation (Figure 10A and Figure 6B). The previous studies considered that the wear rate in the vibration state without rotation had almost no significant difference at the different corner sections [35]. When considering the particle rotation, the sea ice particles at the corner were affected by vibration and inertial forces, which caused the particles to move to the inner side of the corner, resulting in a large and concentrated distribution of the velocity. As a result, the impact intensity of the particles at the corner was large, and abrasion occurred easily (Figure 10B). The effect of particle rotation on wear rate along the path is intuitively shown in Figure 11. Considering the particle rotation characteristics, the wear rate along the pipeline increased significantly.
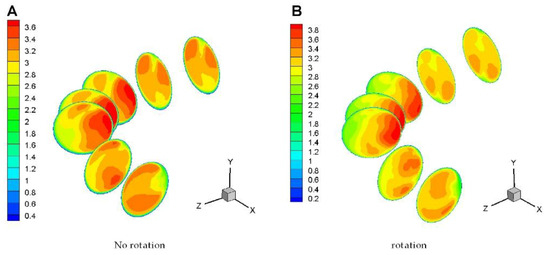
Figure 10.
Velocity comparison of particle rotation at different cross-sections at the elbow.
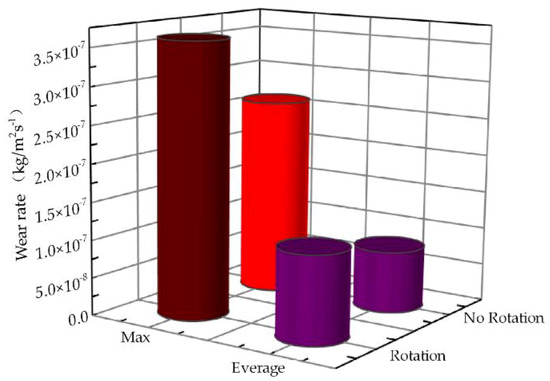
Figure 11.
The effect of particle rotation on wear rate along the path.
5. Conclusions and Recommendations
In this study, using the 90° bend angle of the seawater pipeline of polar ships as the model, and coupled with the CFD numerical simulation method, the pressure drop of the two-phase flow in the pipeline and the wear rate along the pipeline were analyzed in terms of different velocity, ice packing factor (IPF), ice particle size and particle rotation. The following conclusions are obtained:
- Vibration is the most important factor affecting the pressure drop and wear rate. The pressure drop under vibration is greater than that with the static pipe, while the wear rate under vibration is greater than that under the static pipe at same angle section of the elbow.
- With other conditions remaining unchanged, the wear rate first decreases when the flow velocity is up to 2 m/s, where the minimum wear appears. The wear rate is positively correlated with flow rate at the same angle section of the elbow. It slowly increases until the flow is up to 3 m/s, and the wear degree is more obvious at 30° and 90° sections.
- Under vibration conditions, the maximum wear rate has an inflection point that varies with changes of IPF. When IPF is less than 8%, the wear rate only slightly varies, while it greatly increases once IPF is more than 8%.
- Under vibration conditions, the pressure drops significantly when the particle diameter is in the range of 0.1–0.3 mm and tends to stabilize once the particle diameter is over 0.3 mm. The wear rate of the pipe worsens when the particle rotation is considered.
To sum up, vibration is an important factor that causes pipeline wear. For ships sailing in polar regions, operators should strictly follow the ice-breaking work-flow to avoid local high-frequency vibration caused by improper operation. In the design of a pipeline layout scheme, the pipeline should be arranged in the H–V direction as much as possible. The flow rate should be controlled in the range of 2–3 m/s, IPF should be reduced as much as possible, and particle diameter should be controlled at about 0.3 mm. For piping seawater to important equipment, multi-degrees-of-freedom damping support can be used to improve the multi-dimensional damping effect of the pipeline and the service cycle of the pipeline.
Author Contributions
Conceptualization, L.X. and G.-C.L.; methodology, G.-C.L. and Z.-Q.L.; software, G.-C.L. and H.-W.C.; validation, L.X. and J.L.; resources, L.X.; writing—original draft preparation, G.-C.L. and Q.S.; writing—review and editing, G.-C.L.; supervision, L.X. and J.L.; funding acquisition, L.X. and J.L. All authors have read and agreed to the published version of the manuscript.
Funding
National natural science foundation of China project “study on the mechanism of ice crystals’ influence on the heat transfer in polar transport vessel seawater system” (grant no. 51479152) and projects from Key Lab of Marine Power Engineering and Tech. authorized by MOT (KLMPET2018-01) and the Fundamental Research Funds for the General Universities (WUT: 2019III046GX).
Conflicts of Interest
The authors declare no conflict of interest.
References
- Song, Y.H.; Akashi, Y.; Yee, J.J. Effects of utilizing seawater as a cooling source system in a commercial complex. Energy Build. 2007, 39, 1080–1087. [Google Scholar] [CrossRef]
- Karan, S. A review on subsea process and valve technology. Msot 2019, 4, 210–219. [Google Scholar]
- Chen, G.; Chu, C. Problem on Erosion. J. Hebei Inst. Technol. 1997, 19, 27–32. (In Chinese) [Google Scholar]
- Xu, L.; Huang, C.X.; Huang, Z.F.; Sun, Q.; Li, J. Numerical simulation of flow and melting characteristics of seawater-ice crystals two-phase flow in inlet straight pipe of shell and tube heat exchanger of polar ship. Heat Mass Transf. 2018, 54, 3345–3360. [Google Scholar] [CrossRef]
- Cao, Y.; Zhao, J. Progress of Chinese research in Arctic physical oceanography during 2007–2010. APS 2011, 22, 281–292. [Google Scholar]
- Dai, Z.; Duan, Z.X.; Shen, S.M. Factors on Erosion-corrosion in Liquid-Solid Two-phase Flow Sys-tem. Petro-Chem. Equip. 2006, 35, 4–7. (In Chinese) [Google Scholar]
- Cao, X.W.; Xu, K.; Peng, W.S. Simulation and Analysis of Liquid-Solid Two-phase Flow Erosion Failure in Pipe Bends. Surf. Technol. 2016, 45, 124–131. [Google Scholar]
- Fukasawa, T. Some Considerations on the effect of wave-induced vibrations upon hull-girder fatigue strength of a Post-Panamax container ship. Hydroelasticity Mar. Technol. 2012, 11, 389–398. [Google Scholar]
- Wang, Y.P.; Peng, X. Theory and Experimentation Analysis on Vibration of Ship’s Pipeline System. Noise Vib. Control 2004, 24, 18–21. (In Chinese) [Google Scholar]
- Lee, B.E.; Tu, J.Y.; Fletcher, C.A. On numerical modeling of particle wall impaction in relation to erosion prediction: Eulerian versus Lagrangian method. Wear 2002, 252, 179–188. [Google Scholar] [CrossRef]
- Tilly, G.P. Erosion caused by impact of solid particles. Treatise Mater. Sci. Technol. 1979, 13, 287–298. [Google Scholar]
- Ou, G.; Bie, K.; Zheng, Z.; Shu, G.; Wang, C.; Cheng, B. Numerical simulation on the erosion wear of a multiphase flow pipeline. Int. J. Adv. Manuf. Technol 2018, 96, 1705–1713. [Google Scholar] [CrossRef]
- Nguyen, V.B.; Nguyen, Q.B.; Liu, Z.G.; Wan, S.; Lim, C.Y.H.; Zhang, Y.W. A combined numerical–experimental study on the effect of surface evolution on the water–sand multiphase flow characteristics and the material erosion behavior. Wear 2014, 319, 96–109. [Google Scholar] [CrossRef]
- Messa, G.V.; Malavasi, S. Improvements in the numerical prediction of fully-suspended slurry flow in horizontal pipes. Powder Technol 2015, 270, 358–367. [Google Scholar] [CrossRef]
- Yang, W.B.; Liu, T.G. A Study on Wearing of Particle in Fluidized Bed. J. Beijing Inst. Light Ind. 1998, 19, 9–12. [Google Scholar]
- Finnie, I.; Kabil, Y. Erosion of metals by solid particles. J. Mater. 1967, 2, 682. [Google Scholar]
- Bitter, J.G. A study of erosion phenomena: Part1. Wear 1963, 6, 5–21. [Google Scholar] [CrossRef]
- Bitter, J.G. A study of erosion phenomena: part2. Wear 1963, 6, 169–190. [Google Scholar] [CrossRef]
- Robert, B.J.; Alan, L. Erosion mechanism in ductile metals. Wear 1981, 70, 11–27. [Google Scholar]
- Bryggman, U.; Hogmark, S. Comparing the abrasive and erosive resistance of some flame sprayed coatings and nitrided steel surfaces. Mech. Behav. Mater. 1984, 385–391. [Google Scholar] [CrossRef]
- Kaimal, M.R.; Devanathan, R. Motion of a Viscous Fluid with Suspended Particles in a Curved Tube. Int. J. Eng. 1980, 18, 847–854. [Google Scholar] [CrossRef]
- Boulard, T. Advantages and constraints of CFD greenhouse modelling. Acta Hortic. 2011, 893, 145–153. [Google Scholar] [CrossRef]
- Jajcevic, D.; Siegmann, E.; Radeke, C.; Khinast, J.G. Large-scale CFD–DEM simulations of fluidized granular systems. Chem. Eng. Sci. 2013, 98, 298–310. [Google Scholar] [CrossRef]
- Niu, Y.Y.; Tsai, C.S. Simulation of erosion by the dilute particulate flow impact. Numer. Heat Transf. Part A 2000, 37, 167–187. [Google Scholar]
- Wallace, M.S. CFD-Based Erosion Modelling of Simple and Complex Geometries. Ph.D. Thesis, University of Strathclyde, Glasgow, UK, 2001. [Google Scholar]
- Sen, M.; Barrasso, D.; Singh, R.; Ramachandran, R. A Multi-Scale Hybrid CFD-DEM-PBM Description of a Fluid-Bed Granulation Process. Processes 2014, 2, 89–111. [Google Scholar] [CrossRef]
- Kriebitzsch, S.; Rzehak, R. Baseline Model for Bubbly Flows: Simulation of Monodisperse Flow in Pipes of Different Diameters. Fluids 2016, 1, 29. [Google Scholar] [CrossRef]
- Nguyen, V.B.; Nguyen, Q.B.; Zhang, Y.W.; Lim, C.Y.H.; Khoo, B.C. Effect of particle size on erosion characteristics. Wear 2016, 348–349, 126–137. [Google Scholar] [CrossRef]
- Karimi, S.; Shirazi, S.A.; McLaury, B.S. Predicting fine particle erosion utilizing computational fluid dynamics. Wear 2017, 376–377, 1130–1137. [Google Scholar] [CrossRef]
- Zhou, W.; Jiang, Y.; Liu, S.; Zhao, Q.; Long, T.; Li, Z. Detection of Gas-Solid Two-Phase Flow Based on CFD and Capacitance Method. Appl. Sci. 2018, 8, 1367. [Google Scholar] [CrossRef]
- Guher, C.; Igor, K. On the Lagrangian and Eulerian analyticity for the Euler equations. Physica D 2018, 376–377, 121–130. [Google Scholar]
- Lain, S.; Sommerfeld, M. Numerical prediction of particle erosion of pipe bends. Adv. Powder Technol. 2019, 30, 366–383. [Google Scholar] [CrossRef]
- Marrah, A. Simulating of Erosion Modeling Using ANSYS Fluid Dynamics. Ph.D. Thesis, Memorial University of Newfoundland, St. Johns, Queens, NY, USA, 2019. [Google Scholar]
- Jashanpreet, S.; Satish, K.; Jatinder, P.S.; Kumar, P.; Mohapatra, S.K. CFD modeling of erosion wear in pipe bend for the flow of bottom ash suspension. Part. Sci. Technol. 2019, 37, 275–285. [Google Scholar]
- Xu, L.; Sun, Q.; Tang, B.; Huang, C.X.; Li, J. Numerical simulation of ice particle erosion in seawater pipelines of polar ship under vibration conditions. Ocean Eng. 2018, 147, 9–19. [Google Scholar] [CrossRef]
- Weaver, D.S.; Myklatun, B. On the stability of thin pipes with an internal flow. JSV 1973, 31, 399–410. [Google Scholar] [CrossRef][Green Version]
- Zheng, C.; Liu, Y.Y.; Chen, C. Numerical study of impact erosion of multiple solid particle. Appl. Surf. Sci. 2017, 423, 76–184. [Google Scholar] [CrossRef]
- Lindner, A.; Bonn, D.; Poiré, E.C.; Amar, M.B.; Meunier, J. Viscous fingering in non-Newtonian fluids. J. Fluid Mech. 2002, 469, 237–256. [Google Scholar] [CrossRef]
- Hölzer, A.; Sommerfeld, M. New simple correlation formula for the drag coefficient of non-spherical particles. Powder Technol. 2008, 184, 361–365. [Google Scholar] [CrossRef]
- Jun, Y.D.; Tabakoff, W. Numerical simulation of a dilute particulate flow (laminar) over tube banks. J. Fluids Eng. 1994, 116, 770–777. [Google Scholar] [CrossRef]
- Grant, G.; Tabakoff, W. Erosion prediction in turbo machinery resulting from environmental solid particles. J. Aircraft. 1975, 12, 471–478. [Google Scholar] [CrossRef]
- Zhao, Q.A. Ship diary of yong sheng ship (part 1). Marit. China 2013, 9, 36–42. (In Chinese) [Google Scholar]
- Safaei, M.R.; Ahmadi, G.; Goodarzi, M.S.; Safdari Shadloo, M.; Goshayeshi, H.R.; Dahari, M. Heat Transfer and Pressure Drop in Fully Developed Turbulent Flows of Graphene Nanoplatelets–Silver/Water Nanofluids. Fluids 2016, 1, 20. [Google Scholar] [CrossRef]
© 2020 by the authors. Licensee MDPI, Basel, Switzerland. This article is an open access article distributed under the terms and conditions of the Creative Commons Attribution (CC BY) license (http://creativecommons.org/licenses/by/4.0/).