Article

Numerical Simulation of Breaking Wave Loading on Standing Circular Cylinders with Different Transverse Inclined Angles

1
College of Shipbuilding Engineering, Harbin Engineering University, Harbin 150001, China
2
Department of Mechanical and Structural Engineering and Materials Science, University of Stavanger, 4036 Stavanger, Norway
*
Author to whom correspondence should be addressed.
Appl. Sci. 2020, 10(4), 1347; https://doi.org/10.3390/app10041347
Submission received: 20 December 2019 / Revised: 7 February 2020 / Accepted: 12 February 2020 / Published: 16 February 2020
(This article belongs to the Section Energy Science and Technology)

Abstract

:
The purpose of this paper is to numerically simulate the breaking wave past a standing cylinder with different transverse inclined angles. The numerical simulations are carried out by solving the Unsteady Reynolds-Averaged Navier–Stokes (URANS) equations with the k ω S S T turbulence model. The air–water interface is captured using the Volume of Fluid (VOF) method. The convergence studies on the grid and time-step are performed by examining the total horizontal breaking wave forces on the vertical cylinder. The present numerical results have been validated with the published experimental data. A good agreement is obtained between the present numerical results and the experimental data in terms of the surface elevation and the horizontal breaking wave force. Moreover, the total horizontal breaking wave force is decomposed into low-order and high-order wave forces through Fast Fourier Transform (FFT). It is observed that the free surface elevations in front of the cylinder and the normalized high-order wave force have a minimum value when the transverse inclined angle of the cylinder is 45°. The secondary load causing the higher-harmonic ringing motion of structures is not observed when the cylinder is placed with the transverse inclined angles of 30° and 45°.

1. Introduction

The offshore structures installed in shallow water usually suffer highly nonlinear wave breaking impacts. Many coastal and offshore structures consist of cylinders with different inclined angles, such as supporting structures of wind turbines, platforms, and large floating bridges. The breaking waves normally hit the structures within a very short duration and cause a large wave impact force, which can lead to a significant damage to the structures. Therefore, accurately predicting the wave impact forces on standing cylindrical structures with different inclined angles is of great concern for the design of coastal and offshore structures. Because the characteristics of wave breaking are strongly nonlinear, most early research was mainly based on experimental investigations. Apelt and Piorewicz [1] performed breaking wave force experiments on two and three vertical cylinders situated in the breaking wave zone parallel and normal to the direction of wave propagation. The experimental results showed that the incident wave steepness and the distance between the cylinders were two important factors, especially when the cylinders are arranged in orientations normal to the wave propagation than parallel to the wave propagation. Wienke et al. [2] conducted large-scale experimental studies on breaking wave impacts on a vertical cylindrical pile. It was presented that the total breaking wave force is the sum of the quasi-static force calculated by the Morison equations and the slamming force considering the duration of the impact. Irschik et al. [3] employed the Fast Fourier Transform (FFT) low-pass filter and the Empirical Mode Decomposition (EMD) to separate the experimental data of breaking wave forces on a vertical cylinder into two components, i.e., the quasi-static loading and the dynamic force. They found that the calculation methods overestimated the quasi-static force in the region of the maximum impact.
However, measuring velocity, acceleration, and turbulent properties during wave breaking are challenging tasks in the experiment [4]. Moreover, the appropriate experimental facilities, as well as minimizing human and instrument errors have important influences on experimental results. With the increase in computational capabilities, a good alternative approach is Computational Fluid Dynamics (CFD), which can be applied to simulate the impact of the breaking waves on marine structures for both research and engineering design purposes.
Christensen et al. [5] used a Navier–Stokes solver with the VOF technique to study the wave run-up and breaking wave forces on a vertical cylinder. They found that the peak value of the horizontal breaking wave force under a plunging breaker was much larger than that under a spilling breaker. Shao [6] employed the incompressible smoothed particle hydrodynamic (ISPH) method coupled with k ε turbulence model to simulate the spilling and plunging waves by solving RANS equations. It was found that the SPH method can accurately capture the free surfaces without the numerical diffusion compared with the Euler grid method. Chow et al. [7] simulated non-breaking and breaking waves past a vertical cylinder with the improved ISPH method. They found that the maximum loading on the structure was related to the free surface elevation and steepness of the wave across the cylinder. Local pressures on the cylinder near the free surface under breaking waves are higher than those of non-breaking waves. Bredmose and Jacobsen [8] computed breaking wave forces on wind turbines using the VOF method without considering turbulence effects. Their results suggest that the peak force become smaller when the breaking wave is more developed for the spilling breakers. Xiao and Huang [9] investigated the wave run-up and breaking wave impacts on a vertical cylinder located at different positions using the k ε turbulence model with the VOF method. In their study, the largest wave force was observed when the pile was located at 3/4 R (R is the maximum run-up height) below the shoreline. Choi et al. [10] studied breaking wave impact forces on the vertical cylinder and the inclined cylinder which direction is parallel to the wave propagation using modified Navier–Stokes equations. The effect on the breaking wave forces due to the vibration of cylinders in the experiment was studied. The computed breaking wave forces were in good agreement with the experimental data filtered by an FFT low-pass filter and EMD. Kamath et al. [11] and Chella et al. [12] studied the influence of wave breaking locations on the interactions between breaking waves and a vertical cylinder using the k ω turbulence model. They pointed out that the largest total horizontal wave force was generated when the overturning wave tongue was just below the wave crest level and hit the cylinder. Jose and Choi [13] investigated the slamming coefficients on the local cylindrical members of a jacket structure under plunging breakers by solving Navier–Stokes equations together with the VOF method. It was found that the maximum slamming coefficients increase first and then decrease in the impact area, and the curves presented triangular shapes. It is recommended that when calculating the slamming force on the offshore wind turbine substructures, a triangular distribution of force should be adopted instead of using the maximum value of slamming force along the entire member. Recently, Liu et al. [14,15] employed the k ω S S T turbulence model with the VOF method to study the higher-harmonic force on a vertical cylinder under the breaking wave impact. The numerical results show that the occurrence of the secondary load cycles was related to the Froude number and the wave steepness. Both slamming wave force and secondary load can generate the higher-harmonic wave force in the case of breaking wave.
Based on a review of the literature, most studies focused on the effects of wave steepness, wave breaking location, and different numerical models. Only a few papers investigated the influence of inclined angles of the cylinder parallel to the direction of wave propagation. However, for assessment on the stability and safety of the structures during the engineering design process, it is important to understand the interaction between the breaking waves and the cylinders with different inclined directions. Therefore, the primary purpose of the present study is to investigate the characteristics of breaking wave forces on a standing cylinder with different transverse inclined angles in orientation normal to the wave propagation. In this paper, URANS equations are solved by using an open-source CFD software Open FOAM. The interface between air and water is captured using the VOF method. This paper is structured as follows. First, the convergence studies on the grid and time-step are presented. Then numerical results of total horizontal breaking wave forces on the cylinder and free surface elevations are compared with the published experimental data to validate the accuracy of the numerical model. Furthermore, the characteristics of the free surface elevations and different compositions of wave forces are studied. The effects of the transverse inclined angle are discussed in detail. Finally, the conclusions based on the present numerical results are summarized.

2. Methodology

2.1. Governing Equations

The air and water phases are treated as incompressible viscous fluid in the present numerical model, which are solved using URANS equations:
u i t + u j u i x j = 1 ρ p _ r g h x i + ν 2 u i x j 2 u i u j ¯ x j
u i x i = 0
where u i are the components of the mean fluid velocity, p _ r g h is the pressure in excess of the static pressure, ρ is the fluid density (air or water), and ν is the kinematic viscosity. u i u j ¯ denotes the Reynolds stress component expressed by the Boussines q approximation.
u i u j ¯ = ν t ( u i x j + u j x i ) 2 3 k δ i j
Here, k is turbulent kinetic energy, ν t is the turbulent kinematic viscosity, and δ i j is the Kronecker delta.
The k ω S S T model proposed by Menter [16] has a good performance for wave elevation predictions during the wave breaking according to Brown et al. [17]. The application of the k ω S S T model to numerically simulate breaking wave past a vertical cylinder can also be found in Liu et al. [14,15]. Therefore, the k ω S S T turbulence model is employed in the present simulations. The transport equations for turbulent kinetic energy k and specific turbulent dissipation rate ω are given by
( ρ k ) t + ( ρ u i k ) x i = x i [ ( μ + σ k μ t ) k x i ] + P k β * ρ ω k
( ρ ω ) t + ( ρ u i ω ) x i = x i [ ( μ + σ ω μ t ) ω x i ] + α ρ S 2 β ρ ω 2 + 2 ( 1 F 1 ) ρ σ ω 2 ω k x i ω x i
where F 1 is the first blending function defined as
F 1 = tanh { { min [ max ( k B * ω y , 500 υ y 2 ω ) , 4 ρ σ ω 2 k C D k ω y 2 ] } 4 }
C D k ω = max ( 2 ρ σ ω 2 ω k x i ω x i , 10 10 )
where y is the distance from the center of the first layer mesh to the wall. The dynamic turbulent viscosity μ t is defined by
μ t = ρ a 1 k max ( a 1 ω , S F 2 )
The invariant measure of the strain rate S = 2 S i j S i j . Here, S i j = 1 2 ( u i x j + u j x i ) . The second blending function F 2 is expressed as
F 2 = tanh [ [ max ( 2 k β * ω y , 500 υ y 2 ω ) ] 2 ]
The production term P k = min ( G , 10 β * ρ k ω ) , where G is given by
G = μ t u i x j ( u i x j + u j x i )
The constants of α k , α ω , α and β are blended using equation
ϕ = F 1 ϕ 1 + ( 1 F 1 ) ϕ 2
The constants of this model are β * = 0.09 , α 1 = 5 / 9 , β 1 = 0.075 , σ k 1 = 0.85 , σ ω 1 = 0.5 , α 2 = 0.44 , β 2 = 0.0828 , σ k 2 = 1 , σ ω 2 = 0.856 .

2.2. Free Surface Capture

The interface between the air and the water is captured by the VOF method [18], which is based on a volume fraction coefficient α defined as
α = { α = 1 0 < α < 1 α = 0 water interface air
The density ρ and kinematic viscosity ν at the interface can be obtained based on the formulas as follows,
{ ρ = α ρ w + ( 1 α ) ρ a ν = α ν w + ( 1 α ) ν a
where ρ a and ρ w are the densities of air and water, respectively; ν a and ν w denote the kinematic viscosity coefficients of air and water, respectively. The volume fraction α is solved by the following advection equation,
α t + ( α u i ) x i + [ α ( 1 α ) u i r ] x i = 0
where u i r denotes the relative velocity between air and water in the interface region. The surface tension effect is considered negligible.

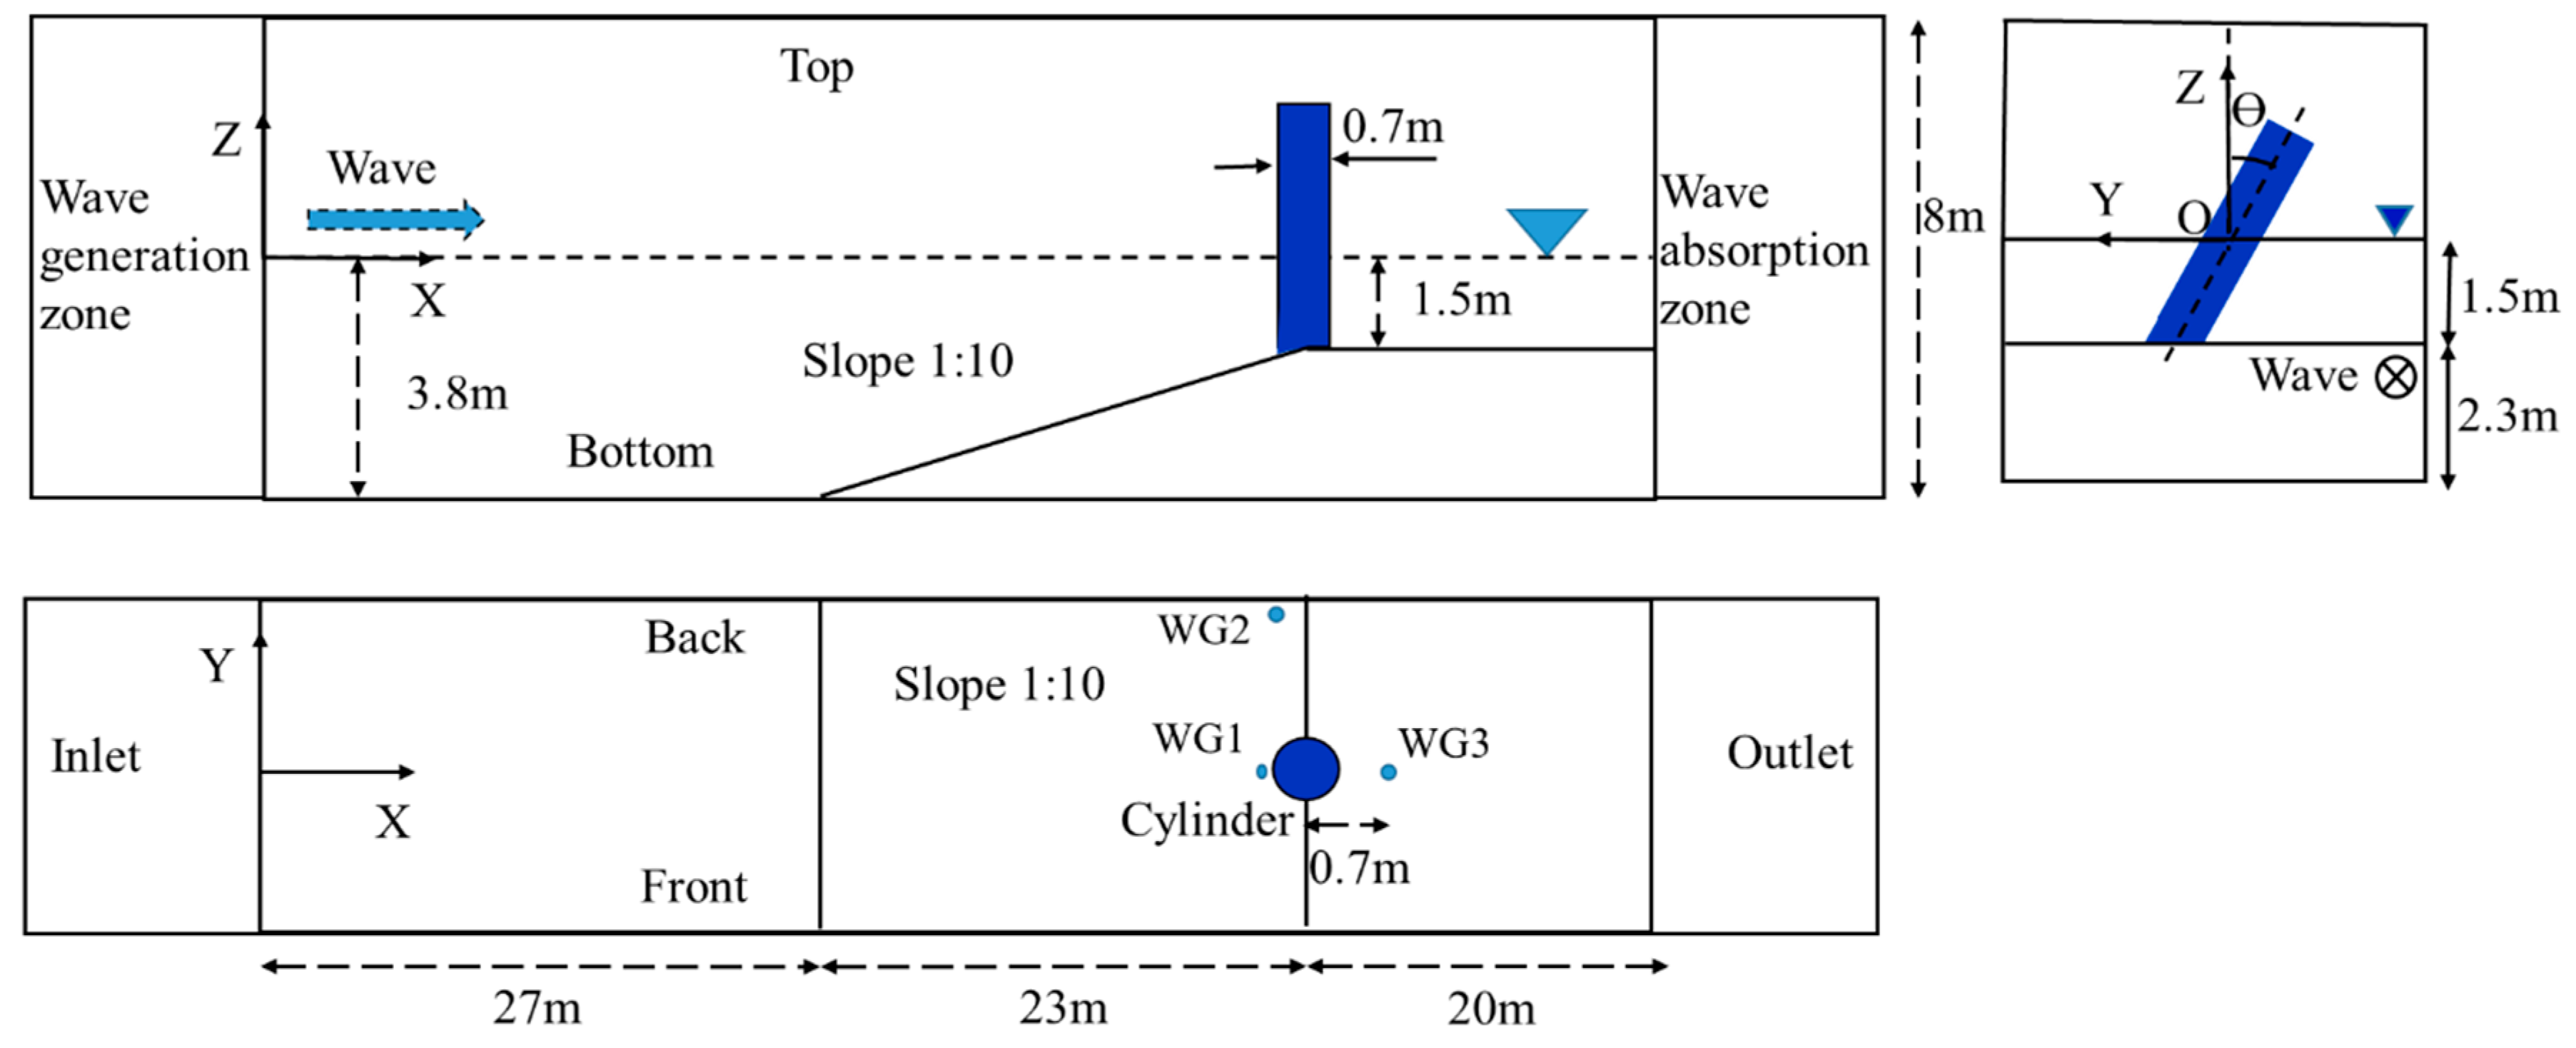
2.3. Numerical Wave Tank

A relaxation method presented by Mayer et al. [19] is used to generate and absorb waves in the numerical wave tank. The relaxation algorithm [20] used to update the wave height and the velocity in the generation zone and absorption zone is expressed as
ϕ = γ R ϕ c o m p u t e d + ( 1 γ R ) ϕ t a r g e t
where ϕ is either α or u i , and the weighting factor γ R is defined by
γ R = 1 exp ( χ R 3 . 5 ) 1 exp ( 1 ) 1 ,   χ R [ 0 , 1 ]
The set-up of the numerical wave tank is shown in Figure 1. Both the wave generation zone and the absorption zone are one wavelength long, respectively. The transverse inclined angle θ is defined as the angle between the cylinder and the vertical direction at the plane perpendicular to the direction of wave propagation.

2.4. Boundary Conditions

Boundary conditions of the present numerical wave tank are presented as follows.
(i)
At the inlet boundary, the velocity for the water is given according to the wave theory, while the air velocity is zero. The pressure is set as a zero normal gradient boundary condition.
(ii)
At the outlet of the domain, the velocities for both water and air are set to zero. The zero normal gradient condition is applied for the pressure.
(iii)
At the top boundary, the velocity for the inflow is calculated from the flux in the patch-normal direction. The velocity for the outflow is set as the zero normal gradient boundary condition. The patch pressure p p on the top boundary is obtained by subtracting the dynamic pressure from the total pressure, expressed as follows,
p p = p 0 0.5 | u | 2
where p 0 is total pressure and u is the mean velocity vector.
(iv)
The no-slip condition is employed in four boundaries, i.e., front, back, bottom, and the cylinder’s surface, where the velocity is zero. Meanwhile, the wall functions are employed on these boundaries. The distance of the first layer center to the wall is 0.002 D, where D is the diameter of the cylinder. It ensures that the dimensionless wall distance y + for the present simulation is at the range of 40–200.

2.5. Calculation of Wave Forces

The breaking wave forces on the cylinder are calculated as the integral of the pressure and the normal component of viscous shear stress τ on the surface of the cylinder Ω:
F = Ω ( n p + n · τ ) d Ω
where n is the unit normal vector pointing to the interior of the fluid.

2.6. Numerical Scheme

In the present simulations, the governing equations are discretized by the finite volume method (FVM). The PISO-SIMPLE (PIMPLE) algorithm is employed for the pressure-velocity coupling. The time derivatives are solved by the second-order implicit Crank-Nicolson scheme. Second-order Gauss with a limited linear scheme is employed for the convective terms. Second-order Gauss with a linear scheme is employed for the diffusive terms. The generalized geometric-algebraic multi-grid (GAMG) numerical method with Diagonal-based Incomplete Cholesky (DIC) preconditioner is employed to solve the pressure equations. For more details information of the above numerical scheme, please refer to Open FOAM [21].

3. Numerical Implementation

3.1. Setup of the Numerical Wave Tank

The experiments were performed at the Large Wave Channel (GWK) in Hannover, Germany. The dimensions of the wave flume are 309 m long, 7 m high, and 5 m wide with a 1:10 slope at the bottom. A cylinder with the diameter D = 0.7 m was installed with its central axis at the edge of the slope. More details of the experiments can be seen in Irschik et al. [3]. The configuration of the present three-dimensional numerical wave tank (NWT) is based on the experimental setup, as shown in Figure 1. The length and height of the NWT working zone are 70 m and 8 m, respectively. The width of the whole computational domain varies with the transverse inclined angle θ , ensuring that both ends of the cylinder are at least 4D away from the front and back boundaries. Three numerical wave gauges (WG1, WG2, and WG3) are used to measure the free surface elevations η , i.e., WG1 is mounted at 0.01 m in front of the cylinder, WG2 is placed near the wall along the frontline of the cylinder and WG3 is arranged at 0.7 m behind the cylinder. The specific positions of wave gauges can be seen in Figure 1. In this study, six cases with different transverse inclined angles are simulated, as shown in Table 1. The incident wave height H = 1.3 m, wave period T = 4.0 s, and water depth d = 3.8 m are chosen for all the simulations.

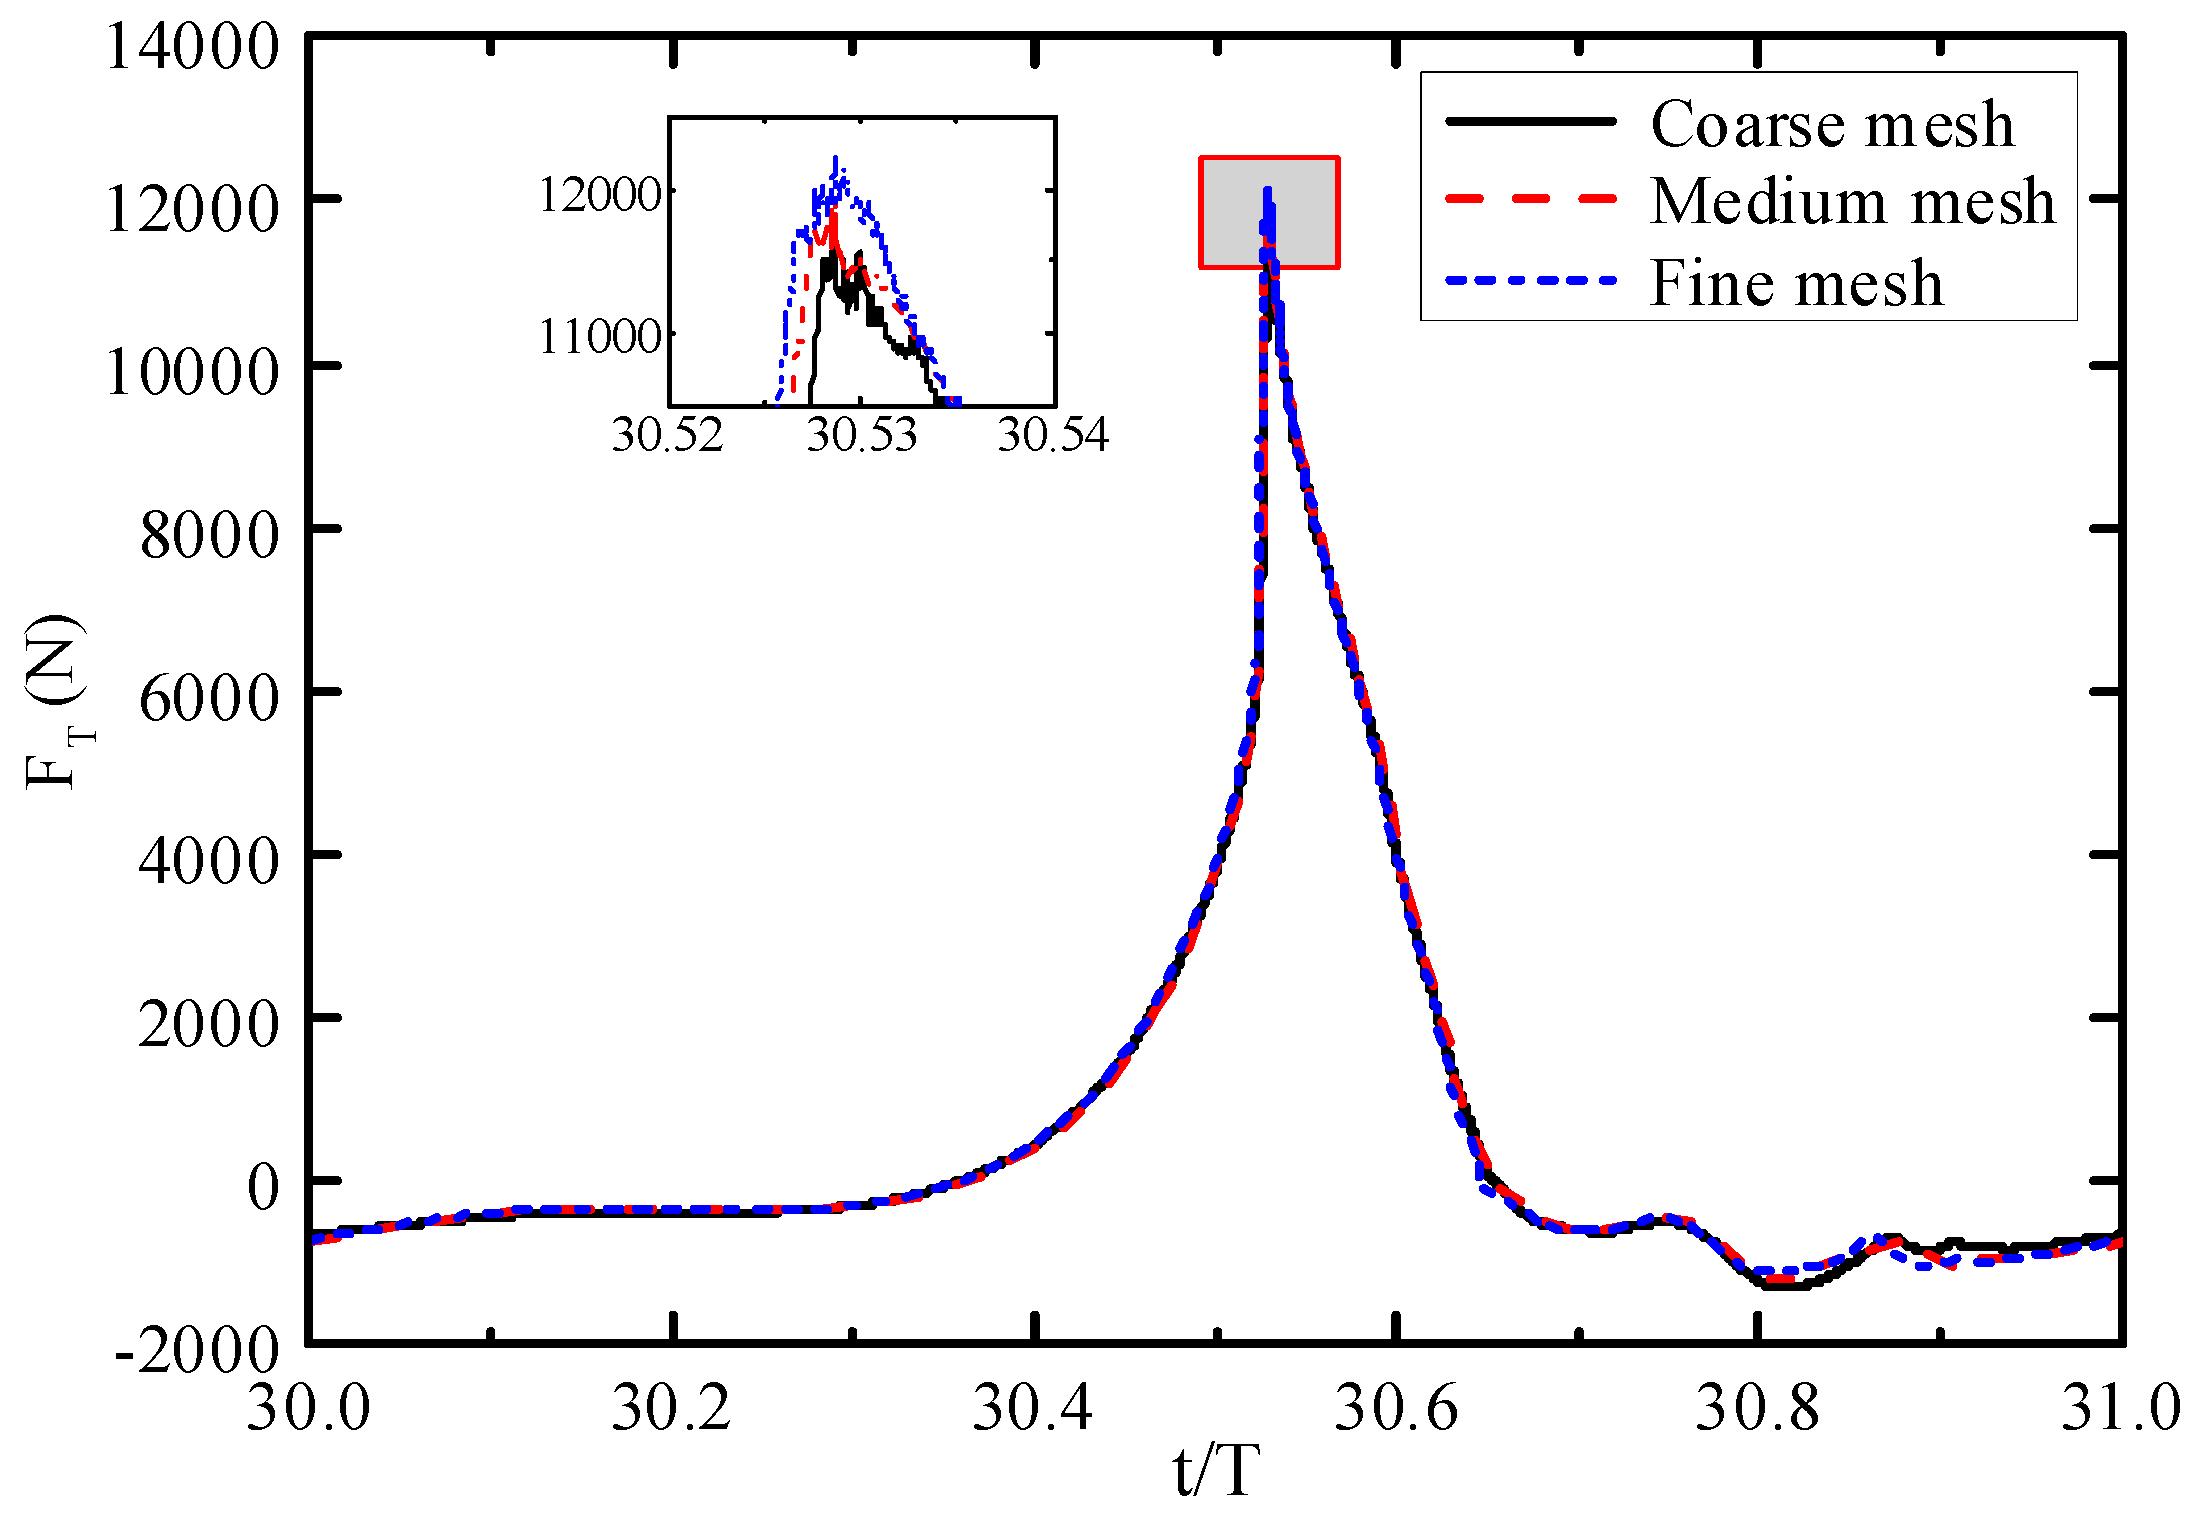
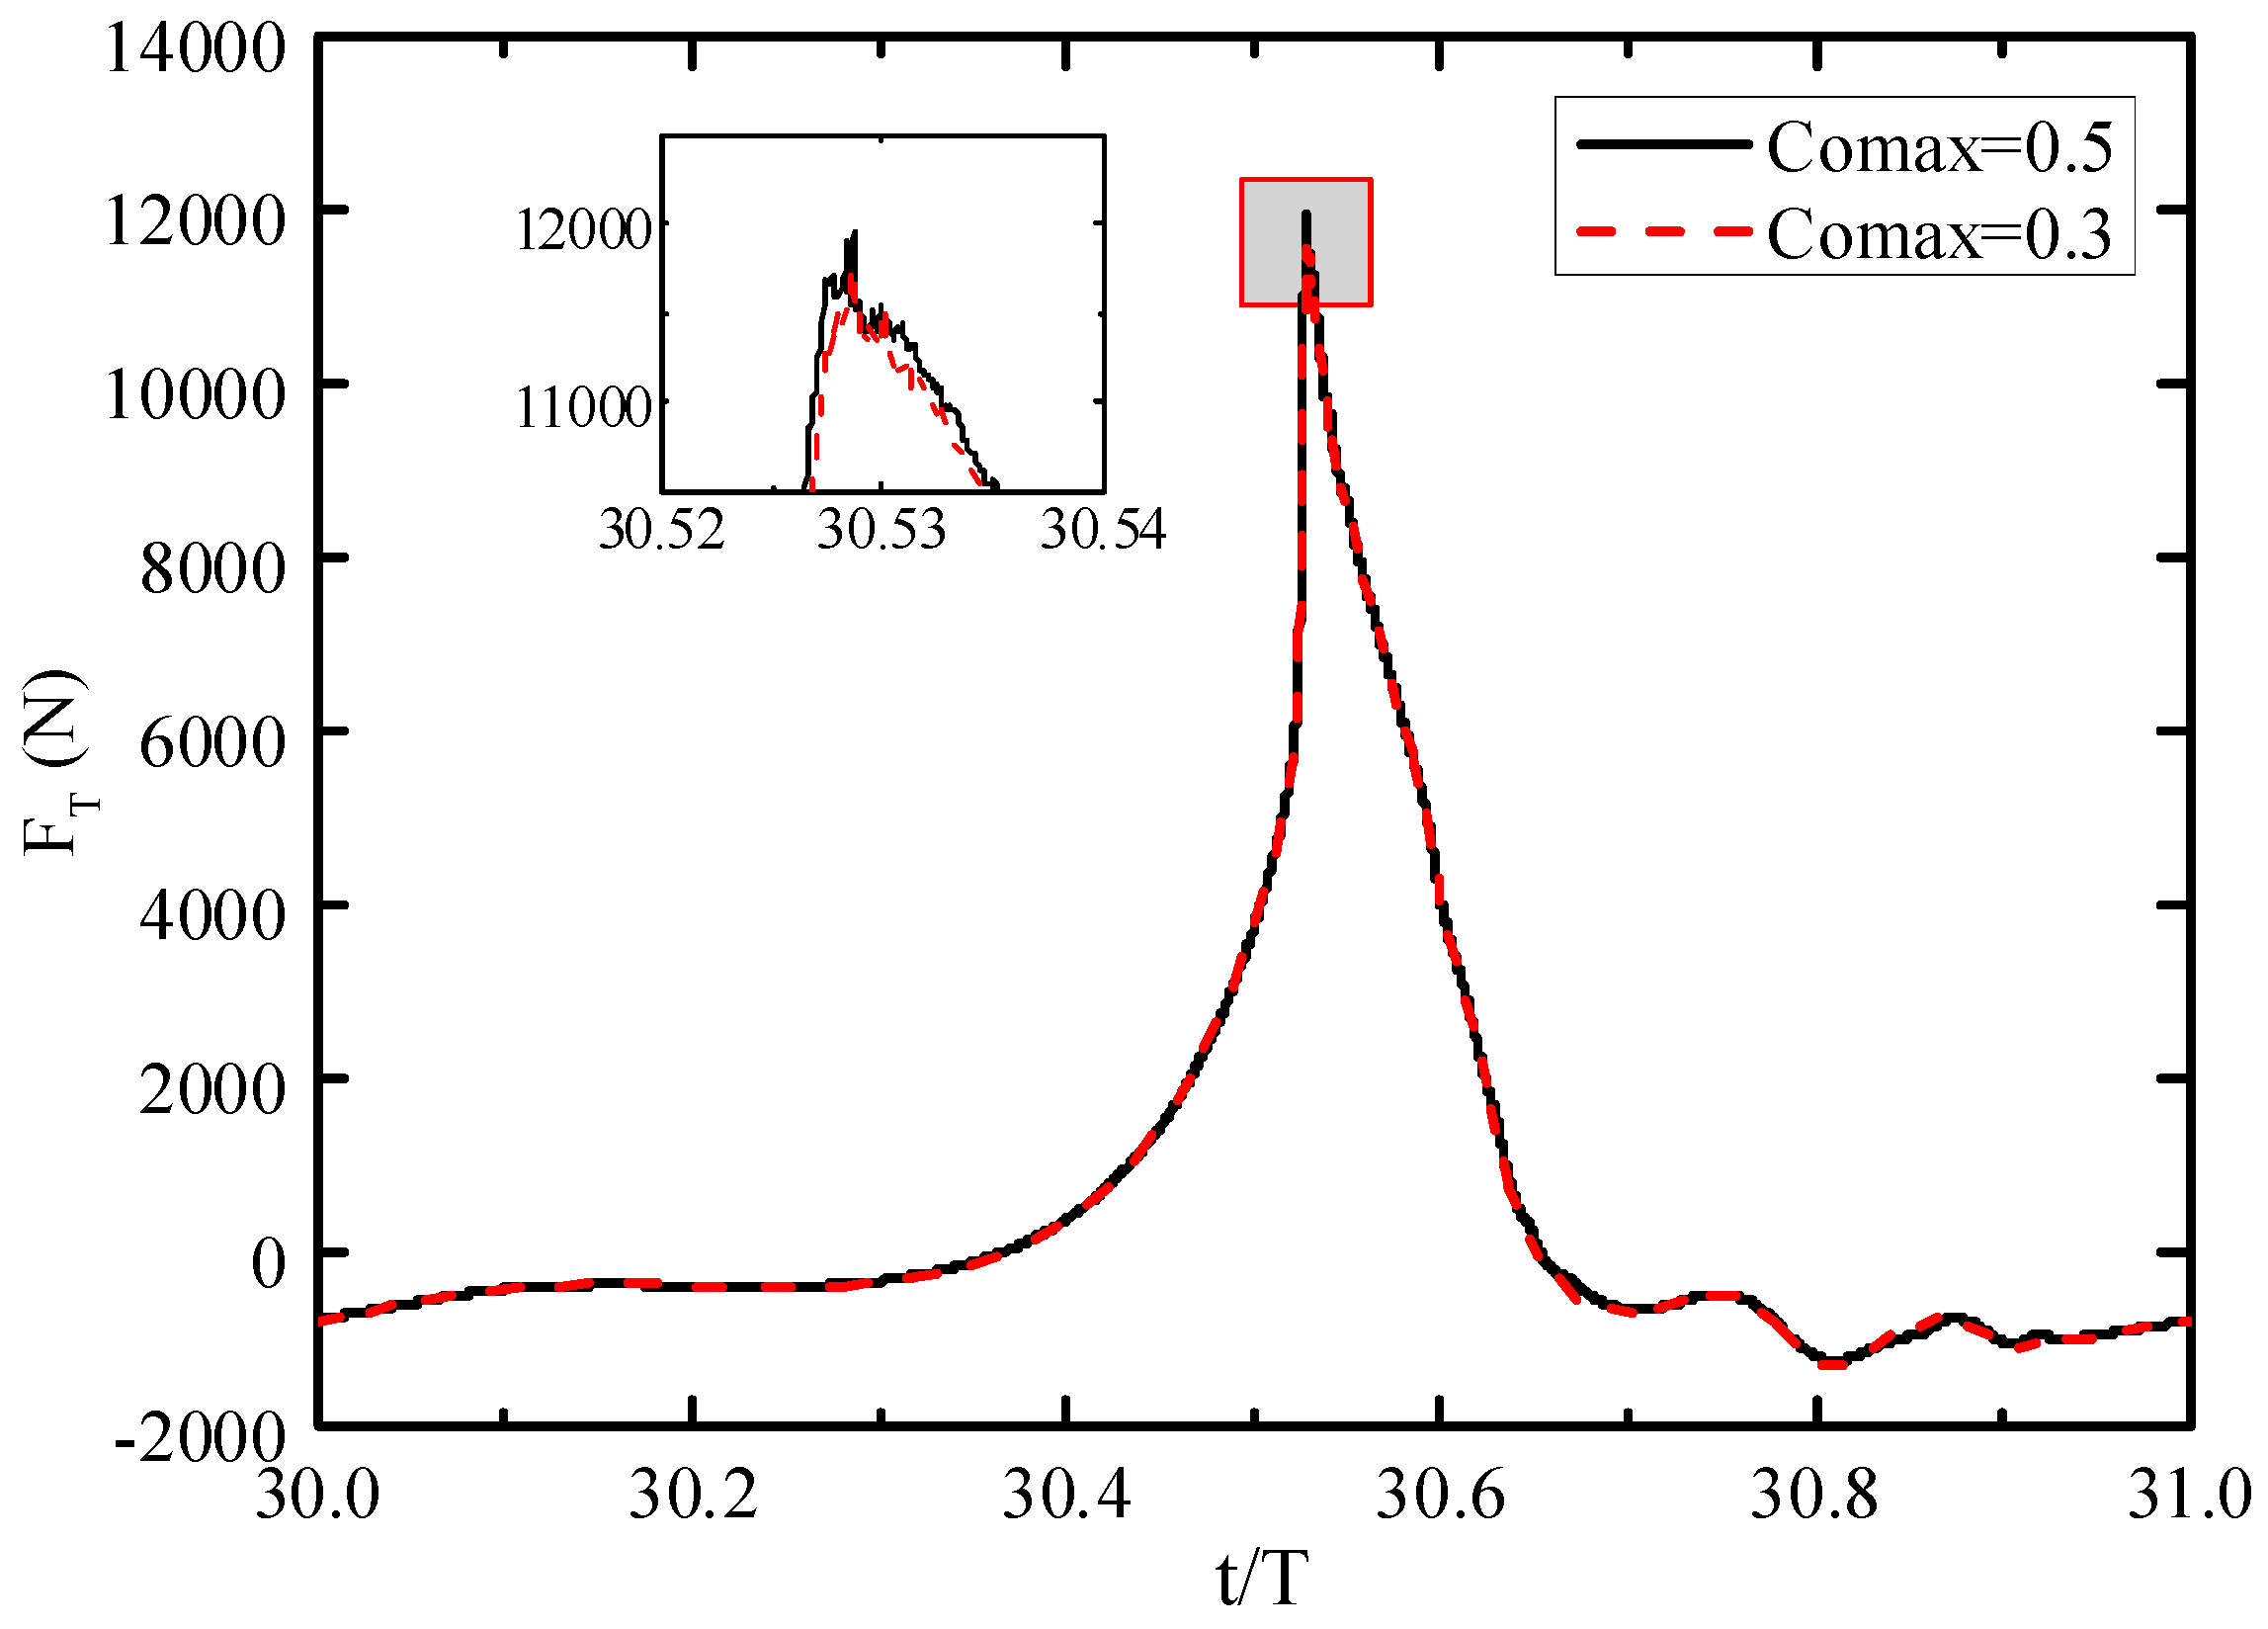
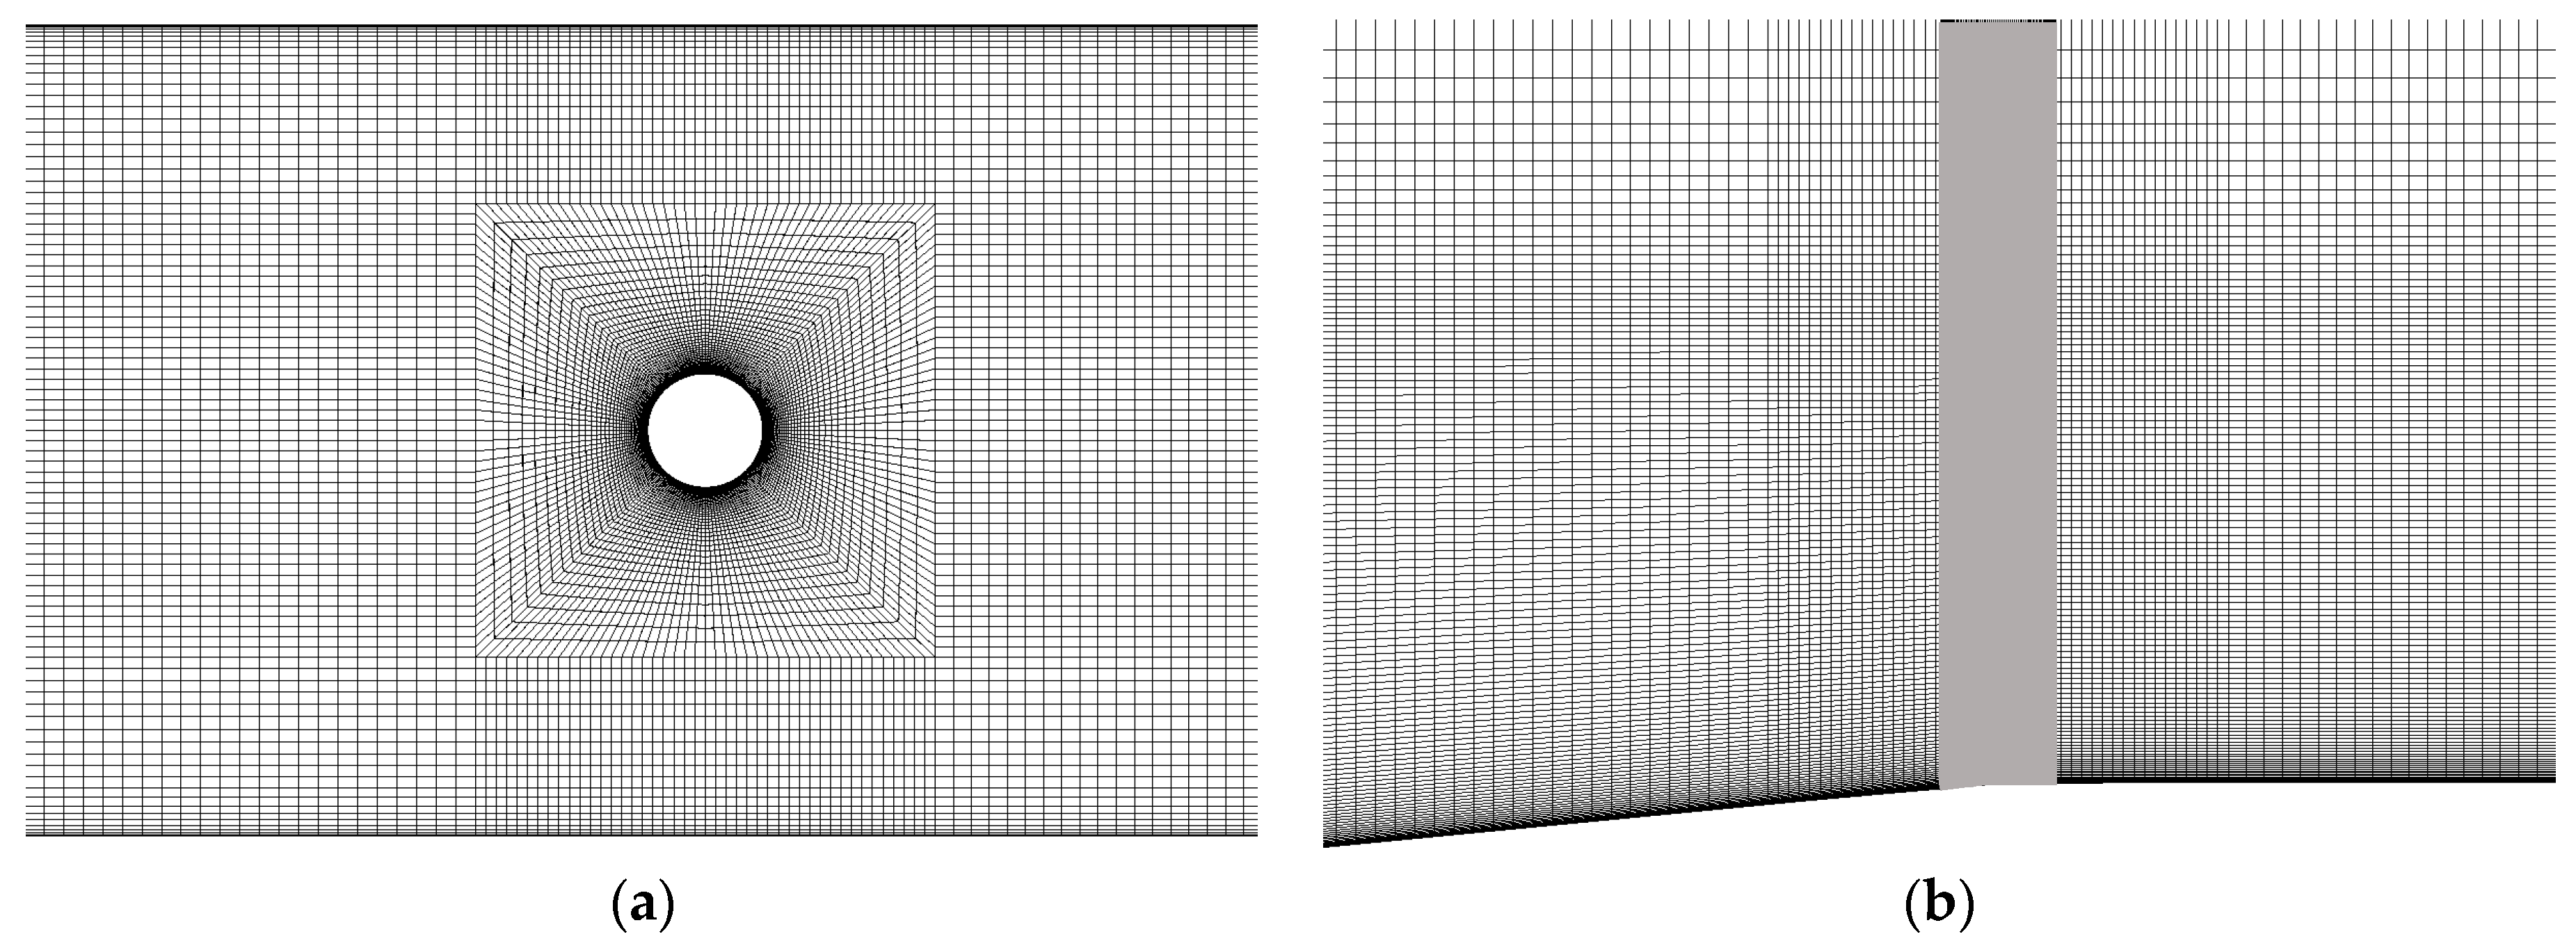
3.2. Grid and Time-Step Refinement Studies

In this section, three sets of meshes are performed to do a grid convergence study as shown in Table 2. All the present numerical simulations are conducted for a minimum duration of 140 s (35 wave periods), which ensures that the stable results can be obtained.
Figure 2 shows the total horizontal breaking wave forces F T on the vertical cylinder (θ = 0°) with three different meshes over one wave period. The relative difference in peak value of the F T between the fine mesh and the medium mesh is 2.2%, which is considered sufficiently accurate for the present simulations. Moreover, there finement study on time-step is also carried out by changing the maximum Courant number. It can be seen from Figure 3 that there is no significant improvement for F T when the maximum Courant number decreases from 0.5 to 0.3. Therefore, the medium mesh with the maximum Courant number 0.5 is considered to give sufficient accuracy to capture the horizontal breaking wave forces and will be used for all other cases. The different views of the medium mesh near the vertical cylinder are shown in Figure 4.

4. Results

4.1. Validation of the Numerical Model

In this section, validation studies are conducted through the numerical simulations of breaking waves past a vertical cylinder and an inclined cylinder with φ = −22.5°. φ is defined as the inclined angle parallel to the direction of wave propagation, details can be seen the set-up in Irschik et al. [3]. The present numerical results of the free surface elevations at the WG2 and the F T are compared with the experimental data from Irschik et al. [3], presented by Choi et al. [10] and other published computed results to validate the accuracy of the present model.

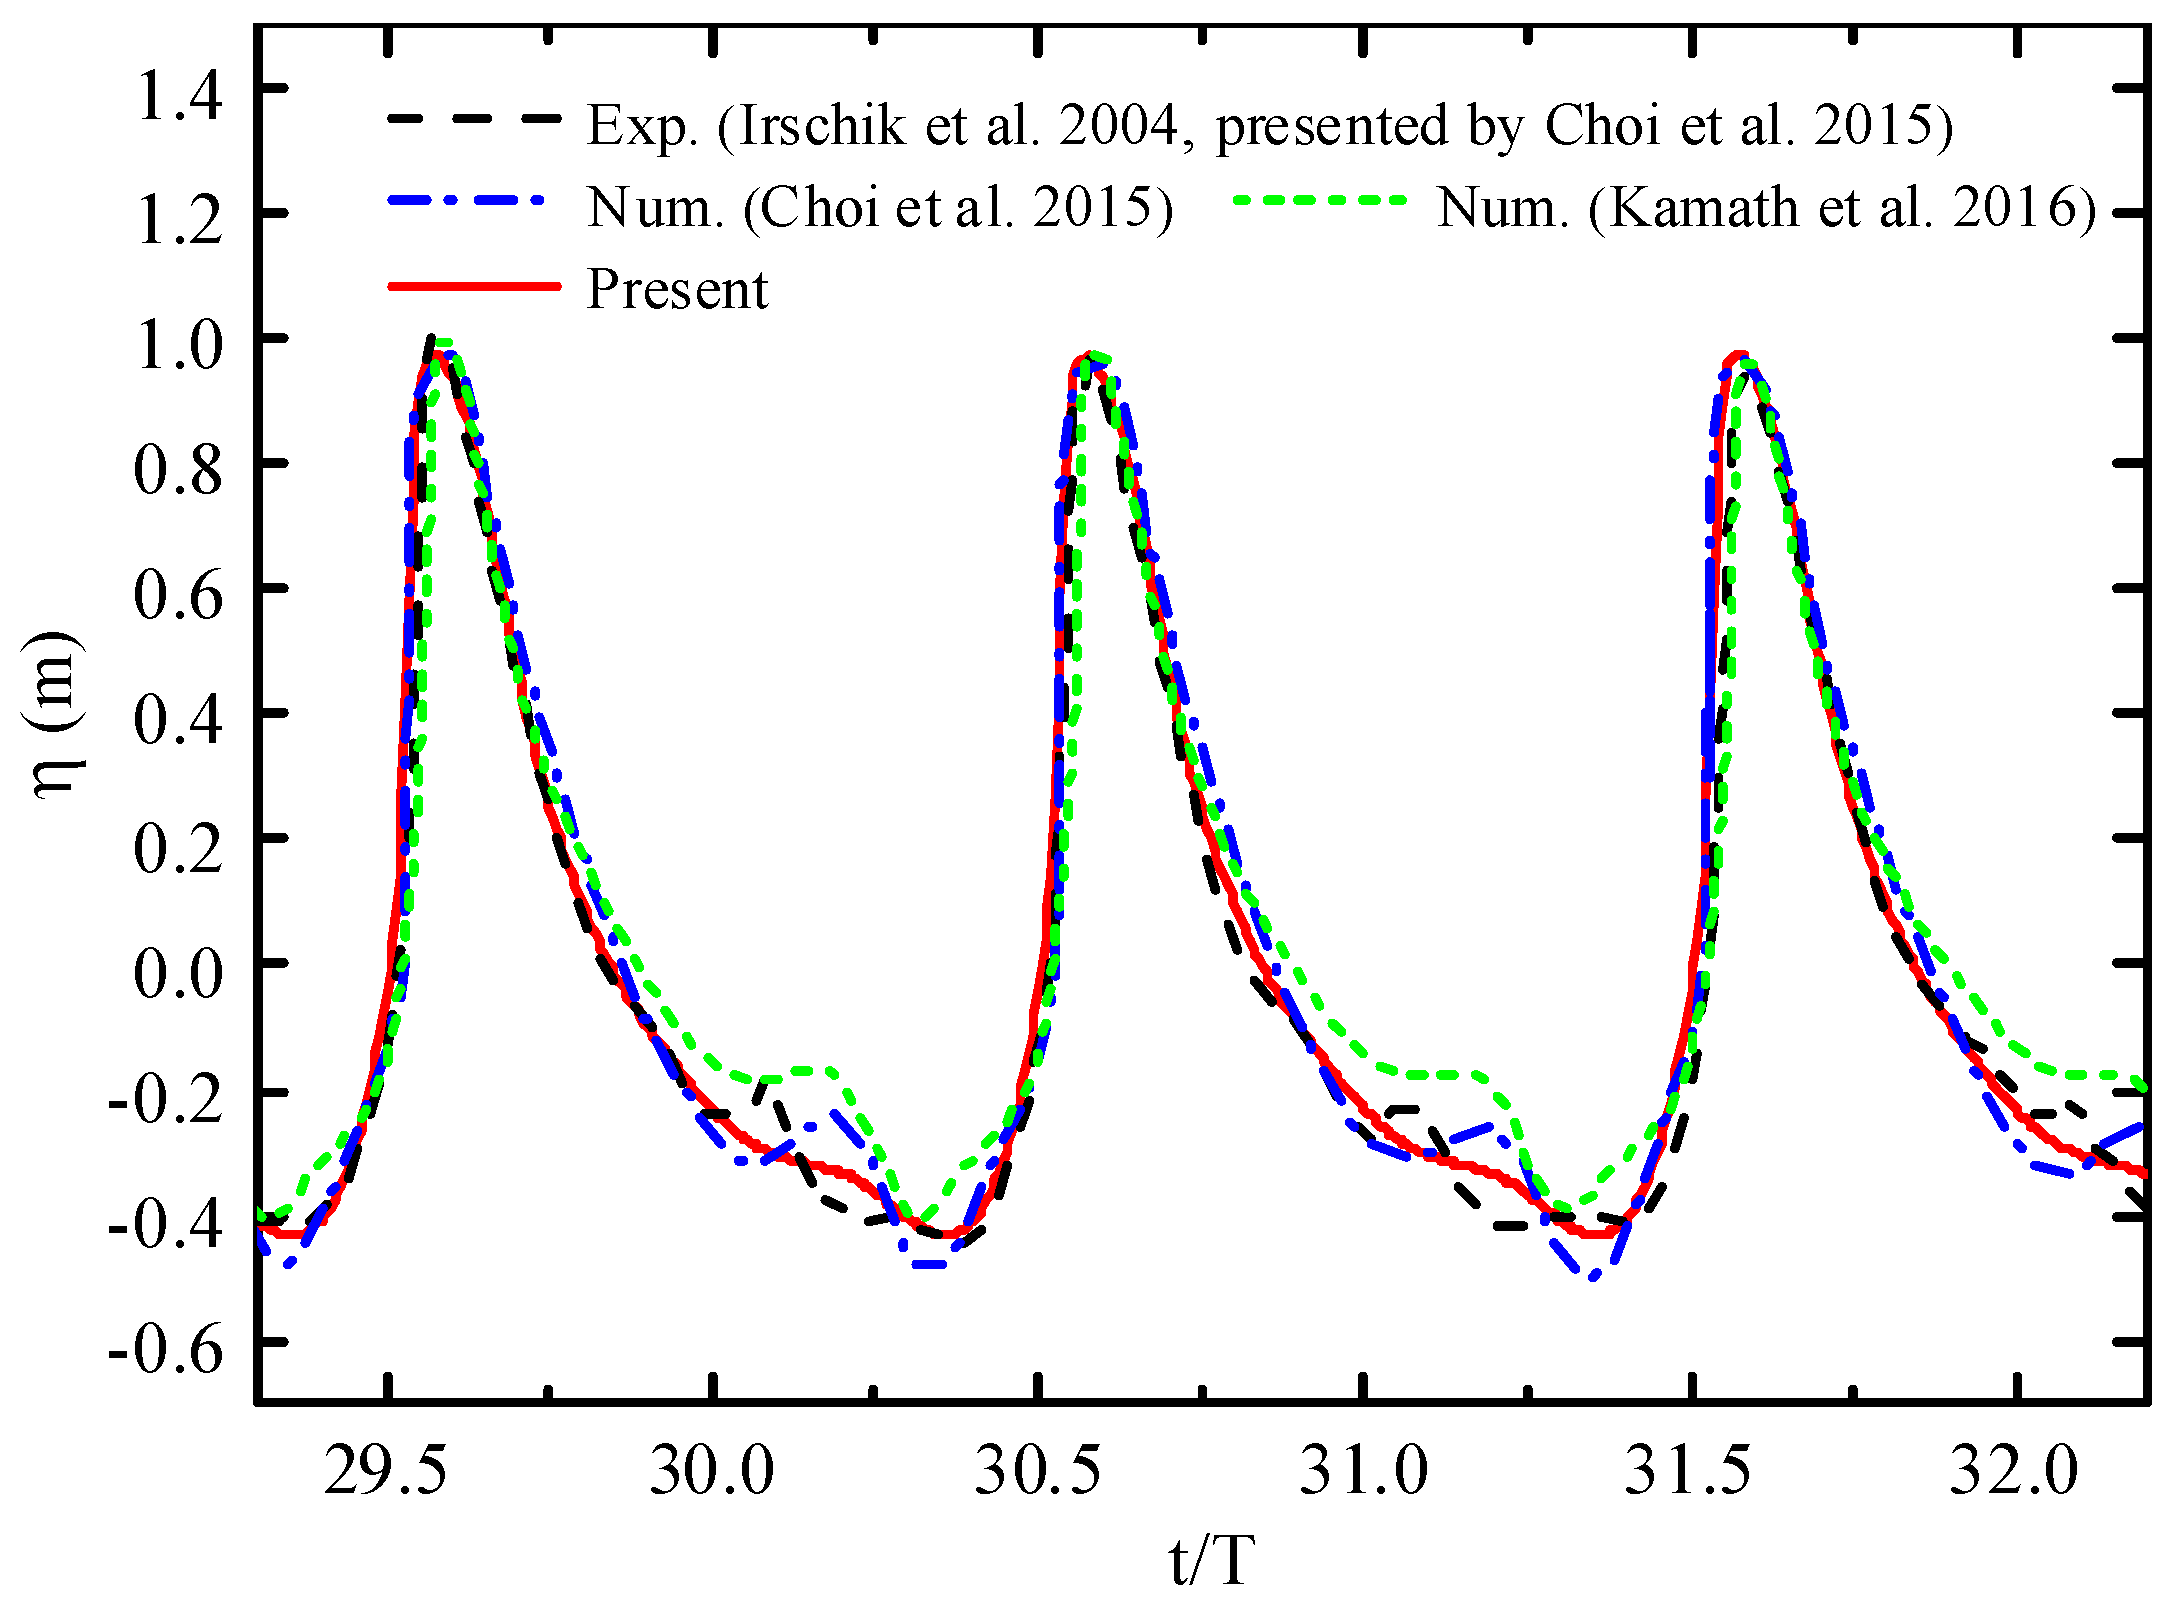
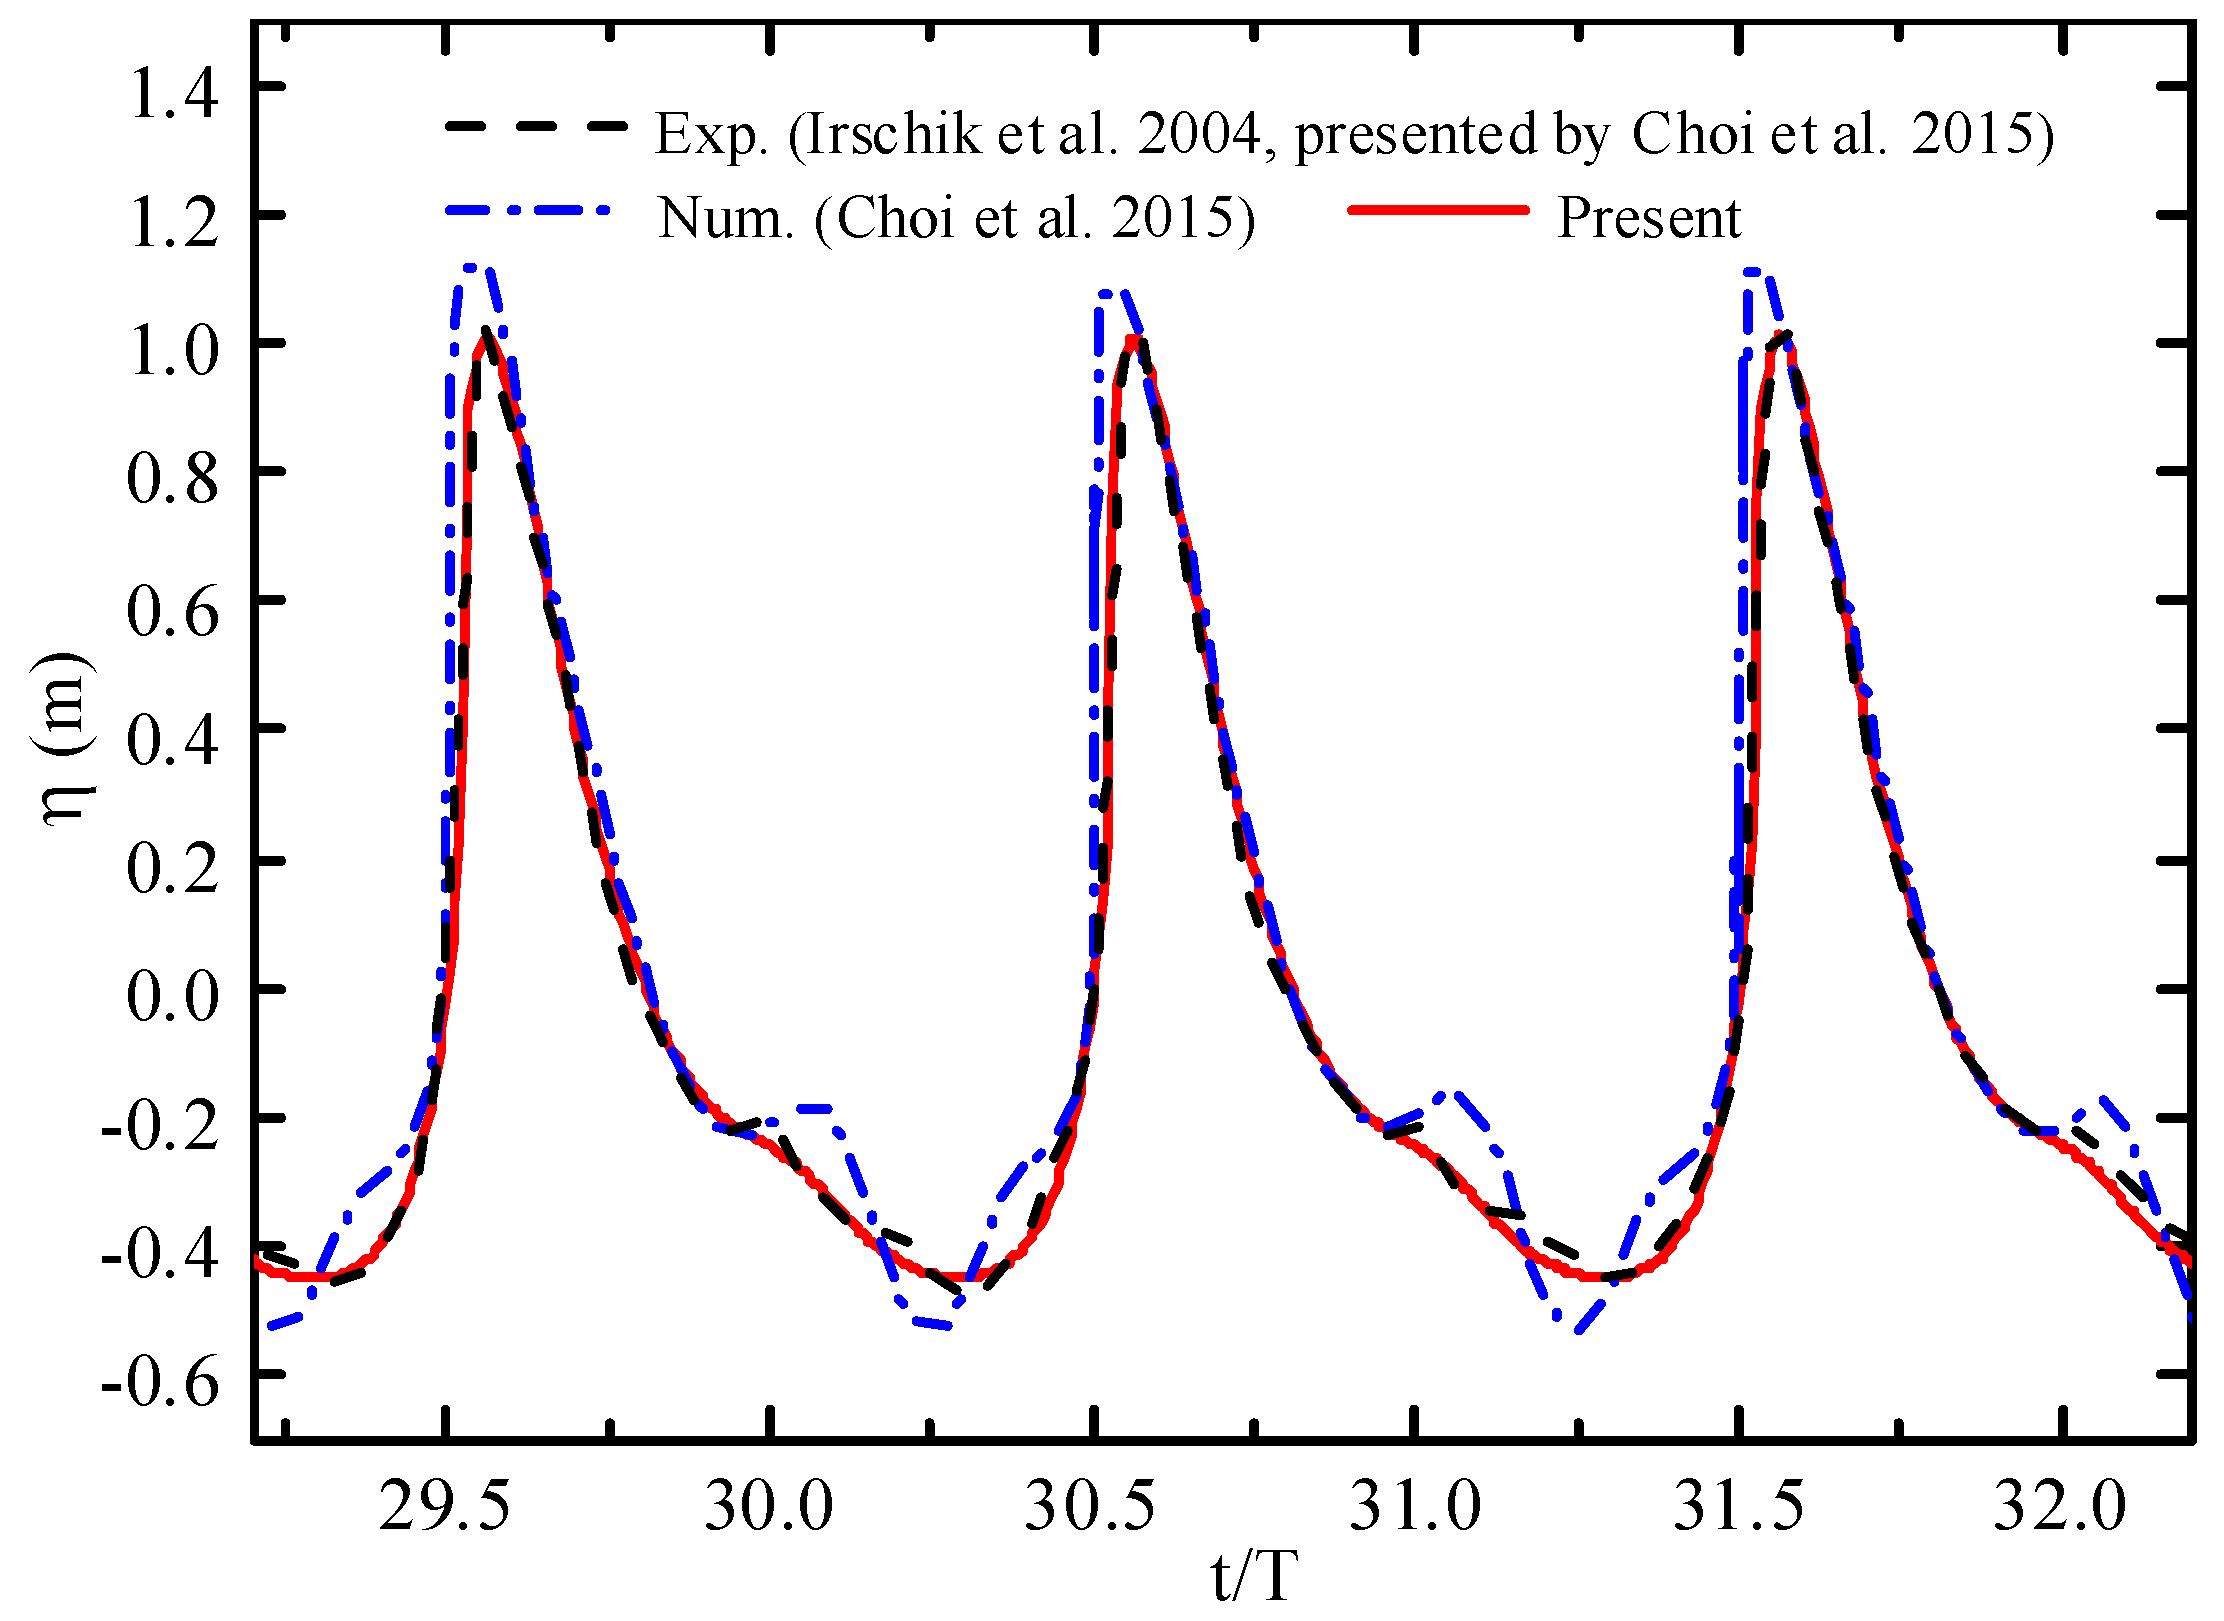
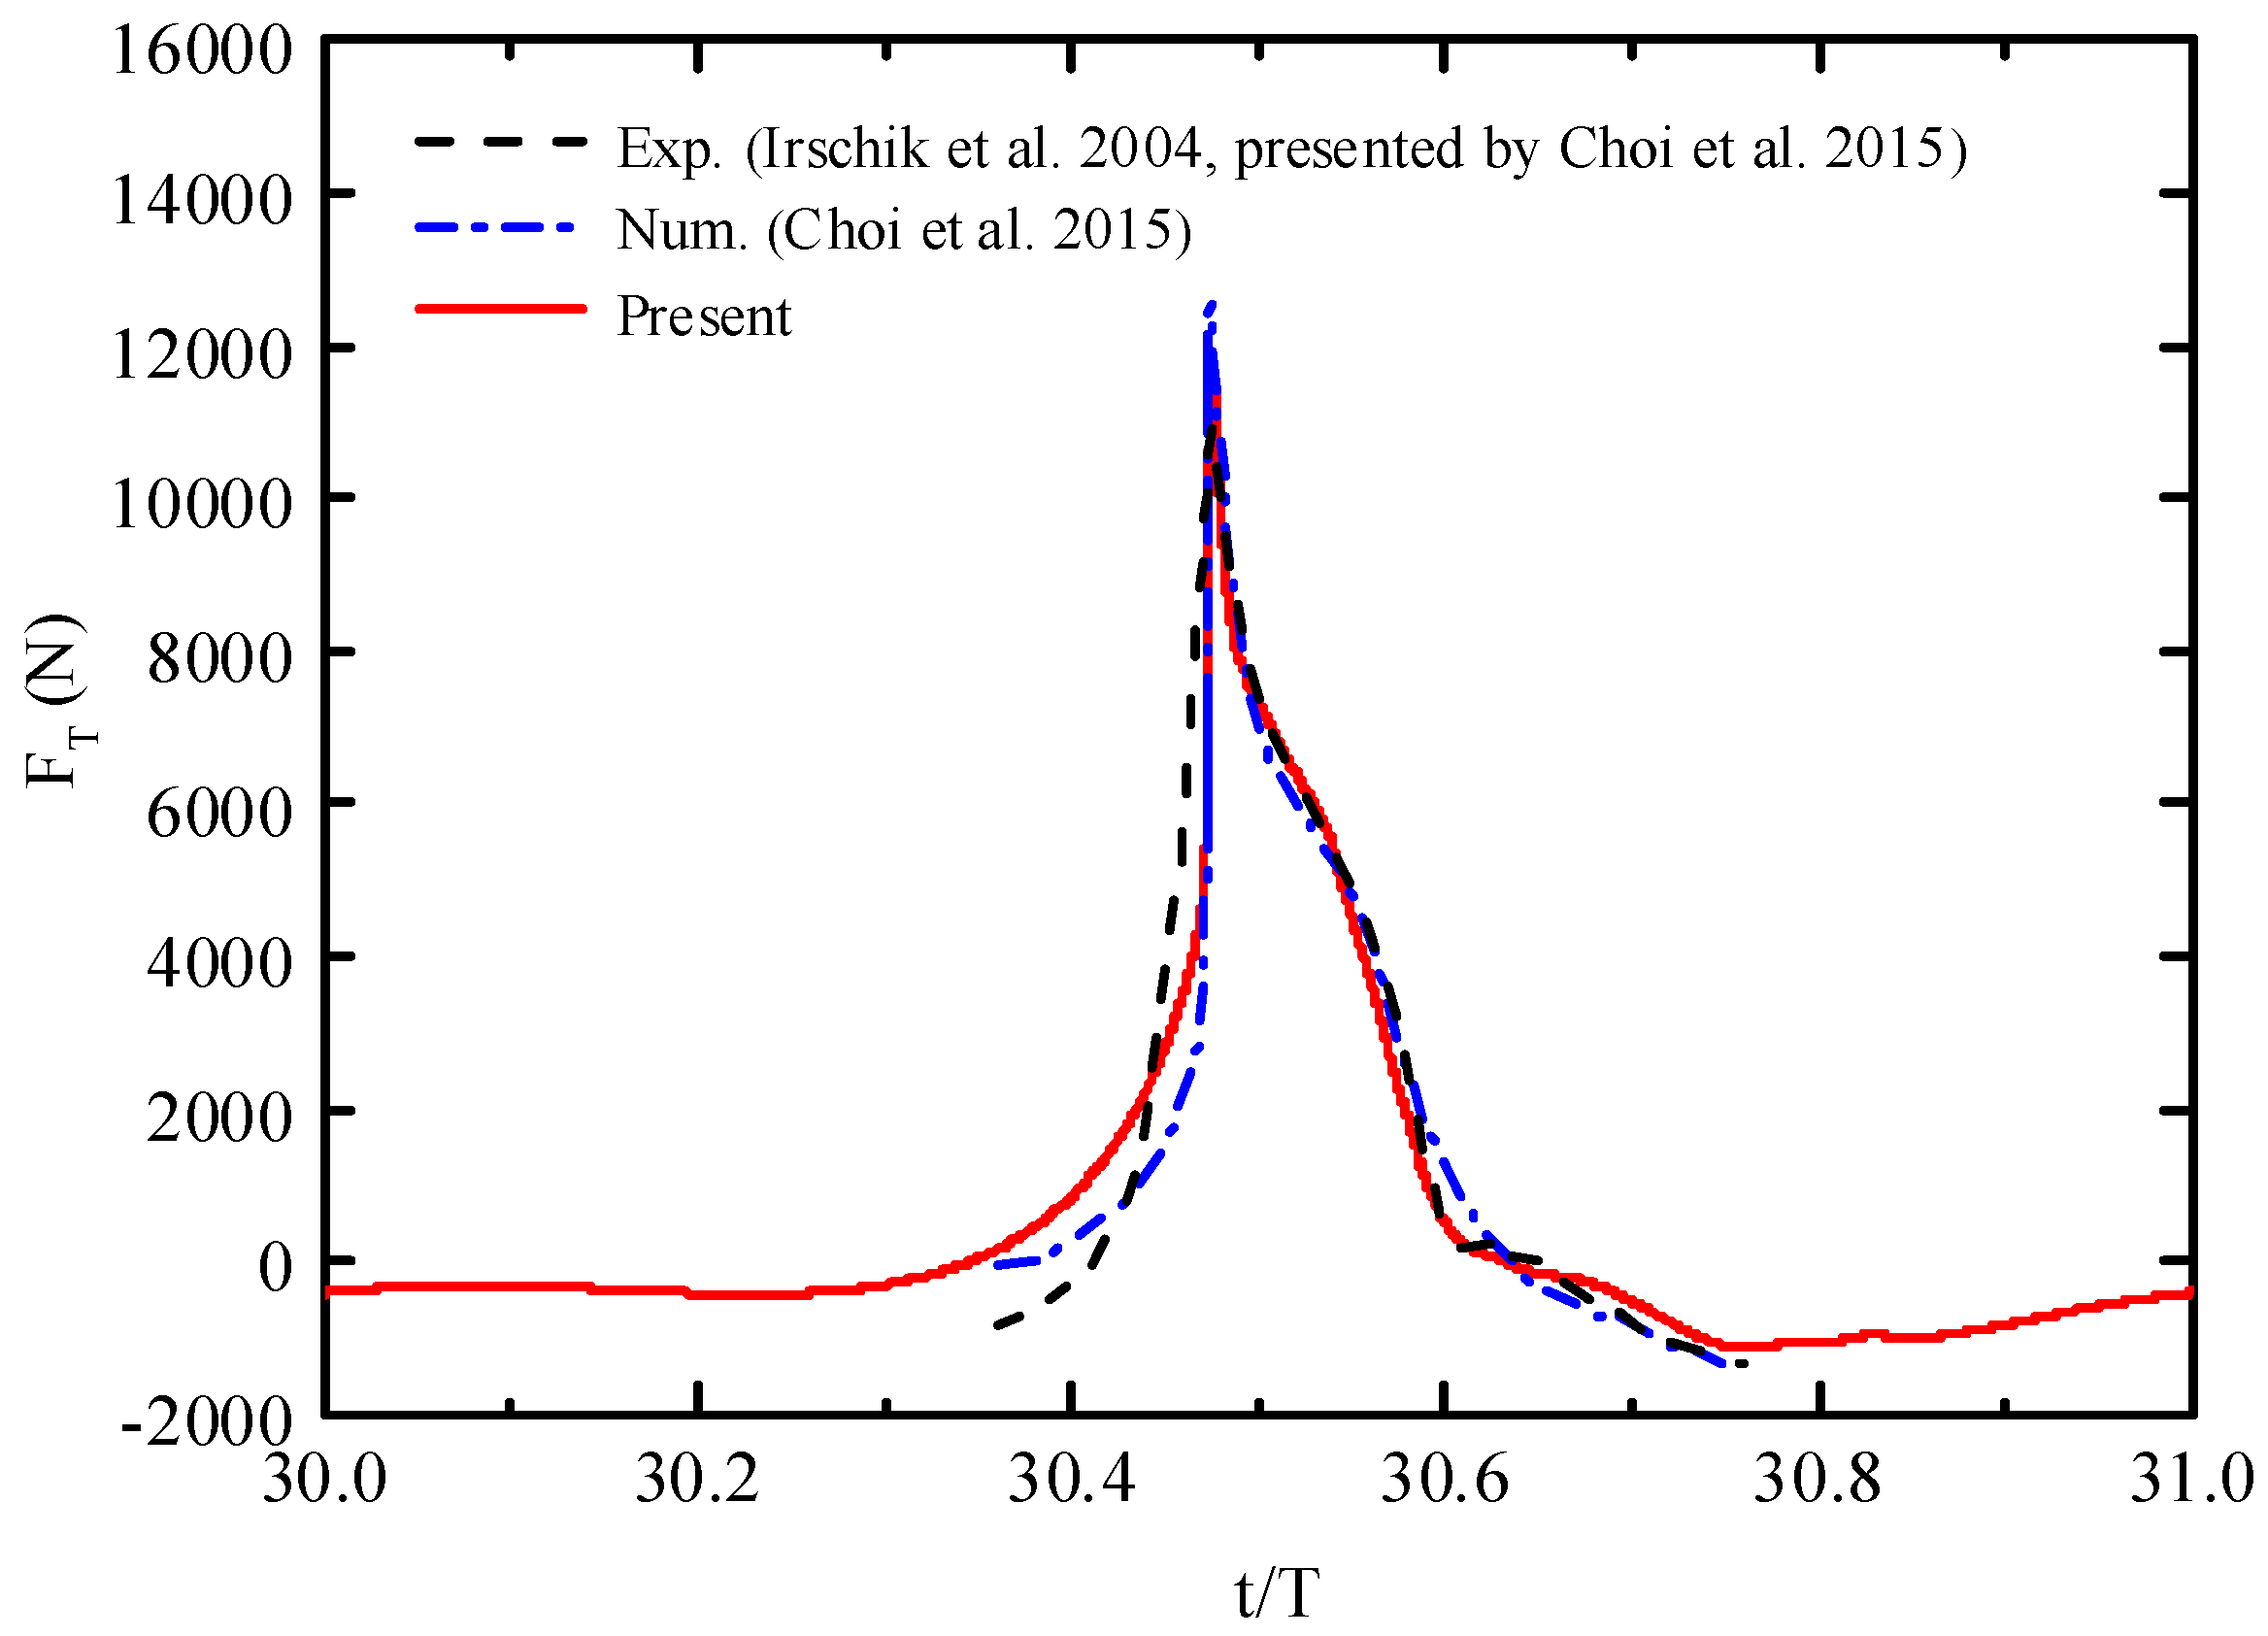
4.1.1. Comparisons of the Present Numerically Simulated Results with the Published Data for a Vertical Cylinder

Figure 5 shows the comparison of the present predicted free surface elevations η at the WG2 location and published data for the vertical cylinder. The present result is in good agreement with the experimental data and the numerical results from Choi et al. [10] and Kamath et al. [11] except for the slight discrepancy at around t/T = 31.1. This could be explained as given below. In the experiment, the wave gauges were installed near the wave tank sidewall to avoid the influence of the measurement equipment on the waves. The interactions between the wave tank sidewall and the wave gauges, as well as the interactions between different wave gauges, can affect the free surface around the measure locations. Figure 6 shows the comparison of the F T on the vertical cylinder over one wave period between the present numerical simulation and the published data. The present computed result of the F T agrees best with the experimental data compared with other numerical simulated results. Meanwhile, the numerical computed rise times obtained by present simulation, Choi et al. [10] and Kamath et al. [11] are ahead of the experimental data at approximately t/T = 30.4. The reason for this is that the assumptions of incompressible flow and rigidly fixed cylinders are applied in the present numerical simulations. However, in the experiment, cylinder vibration, surface irregularities, compressibility of the flow during the impact, and water droplets on the surface of the cylinder may have an effect on the rise time (Choi et al. [10]).

4.1.2. Comparisons of the Present Numerically Simulated Results with the Published Data for an Inclined Cylinder

Figure 7 and Figure 8 show the comparisons between the numerical results and the experimental data in terms of the free surface elevations at WG2 location and the F T on the cylinder with inclined angle φ = −22.5°, respectively. The present predicted free surface elevation agrees reasonably well with the published experimental data. A good agreement is generally observed between the present numerical results and the published experimental data for the F T in Figure 8. The peak value of the F T calculated by present model is slightly overestimated as compared with the experimental peak value, but smaller than the numerical result obtained by Choi et al. [10].The slight discrepancy can also be seen for the rise times of wave forces at around t/T = 30.4 between the numerical simulations and the experimental data. Apart from the reasons mentioned in Section 4.1.1, another critical factor that cannot be ignored is the inclined angle of the cylinder. The rise time and peak value of the force are very sensitive to the inclined angle of the cylinder. In the experiment, the vibration of the cylinder caused by the large wave impact force can change the initial position of the cylinder, which may introduce the measurement inaccuracy.
The two conducted validation studies show that the present numerical model has good performance in predicting free surface elevations and breaking wave forces on the vertical and inclined cylinders. Therefore, the present model is also considered to give reasonable accuracy for simulating breaking wave past a cylinder with different transverse inclined angles.

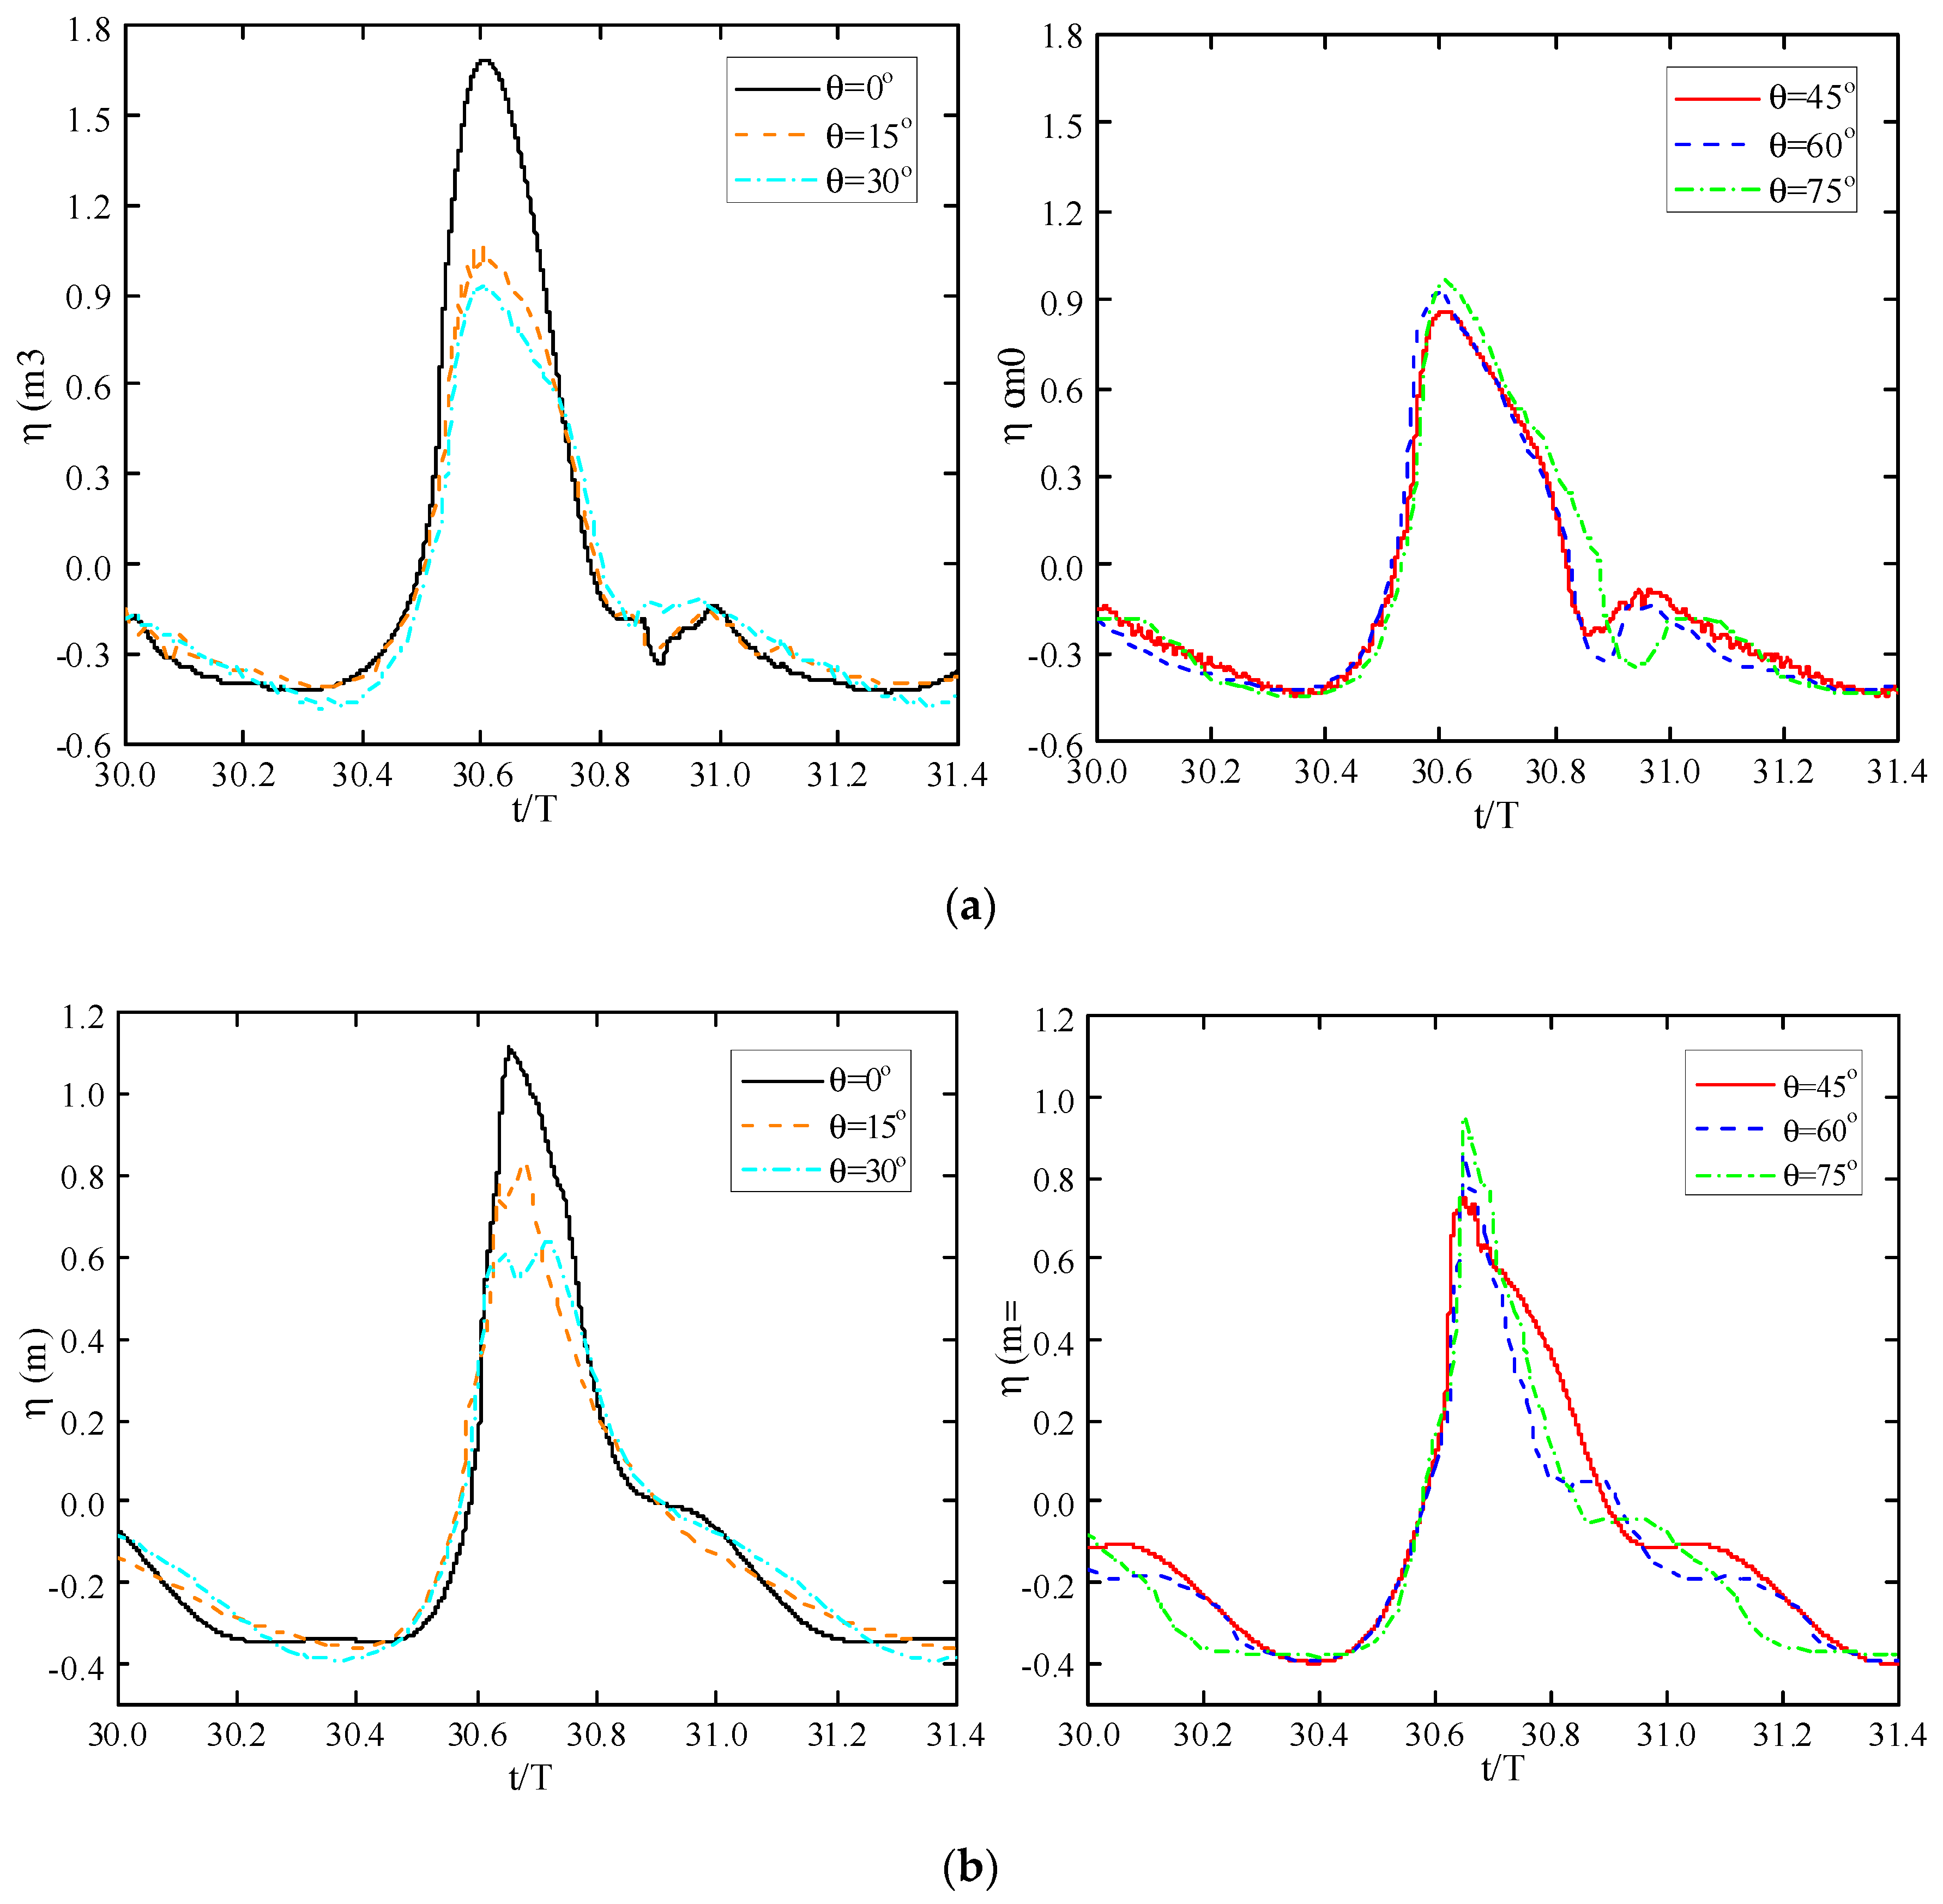
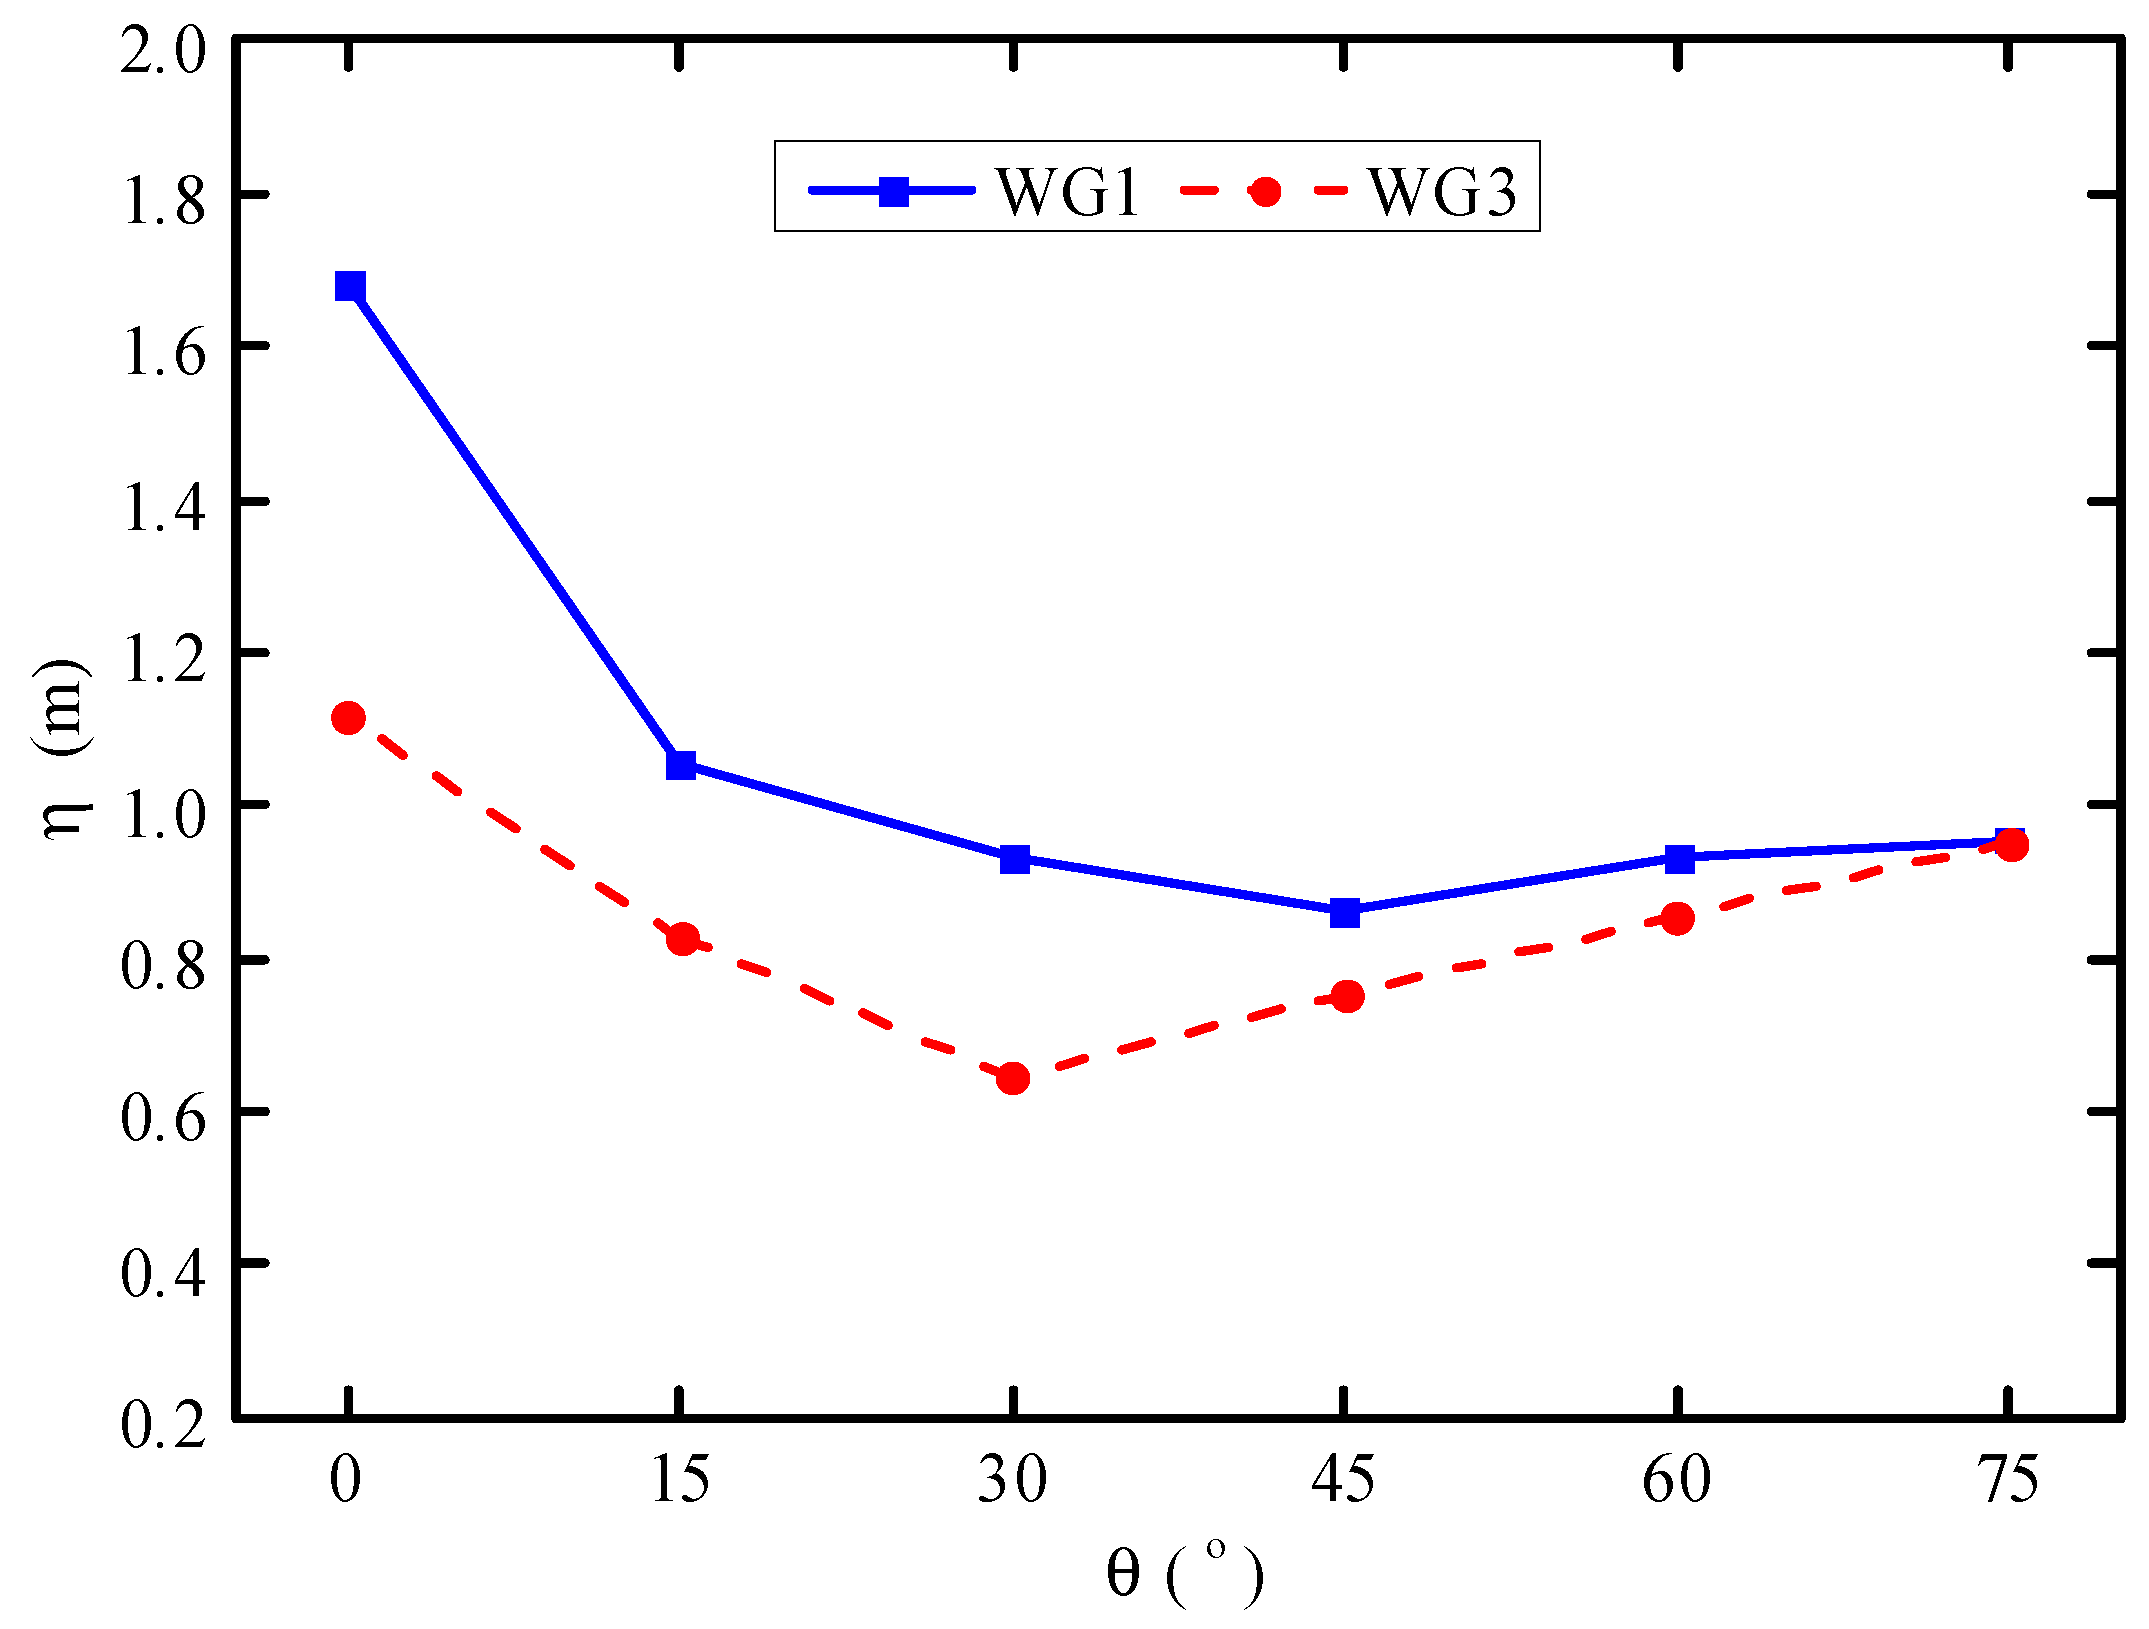
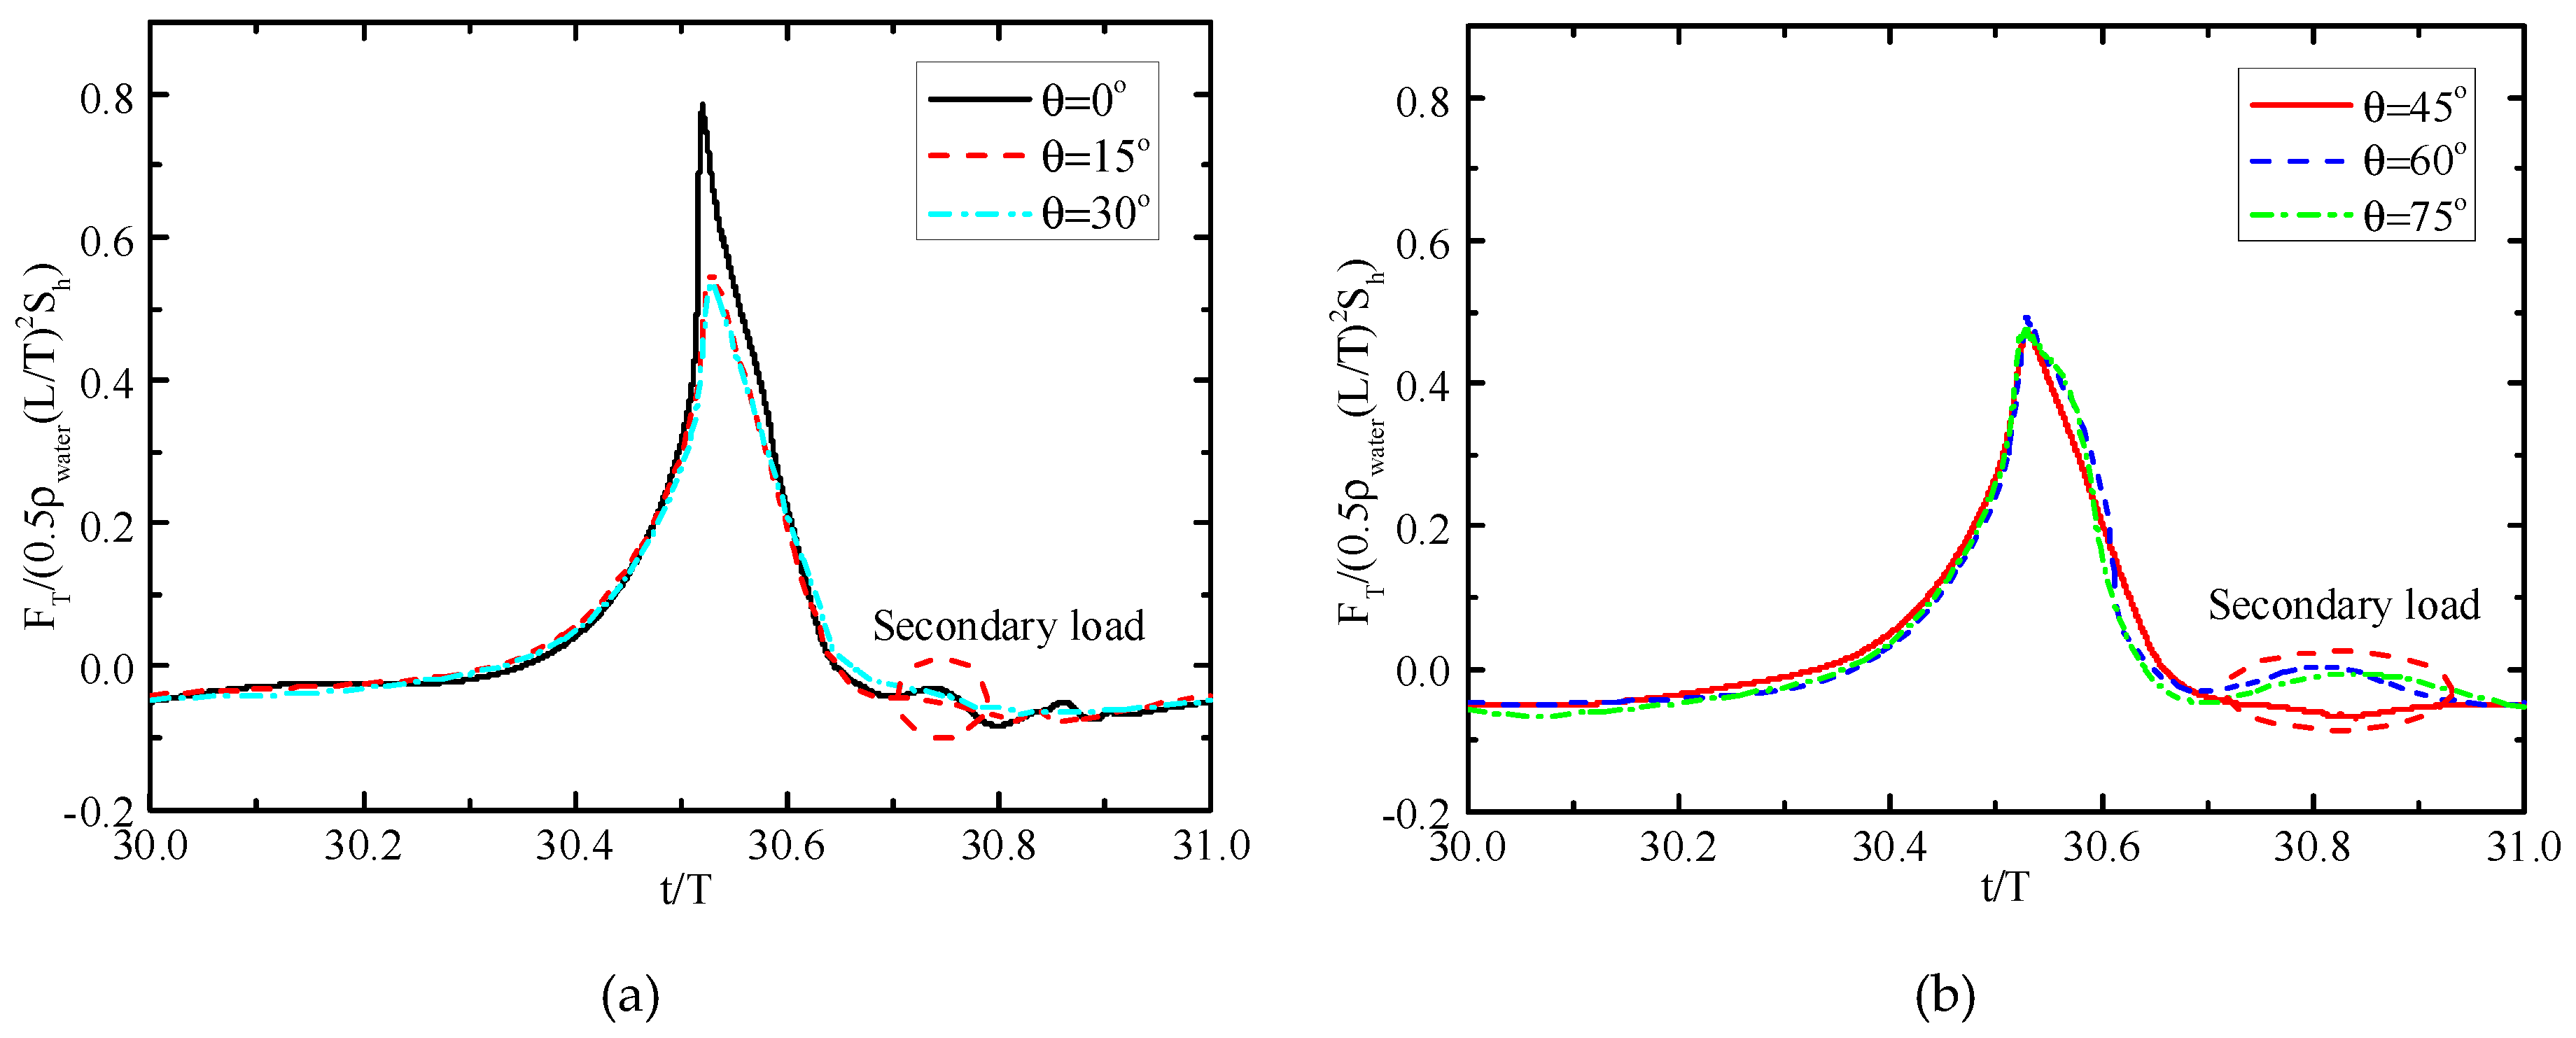
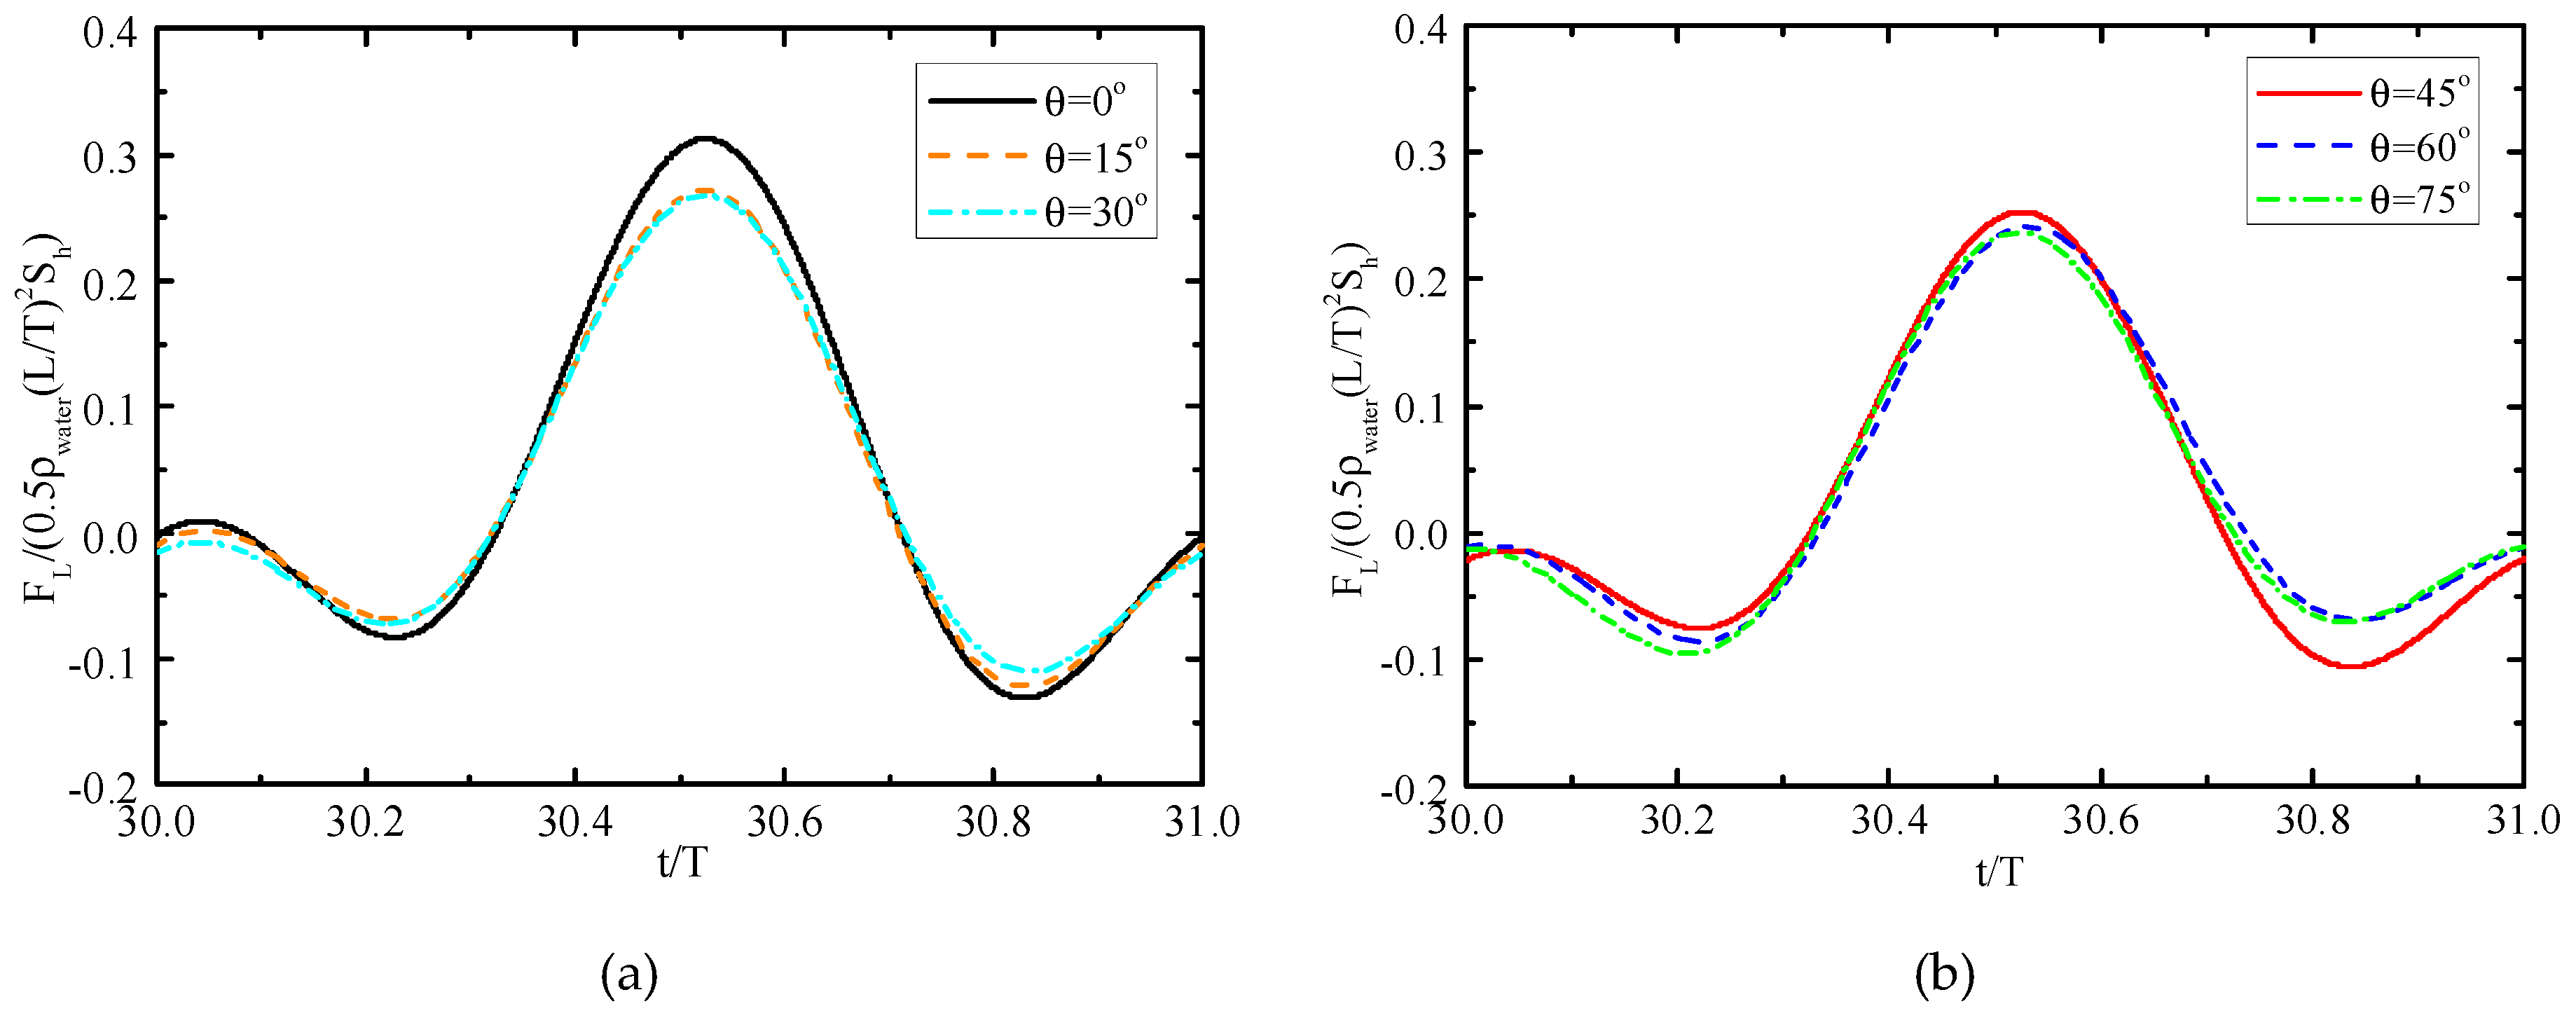
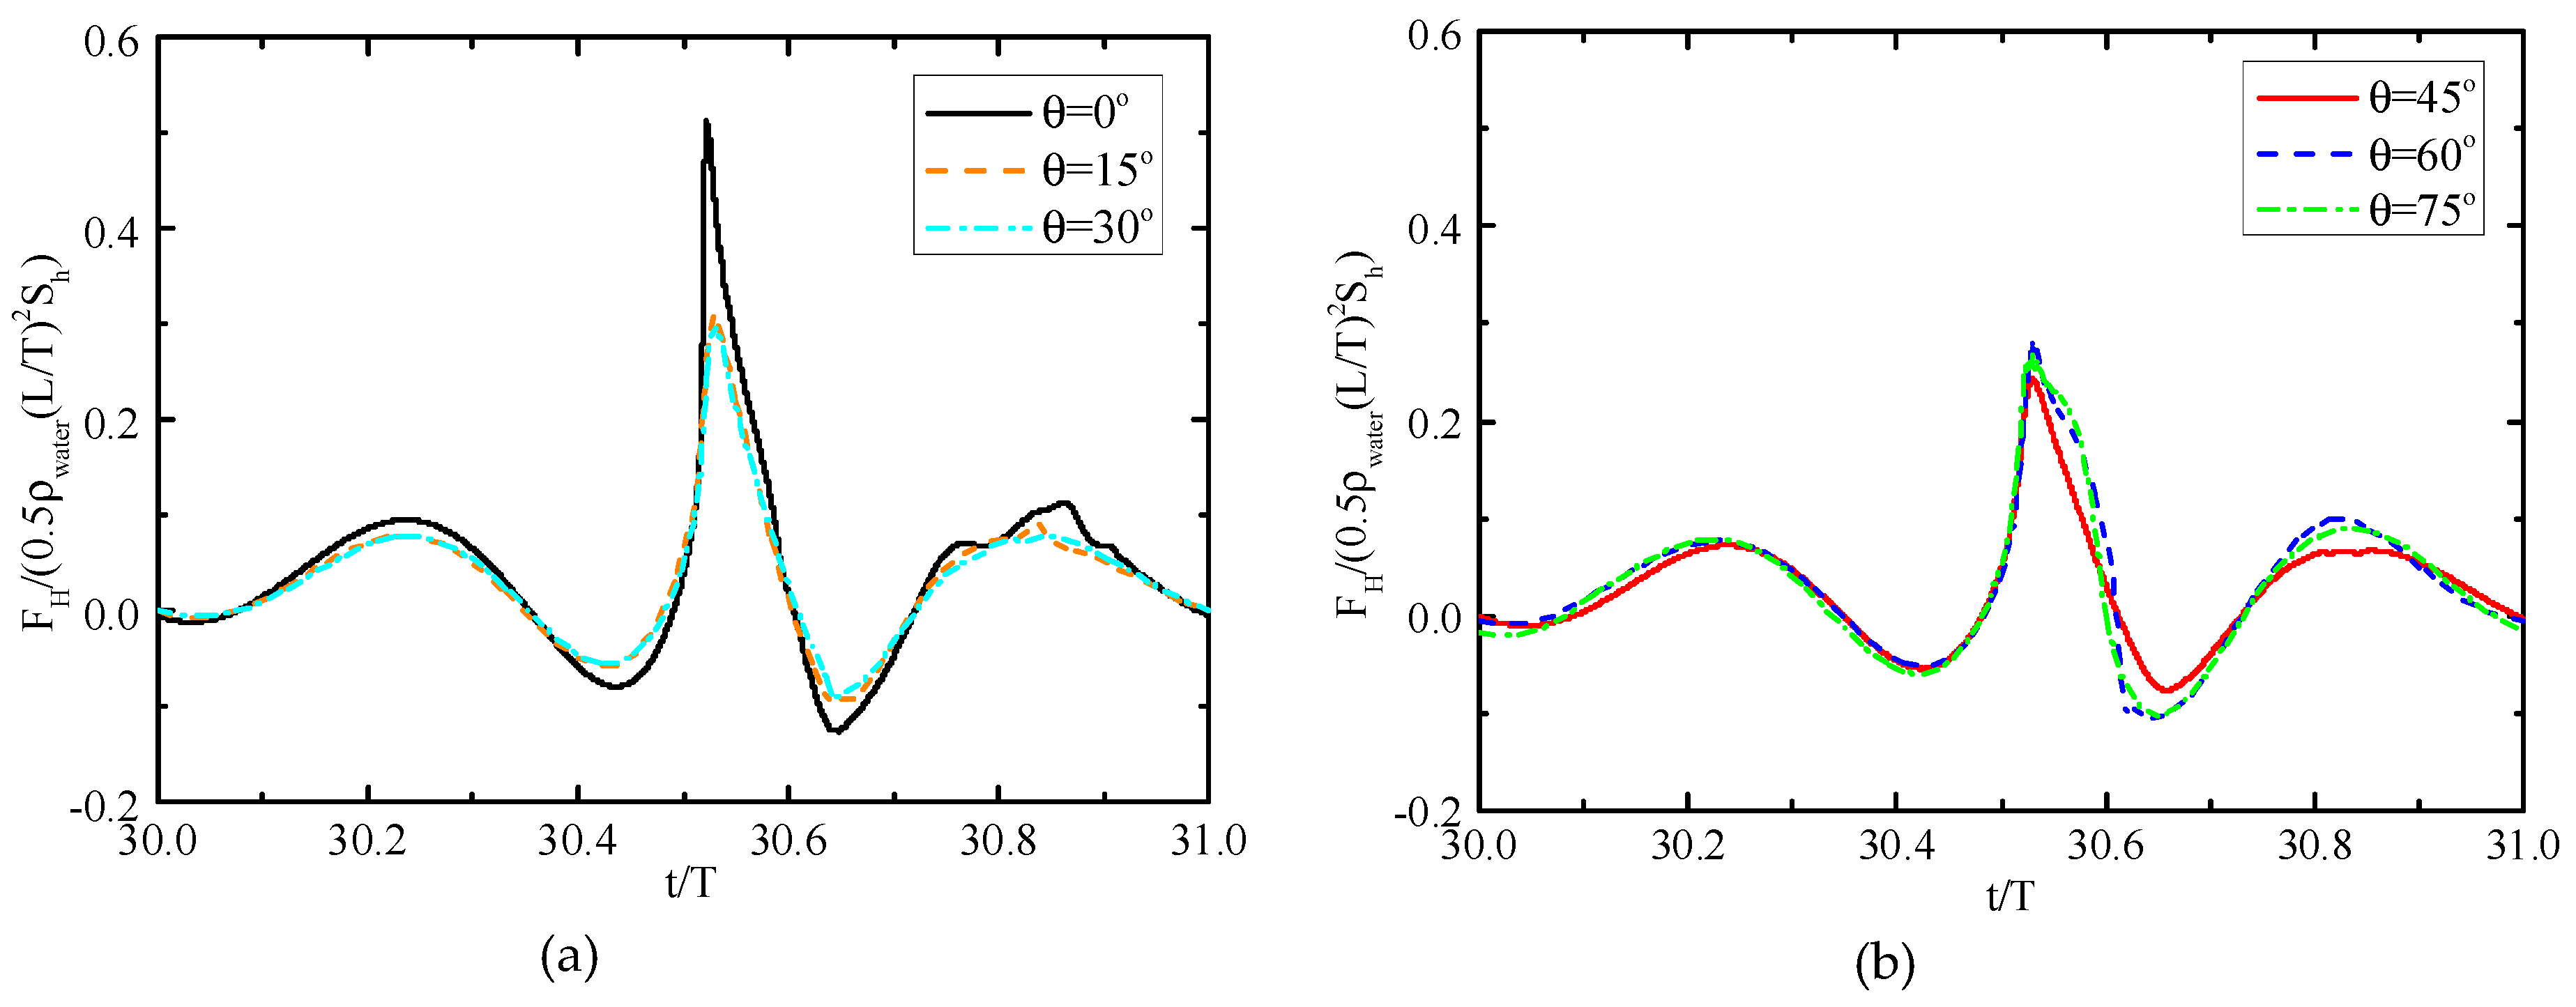
4.2. Characteristics of the Free Surface Elevations and the Breaking Wave Forces on the Standing Cylinder with Different Transverse Inclined Angles

In this section, the free surface elevations and the wave forces on the cylinder with different transverse inclined angle θ are studied. Note that the transverse inclined angle θ is different from the angle φ mentioned in Section 4.1.2. θ is the inclined angle normal to the wave propagating direction and φ is the inclined angle parallel to the wave propagating direction.
Figure 9 depicts the variations of the free surface elevations at WG1 and WG3 locations over one wave period. The peak value of the free surface elevation for the vertical cylinder (θ = 0°) is significantly higher than that for cylinders with other transverse inclined angles at WG1 location. The relative difference of the wave height is reduced by 48.8% when the angle θ varies from 0° to 45°. A small part of the water mass will be reflected due to the existence of the cylinder. Therefore, the second peak of the free surface elevation is also observed in Figure 9a. The maximum value of the wave height at WG3 occurs when the breaking wave passes the vertical cylinder (θ = 0°). Figure 10 shows the peak values of the free surface elevations at WG1 and WG3 for the cases of the cylinder with different θ . The free surface elevation at WG1 decreases first and then increases slightly. The minimum surface elevation is obtained at θ = 45°. The free surface elevation at WG3 gradually decreases with θ varying from 0° to 30° and increases when θ increases from 30° to 75°. This can be explained as given below. When the breaking wave passes a standing cylinder, it will produce a chute-like jet at the back of the cylinder. The height of the chute-like jet is related to transverse inclined angle of the cylinder and decreases with increasing θ . This is the reason that the free surface elevation at WG3 reduces first. With the further increase of θ , the cylinder’s resistance to waves in the vertical direction is weaker, and waves can propagate more easily through the cylinder, which increases the surface elevation.
The forces on the cylinder are normalized by F = F c / ( 0.5 ρ w a t e r ( L / T ) 2 S h ) , where F c represents different compositions of wave forces, L is the wavelength, and S h is the submerged projected area in the direction of wave propagation. Figure 11 shows the normalized F T on the cylinder versus θ over one wave period. The peak of the normalized F T is the largest for the case of the cylinder with θ = 0°. Besides, the secondary load is generated when θ = 0°, 60° and 75°, which are closely associated with the higher-harmonic ringing motion of the cylinder and cause the fatigue and damage of structures [22]. However, the secondary loads cannot be observed for the cases of θ = 30° and θ = 45°, which has a positive effect on the design and installation of cylindrical marine structures.
To further analyze the breaking wave forces characteristics, the total horizontal breaking wave force is decomposed into two parts by using Fast Fourier Transform (FFT), i.e., low-order (first and second orders) wave force F L and high-order wave force F H . Figure 12 depicts the variations of the normalized F L versus θ over one wave period. The normalized F L do not change significantly when the cylinder is placed with different θ . However, the variation of θ has important influence on the normalized F H . It can be seen from Figure 13 that the peak value of the normalized F H on the cylinder with θ = 0° is significantly higher than that for other θ . This implies that the strongest impact phenomenon occurs when the cylinder is perpendicular to the seafloor.
Figure 14 shows the peak values of the normalized wave forces ( F T , F H and F L ) on the cylinder versus θ . The normalized F T has a sharp reduction for θ varying from 0° to 15° and then decreases gently as θ > 15°. However, a relatively small value of the normalized F T is obtained at θ = 45°. The value of the normalized F T decreases 40.9% when θ increases from 0° to 45°. For the normalized F H , the similar trend of the curve can be observed with the normalized F T . The normalized F H decreases with θ varying from 0° to 45° first, and then increases with θ increasing from 45° to 75°. The minimum value is also observed for the case of θ = 45°. The normalized F L decreases slightly as θ increases. When the cylinder is placed with θ = 45°, the ratio of the normalized F H to the normalized F T is also the minimum, i.e., 51.95%. At the same time, the normalized F L and the normalized F H have almost equal contributions to the normalized F T for the case of θ = 45°. It is advantageous for ocean engineering support structures designed as θ = 45° so that the minimal value of the normalized wave forces are obtained. Moreover, the peak values of different compositions forces in different θ are shown in Table 3. The wave forces ( F T , F H and F L ) increase as θ increases apart from θ = 0°. As shown in Figure 13, the main peak of the high-order wave force corresponds the peak of the impact force. Therefore, it is considered that the main component of the high-order wave force is from the wave impact force on the cylinder. Under the same incident waves, the high-order wave force is mainly dependent on the maximum pressure on the cylinder. Comparing Figure 15b and Figure 16b, the maximum pressure on the vertical cylinder is higher than that on the inclined cylinder with θ = 45°. Therefore, the larger high-order wave force on the vertical cylinder is observed at θ = 0°, where as the low-order wave force mainly depends on the area of the cylinder in contact with the wave. The larger submerged area gives the large low-order wave force when θ increases. For the case of vertical cylinder (θ = 0°), the free surface elevation is the highest due to the large wave reflection from the cylinder as shown in Figure 10, which leads to a larger wet surface area as compared to the other transverse inclined angles. Therefore, the large low-order wave force is generated at θ = 0°.

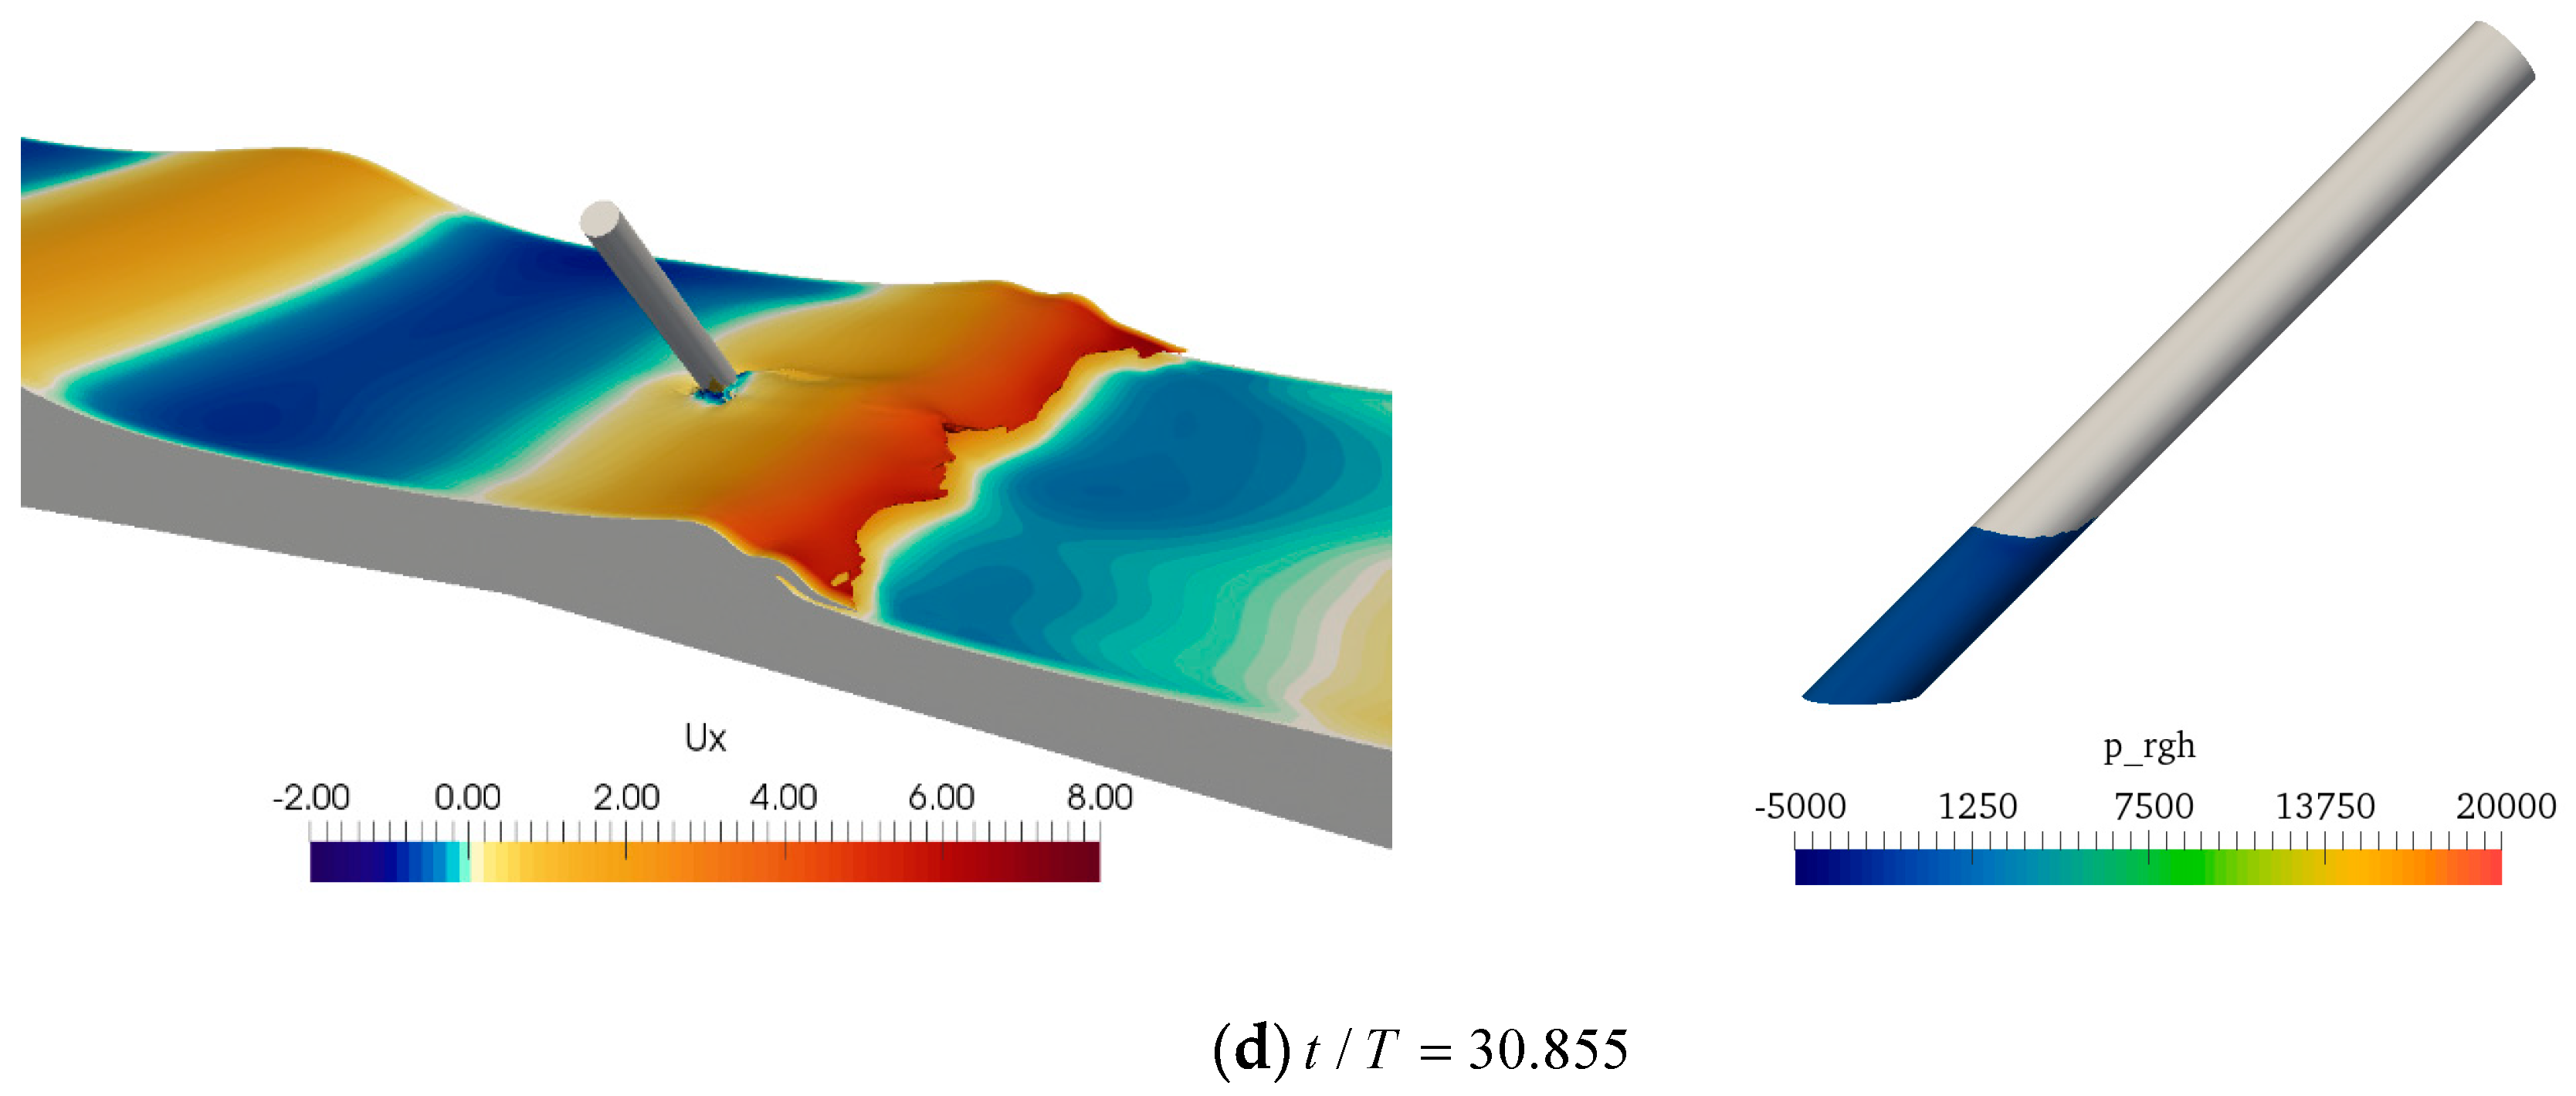
4.3. The Processes of Breaking Waves past the Cylinder

To explore further the mechanism of breaking waves past the cylinders with different transverse inclined angles, the two typical angles θ = 0° and 45° are studied. Figure 15 shows the variations of the free surface with the contour plot of horizontal velocity during the interaction between the breaking wave and a vertical cylinder (θ = 0°). Meanwhile, the pressure p _ r g h on the cylinder is also presented at the corresponding time instants. Before the incident wave reaches the cylinder, the horizontal velocity of the flow field around the cylinder is very low. At this moment, the cylindrical surface is subjected to a minimum pressure, as shown in Figure 15a. With the wave propagating along the slope, the horizontal velocity at the wave crest begins to increase. In Figure 15b, the wave crest almost vertically impacts on the cylinder with high horizontal velocity. The maximum pressure is observed at the corresponding location of the cylinder due to the water velocity reducing to zero in a short time. At the same time, the total horizontal breaking wave force reaches the peak value in Figure 11. The free surface feature corresponding to the second peak of the F T is shown in Figure 15c. As pointed out by Kamath et al. [11], the second peak of wave force plot results from the trailing water mass impacting the cylinder. A chute-like jet produced behind the cylinder is also observed. In Figure 15d, the horizontal breaking wave force on the cylinder drops to a very small value when the wave travels past the cylinder.
Figure 16 shows the free surface deformation and horizontal velocity contours around the cylinder placed with θ = 45°. Before the incident wave arriving at the cylinder, the horizontal velocity of water mass around the cylinder is small and the pressure on the surface of the cylinder is not evident, as shown in Figure 16a. Subsequently, the overturning wave crest impacts the cylinder and produces the maximum pressure on the cylinder in Figure 16b. However, the peak value of pressure is much less than the peak value of the vertical cylinder. It demonstrates that the interaction between the breaking wave and the inclined cylinder is less severe compared to the vertical cylinder, which is consistent with the prediction as shown in Figure 14. When the cylinder is placed with a transverse inclined angle, the wave reflection is weaker than the vertical cylinder case, which eventually results in the smaller horizontal velocity at the wave crest. Another difference between two typical inclined angles is that the chute-like jet behind the cylinder cannot be observed in Figure 16c. It reinforces the aforementioned that the secondary peak of wave force is disappeared when θ = 45°, as shown in Figure 11.

5. Conclusions and Future Work

In this paper, the open-source CFD toolbox waves2Foam based on Open FOAM is employed to numerically simulate breaking waves past a standing cylinder with different transverse inclined angle θ . The present numerical results of the free surface elevations and the horizontal breaking wave forces are in good agreement with the published data. The variation of θ has a significant effect on the characteristics of the wave forces and the free surface elevations.
The vertical cylinder (θ = 0°) is subject to the largest normalized horizontal wave force F T and normalized high-order wave force F H . The high-order wave force has a large contribution to the total horizontal breaking wave force. The minimum ratio of the normalized high-order wave forces to the normalized total horizontal forces is 51.95% when θ = 45°. Concurrently, the minimum normalized F H occurs for the case of the cylinder with θ = 45°. The normalized low-order wave force, F L , slightly decreases as the θ increases. For the free surface elevations in front of the cylinder, the largest value is obtained when the breaking wave past a vertical cylinder and the minimum value is observed for the cylinder with θ = 45°. The secondary load cycle phenomenon is not observed when the cylinder is placed with θ = 30° and 45°.
In future work, the breaking wave past two cylinders in tandem will be conducted to study the effect of the distance between two cylinders and transverse inclined angles on the forces. Meanwhile, the breaking wave past the structures with different shapes will be also investigated.

Author Contributions

Conceptualization, S.Q., S.L. and M.C.O.; Methodology, S.Q., S.L., S.S., M.C.O. and H.R.; Software, S.Q. and S.L.; Validation, S.Q., S.L., S.S. and M.C.O.; Formal analysis, S.Q. and S.L.; Funding acquisition, S.S., M.C.O. and H.R.; Writing—original draft, S.Q. and S.L.; Writing—review and editing, S.Q., S.L., S.S., M.C.O. and H.R. All authors have read and agree to the published version of the manuscript.

Funding

This research was supported in part with computational resources provided by the Norwegian Metacenter for Computational Science (NOTUR), under Project No: NN9372K; The National K&D Program of China (2018YFC0310500) and Fundamental Research Funds for the Central Universities (3072019CF0104).

Conflicts of Interest

The authors declare no conflicts of interest.

References

  1. Apelt, C.; Piorewicz, J. Interference effects on breaking wave forces on rows of vertical cylinders. In Proceedings of the First Australasian Port, Harbour & Offshore Engineering Conference 1986, Sydney, Australia, 29 September–2 October 1986; p. 191. [Google Scholar]
  2. Wienke, J.; Sparboom, U.; Oumeraci, H. Breaking wave impact on a slender cylinder. Coast. Eng. 2000, 2001, 1787–1798. [Google Scholar]
  3. Irschik, K.; Sparboom, U.; Oumeraci, H. Breaking wave loads on a slender pile in shallow water. Coast. Eng. 2005, 4, 568–580. [Google Scholar]
  4. Arntsen, Ø.; Ros Collados, X.; Tørum, A. Impact forces on a vertical pile from plunging breaking waves. Coast. Struct. 2013, 2, 533–544. [Google Scholar]
  5. Christensen, E.D.; Bredmose, H.; Hansen, E.A. Extreme wave forces and wave run-up on offshore wind turbine foundations. In Proceedings of the Copenhagen Offshore Wind, Copenhagen, Denmark, 26–28 October 2005; pp. 1–10. [Google Scholar]
  6. Shao, S. Simulation of breaking wave by SPH method coupled with k-ε model. J. Hydraul. Res. 2006, 44, 338–349. [Google Scholar] [CrossRef]
  7. Chow, A.D.; Rogers, B.D.; Lind, S.J.; Stansby, P.K. Numerical wave basin using incompressible smoothed particle hydrodynamics (ISPH) on a single GPU with vertical cylinder test cases. Comput. Fluids 2019, 179, 543–562. [Google Scholar] [CrossRef]
  8. Bredmose, H.; Jacobsen, N.G. Breaking wave impacts on offshore wind turbine foundations: Focused wave groups and CFD. In Proceedings of the ASME 2010 29th International Conference on Ocean, Offshore and Arctic Engineering, Shanghai, China, 6–11 June 2010; pp. 397–404. [Google Scholar]
  9. Xiao, H.; Huang, W. Three-dimensional numerical modeling of solitary wave breaking and force on a cylinder pile in a coastal surf zone. J. Eng. Mech. 2014, 141, A4014001. [Google Scholar] [CrossRef]
  10. Choi, S.-J.; Lee, K.-H.; Gudmestad, O.T. The effect of dynamic amplification due to a structure׳ s vibration on breaking wave impact. Ocean Eng. 2015, 96, 8–20. [Google Scholar] [CrossRef]
  11. Kamath, A.; Chella, M.A.; Bihs, H.; Arntsen, Ø.A. Breaking wave interaction with a vertical cylinder and the effect of breaker location. Ocean Eng. 2016, 128, 105–115. [Google Scholar] [CrossRef]
  12. Chella, M.A.; Bihs, H.; Myrhaug, D.; Muskulus, M. Breaking solitary waves and breaking wave forces on a vertically mounted slender cylinder over an impermeable sloping seabed. J. Ocean Eng. Mar. Energy 2017, 3, 1–19. [Google Scholar]
  13. Jose, J.; Choi, S.-J. Estimation of slamming coefficients on local members of offshore wind turbine foundation (jacket type) under plunging breaker. Int. J. Nav. Archit. Ocean Eng. 2017, 9, 624–640. [Google Scholar] [CrossRef]
  14. Liu, S.; Jose, J.; Ong, M.C.; Gudmestad, O.T. Characteristics of higher-harmonic breaking wave forces and secondary load cycles on a single vertical circular cylinder at different Froude numbers. Mar. Struct. 2019, 64, 54–77. [Google Scholar] [CrossRef]
  15. Liu, S.; Ong, M.C.; Obhrai, C. Numerical Simulations of Breaking Waves and Steep Waves Past a Vertical Cylinder at Different Keulegan–Carpenter Numbers. J. Offshore Mech. Arctic Eng. 2019, 141. [Google Scholar] [CrossRef]
  16. Menter, F.R.; Kuntz, M.; Langtry, R. Ten years of industrial experience with the SST turbulence model. Turbul. Heat Mass Transf. 2003, 4, 625–632. [Google Scholar]
  17. Brown, S.; Greaves, D.; Magar, V.; Conley, D. Evaluation of turbulence closure models under spilling and plunging breakers in the surf zone. Coast. Eng. 2016, 114, 177–193. [Google Scholar] [CrossRef] [Green Version]
  18. Hirt, C.W.; Nichols, B.D. Volume of fluid (VOF) method for the dynamics of free boundaries. J. Comput. Phys. 1981, 39, 201–225. [Google Scholar] [CrossRef]
  19. Mayer, S.; Garapon, A.; Sørensen, L.S. A fractional step method for unsteady free-surface flow with applications to non-linear wave dynamics. Int. J. Numer. Methods Fluids 1998, 28, 293–315. [Google Scholar] [CrossRef]
  20. Jacobsen, N.G.; Fuhrman, D.R.; Fredsøe, J. A wave generation toolbox for the open-source CFD library: OpenFoam®. Int. J. Numer. Methods Fluids 2012, 70, 1073–1088. [Google Scholar] [CrossRef]
  21. Openfoam User Guide. Available online: https://cfd.direct/openfoam/user-guide/ (accessed on 2 March 2017).
  22. Stansberg, C. Comparing ringing loads from experiments with cylinders of different diameters—an empirical study. In Proceedings of the BOSS ‘97 Conference, Delft, The Netherlands, 1 July 1997. [Google Scholar]
Figure 1. The layout of the numerical wave tank: front view (top); side view (right); plan view (bottom).
Applsci 10 01347 g001
Figure 2. Grid refinement study for the breaking wave forces on the vertical cylinder.
Applsci 10 01347 g002
Figure 3. Time-step refinement study for the breaking wave forces on the vertical cylinder.
Applsci 10 01347 g003
Figure 4. The plan view (a) and front view(b) of the medium mesh near the vertical cylinder.
Applsci 10 01347 g004
Figure 5. Comparison of free surface elevations at WG2 between the present result and the published data for the vertical cylinder.
Applsci 10 01347 g005
Figure 6. Comparison of breaking wave forces between the present result and the published data for the vertical cylinder.
Applsci 10 01347 g006
Figure 7. Comparison of free surface elevations at WG2 between the present result and the published data for the inclined cylinder (φ = −22.5°).
Applsci 10 01347 g007
Figure 8. Comparison of breaking wave forces between the present result and the published data for the inclined cylinder (φ = −22.5°).
Applsci 10 01347 g008
Figure 9. Variations of the free surface elevations around the cylinder with normalized time: (a) free surface elevations before the cylinder (WG1); (b) free surface elevations behind of cylinder (WG3).
Applsci 10 01347 g009
Figure 10. Comparison of the peak values of the free surface elevations around the cylinder with different transverse inclined angles θ .
Applsci 10 01347 g010
Figure 11. Variation of the normalized horizontal breaking wave forces on the cylinder in different transverse inclined angles. (a) θ = 0°, 15°, 30°; (b) θ = 45°, 60°, 75°.
Applsci 10 01347 g011
Figure 12. Variation of the normalized low-order wave forces on the cylinder in different transverse inclined angles. (a) θ = 0°, 15°, 30°; (b) θ = 45°, 60°, 75°.
Applsci 10 01347 g012
Figure 13. Variation of the normalized high-order wave forces on the cylinder in different transverse inclined angles. (a) θ = 0°, 15°, 30°; (b) θ = 45°, 60°, 75°.
Applsci 10 01347 g013
Figure 14. Comparison of the maximum normalized wave forces with transverse inclined angles θ .
Applsci 10 01347 g014
Figure 15. Free surface elevations around the vertical cylinder with horizontal velocity contours (left). Dynamic pressure on the cylinder from the wave propagation view (right): (a) t/T = 30.275, (b) t/T = 30.53, (c) t/T =30.75, and (d) t/T = 30.8075.
Applsci 10 01347 g015aApplsci 10 01347 g015b
Figure 16. Free surface elevations around the inclined cylinder (θ = 45°) with horizontal velocity contours (left). Dynamic pressure on the cylinder from the wave propagation view (right): (a) t/T = 30.375, (b) t/T = 30.555, (c) t/T = 30.7125, and (d) t/T = 30.855.
Applsci 10 01347 g016aApplsci 10 01347 g016b
Table 1. Overview of six cases with different transverse inclined angles (H = 1.3 m, T = 4.0 s, d = 3.8 m).
CaseTransverse Inclined Angle θ (°)
A0
B15
C30
D45
E60
F75
Table 2. The resolutions of three different meshes.
MeshNear the Cylinder (m)
Max(Δx, Δy, Δz)
At Wave Generator (m)
Max(Δx, Δy, Δz)
Number of Total Grids
Coarse mesh (0.12, 0.1, 0.08)(0.15, 0.10, 0.08)5,791,152
Medium mesh(0.10, 0.06, 0.05)(0.12, 0.08, 0.05)7,787,600
Fine mesh(0.08, 0.06, 0.045)(0.10, 0.08, 0.045)8,564,864
Table 3. The peak value of wave forces in different transverse inclined angles.
CaseTotal Horizontal Wave Forces FT (N)Low-Order Wave Forces FL (N)High-Order Wave Forces FH (N)
A11,95245547458
B810340584605
C879344594962
D955351614963
E1422869578200
F25,96513,21315,016

