Article

A Comprehensive Peach Fruit Quality Evaluation Method for Grading and Consumption

1
Beijing Laboratory of Food Quality and Safety, College of Engineering, China Agricultural University, Beijing 100083, China
2
College of Information and Electrical Engineering, China Agricultural University, Beijing 100083, China
3
Department of Informatics, University of Rijeka, Radmile Matejčić 2, 51 000 Rijeka, Croatia
4
Faculty of Agriculture, Unit of Horticulture and Landscape Architecture, Department of Pomology, University of Zagreb, Svetošimunska cesta 25, 10000 Zagreb, Croatia
*
Authors to whom correspondence should be addressed.
Appl. Sci. 2020, 10(4), 1348; https://doi.org/10.3390/app10041348
Submission received: 14 January 2020 / Revised: 12 February 2020 / Accepted: 13 February 2020 / Published: 17 February 2020
(This article belongs to the Section Food Science and Technology)

Abstract

:

Featured Application

Based on principal component analysis (PCA), an evaluation and grading model for fresh peaches was developed to provide guidance for the selection of fresh peaches for the consumer market. The approach and findings presented here may be useful for effective evaluation and grading during real-world fruit production; they can potentially improve processing efficiency, reduce costs, and minimize waste in an automated quality evaluation system.

Abstract

Peaches are a popular fruit appreciated by consumers due to their eating quality. Quality evaluation of peaches is important for their processing, inventory control, and marketing. Eleven quality indicators (shape index, volume, mass, density, firmness, color, impedance, phase angle, soluble solid concentration, titratable acidity, and sugar–acid ratio) of 200 peach fruits (Prunus persica (L.) Batsch “Spring Belle”) were measured within 48 h. Quality indicator data were normalized, outliers were excluded, and correlation analysis showed that the correlation coefficients between dielectric properties and firmness were the highest. A back propagation (BP) neural network was used to predict the firmness of fresh peaches based on their dielectric properties, with an overall fitting ratio of 86.9%. The results of principal component analysis indicated that the cumulative variance of the first five principal components was 85%. Based on k-means clustering analysis, normalized data from eleven quality indicators in 190 peaches were classified into five clusters. The proportion of red surface area was shown to be a poor basis for picking fresh peaches for the consumer market, as it bore little relationship with the comprehensive quality scores calculated using the new grading model.

1. Introduction

Peach is a popular fruit appreciated by consumers due to its eating quality. It is rich in a variety of vitamins and minerals, including carbohydrates, organic acids, pigments, phenolics, vitamins, volatiles, antioxidants, and small amounts of proteins and lipids [1,2]. Quality evaluation of peaches is important for processing, inventory control, and marketing. Physical and chemical quality detection methods (detection of firmness, soluble solids concentration, titratable acidity, etc.) accurately determine the quality of the fruit [3,4]. However, these detection methods are time-consuming and require special experimental equipment and conditions, making them impractical during actual production [3].
In many cases, practical peach quality evaluation consists of appearance screening by operators, which is influenced by subjective factors and has a low efficiency and large errors [5]. As labor costs increase, labor-intensive evaluation and grading constitutes a major expense for fresh and processed peach postharvest management [6]. Therefore, they are gradually being replaced by automated evaluation systems based on machine vision, image processing technology, and other emerging detection technologies. These approaches, which include measurement of dielectric properties and hyperspectral imaging, have the potential to improve processing efficiency, reduce costs, and minimize waste [7,8].
For example, Zhang et al. [9] designed a 13-layer convolutional neural network (CNN) for fruit category identification with three types of data augmentation. Rajkumar et al. [10] studied banana quality and maturity using hyperspectral imaging in the visible and near-infrared (400–1000 nm) regions, and Keresztes et al. [11] developed a real-time pixel-based early apple bruise detection system based on hyperspectral imaging (HIS) in the shortwave infrared (SWIR) range. However, the appearance of fruit is often affected by ripening agents and experimental conditions (e.g., simple glossiness, image background), and quality differences cannot be fully captured by imaging [11,12]. Soltani et al. [13] proposed a rapid and non-destructive method for investigating the correlation between the dielectric constant and quality parameters of banana fruit. Ma et al. [14] investigated changes in the dielectric properties of Fuji apples with red-dot disease that were stored at constant temperature, and Du et al. [15] reported that 13 dielectric properties of peaches showed regular changes with increasing frequency. However, further research and more cases are required to apply emerging detection technologies to quality evaluation of fresh fruit.
It is difficult to accurately assess the quality of an entire batch of fruit based on single evaluation indicators and limited samples; such assessments are affected by the experimental environment and the characteristics of the individual fruit sampled [16,17]. Fruit quality evaluation methods combined with multiple detection technologies, therefore, receive significant attention [18,19]. For example, Das et al. [20] described a platform for evaluation of honey quality based on electrical impedance spectroscopy (EIS) and Fourier-transform mid-infrared spectroscopy (FT-MIR), which was used to detect the presence of sucrose as an adulterant in honey varieties from different floral origins. Lubinska-Szczygel et al. [21] used an electronic nose based on ultrafast gas chromatography and gas chromatography with mass spectrometry to analyze the quality of three citrus fruits.
Currently, fruit quality assessment still requires more convenient and effective evaluation methods [22]. In this work, a rapid and simple measurement of electrical properties was used to predict related differences in the quality of fresh peaches. In addition, principal component analysis (PCA) was used to develop a comprehensive method and model for effectively evaluating and grading peach quality. This model can be used to guide consumers’ choices when buying fresh peaches. It is hoped that the approach and findings of this study will promote further research in the field of fresh fruit quality evaluation.

2. Materials and Methods

2.1. Experimental Materials and Instruments

Instruments used in the present work included a handheld LCR (Inductance, capacitance, and resistance) meter (VICTOR 4082, Shenzhen, China, frequency range: 0–100 kHz, target indicators: impedance and phase angle), a Color Tec-PCM Plus 30 mm Benchtop Colorimeter (Color Tec Associates, Clinton, NJ, USA, target indicators: L, a, b, C, and H), a refractometer (PAL-1, ATAGO, Japan, measurement range: brix 0.0%–53.0%, measurement accuracy: brix ±0.2%), a penetrometer (FM200, PCE, Germany) fitted with a 7.9-mm-diameter plunger, a titrator (DCB5000, BOECO, Germany), an electronic scale (OHAUS Adventurer AX2202, NJ, USA), and a digital caliper.
Commercial fresh peaches (Prunus persica (L.) Batsch ‘Spring Belle’) obtained from a supermarket in Zagreb were used as the experimental sample. Two hundred peaches were placed in cold storage at 0 °C and numbered for use in the experiment. The measurement of nine quality indicators was completed within 48 h and was performed in sequential steps: color, shape index, volume, mass, dielectric properties, firmness, soluble solid concentration (SSC), and titratable acid (TA) [23,24]. Two more quality indicators (density and sugar–acid ratio) were acquired by calculation.

2.2. Determination of Indicators

The color of peaches (L, a, b, C, H) was assessed according to the International Commission on Illumination (CIE) Delta E 2000 (CIEDE2000) color space using a colorimeter, and test times were less than three minutes. Test points were selected from most red-colored and the most light-colored parts of the fruit surface, and average values were used for data analysis. The CIEDE2000 formula was developed by members of the CIE Technical Committee, providing an improved procedure for the computation of industrial color differences [25,26]. The formula is as follows:
Δ E = ( Δ L K L S L ) 2 + ( Δ C K C S C ) 2 + ( Δ H K H S H ) 2 + R T ( Δ C K C S C ) ( Δ H K H S H ) ,
where ΔE is the change in color, RT is a hue rotation term, ΔL, ΔC, and ΔH are the compensation differences for neutral colors (primed values; L, C, H), SL is the compensation for lightness, SC is the compensation for chroma, SH is the compensation for hue, and KL, KC, and KH are constants and usually in unity.
Based on the proportion of red area on the surface of the fresh peach, the operator divided the samples into five appearance quality grades. Consumers in the fruit market always choose fresh peaches with more red areas [27].
Peaches were treated as a sphere for volume measurement, and diameter was estimated based on the average of height and width, as shown in Figure 1a. Peach mass was measured using an electronic scale with an error range of 0.01 g. The shape index (height/width) and density (mass/volume) were acquired by calculation.
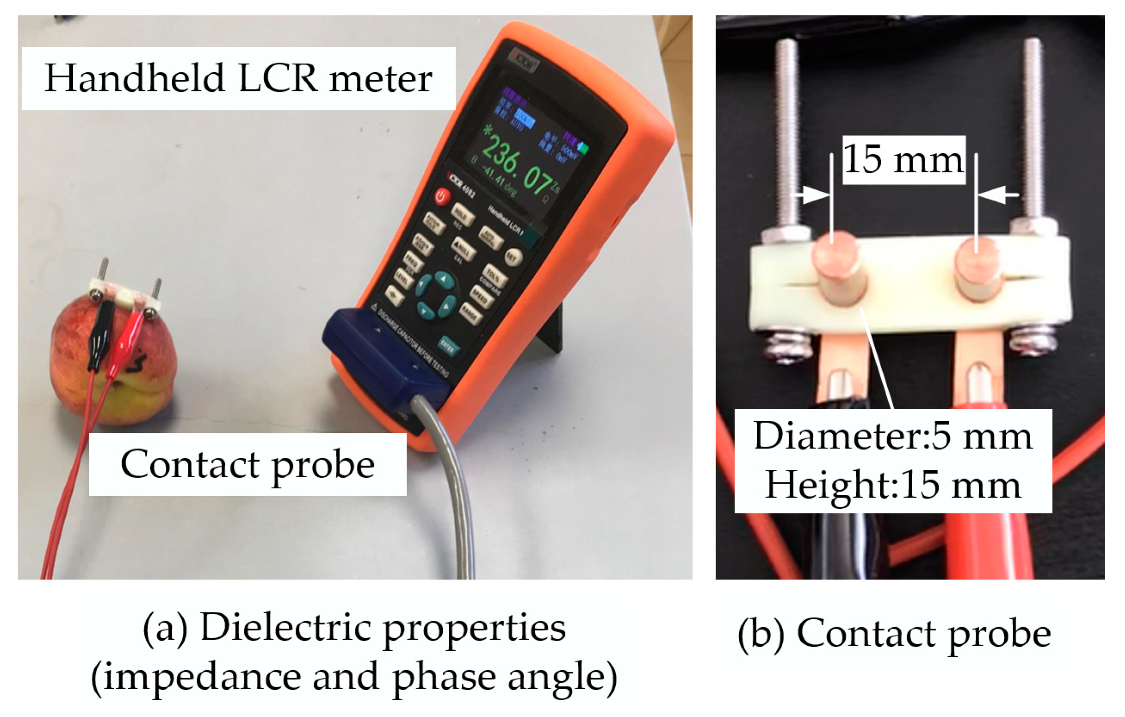
Dielectric properties were measured using published procedures with a level of 500 mV, a test time of 1 min, a frequency of 10 kHz, and a bias voltage of 0 mV [28,29]. The target experimental indicators were impedance (Zs) and phase angle (θ). Measurement range was set to automatic mode, and test speed was set to fast mode [14,30]. The experimental device is shown in Figure 2.
The contact probe was designed and manufactured using copper as a conductive material [15]. The probe was completely inserted into the pulp of the peach. After one minute, the values on the instrument display were paused and recorded. The probe was wiped with alcohol on cotton before measuring the next sample. Avoiding areas damaged by the contact probe, four planes (with obvious pulp) were sliced from four quadrants of peaches (excluding the bottom and top) for firmness measurements, as shown in Figure 1b. Fruit firmness was determined at four equatorial positions on each fruit at 90° [22] after skin was carefully removed.
Juice was extracted from the pulp of peaches and used for SSC determination. An additional 5 g of the remaining juice (without pulp) was sampled, and, after adding few drops of bromothymol blue indicator, the titration solution (0.1 mol/L NaOH) was dropped into the bottle until the juice turned from yellow to olive green, as shown in Figure 1c. The TA content of the juice was determined from the volume of the titrated solution, and the sugar–acid ratio (SSC/TA) was acquired by calculation.

2.3. Data processing and Analysis

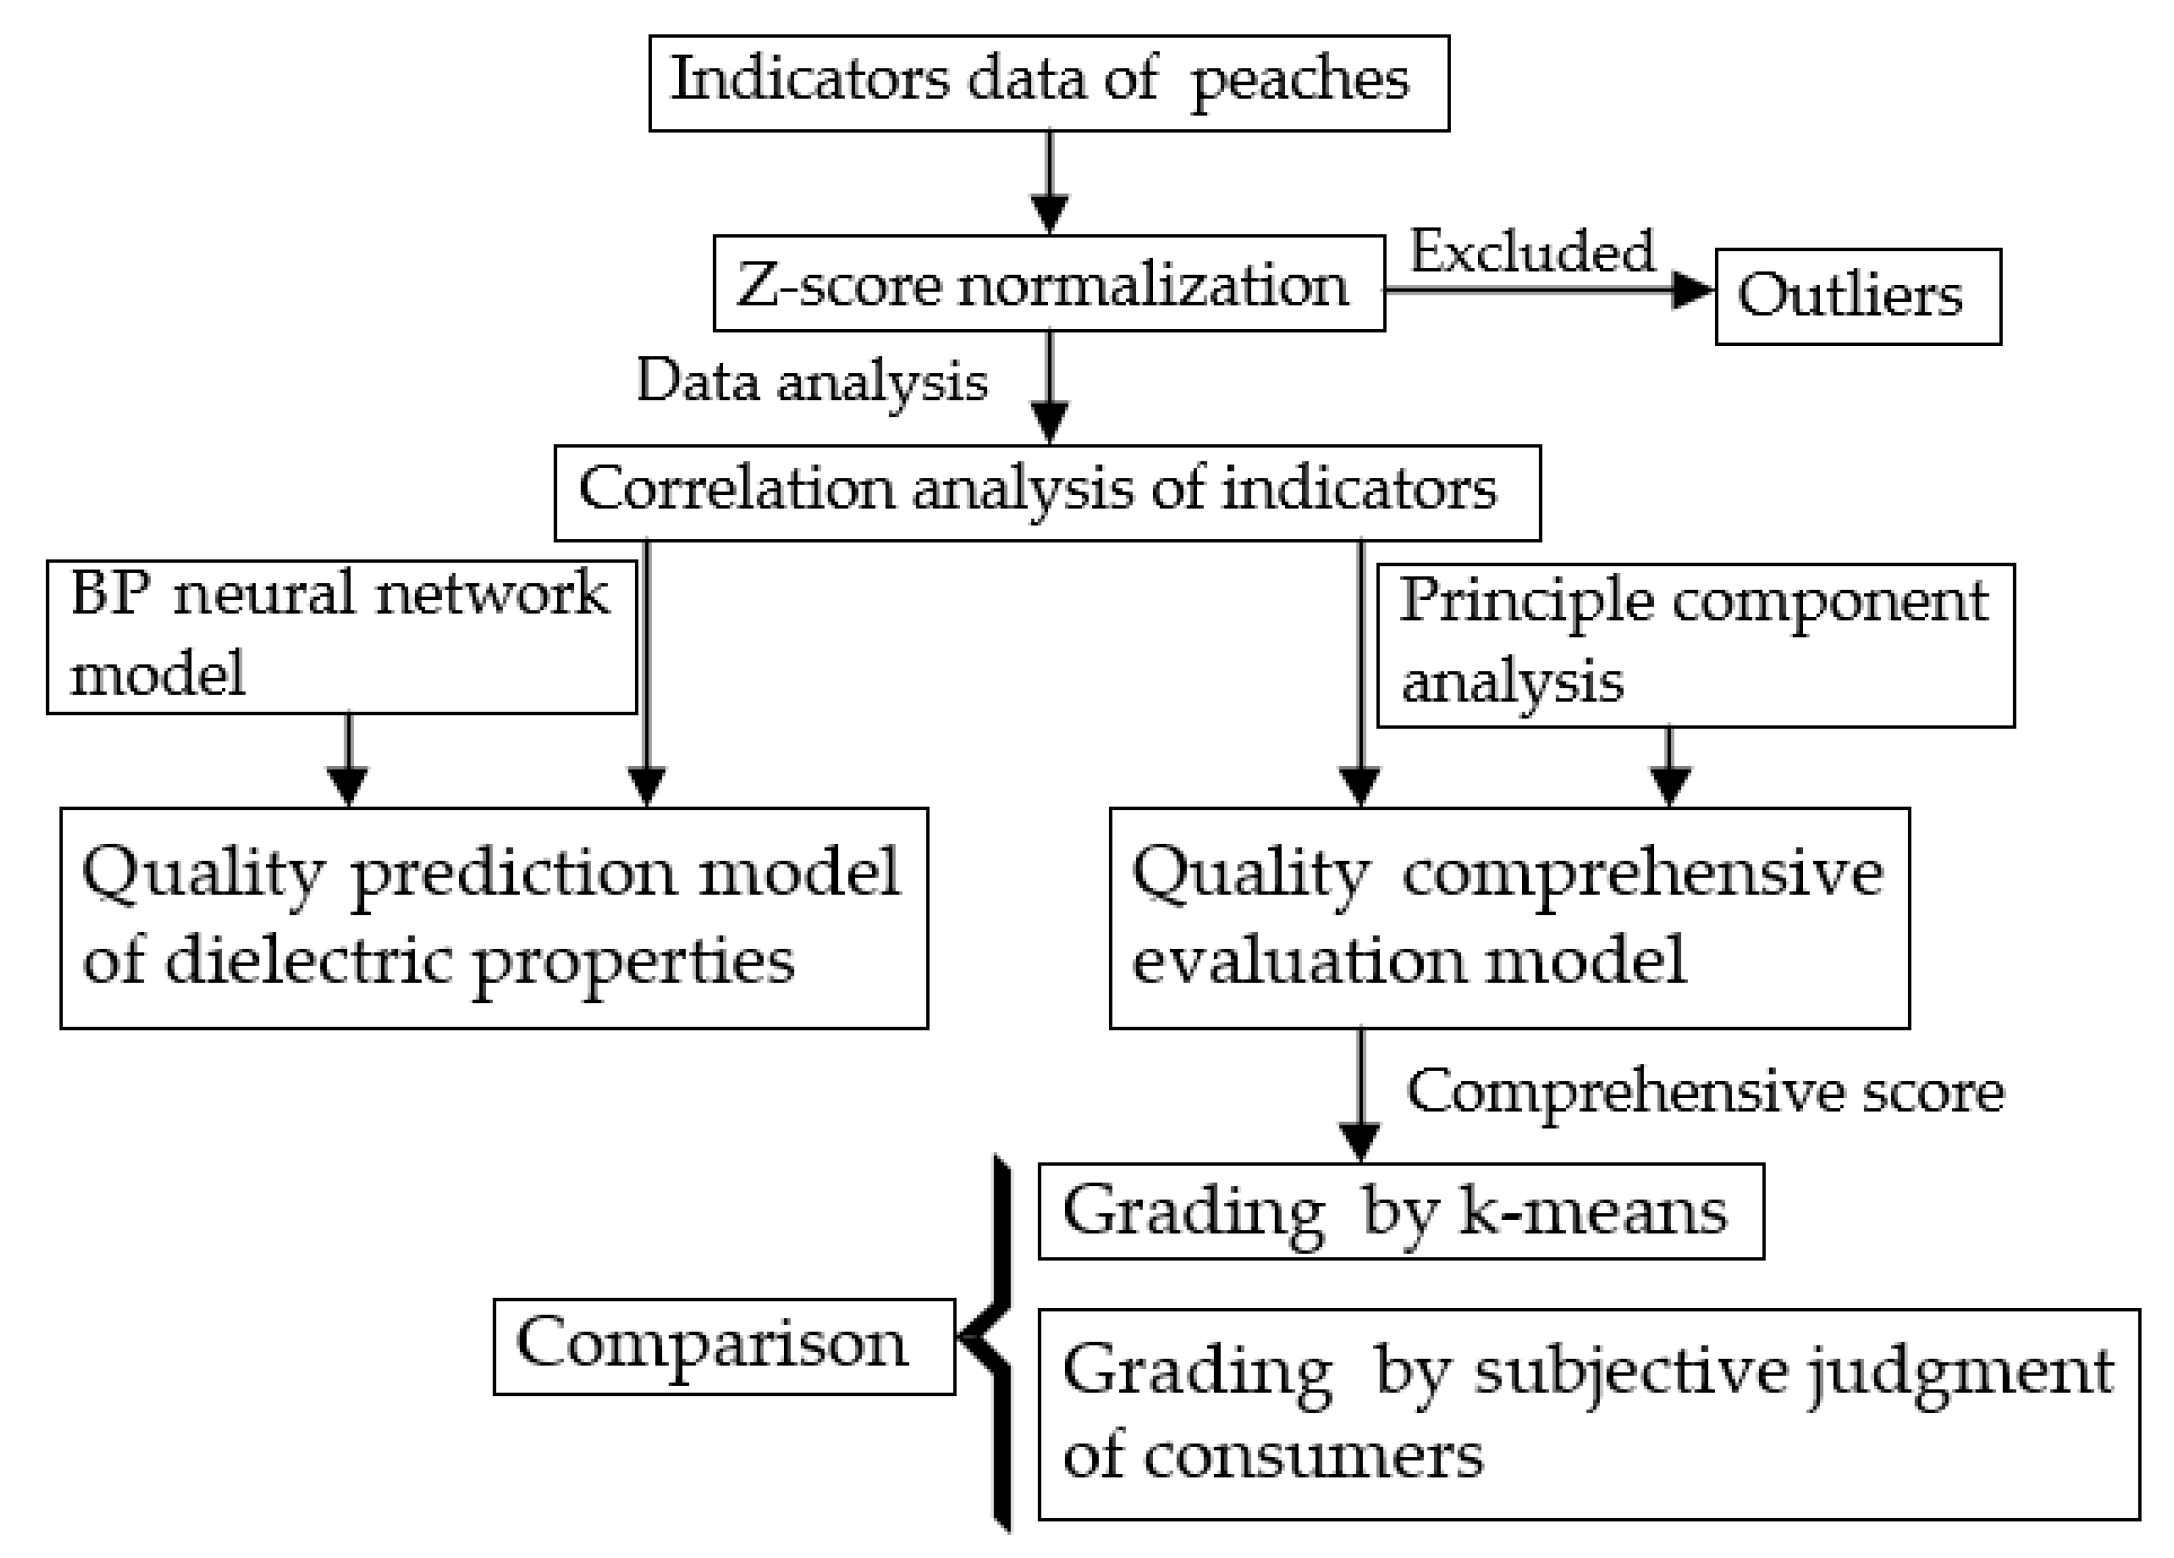
An outline of data processing and analysis steps is shown in Figure 3. The 11 indicators had different dimensions, and indicator data were, therefore, normalized prior to analysis. Indicator data from 200 peaches were grouped and normalized using the Z-score normalization method in SPSS (IBM ver. 25.0), resulting in dimensionless datasets with an average of zero and a standard deviation of one [31,32]. Data points outside the range of (−3, 3) were considered to be outliers, and data from 10 samples were excluded to ensure a normal distribution (−3σ, 3σ) of the processed data. Normalized data from 11 indicators measured in 190 peaches were then renumbered for subsequent analyses. Based on correlation analysis, dielectric properties appeared to best characterize and predict values of the other indicators in peaches (see below).
PCA and k-means clustering analysis were used to develop an evaluation and grading method for fresh peach quality. A principal component is a new indicator that cannot be directly measured by experiment. The content of each principal component can be defined by a component score (Fnj) obtained from the following formula:
F n j = i = 1 11 e j i Z n i ,
where Zni is the normalized indicator value of sample, Fnj is the score of the j-th principal component for the n-th peach, and eji is the load of i-th original indicator in the j-th principal component. Each indicator has a different weight for evaluating the quality of a sample. The final composite score requires a linear weighted summation. The variance contribution rate can be used as the weight value, representing the extent to which the indicator data reflect the overall data. The comprehensive score can be obtained from the following formula:
W n = j = 1 5 F n j η j ,
where Wn represents the composite score of n-th peach, and nj represents the variance of the j-th principal component.

3. Results and Discussion

3.1. Correlation Analysis of Indicators

PCA can simplify the number of evaluation indicators while preserving most of the indicators’ information. Multiple original indicators were converted into a smaller number of independent indicators, making it easier to establish a quality evaluation method for peaches. ZX1 to ZX11 represented the normalized data for each of the 11 indicators (shape index, volume, mass, density, firmness, color, Zs, θ, SSC, TA, and sugar–acid ratio). Correlations between normalized indicators were calculated before PCA in SPSS (IBM ver. 25.0) and are shown in Table 1.
From Table 1, it was obvious that the two dielectric properties (Zs and θ) showed a strong correlation with firmness. A traditional back propagation (BP) neural network, which was multi-layered and had several hidden layers in addition to input and output layers (Figure 4), was used to explain the correlation between them [33,34].
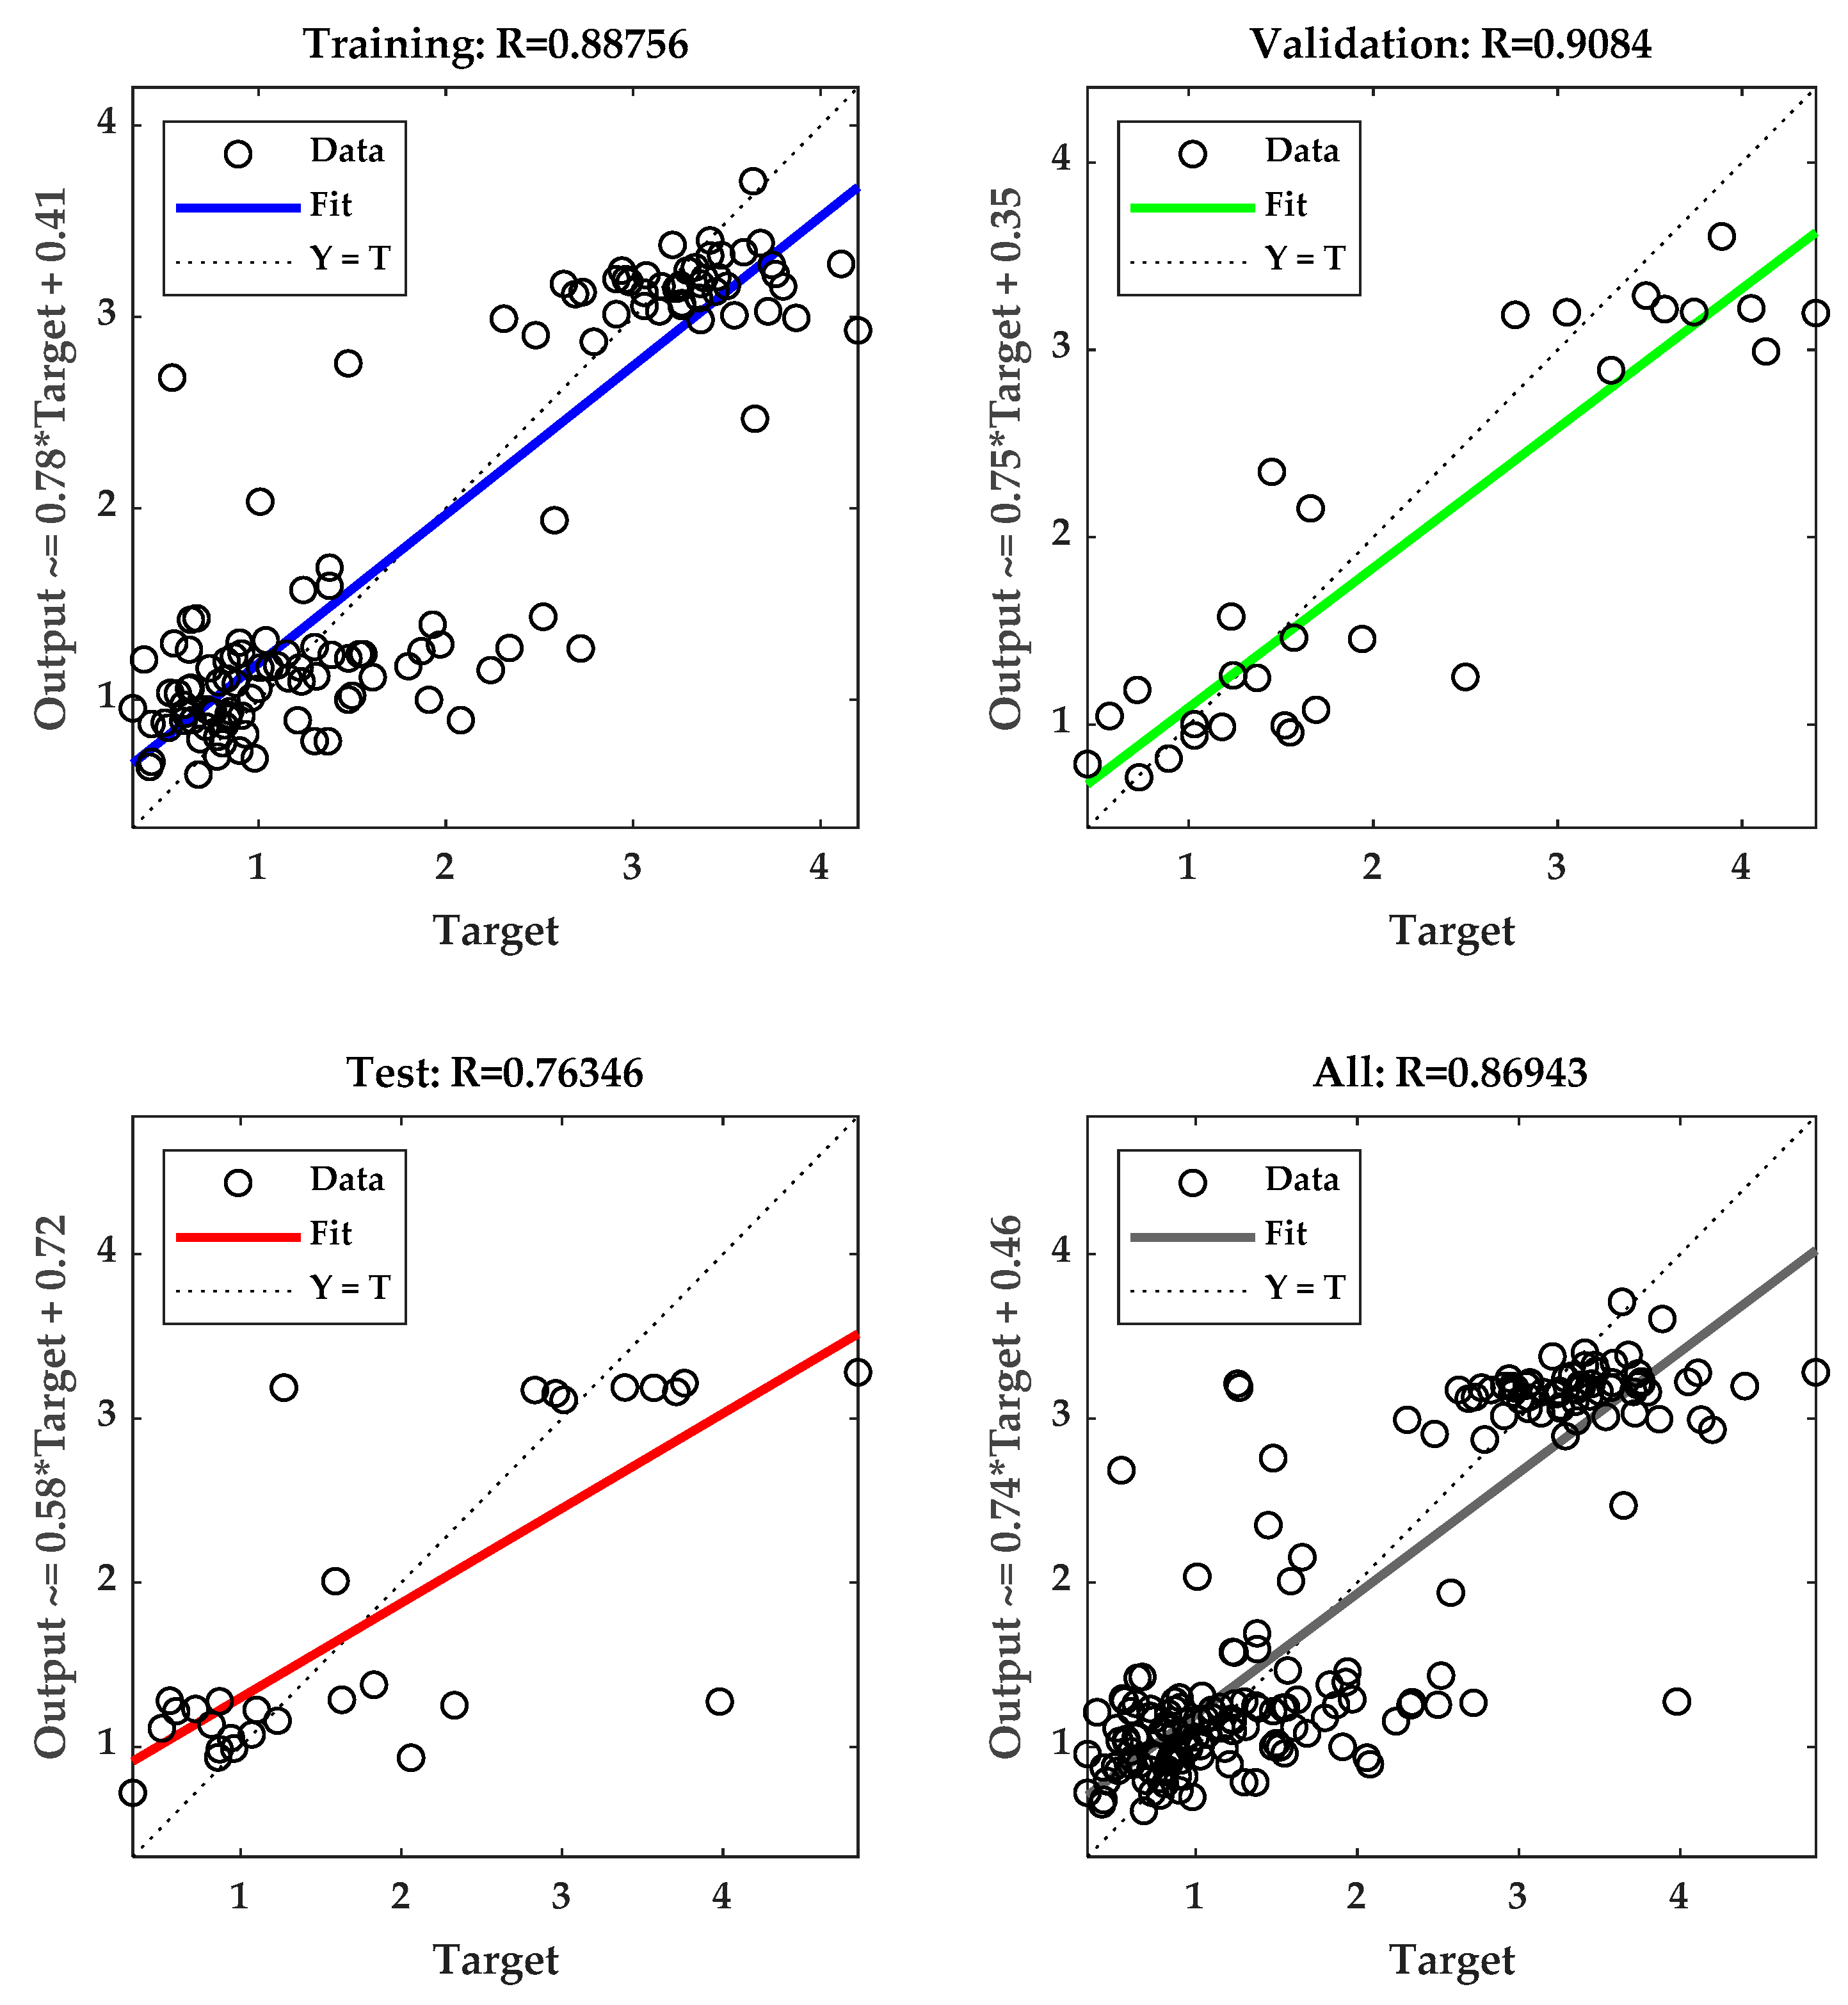
The original data of Zs and θ were set as the inputs, and the firmness was set as the output for the BP neural network established in this study. In total, 190 samples were randomly assigned to training (70%), validation (15%), and test (15%) sets. The number of neurons in the fitting network’s hidden layer was 10, and the Levenberg–Marquardt algorithm was chosen as the training function. The correlation coefficient between the simulated outputs and the observed values of the BP neural network could be quickly obtained with Matlab R2018b (Figure 5).
Fitting rates for training, validation, and test data were 88.8%, 90.8%, and 76.3%, respectively, with an overall fitting rate of 86.9%. These results indicate that the firmness of fresh peaches could be predicted from their dielectric properties based on the model. They provide a reference for data processing that can be compared with previous studies, and they constitute a good test case for fresh fruit quality evaluation based on dielectric measurement.

3.2. Principle Component Analysis of Indicators

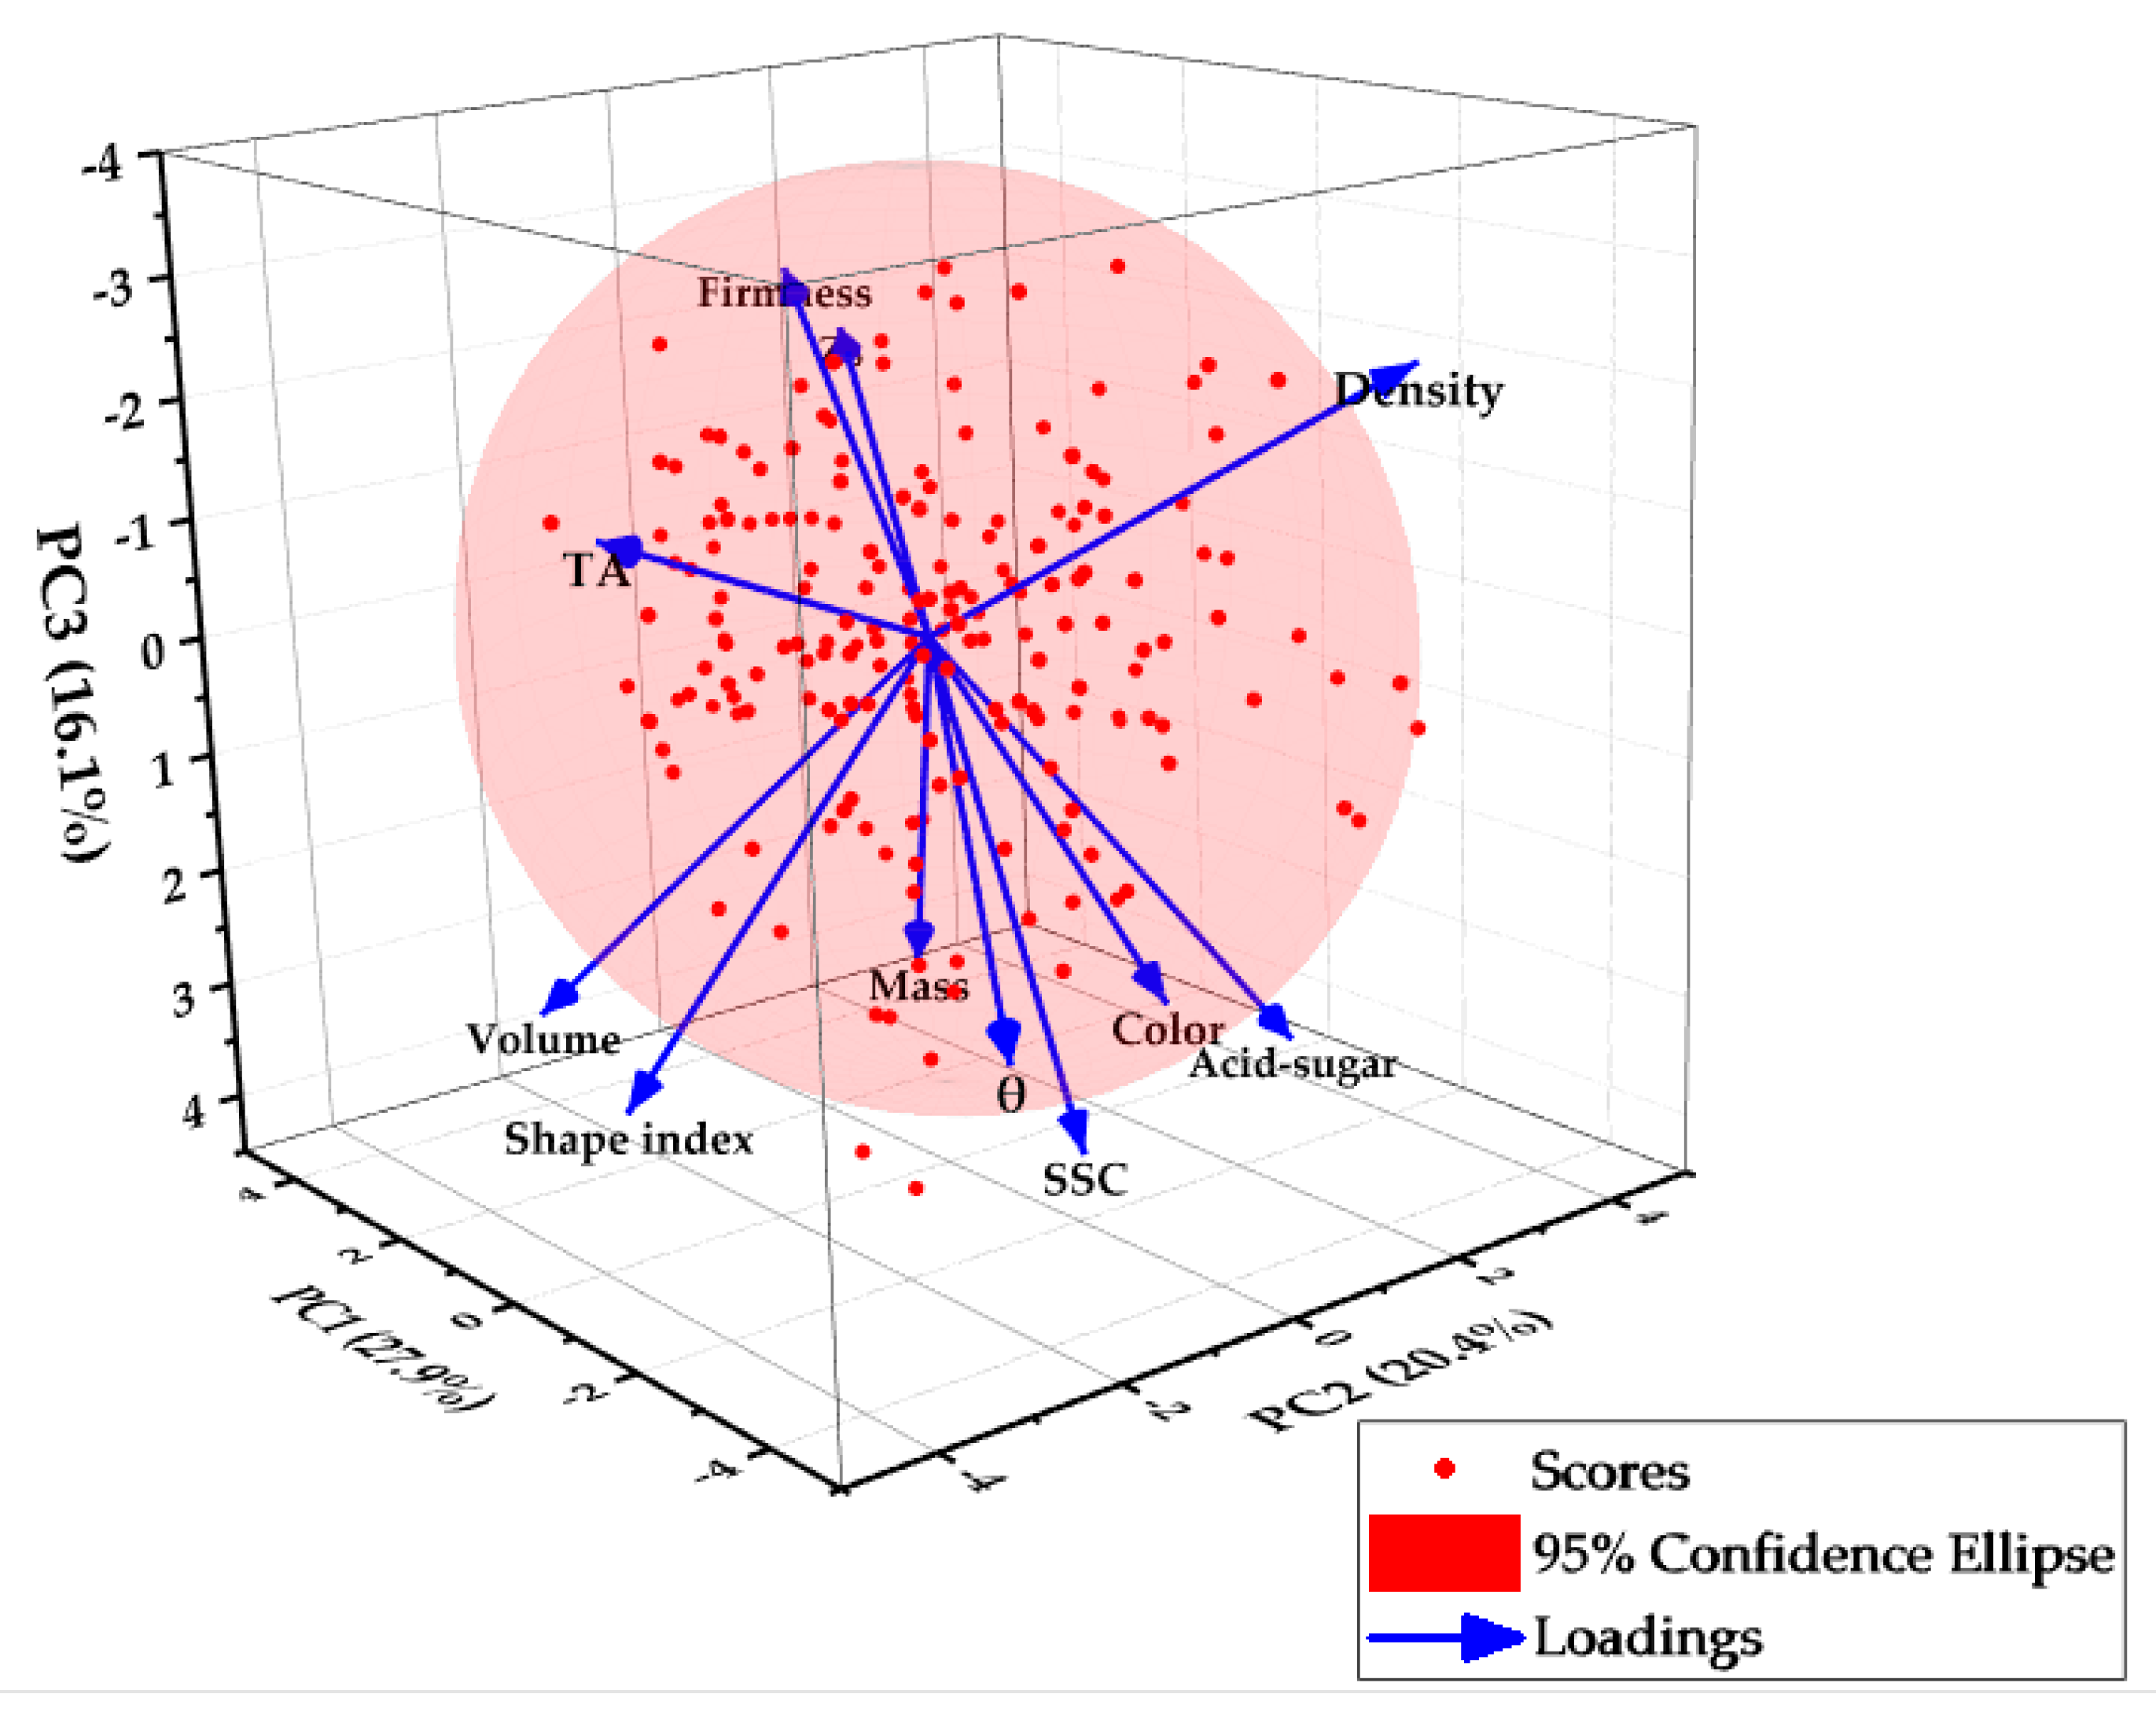
Correlation analysis (Table 1) indicated that there was a degree of information overlap among the 11 indicators, which highlighted the utility of a PCA approach. The PCA results are shown in Figure 6, as well as in Table 2 and Table 3.
From Table 2 and Table 3, five principal components were retained, with eigenvalues of e1 = 3.064, e2 = 2.241, e3 = 1.776, e4 = 1.206, and e5 = 1.058. The cumulative variance of the five principal components was 85%, which included most of the information from the 11 original indicators. F1, F2, F3, F4, and F5 were the scores for the principal components and were calculated using Equation (2) and Table 3. In the first principal component (PC1), variance contributions of volume, density, firmness, Zs, and θ occupied dominant positions with larger absolute values, indicating that this principal component was influenced mainly by volume, density, dielectric properties, and firmness. The second principal component (PC2) was strongly influenced by SSC and sugar–acid ratio. The third component (PC3) was influenced by many indicators, and no single indicator occupied a dominant position. The fourth component (PC4) was strongly influenced by TA, and the fifth component (PC5) was strongly influenced by mass. Among the PCs, PC1 and PC5 represented physical properties of peaches and PC2 and PC4 represented chemical properties. PC3 represented comprehensive properties in which the loadings of indicators were closed. The comprehensive score for peaches was calculated using Equation (3) and Table 2. The PCA approach permitted integration of multiple data types. Compared with previous single-index detection methods, the effectiveness and reliability of the results obtained with PCA were improved.

3.3. Grading of Peaches by k-Means Clustering Analysis

Normalized data from 11 indicators measured in 190 peaches were used for k-means clustering analysis in SPSS (IBM Corp. ver. 25.0). The number of clusters was five, with a maximum of 20 iterations. The new variable was saved as cluster membership mode. Convergence was achieved when there were no changes or small changes in the cluster centers. The maximum absolute coordinate change for any center was zero. There were 14 iterations, and the minimum distance between initial centers was 5.624. The grading results are shown in Table 4.
The results of grading samples by comprehensive score were compared to the results of grading based on the proportion of red surface area, as shown in Table 5.
From the average comprehensive scores in Table 5, it can be seen that cluster 1 > cluster 3 > cluster 2 > cluster 5 > cluster 4, indicating that the fresh peach quality of cluster 1 was the highest and that of cluster 4 was the lowest.
The comprehensive scores of peaches with different percentages of red surface area indicated that increased red surface area did not necessarily correspond to improved quality of the fresh peach. Although the clusters had similar sample numbers, the proportion of samples with less than 70% red area in cluster 4 (the lowest-quality cluster) was only 10%, while the proportion of samples with more than 80% red area in clusters 1 and 3 (the highest-quality clusters) was 34.9%. Therefore, the proportion of red surface area is not a good basis for picking fresh peaches for the consumer market, and the proposed method based on multiple factors is more effective and reliable.

4. Conclusions

In this study, the measurement of 11 quality indicators of 200 peaches was completed within 48 h. Quality indicator data were normalized, and outliers were excluded. A BP neural network was constructed in MATLAB to predict the firmness of fresh peaches from their dielectric properties, and the overall fitting ratio of the predicted values and the observed values was 86.9%. PCA results indicated that the cumulative variance explained by the first five principal components was 85%, indicating that the first five components captured most of the information from the 11 original indicators. Based on k-means clustering of normalized data from 11 indicators, 190 peaches were divided to five clusters, containing 24.7%, 19%, 14.2%, 21.6%, and 20.5% of the samples, respectively. The average comprehensive score was calculated for each cluster; fresh peach quality of cluster 1 was the best, and fresh peach quality of cluster 4 was the worst. Poor correspondence between the comprehensive scores and the percentage of red surface area demonstrated that red surface area is not a good basis for picking fresh peaches for consumers.
This study establishes that dielectric properties can be used to predict the firmness of fresh peaches, and it describes an evaluation and grading model based on multiple indicators. The model provides a scientific, objective, and feasible way of studying and classifying the quality of fresh peaches. It provides a reference for the proposed evaluation of quality in other foods and a technical guarantee of food safety to protect the rights of the consumer. This research provides a technical basis for the detection of dielectric properties related to fruit quality, which will be an important focus of future studies. Based on this research, more convenient and effective fruit quality detection methods will be developed, providing technical support for post-harvest evaluation and classification of fruits in future work.

Author Contributions

G.Z. and T.J. designed the research (conceptualization). G.Z., M.M., and M.B.B. were responsible for the performance of the investigation, acquisition of data, and analysis and interpretation of the results. G.Z. and Q.F. were responsible for the original draft preparation. X.L. and Z.F. acquired funding. All authors have read and agreed to the published version of the manuscript.

Funding

This research was funded by the National Key Research and Development Program of China, grant number 2017YFE0111200.

Acknowledgments

This research was supported and funded by the National Key Research and Development Program of China (No.2017YFE0111200) from the China Ministry of Science and Technology. This experiment was performed in Croatia during a visit by the first author, which was supported by the Chinese–Croatian bilateral Scientific and Technological Cooperation Program (8-19).

Conflicts of Interest

The authors declare no conflicts of interest.

References

  1. Alipasandi, A.; Ghaffari, H.; Alibeyglu, S.Z. Classification of three varieties of peach fruit using artificial neural network assisted with image processing techniques. Int. J. Agron. Plant Prod. 2013, 4, 2179–2186. [Google Scholar]
  2. Fernandez, P.; Gabaldon, J.A.; Periago, M.J. Detection and quantification of Alicyclobacillus acidoterrestris by electrical impedance in apple juice. Food Microbiol. 2017, 68, 34–40. [Google Scholar] [CrossRef] [PubMed]
  3. Legua, P.; Hernandez, F.; Diaz-Mula, H.M.; Valero, D.; Serrano, M. Quality, Bioactive Compounds, and Antioxidant Activity of New Flat-Type Peach and Nectarine Cultivars: A Comparative Study. J. Food Sci. 2011, 76, C729–C735. [Google Scholar] [CrossRef] [PubMed]
  4. Gong, L.; Meng, X.; Liu, N.; Bi, J. Evaluation of apple quality based on principal component and hierarchical cluster analysis. Trans. Chin. Soc. Agric. Eng. 2014, 30, 276–285. [Google Scholar]
  5. Radomille de Santana, L.R.; Benedetti, B.C.; Monteiro Sigrist, J.M. Sensory profile of ‘Douradao’ peaches cold stored under controlled atmosphere. Ciencia E Tecnologia De Alimentos 2011, 31, 238–246. [Google Scholar] [CrossRef] [Green Version]
  6. Lee, D.J.; Schoenberger, R.; Archibald, J.; McCollum, S. Development of a machine vision system for automatic. date grading using digital reflective near-infrared imaging. J. Food Eng. 2008, 86, 388–398. [Google Scholar] [CrossRef]
  7. Nelson, S.O. Agricultural Applications of Dielectric Spectroscopy. J. Microw. Power Electromagn. Energy 2004, 39, 75–85. [Google Scholar] [CrossRef] [Green Version]
  8. Renshaw, R.C.; Dimitrakis, G.A.; Robinson, J.P.; Kingman, S.W. The relationship of dielectric response and water activity in food. J. Food Eng. 2019, 244, 80–90. [Google Scholar] [CrossRef]
  9. Zhang, Y.D.; Dong, Z.C.; Chen, X.Q.; Jia, W.J.; Du, S.D.; Muhammad, K.; Wang, S.H. Image based fruit category classification by 13-layer deep convolutional neural network and data augmentation. Multimed. Tools Appl. 2019, 78, 3613–3632. [Google Scholar] [CrossRef]
  10. Rajkumar, P.; Wang, N.; Elmasry, G.; Raghavan, G.S.V.; Gariepy, Y. Studies on banana fruit quality and maturity stages using hyperspectral imaging. J. Food Eng. 2012, 108, 194–200. [Google Scholar] [CrossRef]
  11. Keresztes, J.C.; Goodarzi, M.; Saeys, W. Real-time pixel based early apple bruise detection using short wave infrared hyperspectral imaging in combination with calibration and glare correction techniques. Food Control 2016, 66, 215–226. [Google Scholar] [CrossRef]
  12. Chong, V.K.; Nishi, T.; Kondo, N.; Ninomiya, K.; Monta, M.; Namba, K.; Zhang, Q.; Shimizu, H. Surface Gloss Measurement on Eggplant Fruit. Appl. Eng. Agric. 2008, 24, 877–883. [Google Scholar] [CrossRef]
  13. Soltani, M.; Alimardani, R.; Omid, M. Evaluating banana ripening status from measuring dielectric properties. J. Food Eng. 2011, 105, 625–631. [Google Scholar] [CrossRef]
  14. Ma, H.; Song, C.; Zhang, J.; Zhang, W.; Hu, F. Influence of Frequency of Electric Excitation Signal on Dielectric Property of Fuji Apples with Red-dot Disease. Trans. Chin. Soc. Agric. Mach. 2009, 40, 97. [Google Scholar]
  15. Du, G.; Tang, Y.; Guo, A.; Zhang, J. Influence of Frequency Signal on Electrical Property of Peach Fruits. Food Sci. 2013, 34, 11–15. [Google Scholar]
  16. Arvanitoyannis, I.S.; Tsitsika, E.V.; Panagiotaki, P. Implementation of quality control methods (physico-chemical, microbiological and sensory) in conjunction with multivariate analysis towards fish authenticity. Int. J. Food Sci. Technol. 2005, 40, 237–263. [Google Scholar] [CrossRef]
  17. Strydom, P.E. Quality related principles of the South African beef classification system in relation to grading and classification systems of the world. S. Afr. J. Anim. Sci. 2011, 41, 177–193. [Google Scholar] [CrossRef] [Green Version]
  18. Birla, S.L.; Wang, S.; Tang, J.; Tiwari, G. Characterization of radio frequency heating of fresh fruits influenced by dielectric properties. J. Food Eng. 2008, 89, 390–398. [Google Scholar] [CrossRef] [Green Version]
  19. Sanaeifar, A.; Jafari, A.; Golmakani, M.T. Fusion of dielectric spectroscopy and computer vision for quality characterization of olive oil during storage. Comput. Electron. Agric. 2018, 145, 142–152. [Google Scholar] [CrossRef]
  20. Das, C.; Chakraborty, S.; Acharya, K.; Bera, N.K.; Chattopadhyay, D.; Karmakar, A.; Chattopadhyay, S. FT-MIR supported Electrical Impedance Spectroscopy based study of sugar adulterated honeys from different floral origin. Talanta 2017, 171, 327–334. [Google Scholar] [CrossRef]
  21. Lubinska-Szczygel, M.; Pudlak, D.; Dymerski, T.; Namiesnik, J. Rapid assessment of the authenticity of limequat fruit using the electronic nose and gas chromatography coupled with mass spectrometry. Mon. Chem. 2018, 149, 1605–1614. [Google Scholar] [CrossRef] [Green Version]
  22. Wang, X.; Matetic, M.; Zhou, H.J.; Zhang, X.S.; Jemric, T. Postharvest Quality Monitoring and Variance Analysis of Peach and Nectarine Cold Chain with Multi-Sensors Technology. Appl. Sci.-Basel 2017, 7, 13. [Google Scholar]
  23. Zhang, H.; Han, T.; Wang, Y.; Li, L. Selection of factors for evaluating peach (Prunus persica) fruit quality. Trans. Chin. Soc. Agric. Eng. 2006, 22, 235–239. [Google Scholar]
  24. Zhu, N.; Lin, M.H.; Nie, Y.T.; Wu, D.; Chen, K.S. Study on the quantitative measurement of firmness distribution maps at the pixel level inside peach pulp. Comput. Electron. Agric. 2016, 130, 48–56. [Google Scholar] [CrossRef]
  25. Sharma, G.; Wu, W.C.; Daa, E.N. The CIEDE2000 color-difference formula: Implementation notes, supplementary test data, and mathematical observations. Color Res. Appl. 2005, 30, 21–30. [Google Scholar] [CrossRef]
  26. Agnihotry, A.; Gill, K.S.; Singhal, D.; Fedorowicz, Z.; Dash, S.; Pedrazzi, V. A comparison of the bleaching effectiveness of chlorine dioxide and hydrogen peroxide on dental composite. Braz. Dent. J. 2014, 25, 524–527. [Google Scholar] [CrossRef]
  27. Gasic, K.; Reighard, G.L.; Windham, J.; Ognjanov, M. Relationship between fruit maturity at harvest and fruit quality in peach. Acta Hortic. 2015, 1084, 643–648. [Google Scholar] [CrossRef]
  28. Guo, W.; Zhu, X.; Guo, K.; Wang, Z. Electrical Properties of Peaches and Its Application in Sensing Freshness. Trans. Chin. Soc. Agric. Mach. 2007, 38, 112–115. [Google Scholar]
  29. Lombardo, R.; Rubino, T.; Cammalleri, M. Dielectric Characterization of Fruit Nectars at Low RF Frequencies. Int. J. Food Prop. 2015, 18, 2312–2326. [Google Scholar] [CrossRef]
  30. Guo, W.; Hen, K. Relationship between Dielectric Properties from 10 to 4500MHz and Internal Quality of Peaches. Trans. Chin. Soc. Agric. Mach. 2010, 41, 134–138. [Google Scholar]
  31. Zhang, G.X.; Huang, X.Y.; Fu, Z.T.; Jilani, M.T.; Luo, H.L.; Li, X.X. Correlation between physical properties and freshness of chilled mutton in China. J. Food Process. Preserv. 2019, 43, 9. [Google Scholar] [CrossRef]
  32. Meng, Y.; Zhang, Y.; Wang, X.; Wei, L.; Ma, Y.; Deng, H.; Guo, Y. Establishing comprehensive evalution system of American No.8 fresh apples based on principal component analysis. Sci. Technol. Food Ind. 2015, 36, 296–300. [Google Scholar]
  33. Shang, L.; Gu, J.; Guo, W. Non-destructively detecting sugar content of nectarines based on dielectric properties and ANN. Trans. Chin. Soc. Agric. Eng. 2013, 29, 257–264. [Google Scholar]
  34. Fu, Z.T.; Zhao, S.; Zhang, X.S.; Polovka, M.; Wang, X. Quality Characteristics Analysis and Remaining Shelf Life Prediction of Fresh Tibetan Tricholoma matsutake under Modified Atmosphere Packaging in Cold Chain. Foods 2019, 8, 14. [Google Scholar] [CrossRef] [Green Version]
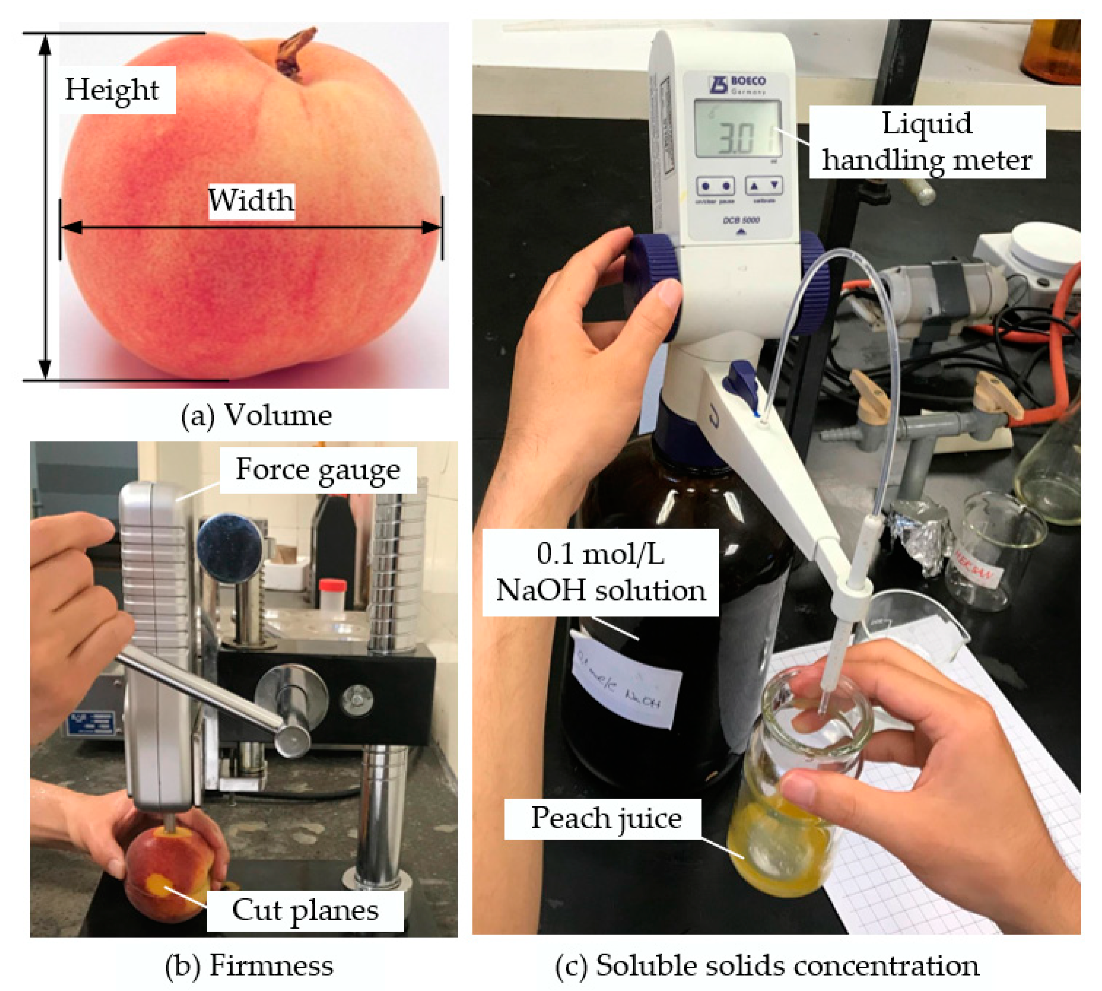
Figure 1. Volume, firmness, and titratable acidity measurement of peaches.
Applsci 10 01348 g001
Figure 2. Contact probe and measurement of dielectric properties in peaches.
Applsci 10 01348 g002
Figure 3. Outline of data processing and analysis.
Applsci 10 01348 g003
Figure 4. Diagram of back propagation (BP) neural network in Matlab.
Applsci 10 01348 g004
Figure 5. Regression results of the BP neural network model.
Applsci 10 01348 g005
Figure 6. Principal component analysis (PCA) plot of the first (PC1), second (PC2), and third principal components (PC3).
Applsci 10 01348 g006
Table 1. Correlation analysis results for eleven normalized indicators measured in fresh peaches. SSC—soluble solid concentration; TA—titratable acid.
Correlation Matrix
CorrelationZX1ZX2ZX3ZX4ZX5ZX6ZX7ZX8ZX9ZX10ZX11
Shape indexZX11.000
VolumeZX20.4771.000
MassZX3−0.0270.4861.000
DensityZX4−0.545−0.8690.0061.000
FirmnessZX50.0400.2700.068−0.2741.000
ColorZX6−0.019−0.1080.0740.166−0.1361.000
ZsZX70.0790.2500.085−0.2350.752−0.0921.000
θZX80.050−0.217−0.1310.173−0.7460.035−0.8121.000
SSCZX90.158−0.0610.0890.124−0.1060.262−0.0770.0721.000
TAZX100.1390.040−0.106−0.106−0.083−0.135−0.2000.1450.2321.000
Acid–sugar ratioZX11−0.029−0.0920.1510.194−0.0180.2870.121−0.0730.460−0.7441.000
Table 2. Percentage of total variance explained.
ComponentInitial Eigenvalues
Total% of VarianceCumulative %
13.06427.927.9
22.24120.448.3
31.77616.164.4
41.20611.075.4
51.0589.685.0
60.7777.192.1
70.4384.096.1
80.2582.398.4
90.1701.599.9
100.0100.090100.0
110.0020.016100.0
Table 3. Component matrix of principal components.
Component
12345
ZX10.354−0.4410.5080.145−0.405
ZX20.723−0.3870.463−0.2310.175
ZX30.2560.1310.408−0.2480.803
ZX4−0.6810.516−0.2940.1290.245
ZX50.7850.267−0.3030.2130.002
ZX6−0.2090.3360.4170.2440.053
ZX70.7910.391−0.2240.187−0.063
ZX8−0.750−0.4150.280−0.226−0.086
ZX9−0.1680.1730.5670.7010.067
ZX10−0.088−0.706−0.1870.6040.299
ZX11−0.0510.7590.547−0.080−0.228
Table 4. Final cluster center results for 190 peaches by k-means clustering analysis.
Cluster
12345
ZX10.2270.756−0.715−0.8830.362
ZX20.7730.408−0.650−0.9720.360
ZX30.4010.237−0.283−0.098−0.267
ZX4−0.645−0.3460.55010.039−0.550
ZX50.947−0.7240.812−0.834−0.317
ZX6−0.3580.5860.677−0.056−0.346
ZX71.068−0.7240.942−0.918−0.373
ZX8−0.9930.918−1.1030.7930.301
ZX9−0.3100.6680.316−0.066−0.370
ZX10−0.149−0.116−0.548−0.0020.914
ZX11−0.1270.4720.688−0.041−0.976
Table 5. Comparison of grading methods.
Clustering CenterNumber of SamplesAverage Comprehensive ScoreRed Area on the SurfaceNumber of SamplesAverage Comprehensive Score
Cluster147 (24.7%)1.01925%–50%3 (1.6%)0.327
236 (19%)−0.14950%–70%37 (19.4%)−0.082
327 (14.2%)0.80970%–80%64 (33.7%)−0.174
441 (21.6%)−1.07280%–90%56 (29.5%)0.163
539 (20.5%)−0.56690%–100%30 (15.8%)−0.575
Valid190 (100%) 190 (100%)
Missing0 (0%) 0 (0%)