Article

Hybrid Simulation of Seismic Responses of a Typical Station with a Reinforced Concrete Column

1
Department of Geotechnical Engineering, Tongji University, Shanghai 200092, China
2
State Key Laboratory of Disaster Reduction in Civil Engineering, Tongji University, Shanghai 200092, China
*
Author to whom correspondence should be addressed.
Appl. Sci. 2020, 10(4), 1331; https://doi.org/10.3390/app10041331
Submission received: 24 January 2020 / Revised: 13 February 2020 / Accepted: 13 February 2020 / Published: 16 February 2020
(This article belongs to the Special Issue Advances on Structural Engineering)

Abstract

:
During the 1995 Kobe earthquake, damages were observed in the Daikai subway station and adjacent tunnels. It was the first large-scale underground structure that failed under the earthquake excitation. Numerical and experimental analyses have been conducted to study the failure process of the Daikai station. However, the issue of the scale ratio still exists in the shaking table tests of underground structures. In order to tackle this issue, a hybrid simulation technique is developed here to study the seismic performance of a typical subway station. Based on the previous research, it is found that the central column is the critical component of the structure. Therefore, a reinforced concrete central column is physically tested in the hybrid simulation process. On the other hand, the remaining parts of the structure and soil domain are numerically modeled at the same time. Four hybrid simulation cases are conducted with peak ground accelerations of 0.01 g, 0.1 g, 0.22 g, and 0.58 g. The test results of displacement and shear force are compared with the analytical results. Moreover, the good agreement between the test results and numerical results validate the accuracy of the proposed hybrid test method. After the hybrid simulation process, a quasi-static test is conducted to illustrate the mechanical properties of the central column after the earthquake excitation.

1. Introduction

Serious damages of subway stations and tunnels were observed in the Kobe earthquake, indicating that underground structures were vulnerable under severe earthquake excitations [1]. The Daikai station was the first large-scale underground structure that almost collapsed in the earthquake. Therefore, researchers all around the world gave their explanations about the damage process of the Daikai station, both numerically and experimentally. Such investigations shed light on the damage process and the failure mode of the Daikai station [2]. Actually, a consensus on the seismic responses of a typical subway station has not been reached. Investigations on the damage process of a typical subway station require more work. Therefore, innovate numerical methods and experimental methods should be proposed to study the dynamic responses of a typical subway station.
Generally, two kinds of methods, namely numerical methods and experimental methods, are developed to study the seismic behavior of subway stations. With respect to numerical modelling, the finite element method is widely used in time-history analysis. The nonlinear mechanical behavior of the underground structure, adjacent geotechnical media, and soil-structure interaction could be considered in time-history analysis. The propagation process of seismic waves in the infinite region would be reproduced with a reasonable boundary. Therefore, up to now, numerical analysis is the main way to study the seismic performance of subway stations, especially for failure progress [3,4,5,6,7]. Such investigations give clues to the design of typical underground structures.
Yasuo et al. [3] used the equivalent linearized constitutive model for soil modeling. The viscous boundary was selected at the bottom of the finite element (FE) model. The transmission boundary was selected laterally. The rigid beam element and elastic beam element were selected for the structure modelling. The results showed that the shear force of the center column reached the bearing capacity during the earthquake and brittle failure happened. Due to the damage of the concrete, the vertical bearing capacity of the central column decreased, and the thrust exceeded the bearing capacity, which caused the center column to fail. The upper end of the side walls and the upper roof reached the ultimate bending capacity after the center column crushed. Huo et al. [4] applied an equivalent linearized constitutive material for soil modelling. The rigid boundary was applied on the bottom side, and the free boundary was selected on the lateral sides. The results showed that the soil-structure stiffness ratio was significant in the seismic analysis. The station with a lower stiffness ratio suffered more severe damage. As the Daikai station was designed subject to static loading only, the stirrup reinforcement ratio was relatively low, and brittle failure occurred due to the insufficient shear capacity. After the shear failure, the compressive bearing capacity of the central column decreased. In fact, the Daikai station had a large span. After the center column failed, the entire station collapsed due to the increased thrust of the central column. Lu et al. [5] proposed a simplified approach to consider the nonlinear behavior of the station with FLAC-2D. The nonlinear constitutive models were applied to consider the nonlinear interaction between the soil and structure accurately. Based on the proposed framework, the failure process of the Daikai station can be traced by the dynamic time-history analysis. In order to decrease the seismic responses of the Daikai station, Chen et al. [6,7] proposed a self-centering energy dissipation column for the Daikai station. 3D time-history analysis results showed that the self-centering energy dissipation column would effectively decrease the internal forces of the central column and the peak and residual drift. To be specific, the drift would be reduced by 4–5%. Replaceable energy dissipating devices provide supplementary energy dissipation capacity to relieve the development of structural plasticity [8,9,10,11]. Therefore, the enhanced behavior of the central column would avoid the occurrence and development of a plastic hinge under earthquake excitation.
Actually, further work should be conducted to validate the accuracy of the numerical method. With respect to experimental research, Chen et al. [12] conducted a series of shaking table tests to investigate the effect of pulse-like ground motion on a typical multi-story subway station. Dynamic responses including structural forces, story drift, settlement, and deformation of the soil were obtained and analyzed. Central columns were verified as the vulnerable component of the multi-story subway station. Moreover, the propagation of earthquake motions in soils was explored based on the test results of another series of large-scale shaking table tests [13]. It was found that the site amplified the frequency components of dynamic excitation in specific frequency bands. Pulse-like earthquake motions with a long pulse duration and multiple pulse cycles would lead to remarkable resonance-like phenomena of soils. Chen et al. [14] conducted a series of shaking table tests based on a typical three-story and three-span subway station made of plaster in order to investigate the seismic failure process of an underground subway station on the liquefiable ground. The dynamic responses of the structure and ground soil were studied. Sand boiling, waterspout phenomena, ground surface cracks, and earthquake-induced ground surface settlements were observed in the test. The results of the aforementioned shaking table tests gave people new sights into the seismic damage development process and failure mechanism of the subway station.
It should be noted that the scale issue always exists in the shaking table test of underground structures. In light of the above-mentioned research, this paper aims at studying the seismic behavior of a typical station with a hybrid simulation technique. The hybrid simulation technique is a kind of test method that combines numerical modelling and experimental research. Hybrid simulation could take advantage of both numerical methods and test methods. Therefore, hybrid simulation would achieve a complete representation of the real-world problem [15]. With respect to the application of hybrid simulation to the underground infrastructure, Yang et al. [16] applied the virtual hybrid simulation method in the seismic issue of a typical station. In addition, a self-designed steel column was used to validate the hybrid simulation process. Tessari [17] utilized a shaking table and an actuator to analyze the soil structure interaction issue with the hybrid simulation test method. The soil domain was tested by the shaking table, and the effects of structure-foundation interactions were realized by the actuator. Based on the previous research, the critical part of the model, such as the central column of the subway station, could be adopted as the physical substructure, while the remaining parts of the station and the soil domain could be taken as the numerical substructure. In this paper, an RC (reinforced concrete) column specimen is selected to study the seismic performance of the central column of a typical station. The pressure-dependent multi-yield-surface J2 plasticity material model is applied to model the deposit. The hybrid simulation system is composed of OpenSees, OpenFresco, and the MTS loading system. The Kobe excitation (peak ground acceleration = 0.01 g, 0.1g, 0.22 g, 0.58 g) is applied in the hybrid simulation process, then the quasi-static test is conducted after the hybrid simulation process. The shear forces and drift responses of the central column are analyzed further to illustrate the characteristics of the central column after the earthquake excitation.

2. Substructure Hybrid Simulation

Hybrid simulation is one kind of experimental method that consists both of physical testing and numerical modelling. The concept originated from the PsD (pseudo-dynamic) test method. In the PsD test method, the mass and damping of the model are numerically calculated while the stiffness is obtained physically from the test specimen. In this paper, the substructure pseudo dynamic test method is adopted to evaluate the seismic performance of a typical station. The concept of the substructure pseudo dynamic test allows the critical part of the structure (typically with a highly nonlinear response) to be physically tested and the rest of the structure to be simultaneously numerically modeled [18]. The dynamic equation of motion can be written as follows.
M x ¨ i + 1 + C x ˙ i + 1 + R N i + 1 + R E i + 1 = F i + 1
where M is the mass matrix, C is the damping matrix, x ¨ i + 1 is the nodal acceleration vector, x ˙ i + 1 is the nodal velocity vector, R N i + 1 is the restoring force vector for the numerical substructure, R E i + 1 is the restoring force vector for the experimental substructure, and F i + 1 is the external load vector. During the analysis process, R N is obtained by calculation, whilst R E is derived from the test results. At each integration step, the displacement is calculated numerically and sent to the experimental substructure. Equation (1) is solved for the displacement x N at the interface between the experimental substructure and numerical substructure. The restoring forces R E are then fed back to the numerical substructure where the displacement is calculated for the next integration step. Such a procedure would be repeated until the end of the test.
OpenFresco is the middleware that allows the communication between the finite element software (OpenSees) and the experimental hardware (MTS actuator(s)). Displacement and force signals are transmitted and transformed on the OpenFresco platform. OpenFresco builds a bridge between the numerical model and the experimental specimen to fulfill the hybrid simulation process. OpenFresco is used to define the stiffness of the physical substructure, and in this way, the experimental substructure can be regarded as a part of the numerical model. The stiffness matrix would be updated based on the feedback force. The equation of motion could be solved with the updated stiffness matrix for the next integration step.

3. Numerical Substructure

3.1. Soil Modeling

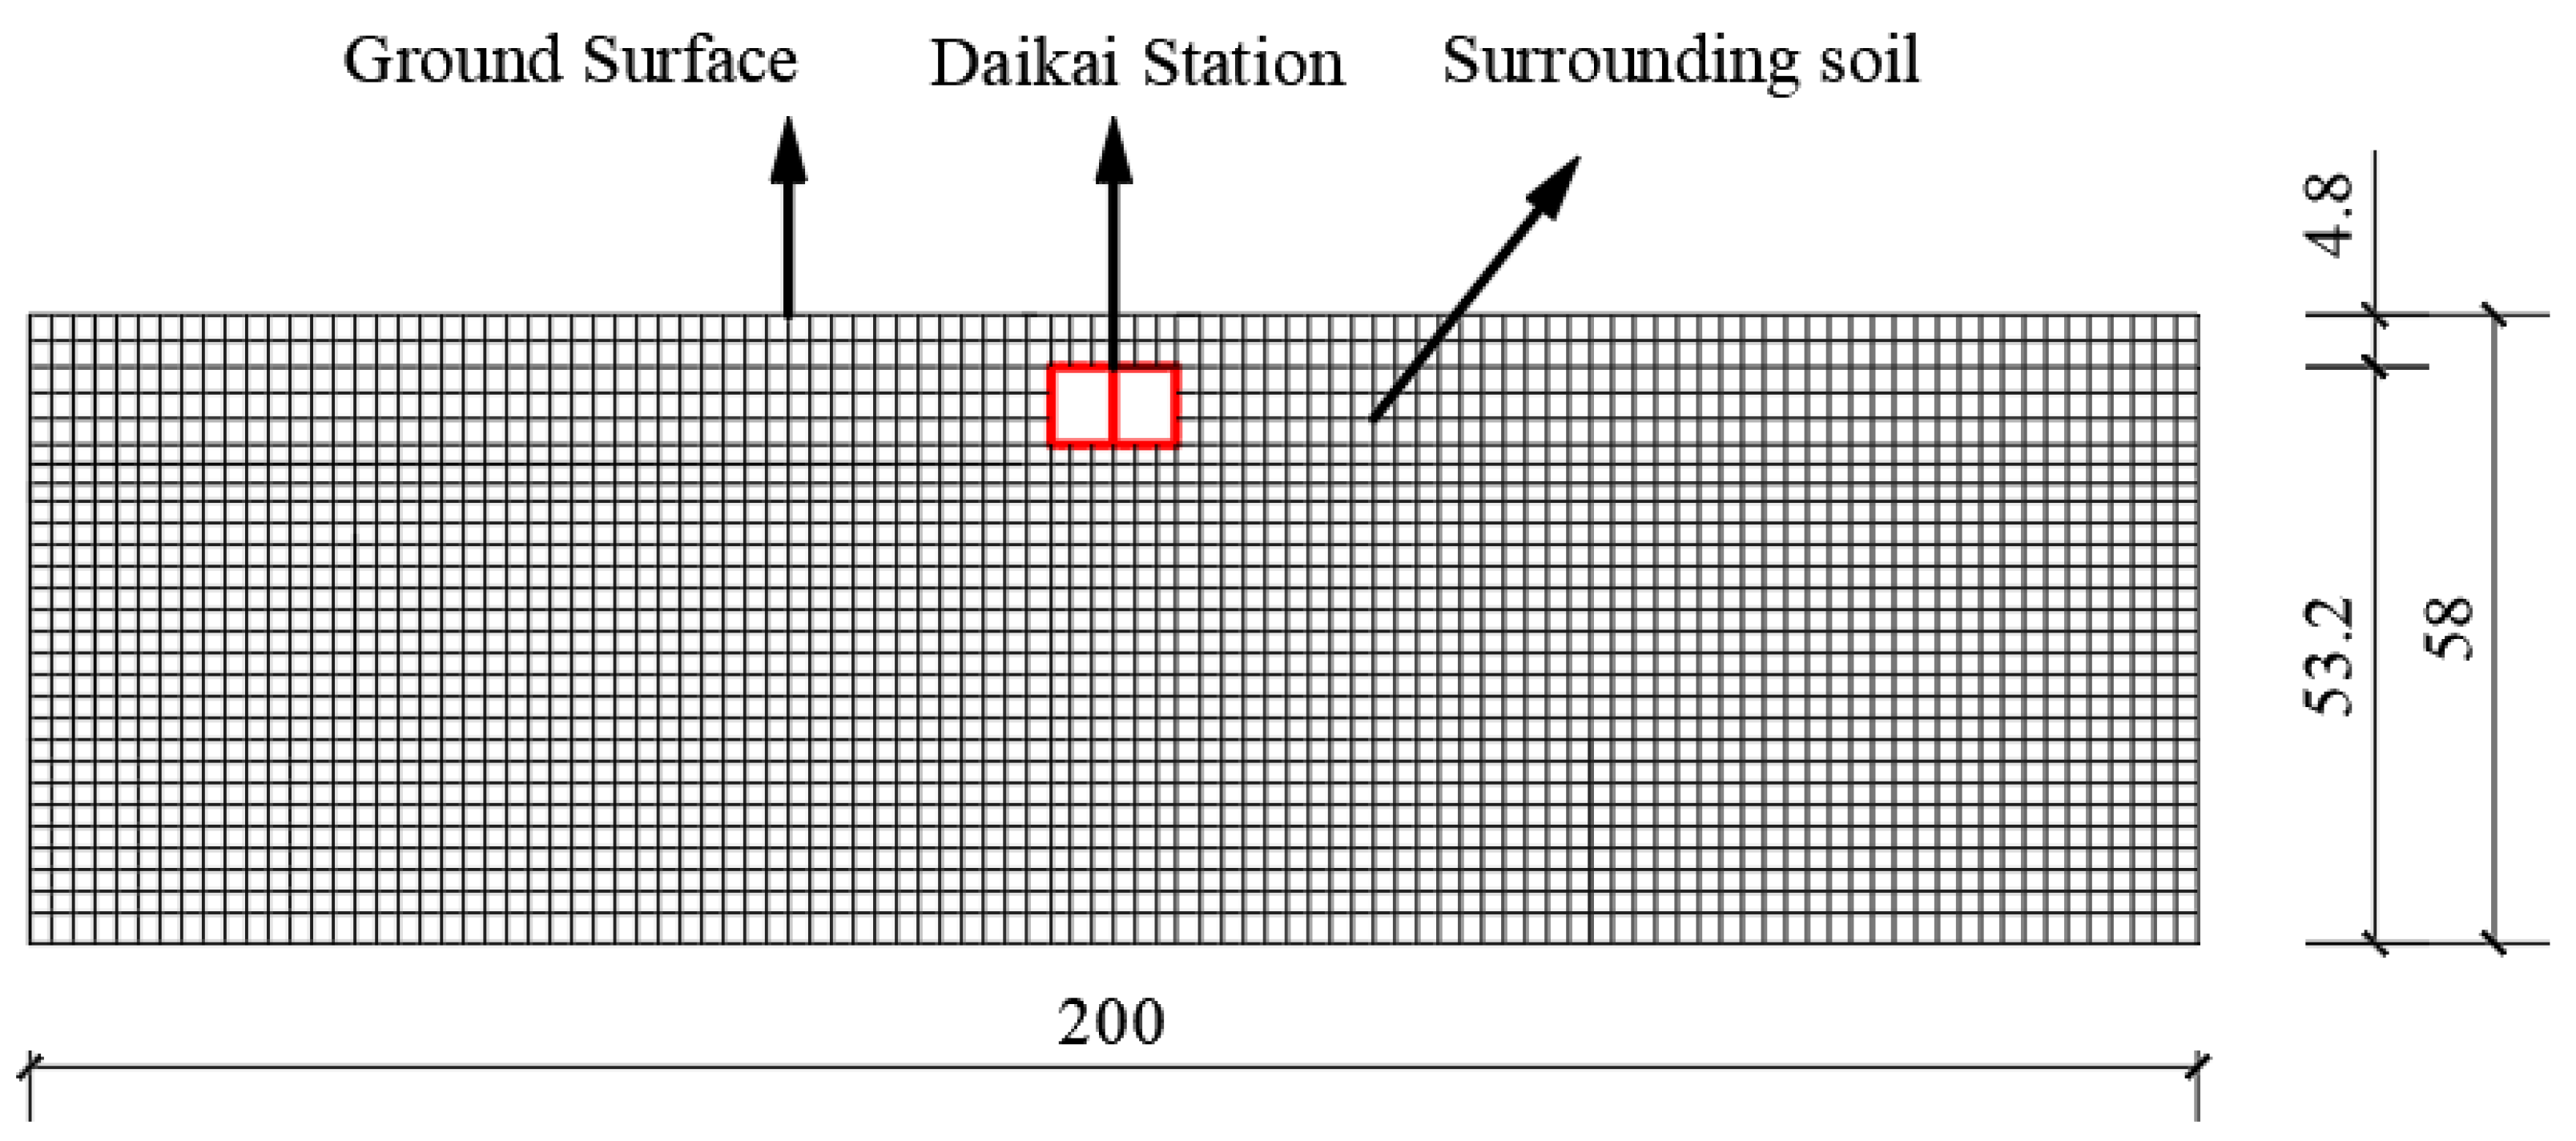
The FE model was established by the object-oriented and open source software OpenSees, with a width of 200 m (11.7 times of structural width) and a height of 58 m, as shown in Figure 1. The thickness of plane-strain model was 3.5 m because the column spacing was 3.5 m [19]. The central column was located at the center position of the model along the out-of-plane direction. The ground surface was set to be free. The fixed boundary was set at the bottom of the FEA model. The boundaries at the lateral sides of the model were set as the equal displacement boundary in order to reduce the impact of seismic wave reflection. All boundaries were supposed to be undrained.
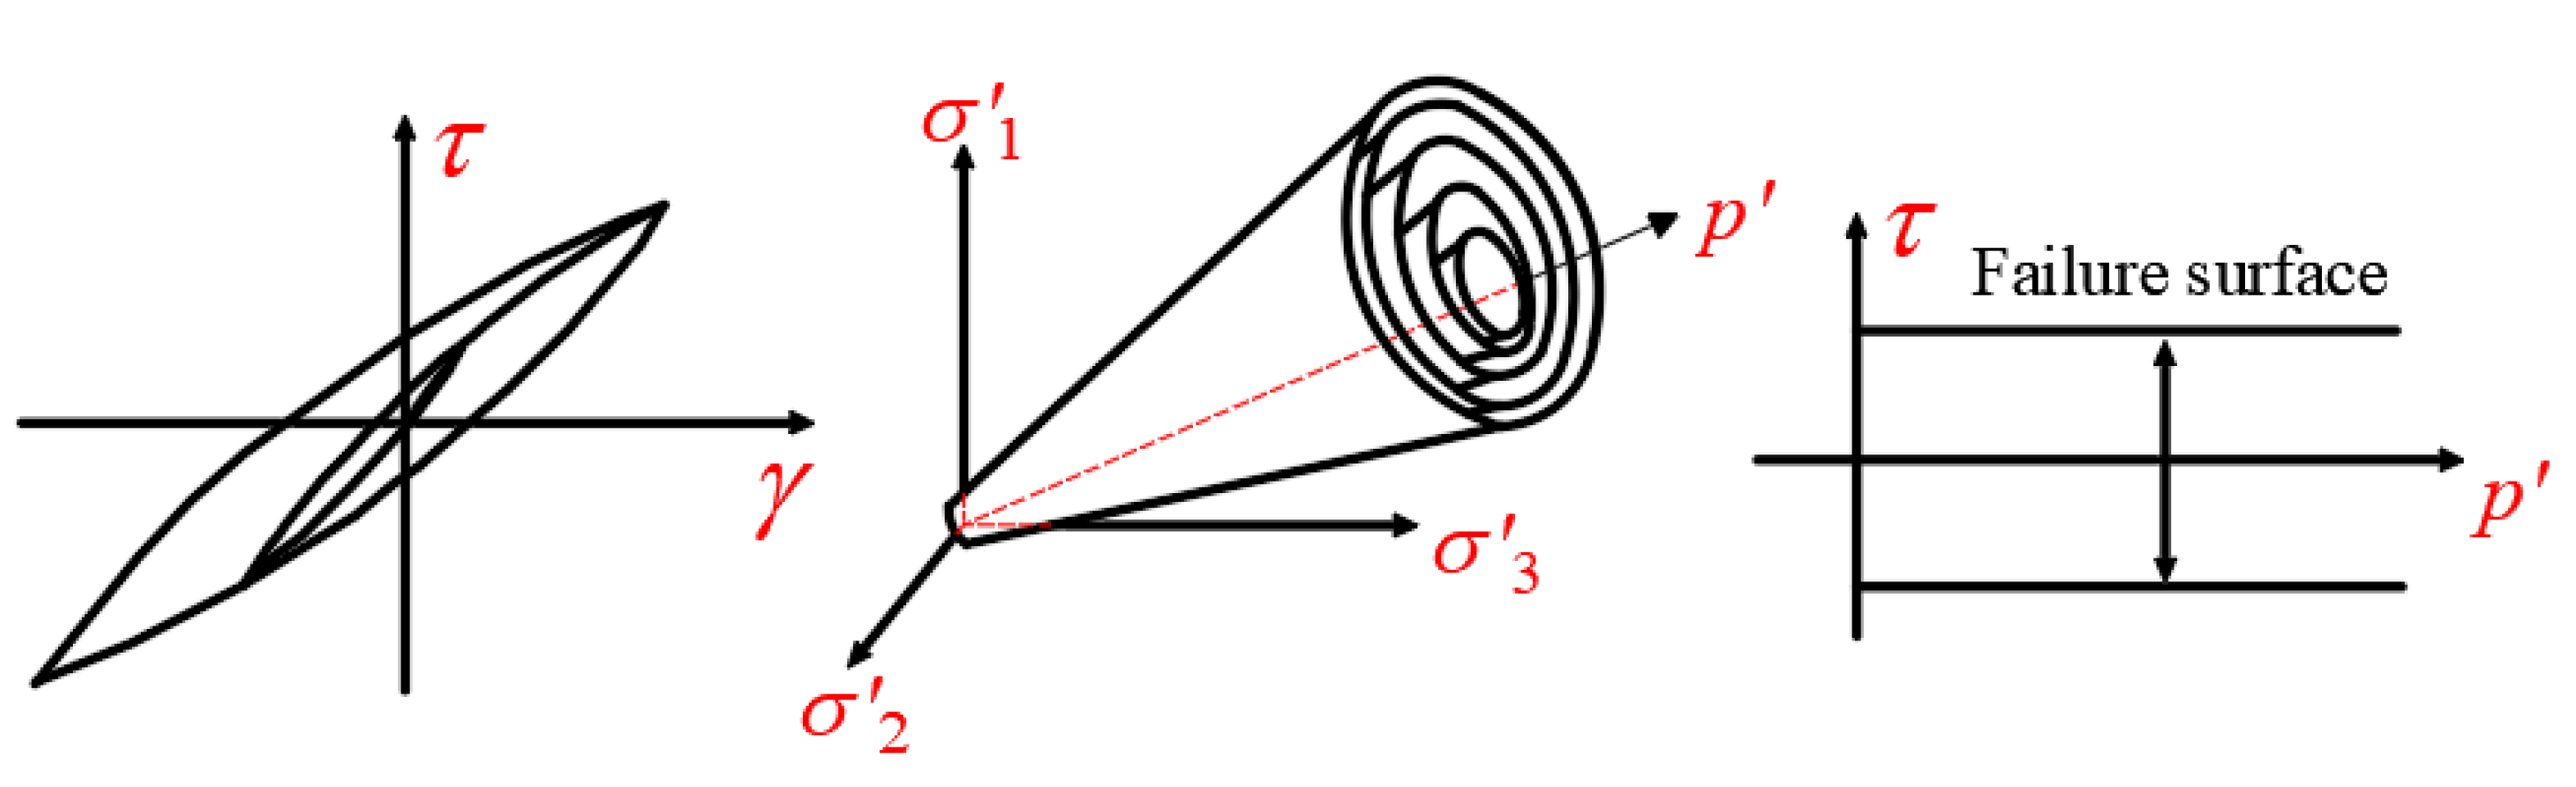
The soil was modeled with the pressure-dependent multi-yield-surface J2 plasticity material model [20]. In the multi-yield-surface clay model, it was postulated that the shear behavior was dependent on the soil confining pressure. In this constitutive model, a set of von Mises yield surfaces with different sizes formed a hardening zone, as shown in Figure 2. The outermost surface defined the shear strength (or failure) envelope. Nonlinear kinematic hardening and associative flow rules were employed to reproduce the Masing-type hysteretic behavior. The soil layers and parameters of the site are listed in Table 1.
The quad elements were applied to simulate the deposit, and such quad elements were four-node plane strain elements. The size of the soil elements should be less than one-eighth of the wavelength corresponding to the maximum frequency of the input seismic wave [21]. The Rayleigh damping model was applied in the analysis procedure. To be specific, the target damping ratio was set as 0.02. The stiffness parameter and the mass parameter were determined by Equation (2). The frequencies of first order and third order were derived to determine the damping coefficients.
{ α β } = 2 ξ ω 1 + ω 3 { ω 1 ω 3 1 }
where α is the mass parameter, β is the stiffness parameter, ξ is the damping ratio, ω 1 is the angular frequency of the first mode, and ω 3 is the angular frequency of the third mode.

3.2. Structure Modeling

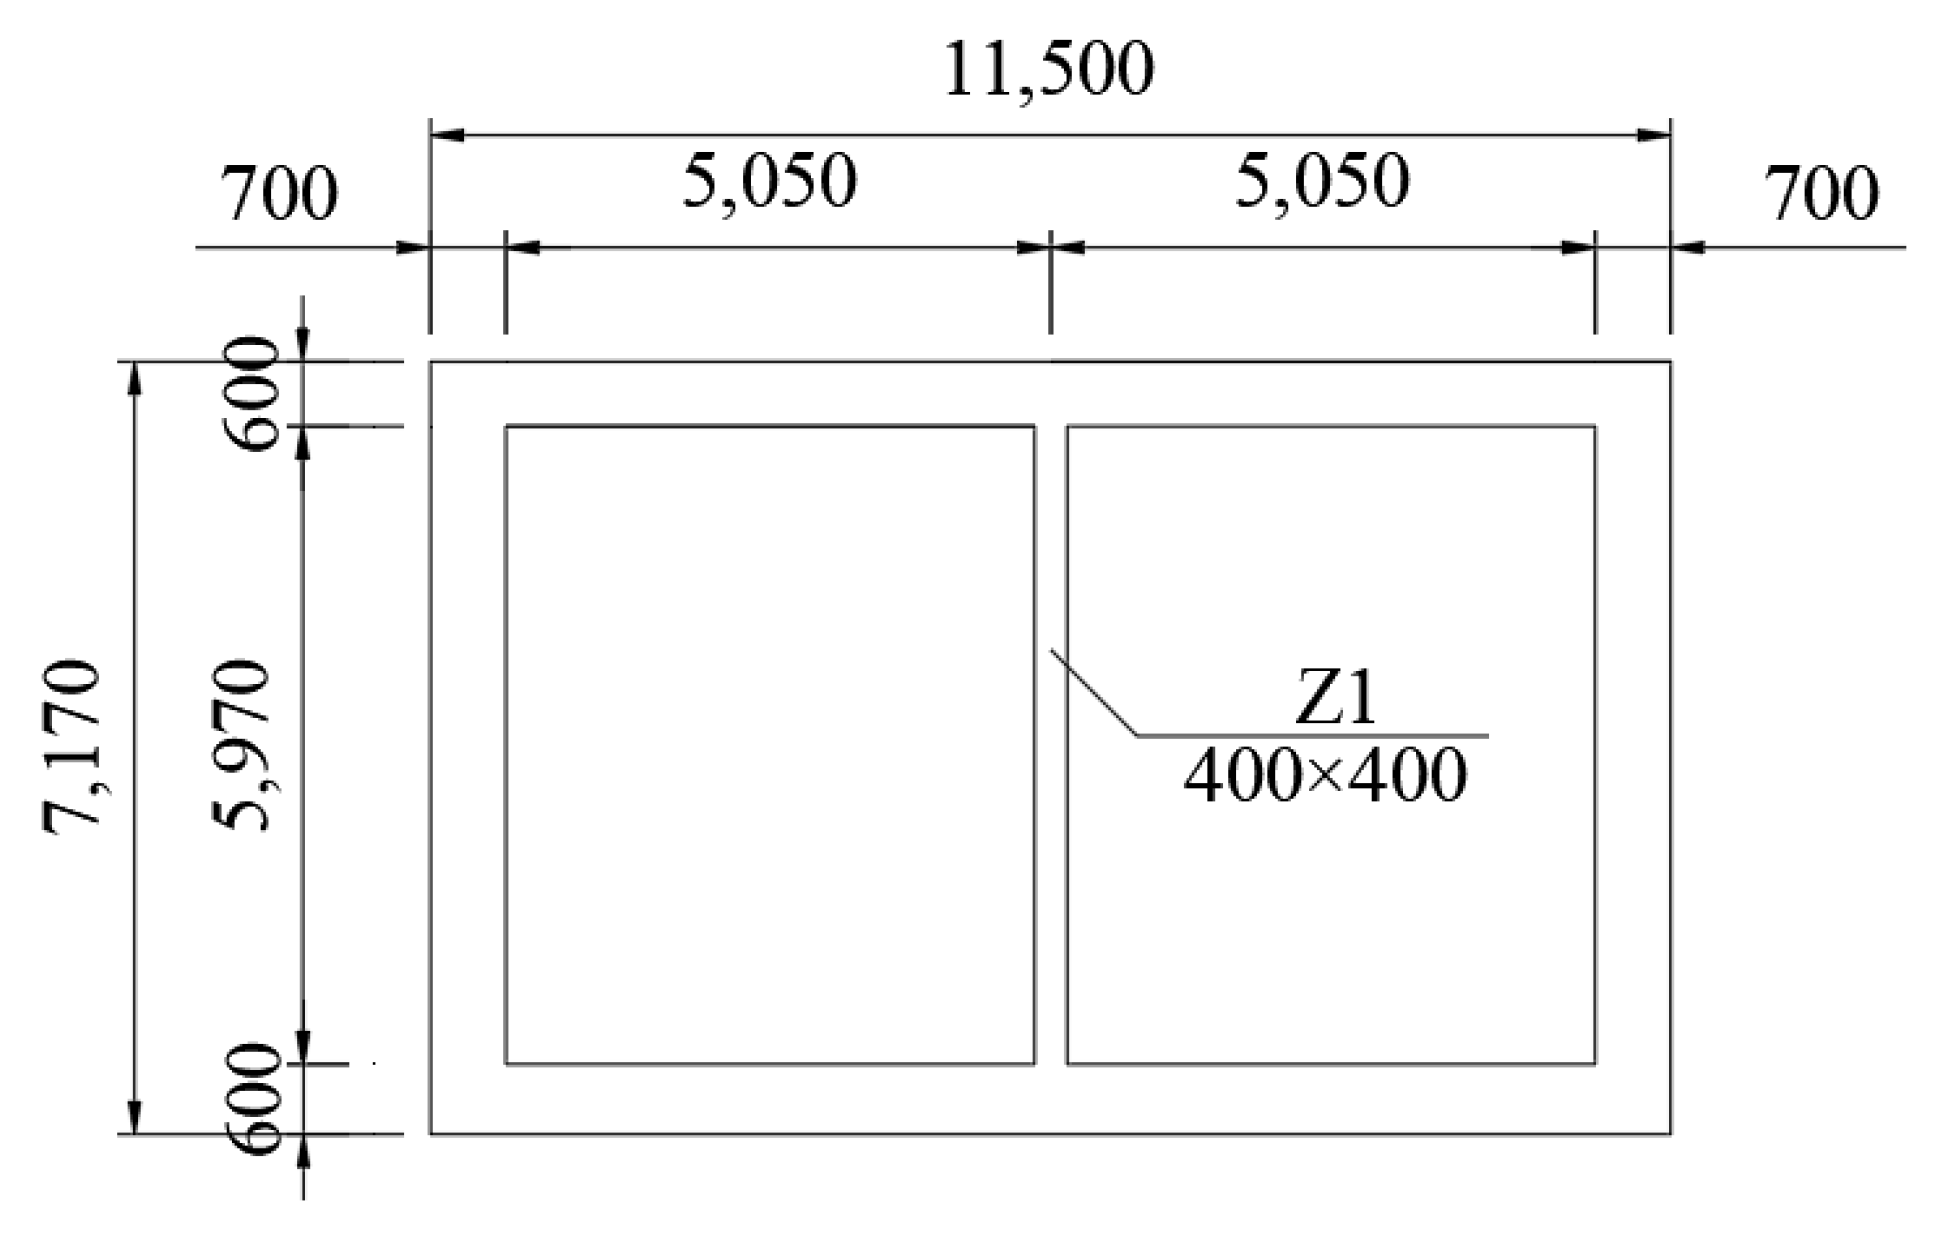
The finite element model of the stratum-station is shown in 
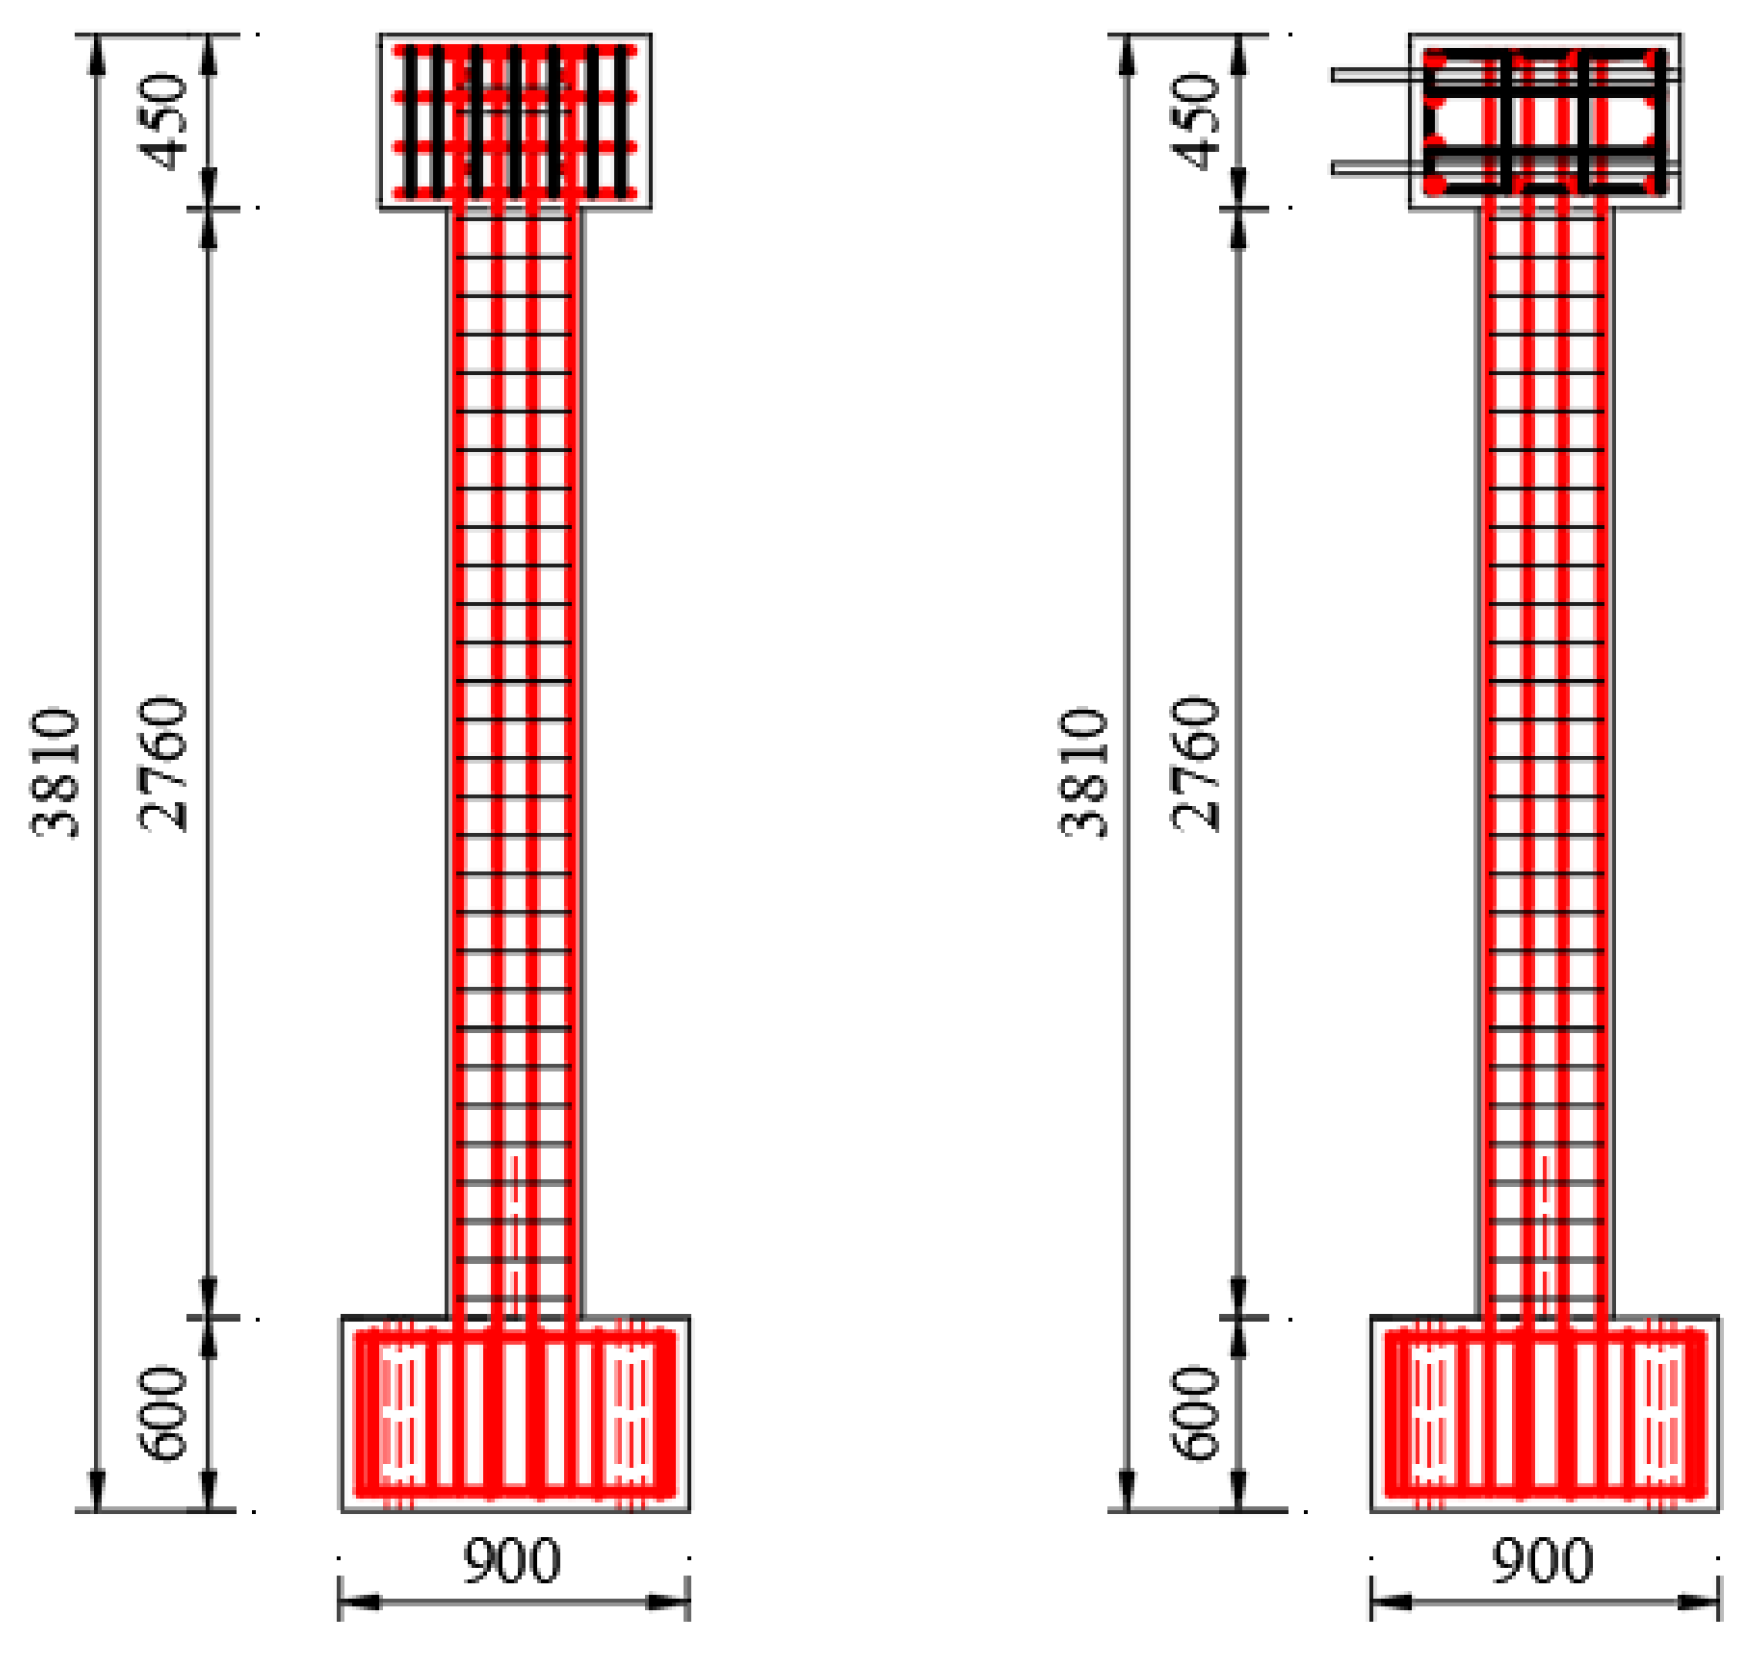
Figure 1. The subway station was a one-story two-bay RC frame with section dimensions given in Figure 3. The cross-section of the subway station measured 11.5 m × 7.17 m. The buried depth of the station structure was 4.8 m, and the column spacing was 3.5 m. The thickness of the station roof was 0.8 m, and the thickness of the bottom plate was 0.85 m, while the thickness of the sidewalls was 0.7 m. The cross-section of the center column measured 0.4 m × 0.4 m. The structure elements and the surrounding soil elements were fixed together, and the sliding effect of soil and structure was neglected in the analysis.
The subway station was modeled with distributed plasticity Euler–Bernoulli beam elements, which had four Gauss–Legendre integration points. The displacement based element was adopted to simulate the slabs, lateral walls, and central column. The element assumed the displacement field derived the formulation through the virtual displacement principle. For a given element displacement vector q , the section deformation vector d ( x ) at location x is approximated as below [22],
d ( x ) = N d ( x ) q
where N d ( x ) is the displacement interpolation function, and the Hermite polynomials can be used here. Then, the section force vector D ( x ) can be obtained through the fiber section model,
D ( x ) = K s ( x ) d ( x )
where K s ( x ) is the section stiffness matrix. According to the virtual displacement principle, the element resisting force Q and stiffness K e are expressed by Equation (5),
Q = L N d T ( x ) D ( x ) d x K e = L N d T ( x ) K s ( x ) N d ( x ) d x
where the integral can be computed through Gauss quadrature.
The Concrete 01 constitutive model as used to construct a uniaxial Kent–Scott–Park concrete material object with degraded linear unloading/reloading stiffness. In addition, no tensile strength was considered for such concrete material. The Concrete 01 model was utilized for the concrete, whilst the Steel 02 model was utilized for the reinforcements of the central column specimen. The whole structure had a density of 25 kN/m3, a Poisson’s ratio of 0.2, and a Young’s modulus of 32,500 MPa. The main parameters of the Concrete 01 model were the peak compressive yielding stress 36.4 MPa and peak strain 0.002, while the extreme compressive yielding stress 7.3 MPa and peak strain 0.004. The longitudinal reinforcements in the central column had a density of 7800 kN/m3, a Poisson’s ratio of 0.3, a Young’s modulus of 200 GPa, and a yielding stress of 431.5 MPa. The hardening ratio was set to be 0.01.
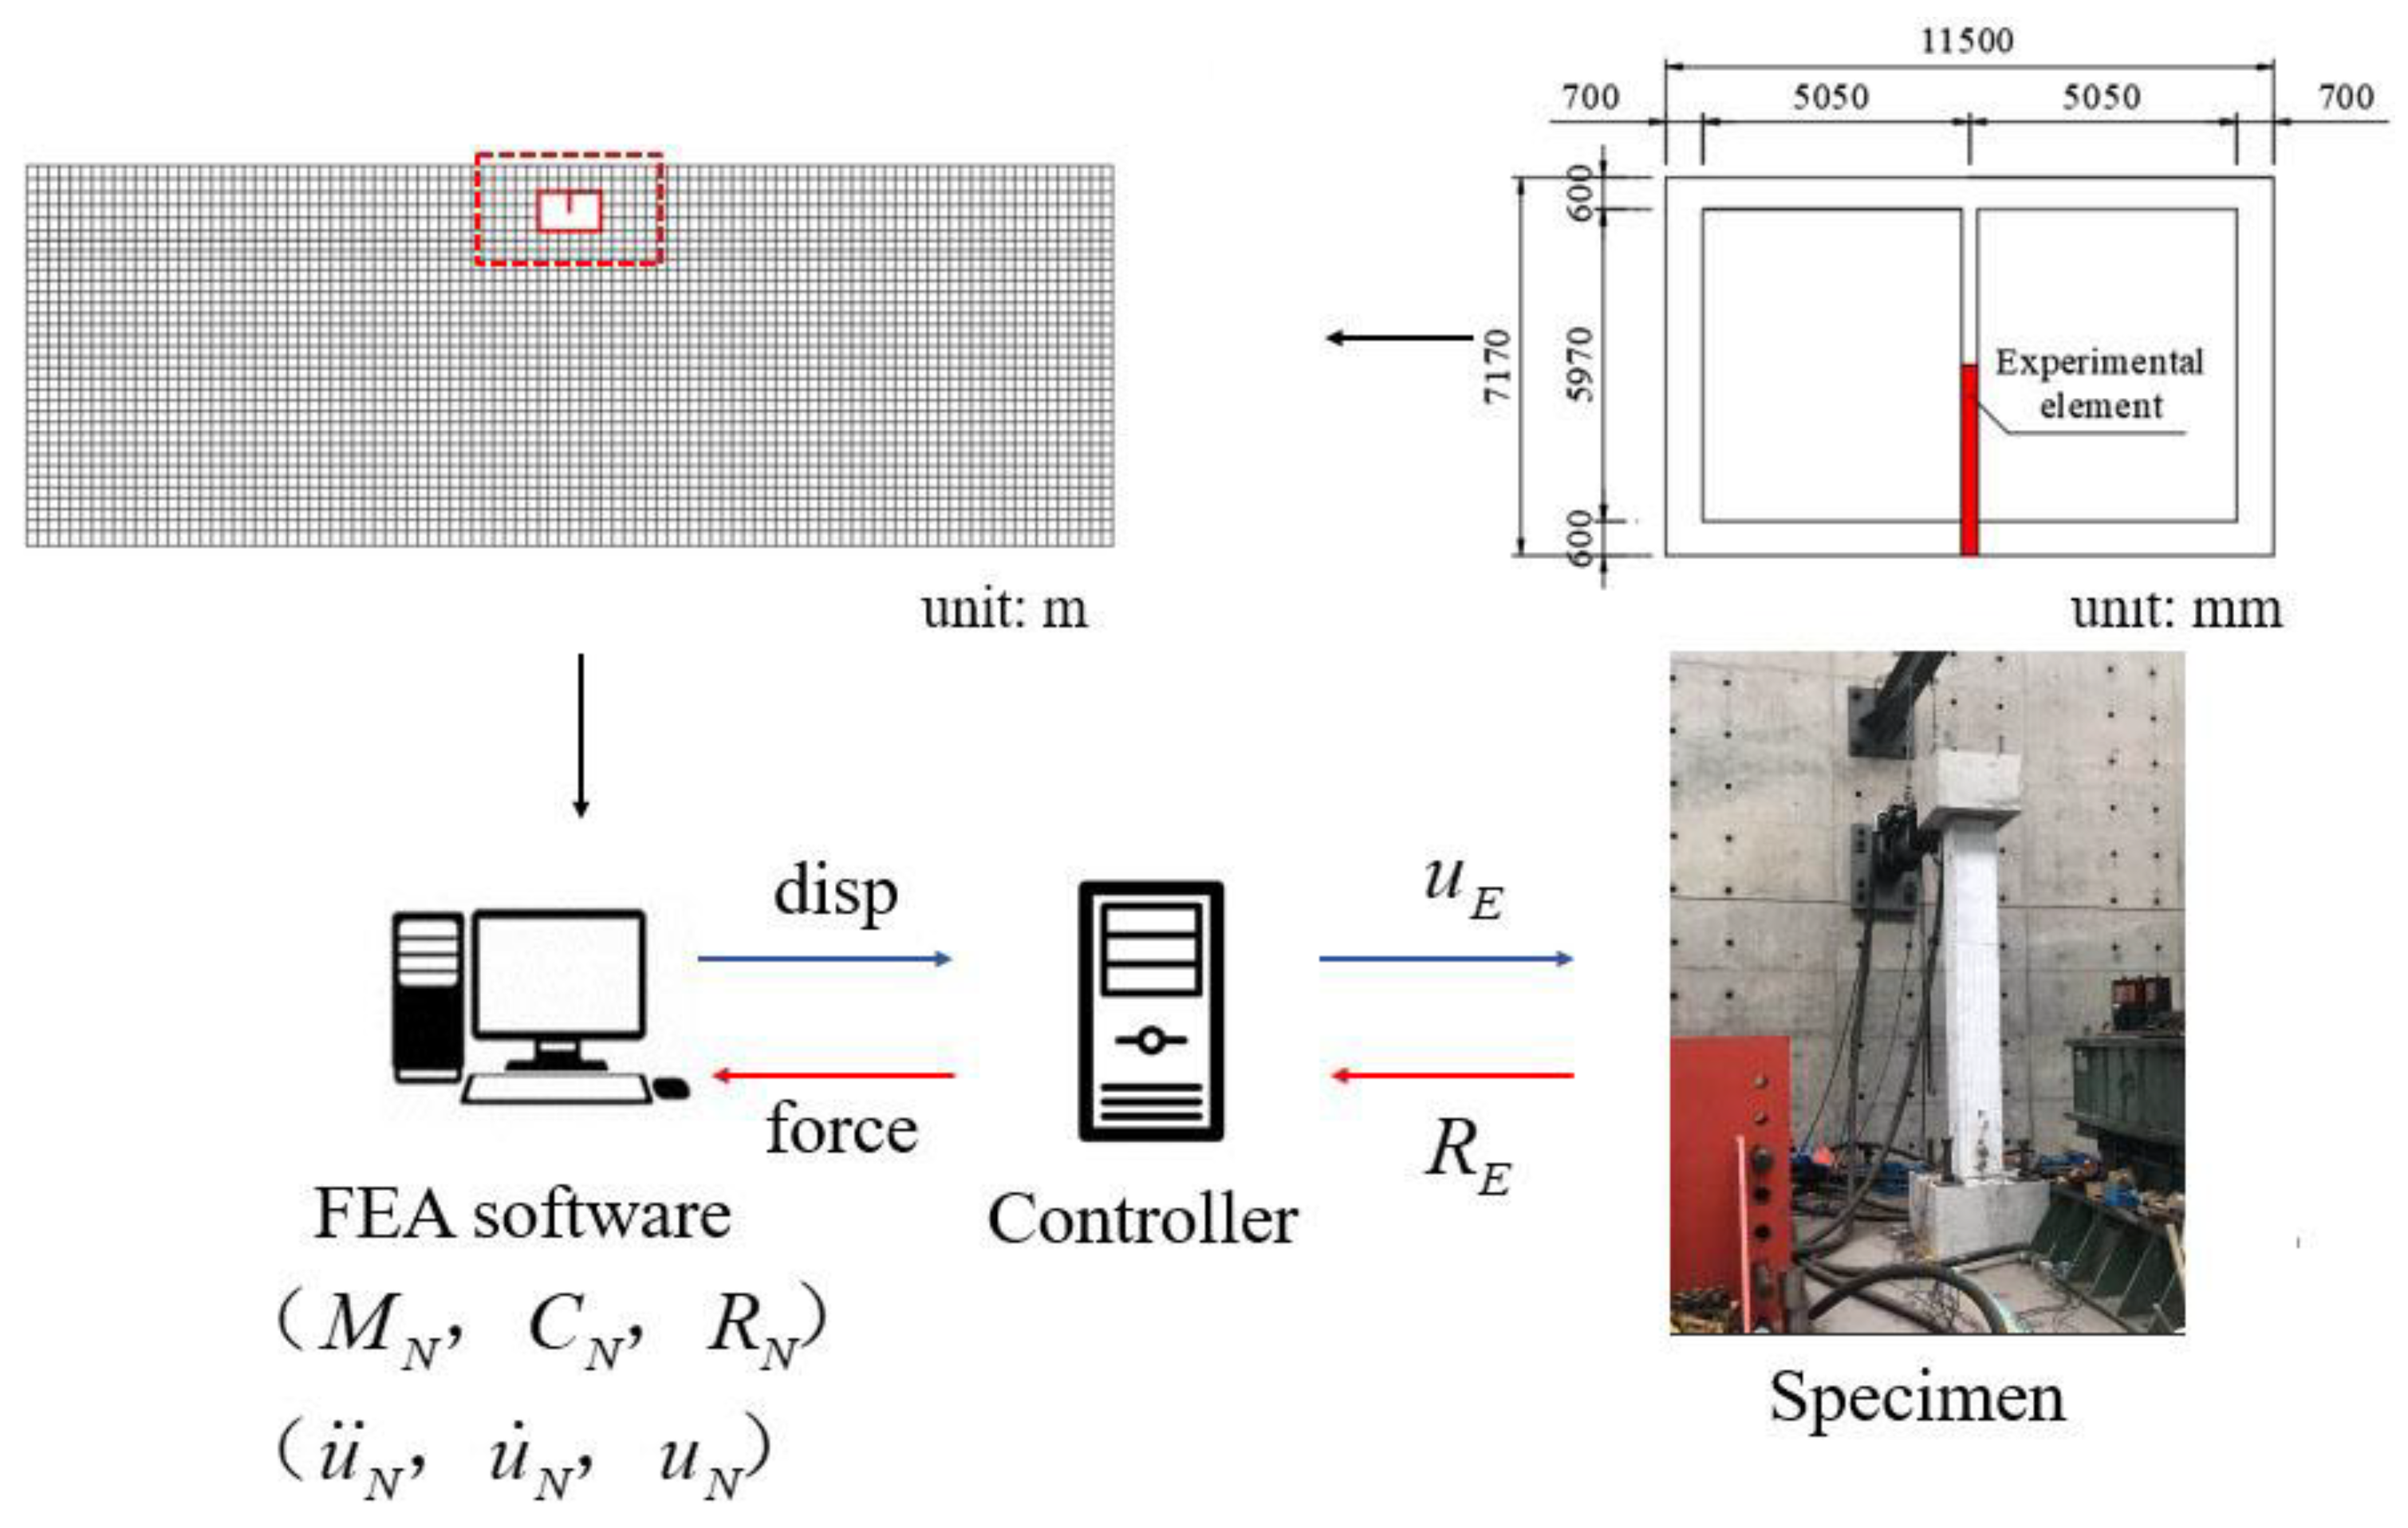
During the hybrid simulation process, the appropriate experimental substructure should be adopted to satisfy the boundary conditions. 
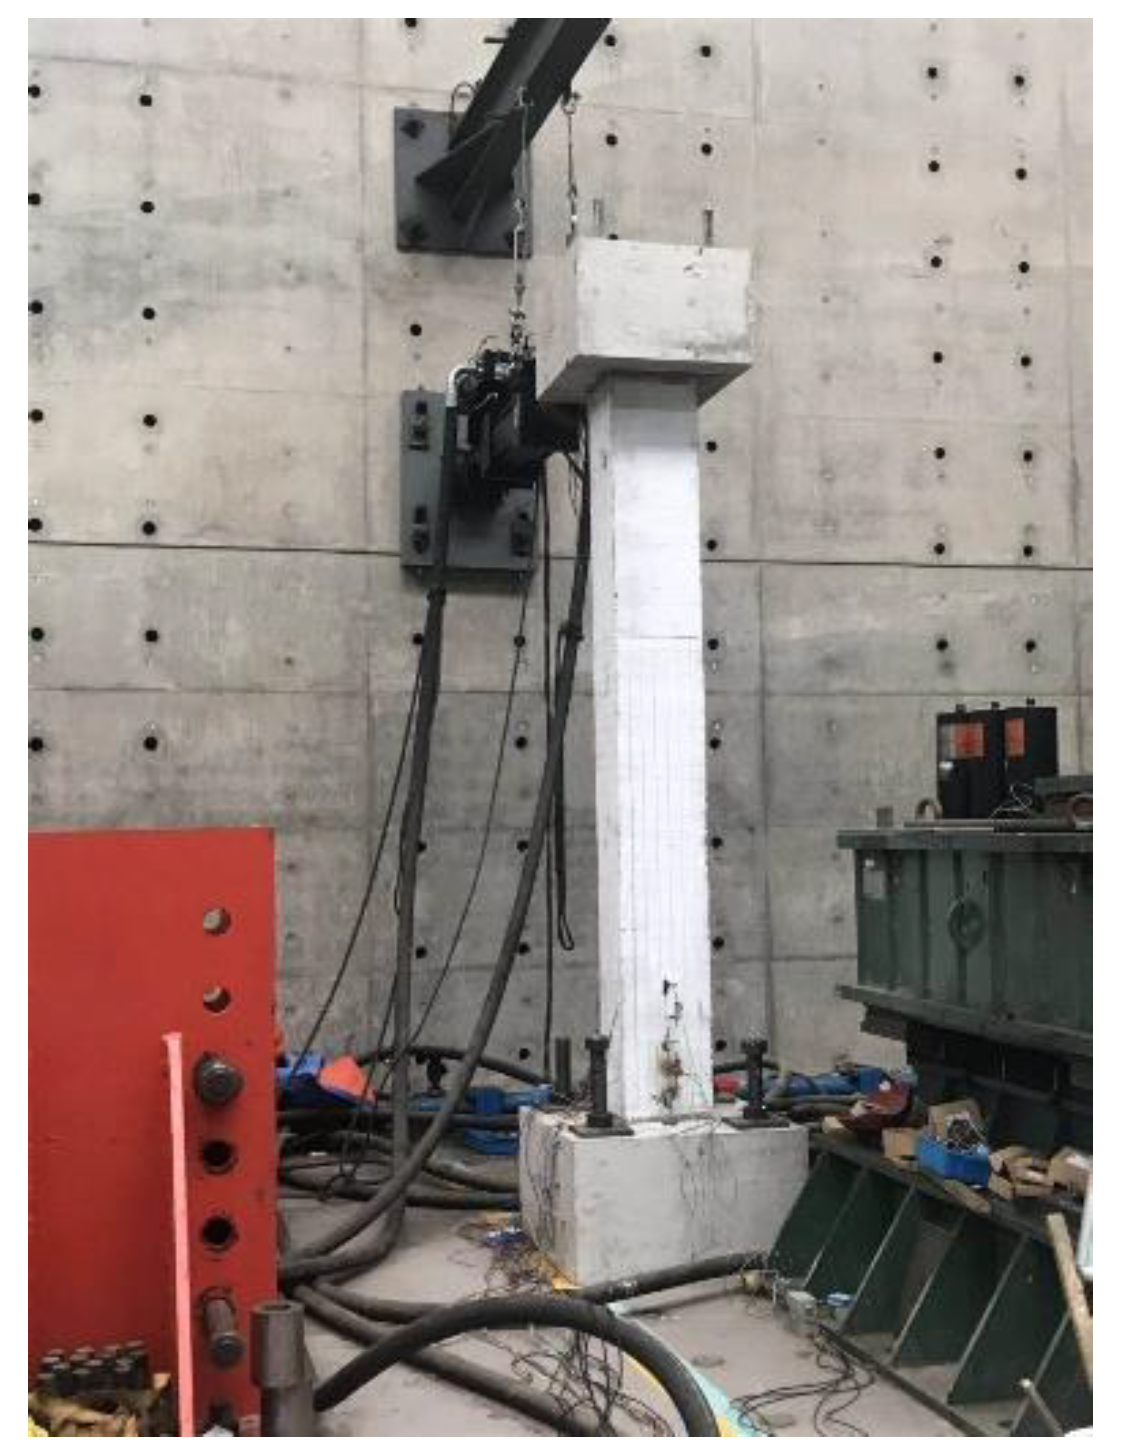
Figure 4 shows that the experimental specimen was selected based on the inflection point of the central column. It was assumed that the inflection point of the central column was located in the center. Therefore, the half bottom central column was adopted as the experimental substructure with a height of 3.56 m.
Two analysis steps should be involved. Firstly, geostatic analysis procedure should be carried out to balance the gravity load. Then, the dynamic analysis procedure should be carried out with the designated accelerations. Actually, only the dynamic process was conducted in this study because thrust was not applied on the top of the column specimen.
The end point of the Euler–Bernoulli beam element shared three degrees of freedom, corresponding to the axial direction, tangential direction, and rotational direction. Therefore, axial force, shear force, and bending moment should be taken into consideration in the traditional substructure hybrid simulation. In the hypothetical model, the top point of the column was the inflection point, and the position of inflection point did not change in the hybrid simulation test. Based on the assumptions mentioned above, shear force could be considered. However, both bending moment and thrust were neglected in the test.

3.3. Input Motions

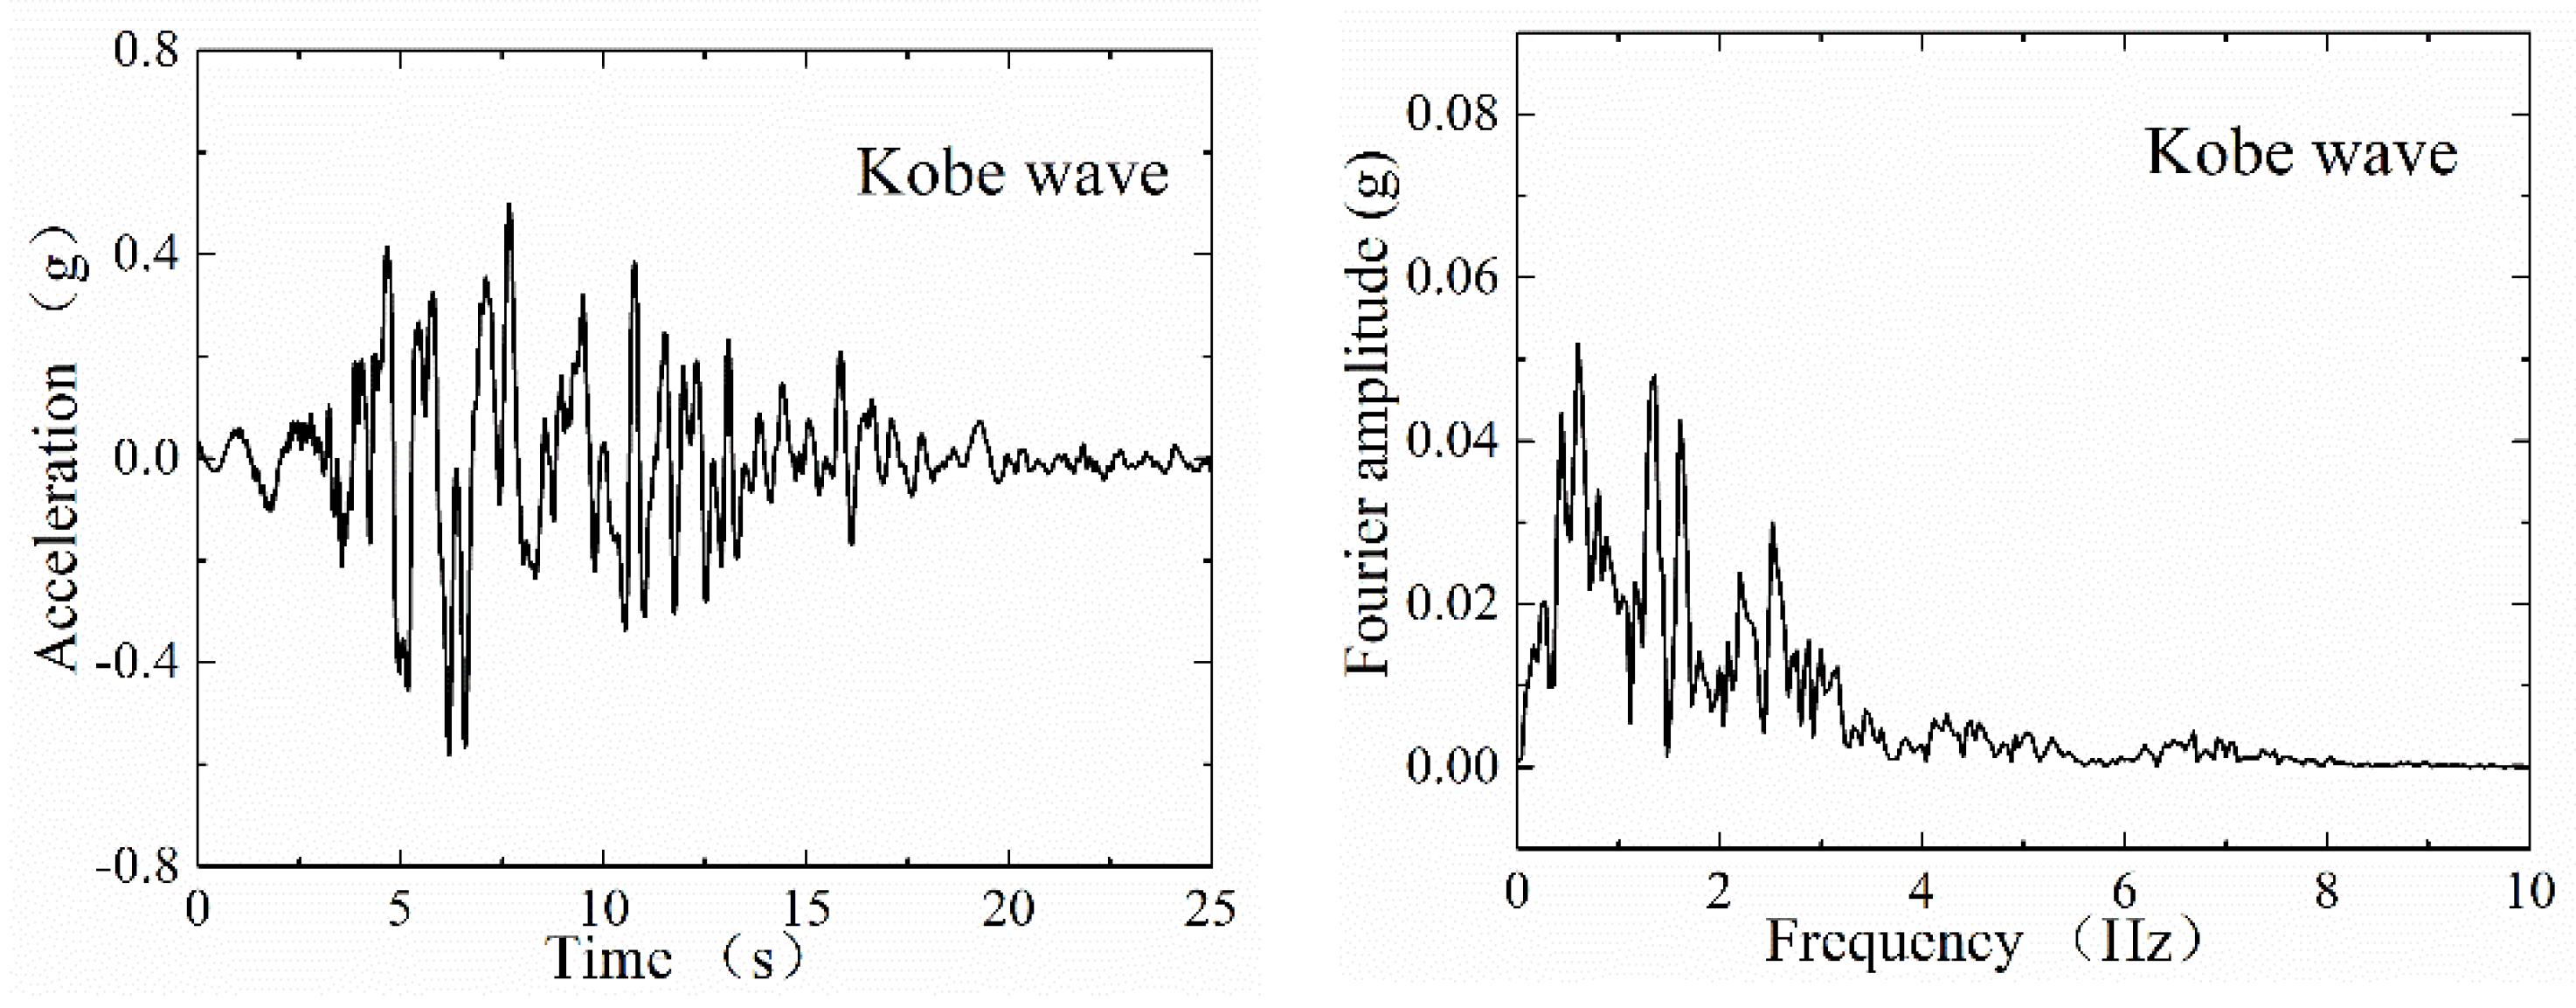
The Kobe wave, which was recorded at Port island, was adopted as the input earthquake motion. Figure 5 shows the seismic acceleration time histories and spectra. The frequency content of the Kobe wave was mainly below 10 Hz, and the dominant frequency ranged from 0.60 to 1.36 Hz based on the results of Fourier transformation. The PBA (peak base acceleration) of the Kobe wave was scaled to 0.01 g, 0.10 g, 0.22 g, and 0.58 g in this paper. The accelerations were applied on the bedrock face, which was 58 m away from the ground surface level.
The 2D numerical model had a width of 200 m and a depth of 58 m. The width of the site was large enough that the influence of the reflected wave near the lateral boundary could be ignored. The lateral boundary was set as an equal-displacement and impermeable boundary. Vertically polarized shear waves (SV seismic waves) could be appropriately considered by setting the equal-displacement boundary.

4. Experimental Substructure

4.1. Specimen Details

The construction drawing of the RC central column specimen is shown in Figure 6. As the loading capacity of the horizontal actuator was 150.0 kN, the section of the central column was designed as 400 mm × 400 mm. Besides that, the sectional reinforcement was designed to meet the requirements of the Chinese code, which is shown in Figure 6. To be specific, the section of the central column was 400 mm × 400 mm, and the section of column footing was 900 mm × 900 mm, while the section of the loading end was 700 mm × 700 mm. Cube tests were carried out according to the Standard of Testing of Mechanical Properties of Ordinary Concrete [23]. The compressive strength of concrete at the 28th day was 36.4 MPa, determined on three cubes. The longitudinal rebars of the column were welded bars with a diameter of 20 mm, and the yield stress was 431.5 MPa. The beam and column stirrups were smooth bars with a diameter of 10 mm, and the stirrup spacing was 100 mm.
The central column specimen was assumed to be fixed on the laboratory’s rigid floor. In the subway station, the linear stiffness ratio of the floor to the central column was 70 in this junction. To be specific, the cross-sectional dimension of the central column was 400 mm × 400 mm, whilst the cross-sectional dimension of the floor was 3500 mm × 850 mm. According to the conclusion in [6], the station floor could be considered as a rigid body on the condition that the linear stiffness ratio of the station floor to the central column was more than 10. Thus, it was a reasonable assumption that the column bottom could be regarded as a fixed end. The top point of the specimen was the control point in the hybrid simulation, and the control point could provide the interaction between the numerical model and the experimental specimen. At the top point of the specimen, the horizontal actuator was connected to the specimen with pre-embedded bolts.

4.2. Experiment Setting

The MTS hybrid simulation system consisted of a 150 kN capacity high speed linear hydraulic actuator, the simulation host PC, and a two-channel MTS 793 controller. The purpose of the OpenFresco middleware was to build the bridge between the loading hardware and the computation hardware. Several key parameters should be defined on the OpenFresco platform to realize the hybrid simulation process, including “experimental element”, “experimental site”, “experimental setup”, and “experimental control”.
The MTS-CSI control method, which is suitable for the MTS 793 Controller, was used in the hybrid simulation test. The control point managed the displacement order in the horizontal direction. Moreover, the control point would record the actual loading displacement signals and transmit back the restoring force from the experimental substructure. To be specific, the middle point of the central column was adopted as the control point. The loading displacement order was converted on the OpenFresco platform. The hybrid simulation was fulfilled in a number of local experimental systems. The communication between the physical substructure and numerical substructure could take place through a fixed cable. Therefore, such a hybrid simulation was named as the local hybrid test on OpenFresco platform. A 2D “ExpBeamcolumn element” with initial stiffness was applied for the hybrid simulation; “ExpBeamcolumn element” had two end nodes with three degrees of freedom, namely axial direction, tangential direction, and rotational direction. The initial stiffness matrix of the “ExpBeamcolumn element” can be obtained by Equation (6),
K exp = [ k v 0 0 0 k h 0 0 0 0 ]
where k v is vertical stiffness of the specimen and k h is the horizontal stiffness of the specimen. The numbers in the third column and row in the stiffness matrix were zero, since there was no moment transfer at the top of the column.

5. Hybrid Simulation Process

5.1. Experiment Procedure

The test setup of the hybrid simulation is shown in Figure 7. A high speed linear hydraulic actuator was connected to the load end of the specimen. As shown in Figure 7, one steel beam was installed above the actuator. The steel wires on the steel beam were used to hang the actuator to ensure the safety of the actuator.

5.2. Structural Response

To evaluate the accuracy of the hybrid test, the results of the analytical model and hybrid simulation are plotted in the same figure. In the case with the peak ground acceleration of 0.01 g, the time histories of drift responses and shear forces at the control point of the hybrid model are given in Figure 8. The good correspondence between the hybrid simulation result and the analytical model result validated the accuracy of the test method at the elastic stage.
Dyke [24] proposed nine indexes to evaluate the accuracy of the hybrid simulation process. As shown in Equations (7) and (8), J 2 and J 3 could be applied to evaluate the test results in this paper. To be specific, J 2 is the standardized RMS error, which could describe the fitness between experimental displacement and analytical displacement in the whole test process. J 3 is the standardized peak error, which could describe the error at the peak response and illustrate the fitness between experimental displacement and analytical displacement at the peak response,
J 2 = i = 1 N [ x m ( i ) y n ( 1 ) ( i ) ] 2 i = 1 N [ y n ( 1 ) ( i ) ] 2 × 100 %
J 3 = max | x m ( i ) y n ( 1 ) ( i ) | max | y n ( 1 ) ( i ) | × 100 %
where x m ( i ) is the test result at time i and y n ( 1 ) ( i ) is the numerical result at time i . In the displacement result depicted in Figure 8, J 2 was computed as 12.4%, whilst J 3 was computed as 4.7%. The accuracy of such test method would be verified with the results of J 2 and J 3 .
As the PBA increased, the RC column specimen reached its plastic state, which is shown in Figure 9 and Figure 10. The stiffness degradation of the specimens during the loading process was described by the secant stiffness trend. The peak-to-peak secant stiffness of the load-displacement hysteretic response was applied to define the secant stiffness trend. This parameter is calculated as:
K i = F i + F i D i + D i
where K i is the secant stiffness, F i + and F i are the peak loads in the positive and negative loading directions, respectively, and D i + and D i are the corresponding displacements in the positive and negative loading directions, respectively.
In the 0.10 g case, 0.22 g case, and 0.58 g case, the lateral stiffnesses of the specimen were 3.37 kN/mm, 2.53 kN/mm, and 2.37 kN/mm. Therefore, the reductions in the lateral stiffness of the specimen were 24.9% and 29.7% compared to the initial stiffness. The experimental substructure could accurately capture the mechanical behaviors of the RC specimen. Compared with the analytical results, the decrease of the peak shear force and the increase of the peak drift were caused by the reduction of the specimen stiffness.
Based on the test results mentioned above, it could be concluded that the computer hardware (OpenSEES, OpenFresco) and loading hardware (MTS actuator with a 150 kN capacity) could be applied to fulfill the hybrid simulation process to evaluate the seismic performance of the typical station. Followed by the quasi-static test, the ultimate displacement and load capacity of the specimen are discussed to illustrate the mechanical behavior of the central column after the earthquake excitation.

6. Quasi-Static Test

6.1. Experiment Procedure

After the hybrid simulation process, a quasi-static test was conducted to illustrate the mechanical properties of the central column after the earthquake excitation. The bottom of the column was fixed to the strong floor with four screws. At the top end of the specimen, the actuator was applied to provide the horizontal force. The linear hydraulic actuator had a 150 kN capacity with a 500 mm (±200 mm) stroke. The reversed horizontal loading with increasing amplitude was applied. The cyclic loading was displacement controlled, and the loading scheme is shown in Figure 11. In the first stage of the test, two fully reversed cycles were applied with an increment of 10.0 mm until the drift reached 60.0 mm. In the second stage of the test, two fully reversed cycles were applied with an increment of 20.0 mm until the drift reached 180.0 mm.

6.2. Experimental Observations

In Figure 12, the crack pattern is observed and recorded on the four sides (Side A, Side B, Side C, and Side D). Side C was the tension side when the loading direction was positive, whilst Side D was the tension side when the loading direction was negative. Side A and Side B were the lateral sides, which were parallel to the loading direction.
On Side A and Side B, cracks were horizontal before the loading displacement reached 40.0 mm. Such cracks were mostly tensile cracks. After the 40.0 mm loading stage, as loading proceeded, flexural cracks started to propagate, and the width of the flexural cracks increased. The propagation direction was oblique due to the effect of shear force. When the displacement reached 80.0 mm, on Side C, the width of largest horizontal crack reached 2.8 mm. When the displacement reached 100.0 mm, on Side C, the width of largest horizontal crack reached 4.6 mm. On Side D, the width of the largest horizontal crack reached 3.3 mm. When the displacement reached 140.0 mm, on Side C, the width of largest horizontal crack reached 8.0 mm. On Side D, the width of largest horizontal crack reached 4.5 mm.

6.3. Test Results

The load-displacement hysteresis curve is shown in Figure 13. At the loading stage of 80.0 mm, the positive peak load reached 91.0 kN, while the negative peak load reached 88.2 kN. At the loading stage of 180.0 mm, the positive ultimate load reached 88.8 kN, whilst the negative ultimate load reached 92.1 kN. The specimen exhibited a ductile behavior based on the test results. The hysteresis curve of the specimen was wide, and the ultimate strength did not decrease at the end of the test.

6.4. Energy Dissipation

The area enclosed by a hysteretic loop was the energy dissipation of a specimen at each loading cycle. The cumulative energy dissipation was calculated as the summation of the quantities of energy dissipated in consecutive loops throughout the cyclic load reversals [25]. The cumulative energy dissipation of the test specimens is shown in Figure 14. Up to a drift ratio of 1.6%, only a small amount of energy was dissipated. After the displacement reached a drift ratio of 1.6%, the increment of cumulative energy dissipation was almost the same, namely 4077 kN.mm per stage.

6.5. Stiffness Degradation

The degradation of specimen stiffness is shown in Figure 15. Based on the test results mentioned above, it could be seen that the ultimate load of the specimen did not decrease Therefore, the stiffness of the specimen experienced a decreasing trend in the whole experiment process. Figure 15 shows that the specimen exhibited a good ductility. The test results of the hybrid simulation and quasi-static test showed that the designated RC column in this paper had a good performance both in the earthquake excitation process and after earthquake excitation.

7. Conclusions

Although the hybrid simulation technique with RC specimens could be applied to reproduce the seismic behavior of the typical subway station, there were still some shortcomings that need to be overcome. The first shortcoming was the application of thrust. As thrust was not applied in the test, gravity analysis was not performed. Such a loading condition did not coincide with the real condition. The second shortcoming was the assumption of the inflection point. The bottom half column was adopted as the physical substructure on the condition that the position of the inflection point would not change during the test. Limited to the laboratory conditions, such an assumption was made to meet the requirements of the hybrid test. The third shortcoming was the constitutive model of the deposit. The parameters of the soil constitutive model should be calibrated with the corresponding test results. However, such work was not promoted in this paper. Hence, the aforementioned three factors could be used as predictors to further improve the accuracy of the hybrid simulation and estimate the seismic behavior of the typical station.
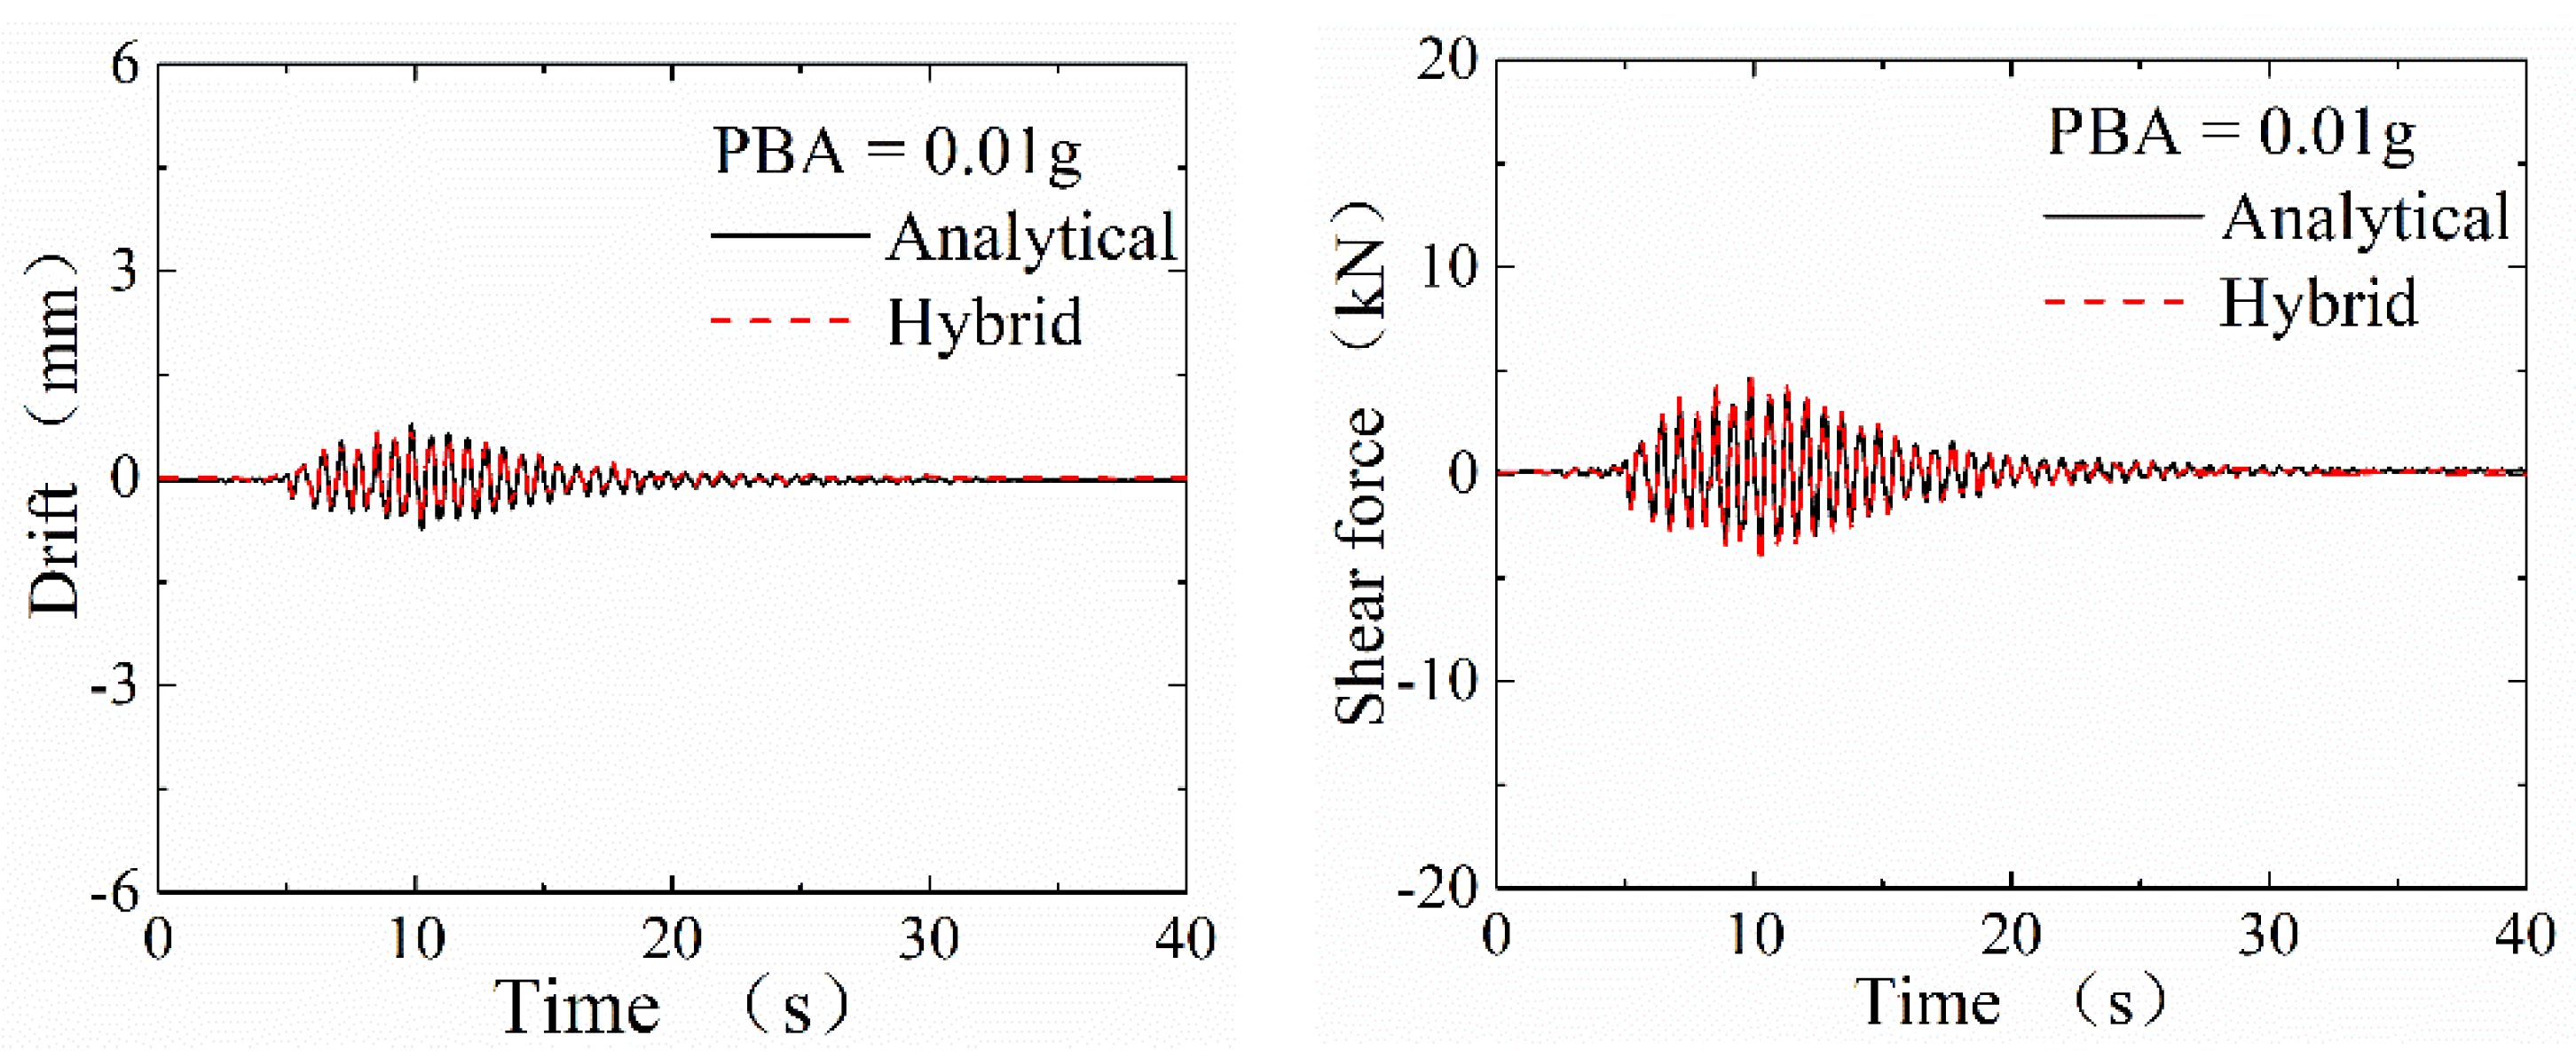
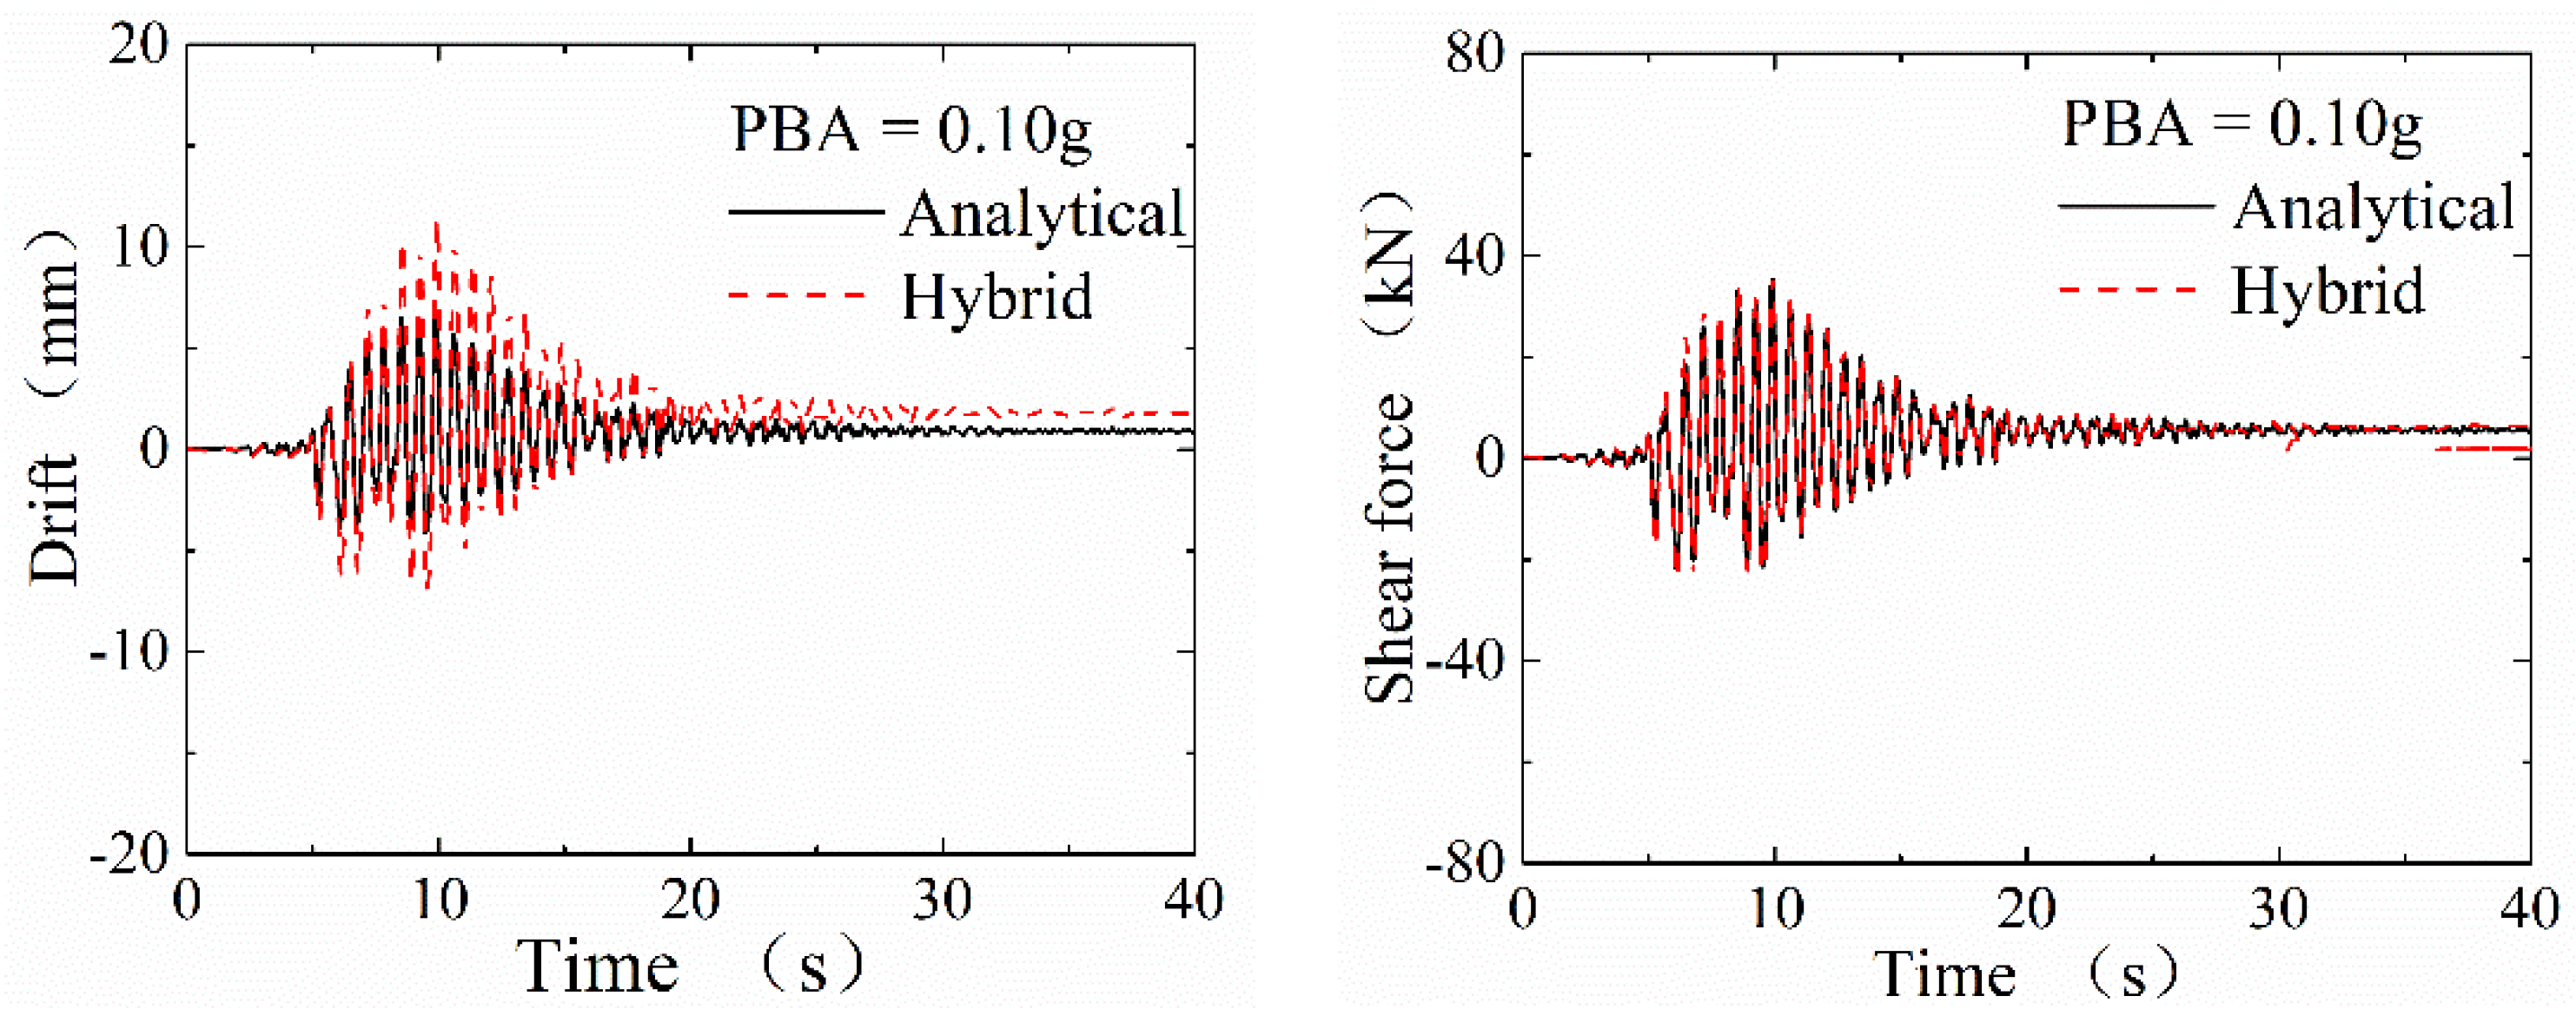
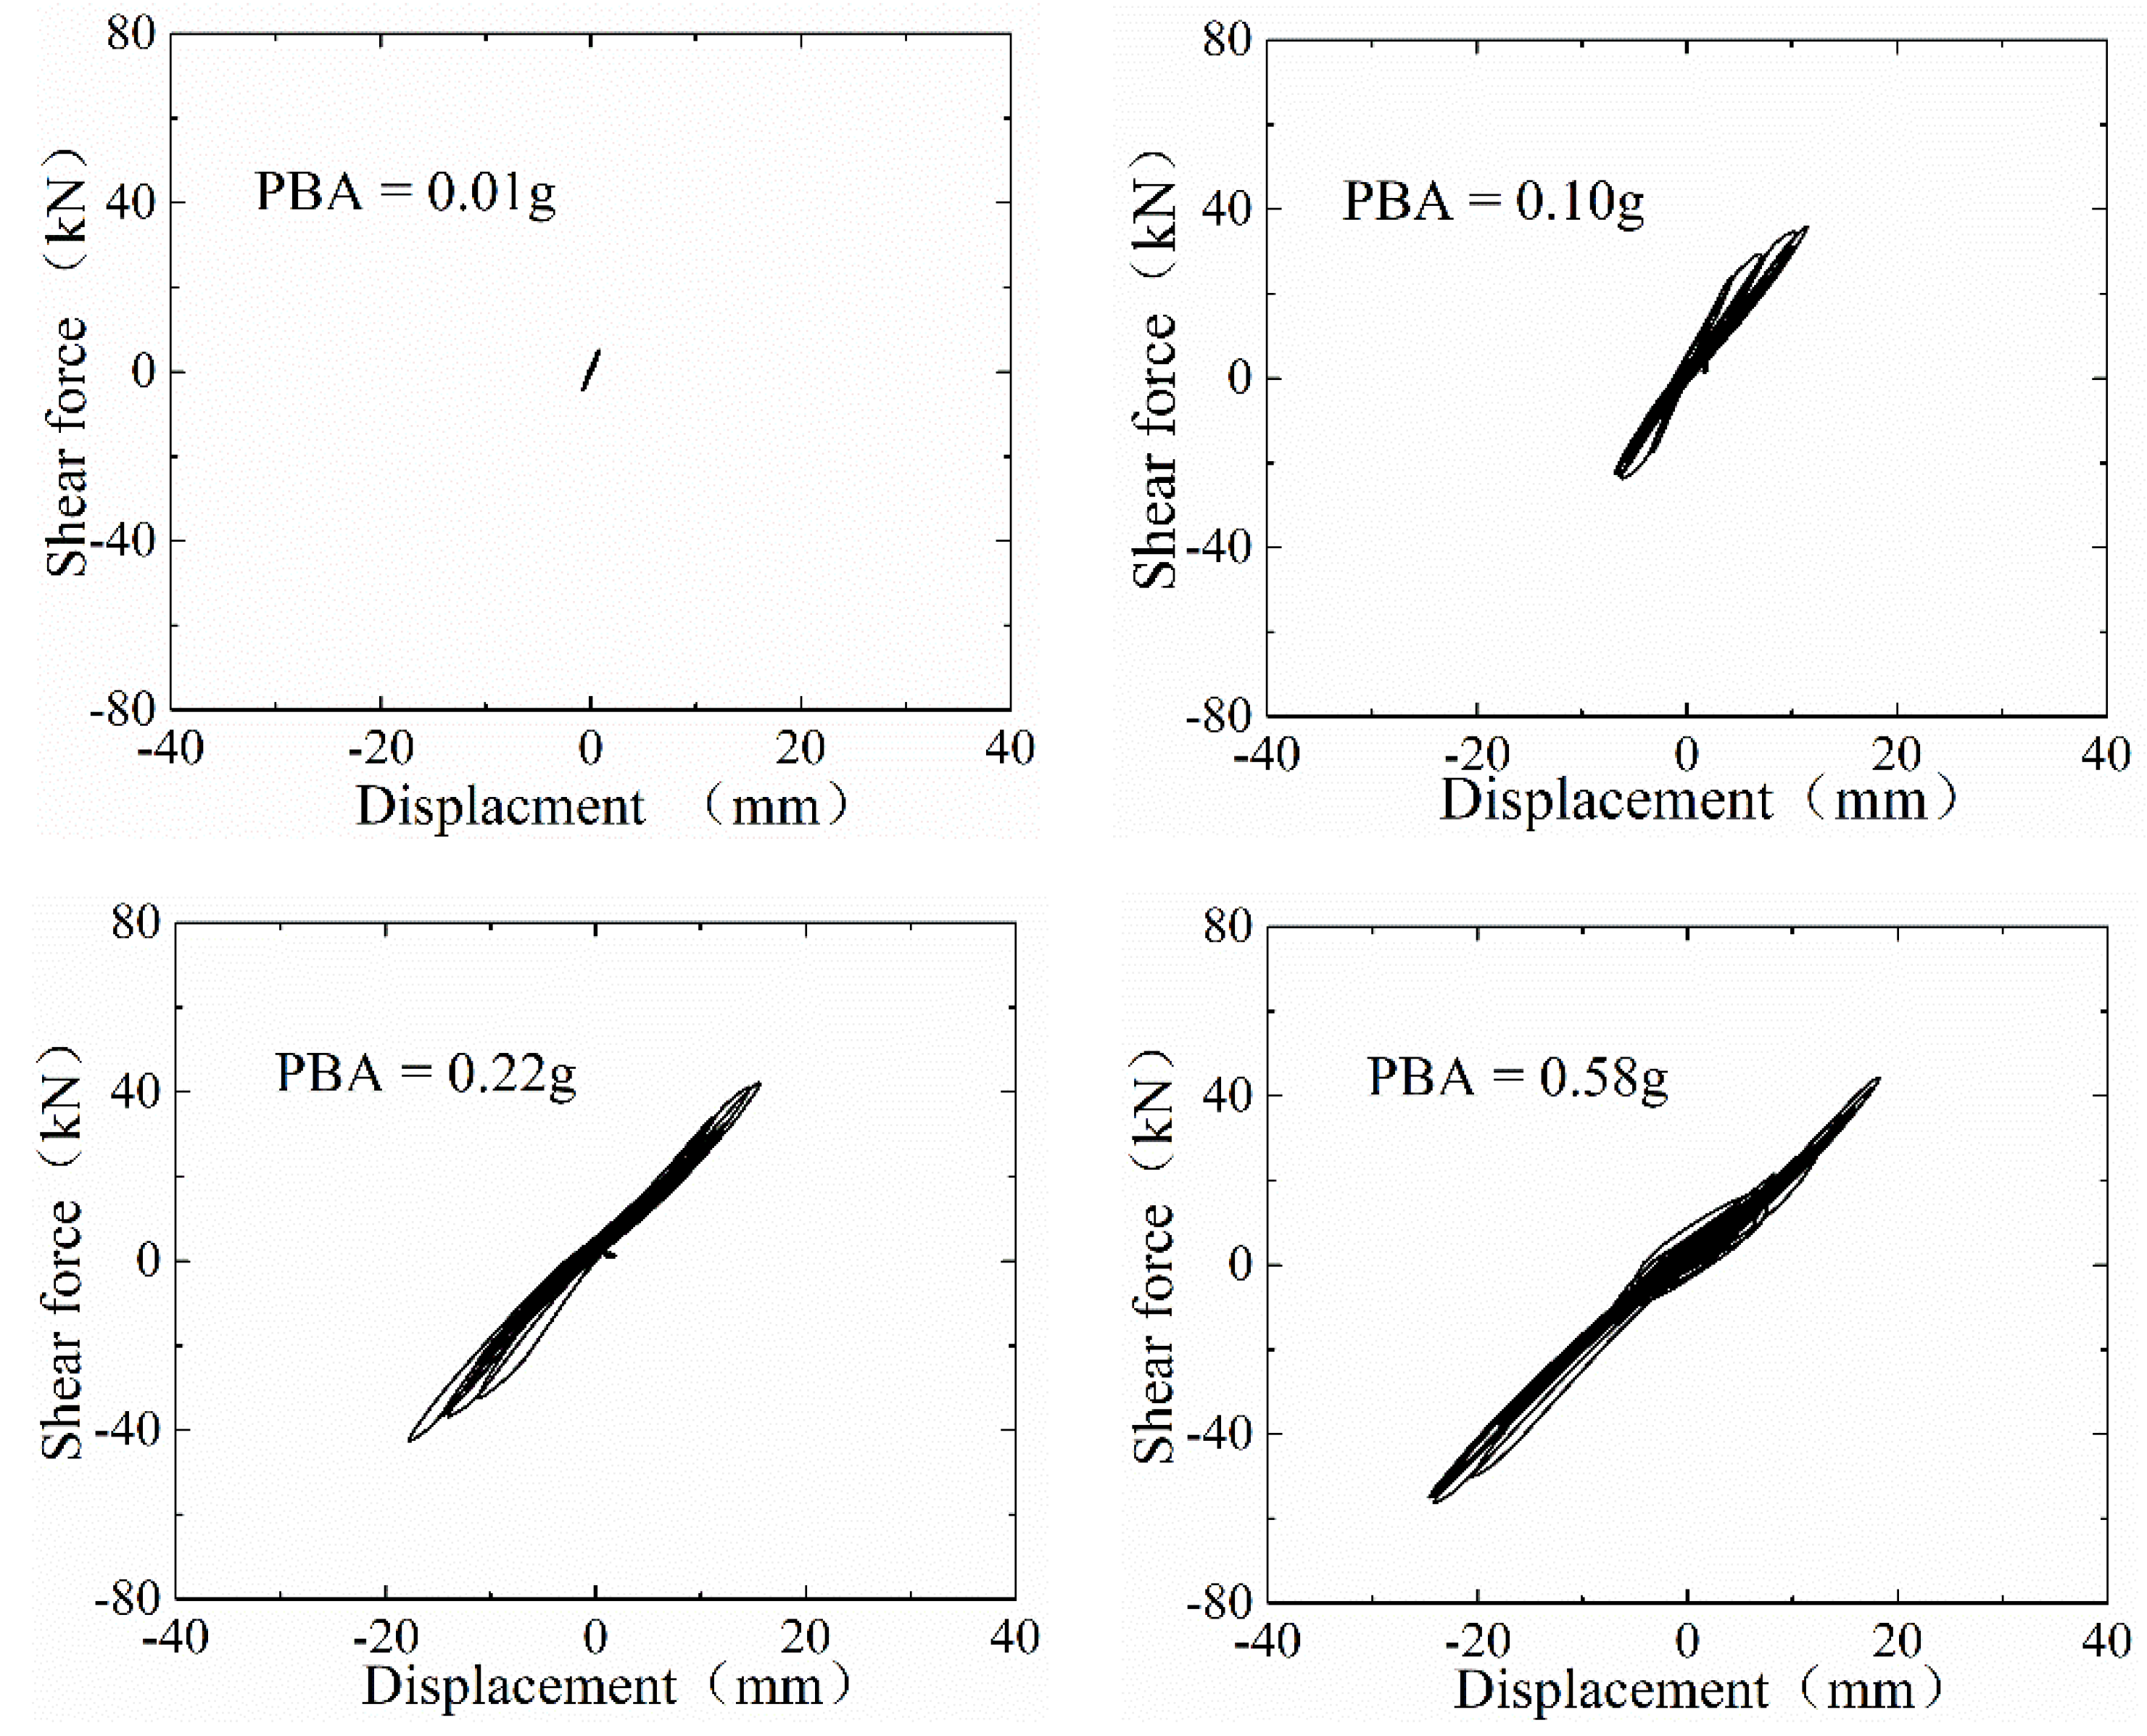
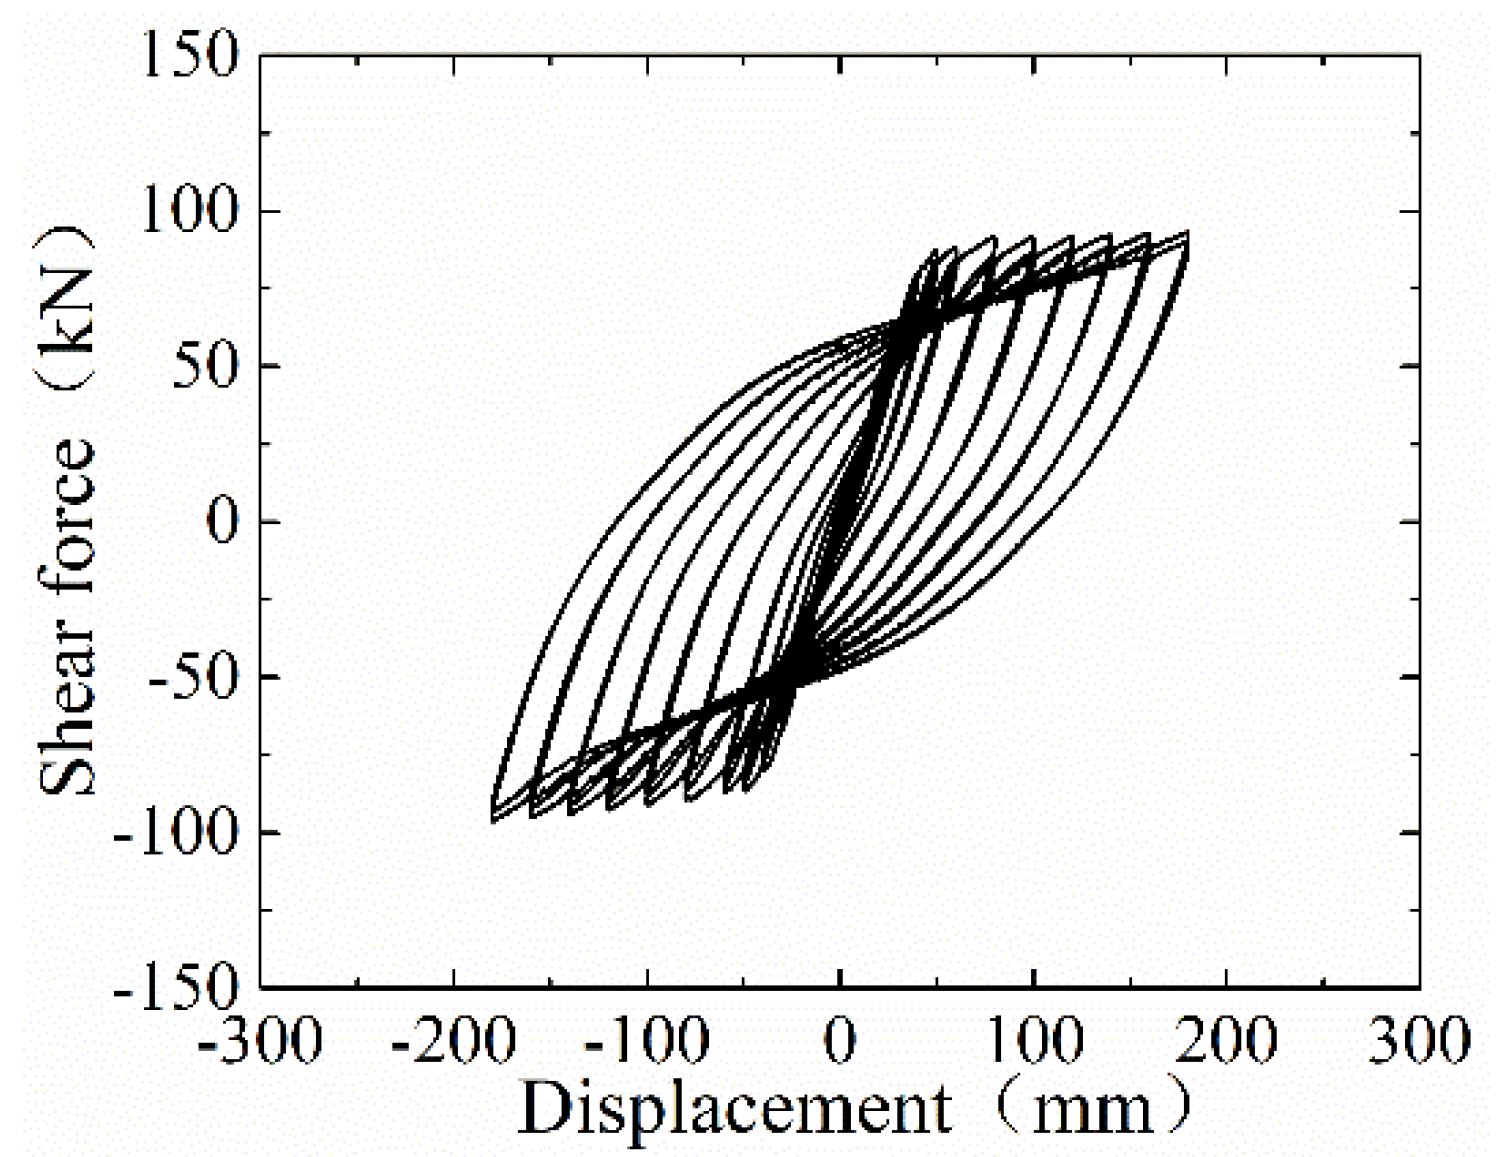
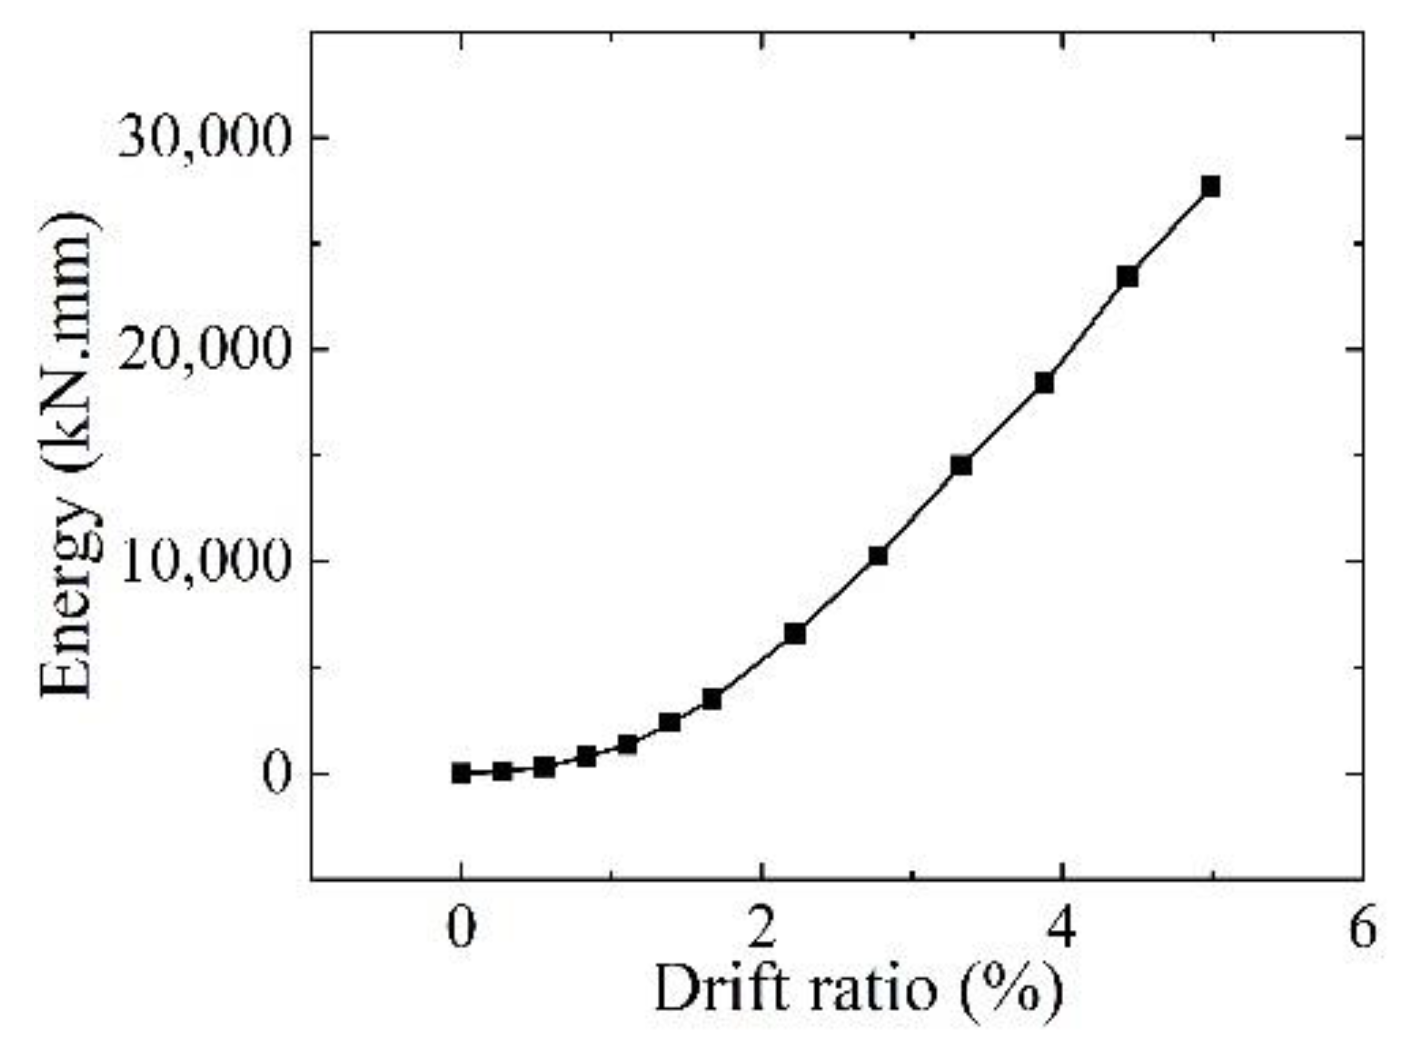
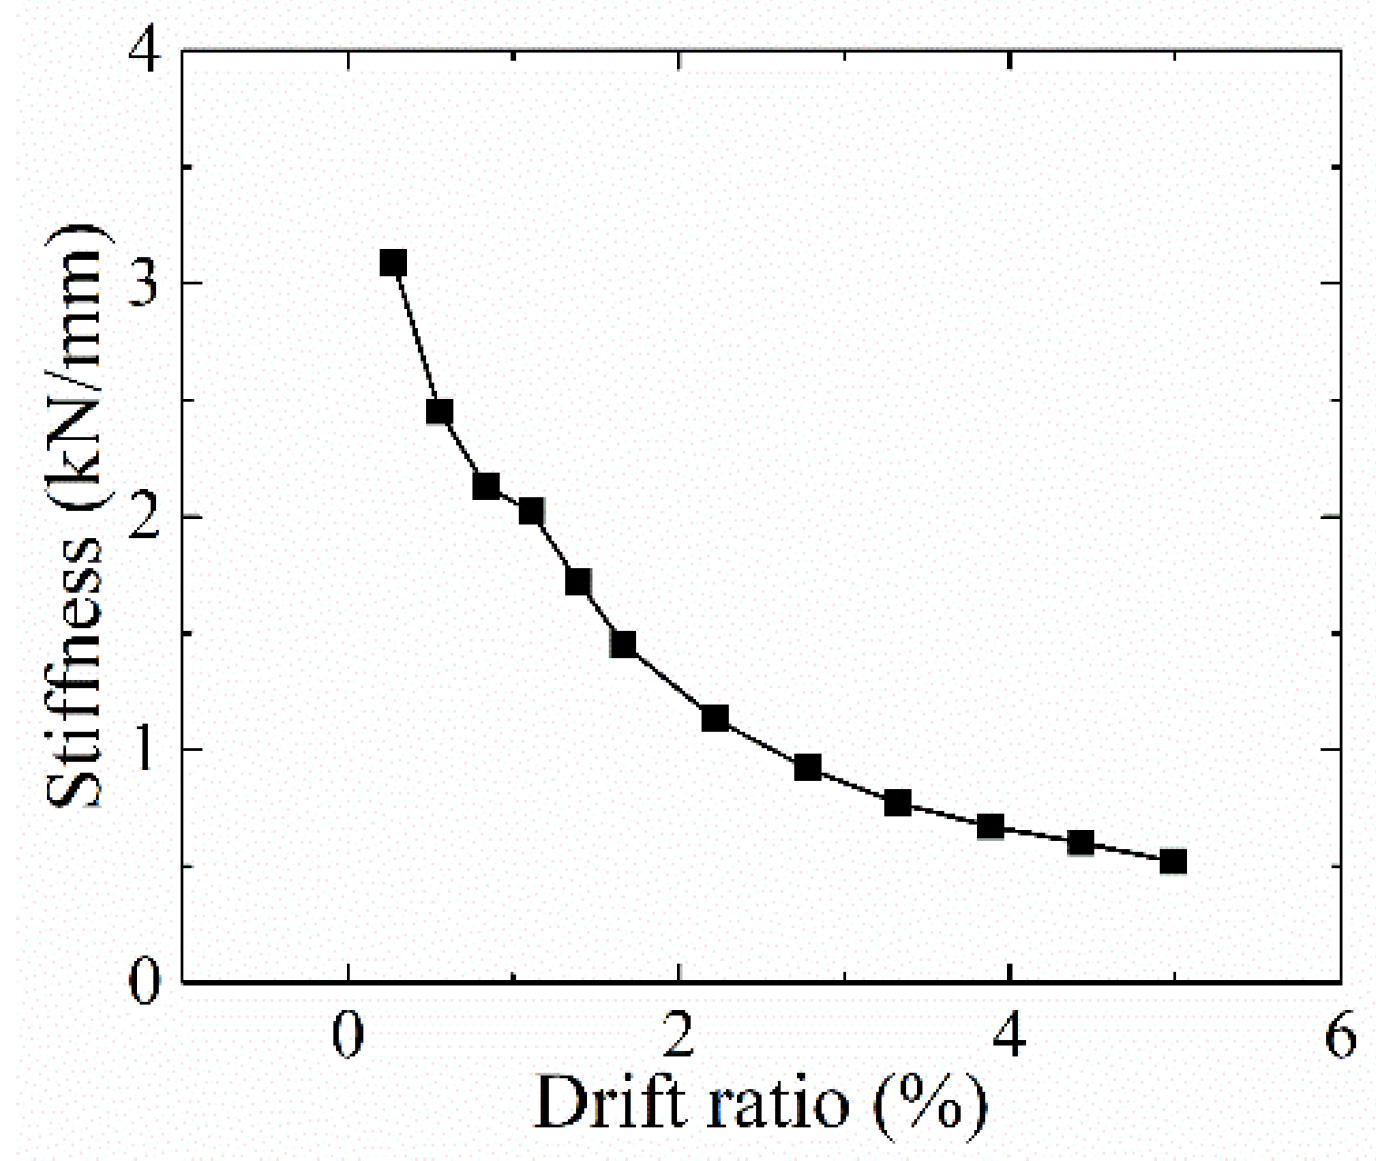
The hybrid simulation technique was shown to be a feasible solution of conducting large-scale or full-scale seismic tests of underground structures. In this paper, a series of tests, composed of hybrid tests and quasi-static tests, were performed on the central column of the typical subway station. The physical substructure was an RC column, while the numerical substructure was the rest of the model. After the definition of the experimental beam-column elements in OpenFresco, the lateral stiffness of the central column was represented. With the proposed evaluation index, the test results showed a good agreement with the numerical results in the elastic stage. Therefore, hybrid simulation was proven to be a suitable way to assess the seismic performance of a typical subway station. It should be noted that in the hybrid simulation cases of 0.22 g and 0.58 g, the ultimate shear forces were smaller than the corresponding analytical results whilst the peak drifts were larger. The stiffness of the central column decreased, and the central column gradually entered its plastic state in the aforementioned hybrid simulation cases.

Author Contributions

Conceptualization, C.Y. and Y.Y.; Data curation, X.C.; Investigation, X.C.; Methodology, C.Y. and X.C.; Software, X.C.; Supervision, Y.Y.; Writing—original draft, X.C.; Writing—review & editing, C.Y. and Y.Y. All authors have read and agreed to the published version of the manuscript.

Funding

This research was funded by Shanghai Committee of Science and Technology (16DZ1200302).

Conflicts of Interest

The authors declare no conflict of interest.

References

  1. Okimura, T.; Takada, S.; Koid, T.H. Outline of the great Hanshin earthquake, apan 1995. Nat. Hazards 1996, 14, 39–71. [Google Scholar] [CrossRef]
  2. Hashash, Y.M.A.; Hook, J.J.; Schmidt, B.; Yao, J.I.-C. Seismic design and analysis of underground structures. Tunn. Undergr. Space Technol. 2001, 16, 247–293. [Google Scholar] [CrossRef]
  3. Yamato, T.; Umehara, T.; Aoki, H.; Nakamura, S.; Ezaki, J.; Suetomi, I. Damge to The Daikai subway station of Kobe rapid transit system and estimation of its reason during the 1995 Hyogoken-Nanbu earthquake. J. SCE 1996, 537, 303–320. [Google Scholar]
  4. Huo, H.; Bobet, A.; Fernández, G. Load Transfer Mechanisms between Underground Structure and Surrounding Ground: Evaluation of the Failure of the The Daikai Station. J. Geotech. Geoenviron. Eng. 2005, 131, 1522–1533. [Google Scholar] [CrossRef]
  5. Lu, C.; Hwang, J. Nonlinear collapse simulation of The Daikai Subway in the 1995 Kobe earthquake. Tunn. Undergr. Space Technol. 2019, 87, 78–90. [Google Scholar] [CrossRef]
  6. Chen, Z.Y.; Liu, Z.Q. Efects of central column aspect ratio on seismic performances of subway station structures. Adv. Struct. Eng. 2018, 24, 14–29. [Google Scholar] [CrossRef] [Green Version]
  7. Chen, Z.Y.; Zhou, Y. Seismic performance of framed underground structures with selfcentering energy-dissipation column base. Adv. Struct. Eng. 2019, 22, 2809–2822. [Google Scholar] [CrossRef]
  8. Farzampour, A.; Eatherton, M.R. Yielding and lateral torsional buckling limit states for butterfly-shaped shear links. Eng. Struct. 2019, 180, 442–451. [Google Scholar] [CrossRef]
  9. Farzampour, A. Evaluating Shear Links for Use in Seismic Structural Fuses (Doctoral Dissertation, Virginia Tech); Farzampour, A., Eatherton, M.R., Eds.; Virginia Polytechnic Institute and State University: Blacksburg, VA, USA, 2019. [Google Scholar]
  10. Farzampour, A.; Eatherton, M.R. Investigating limit states for butterfly-shaped and straight shear links. In Proceedings of the 16th European Conference on Earthquake Engineering, 16ECEE, Thessaloniki, Greece, 18–21 June 2018. [Google Scholar]
  11. Farzampour, A.; Eatherton, M.R. Parametric study on butterfly-shaped shear links with various geometries. In Proceedings of the 11th National Conference on Earthquake Engineering, 11NCEE, Los Angeles, CA, USA, 25–29 June 2018. [Google Scholar]
  12. Chen, Z.; Chen, W.; Li, Y. Shaking table test of a multi-story subway station under pulse-like ground motions. Soil Dyn. Earthq. Eng. 2016, 82, 111–122. [Google Scholar] [CrossRef]
  13. Chen, Z.Y.; Liu, Z.Q. Effects of pulse-like earthquake motions on a typical subway station structure obtained in shaking-table tests. Eng. Struct. 2019, 198, 109557. [Google Scholar] [CrossRef]
  14. Chen, G.; Wang, Z.; Zuo, X. Shaking table test on the seismic failure characteristics of a subway station structure on liquefiable ground. Earthq. Eng. Struct. Dyn. 2013, 42, 1489–1507. [Google Scholar] [CrossRef]
  15. Mustafee, N.; Brailsford, S.; Djanatliev, A. Purpose and benefits of hybrid simulation: Contributing to the convergence of its definition. In Proceedings of the 2017 Winter Simulation Conference (WSC), Las Vegas, NV, USA, 3–6 December 2017. [Google Scholar]
  16. Yang, C.; Cai, X.; Yuan, Y.; Ma, Y. Hybrid simulation of soil station system response to two-dimensional earthquake excitation. Sustainability 2019, 11, 2582. [Google Scholar] [CrossRef] [Green Version]
  17. Stefanaki, A.; Sivaselvan, M.V.; Tessari, A. Soil-foundation-structure interaction using hybrid simulation. In Proceedings of the 23th International Conference on Structural Mechanics in Reactor Technology, Manchester, UK, 10–14 August 2015. [Google Scholar]
  18. Mccrum, D.P.; Williams, M.S. An overview of seismic hybrid testing of engineering structures. Eng. Struct. 2016, 118, 240–261. [Google Scholar] [CrossRef] [Green Version]
  19. Bao, X.; Xia, Z.; Ye, G. Numerical analysis on the seismic behavior of a large metro subway tunnel in liquefiable ground. Tunn. Undergr. Space Technol. 2017, 66, 91–106. [Google Scholar] [CrossRef]
  20. Barbato, M.; Gu, Q.; Conte, P. Probabilistic pushover analysis of structural and geotechnical systems. J. Struct. Eng. 2010, 136, 1330–1341. [Google Scholar] [CrossRef] [Green Version]
  21. Amorosi, A.; Boldini, D.; Elia, G. Parametric study on seismic ground response by finite element modelling. Comput. Geotech. 2010, 37, 515–528. [Google Scholar] [CrossRef]
  22. Feng, D.C.; Xie, S.C.; Ning, C.L.; Liang, S.X. Investigation of Modeling Strategies for Progressive Collapse Analysis of RC Frame Structures. J. Perform. Constr. Facil. ASCE 2019, 33, 04019063. [Google Scholar] [CrossRef]
  23. Standard of Test Method of Mechanical Properties on Ordinary Concrete; (GB/T50081-2002); Ministry of Construction of China: Beijing, China, 2002.
  24. Silva, C.E.; Gomez, D.; Maghareh, A. Benchmark control problem for real-time hybrid simulation. Mech. Syst. Signal Process. 2020, 135, 106381. [Google Scholar] [CrossRef]
  25. Mostofinejad, D.; Shameli, S.M.; Hosseini, A. EBROG and EBRIG methods for strengthening of RC beams by FRP sheets. Eur. J. Environ. Civ. Eng. 2014, 18, 652–668. [Google Scholar] [CrossRef]
Figure 1. The stratum-station system FEA model (units in m).
Applsci 10 01331 g001
Figure 2. Pressure-dependent soil material model [20].
Applsci 10 01331 g002
Figure 3. Section of the subway station (units in mm).
Applsci 10 01331 g003
Figure 4. Key components of the hybrid simulation model.
Applsci 10 01331 g004
Figure 5. Input earthquake motions.
Applsci 10 01331 g005
Figure 6. Construction drawing of the central column specimen (units: mm). Note: left figure view is from loading direction, right figure view is perpendicular to loading direction.
Applsci 10 01331 g006
Figure 7. Overview of the test setup.
Applsci 10 01331 g007
Figure 8. Test results of the 0.01 g case.
Applsci 10 01331 g008
Figure 9. Test results of 0.1 g, 0.22 g, and 0.58 g case. PBA, peak base acceleration.
Applsci 10 01331 g009aApplsci 10 01331 g009b
Figure 10. Curve of the force-displacement hysteretic response.
Applsci 10 01331 g010
Figure 11. Quasi-static loading procedure.
Applsci 10 01331 g011
Figure 12. Crack pattern of the specimen. Note: Side (C) was the tension side when the loading direction was positive, whilst Side (D) was the tension side when the loading direction was negative. Side (A) and Side (B) were the lateral sides, which were parallel to the loading direction.
Applsci 10 01331 g012
Figure 13. Load-displacement hysteretic curve.
Applsci 10 01331 g013
Figure 14. Cumulative energy dissipation.
Applsci 10 01331 g014
Figure 15. Reduction of the secant stiffness.
Applsci 10 01331 g015
Table 1. Soil material properties.
Soil LayerDepth (m)Unit Weight (kN/m3)Friction Angle (°)Cohesion Yield Stress (kPa)Young’s Modulus (MPa)Poisson’s Ratio
Fill0–1192070101.30.333
Holocene clay1–2192070100.30.333
Holocene sand2–4.81920-147.90.32
Pleistocene sand4.8–8.01920-195.90.40
Pleistocene clay8–17192070290.30.30
Pleistocene gravel17–582020-560.00.26

