Article

Percolation and Transport Properties in The Mechanically Deformed Composites Filled with Carbon Nanotubes

1
Faculty of Physics, Vilnius University, Sauletekio 9, LT-10222 Vilnius, Lithuania
2
Institute for Nuclear Problems, Belarusian State University, 220006 Minsk, Belarus
3
Computer, Electrical and Mathematical Science and Engineering Division, 4700 King Abdullah University of Science and Technology, Thuwal 23955-6900, Saudi Arabia
4
Department of Information and Electrical Engineering and Applied Mathematics, University of Salerno, Via Giovanni Paolo II 132, 84084 Fisciano (SA), Italy
5
Institute of Photonics, University of Eastern Finland, Yliopistokatu 7, FI-80101 Joensuu, Finland
*
Author to whom correspondence should be addressed.
Appl. Sci. 2020, 10(4), 1315; https://doi.org/10.3390/app10041315
Submission received: 14 January 2020 / Revised: 5 February 2020 / Accepted: 12 February 2020 / Published: 15 February 2020
(This article belongs to the Special Issue Numerical and Analytical Methods in Electromagnetics)

Abstract

:
The conductivity and percolation concentration of the composite material filled with randomly distributed carbon nanotubes were simulated as a function of the mechanical deformation. Nanotubes were modelled as the hard-core ellipsoids of revolution with high aspect ratio. The evident anisotropy was observed in the percolation threshold and conductivity. The minimal mean values of the percolation of 4.6 vol. % and maximal conductivity of 0.74 S/m were found for the isotropic composite. Being slightly aligned, the composite demonstrates lower percolation concentration and conductivity along the orientation of the nanotubes compared to the perpendicular arrangement.

1. Introduction

The macroscopic properties of the randomly organized media has attracted research interest for many decades. Nowadays, the the critical study points are the determination of the properties of composites filled with the carbonaceous fillers, like carbon nanotubes (CNT) [1,2,3,4], or graphene nanoplatelets (GNP) [5,6,7,8]. All these objects have high aspect ratios, and there is an interest to develop anisotropic composites using the partially oriented fillers [9,10,11]. There are several ways to reach the anisotropy in case of a CNT-filled composite, for instance: mechanical deformation, curing the CNT-filled polymer in external fields, or template-based techniques (see [12] and Refs therein).
Currently, there are different ways to model the macroscopic properties of carbon composites. Among them are: general effective media model [13], excluded volume theory [14], Monte Carlo models [15,16], finite and boundary element methods [17,18]. For the conductive properties modelling, the Monte Carlo based techniques are one of the most interesting due to their simplicity, extremely high tunability and good agreement with the experimental results (See [19] and Refs therein).
However, Monte Carlo models for the aligned CNT composites lack in several aspects. Firstly, many studies introduce the cut-off zenith angle as an anisotropy parameter (AP) and investigate the dependencies of the macroscopic properties on the cut-off values [20,21,22]. In case of the real systems, one can measure the deformation degree or the externally applied field, but not the cut-off angle. Secondly, there is some contradiction in conductivity data for the partially oriented composites. Many report on the descent of conductivity with the increase of the AP [22,23,24], and several demonstrate a maximum of the conductivity with the small values of the AP [20,21,25]. To figure out the conductivity dependence, the critical concentration dependence on the anisotropy parameters should be investigated. Finally, the properties of the aligned composite should be studied along different directions, while most of the studies usually report on the behaviour along one direction [21,22,23].
In this paper, the CNT-filled composite after mechanical deformation, which in our model is introduced as non uniformity in angular coordinate distribution, is investigated. The percolation threshold and conductivity are computed as a function of the mechanical deformation. Two main directions (along and perpendicular to the deformation axis) are studied.

2. Model and Simulation Details

The CNTs are modelled as the ellipsoids of revolution with high aspect ratio, their semi axes are b 1 = b 2 b 3 . For the calculation the similar ellipsoids with semi axes b 1 = 2.5 nm and b 3 = 37.5 nm were taken. The representative unit cell with the volume of ( n b 3 ) 3 , where n > 1 , is used.
The particles are introduced one by one into the unit cell by randomly generating Cartesian coordinates X for the centre of the ellipsoid and two spherical angular coordinates θ and ϕ for the orientation of the longest axis of the ellipsoid. Each time the non-overlap condition is checked, and the new ellipsoid is stored only if it does not intersect the walls of the unit cell and does not penetrate into any of the already existing particles. After the predefined number of particle is reached, the connectivity is checked along the selected direction using the Dijkstra’s protocol [26].
The algorithm for the percolation computation is organised as a Tabu search method and it stops when the percolation is achieved [27,28,29]. Until the percolation is reached, the number of particles increases in each cycle. The detailed modelling procedure is described in our previous paper [30]. The periodic boundary conditions are applied for the calculation of the percolation concentration and conductivity.
The connection criteria for the nanotubes is obtained as follows. The dependence of the tunnelling resistance on the distance between the nanotubes given as [8,31]:
ρ = h 2 e 2 2 m b exp 4 π d h 2 m b
where b is the potential barrier, and d is the distance, e and m denote the elementary change and electron mass, respectively. The reciprocal value 1 / ρ is the tunnelling conductivity. The conductivity drastically decreases with the distance increment and reaches already small values of 10 4 S/m for 2 nm separation. Thus, for the percolation computations the separation of 2 nm is considered as the connection criteria, while for the piezoresistivity computation direct values obtained from Equation (1) were used. In the last case, the tunnelling barrier of b = 0.75 eV.
To introduce anisotropy, the composite was considered as mechanically stretched. The probability density function (PDF) for the CNT angular distribution was derived using the following assumptions: (i) the mechanical deformation oriented along the z-axis, (ii) the centre of the ellipsoid keeps its position after the deformation, and (iii) the Poison’s shrinkage in the perpendicular directions was neglected. The last assumption is justified, since the independence of the percolation value on the unit cell volume was demonstrated previously [30].
Thus, after the deformation, X and φ remain unchanged. The PDF for the θ angle was obtained as the modified function for the mechanically deformed composite filled with cylinders [32]:
ψ ( θ ) = k 2 [ k 2 cos 2 θ + sin 2 θ ] 3 / 2
where k is the deformation coefficient introduced as the ratio of the final and initial lengths of the unit cell, k = l l 0 . For k = 1 , the PDF function (2) will return uniform distribution, while for k > 1 some non uniformity will appear (see Figure 1). In order to apply the function to spherical coordinates, the final distribution will be given taking into account the Jacobian as ψ ( θ ) s i n ( θ ) .
The conductivities are computed according to the following protocol. Firstly, the resistance of the nanotubes is taken as infinite, so the total conductivity of the composite is governed by the inter-tube tunnelling (Equation (1)). Next, the direction for the conductivity computation is selected and the nanotubes near the initial and final boarders are collected. The Dijkstra algorithm is used to trace the paths of the minimal resistance between the initial and final tubes. The array R ( t , l ) (where t and l stand for the initial and final indexes of the tube, respectively) is computed. To implement the periodic boundary conditions the array B ( l , t ) of the boundary resistances was introduced. The total resistance for the selected fixed l is follows:
T o t ( l ) = t 1 R ( t , l ) 1 + t 1 B ( l , t ) 1
And finally the total conductivity of the composite is computed as
σ = l 1 T o t ( l )
The algorithm is implemented using PGI CUDA FORTRAN standards [33]. The big enough number of the realizations (500–600) was collected for each particular case.

3. Results and Discussion

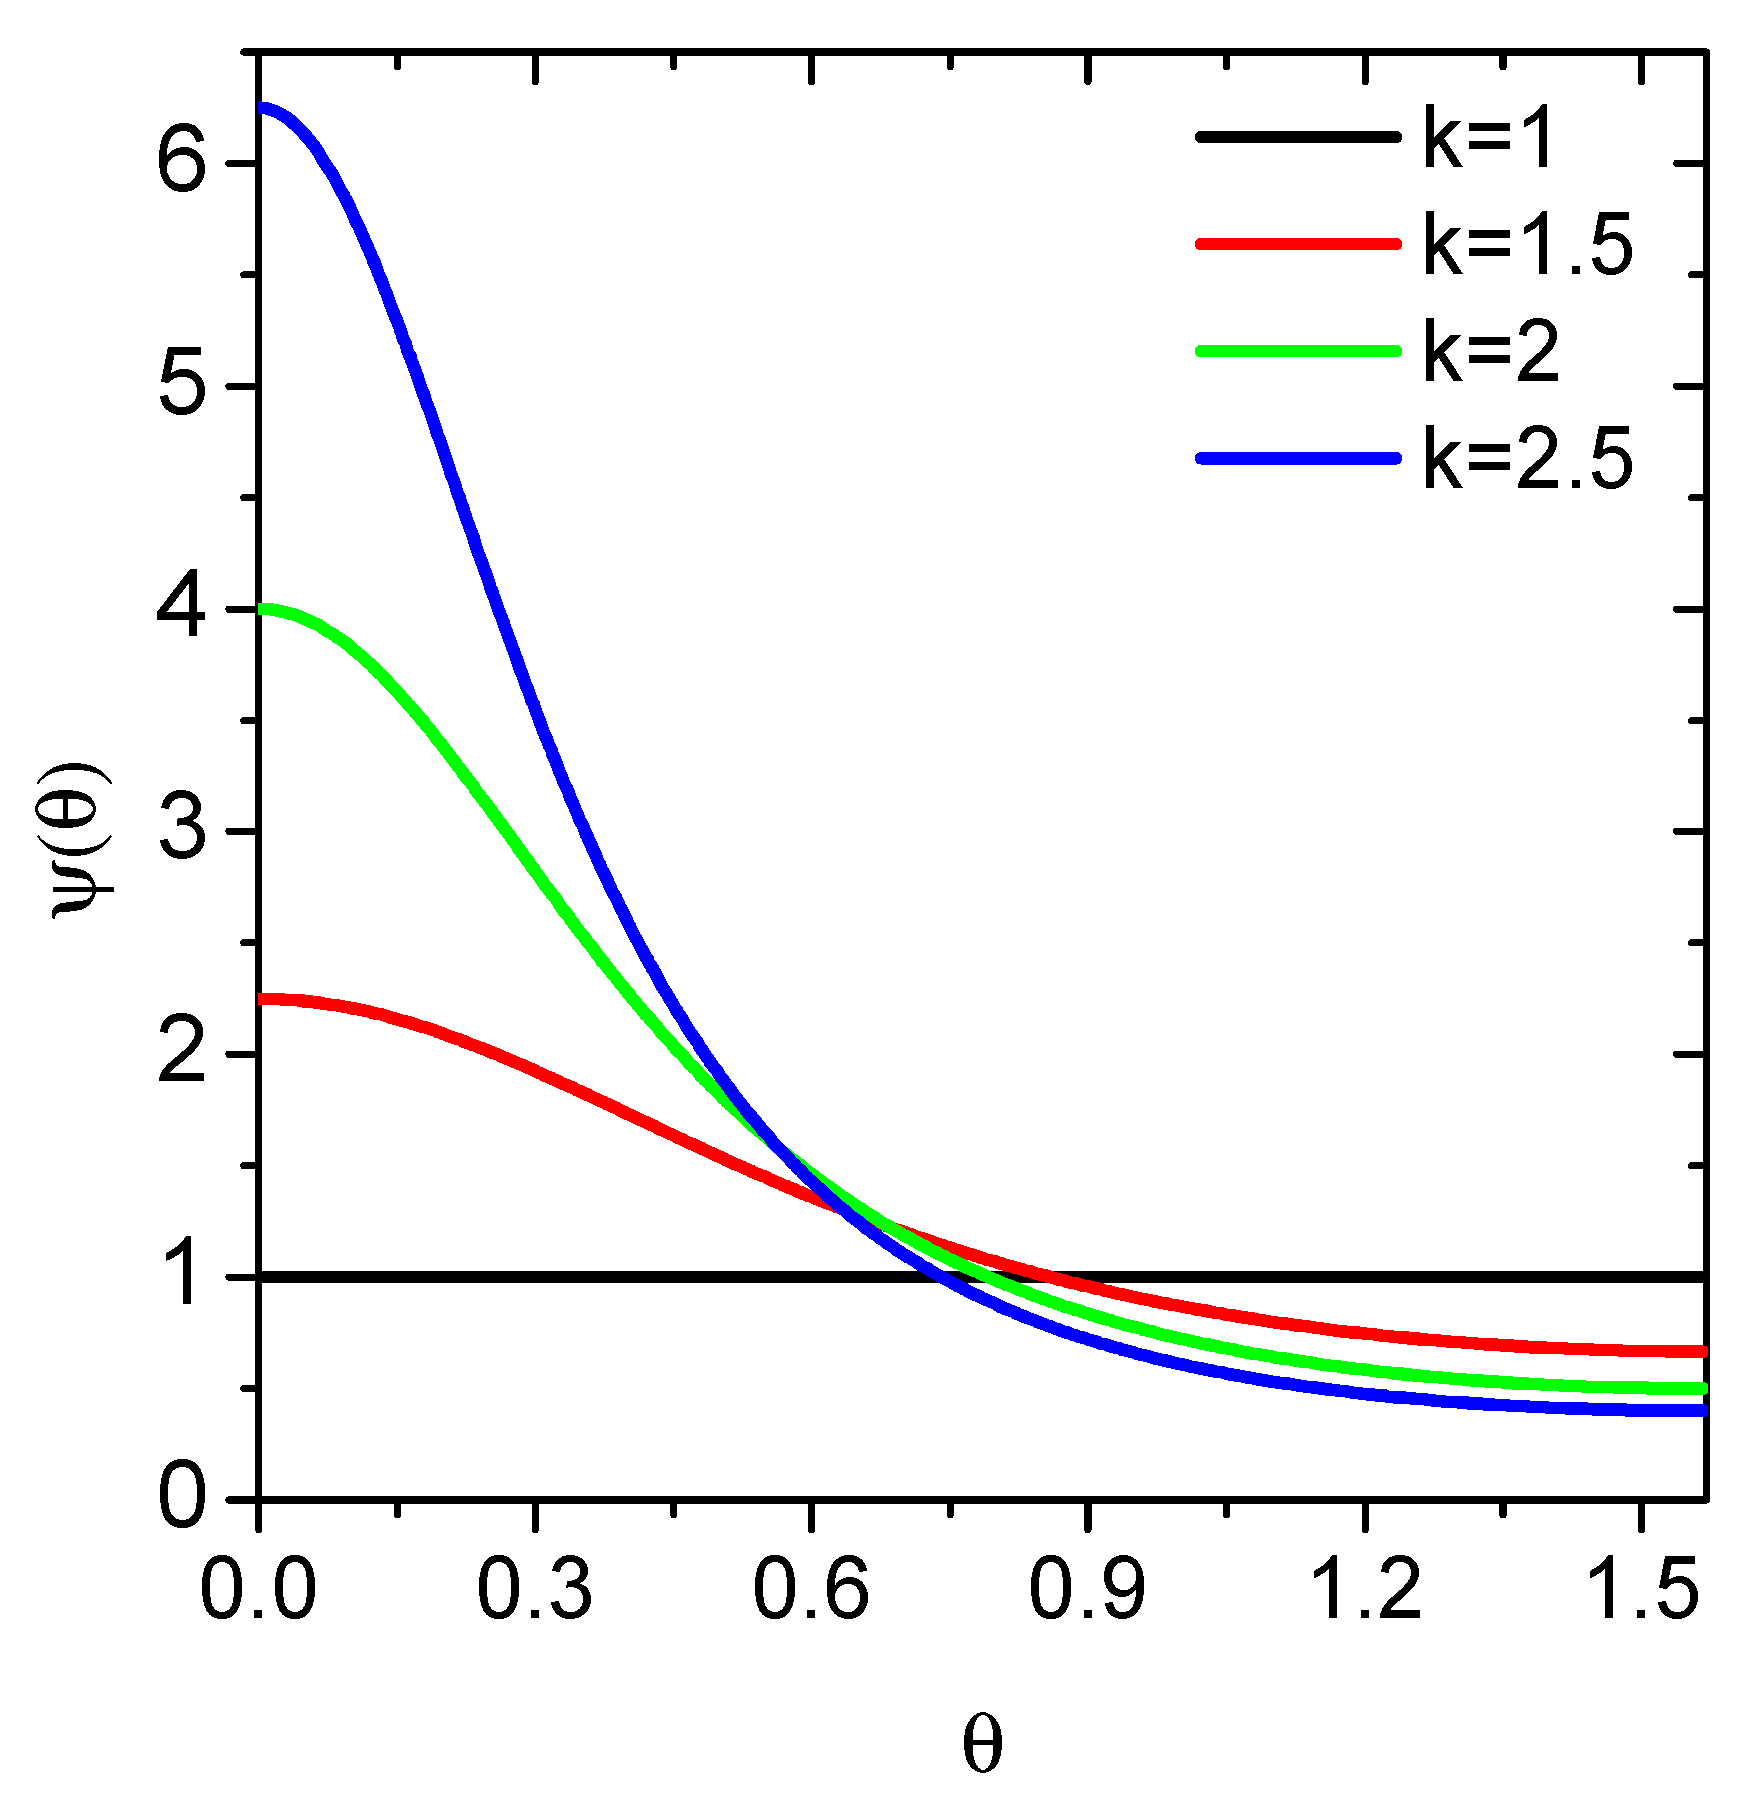
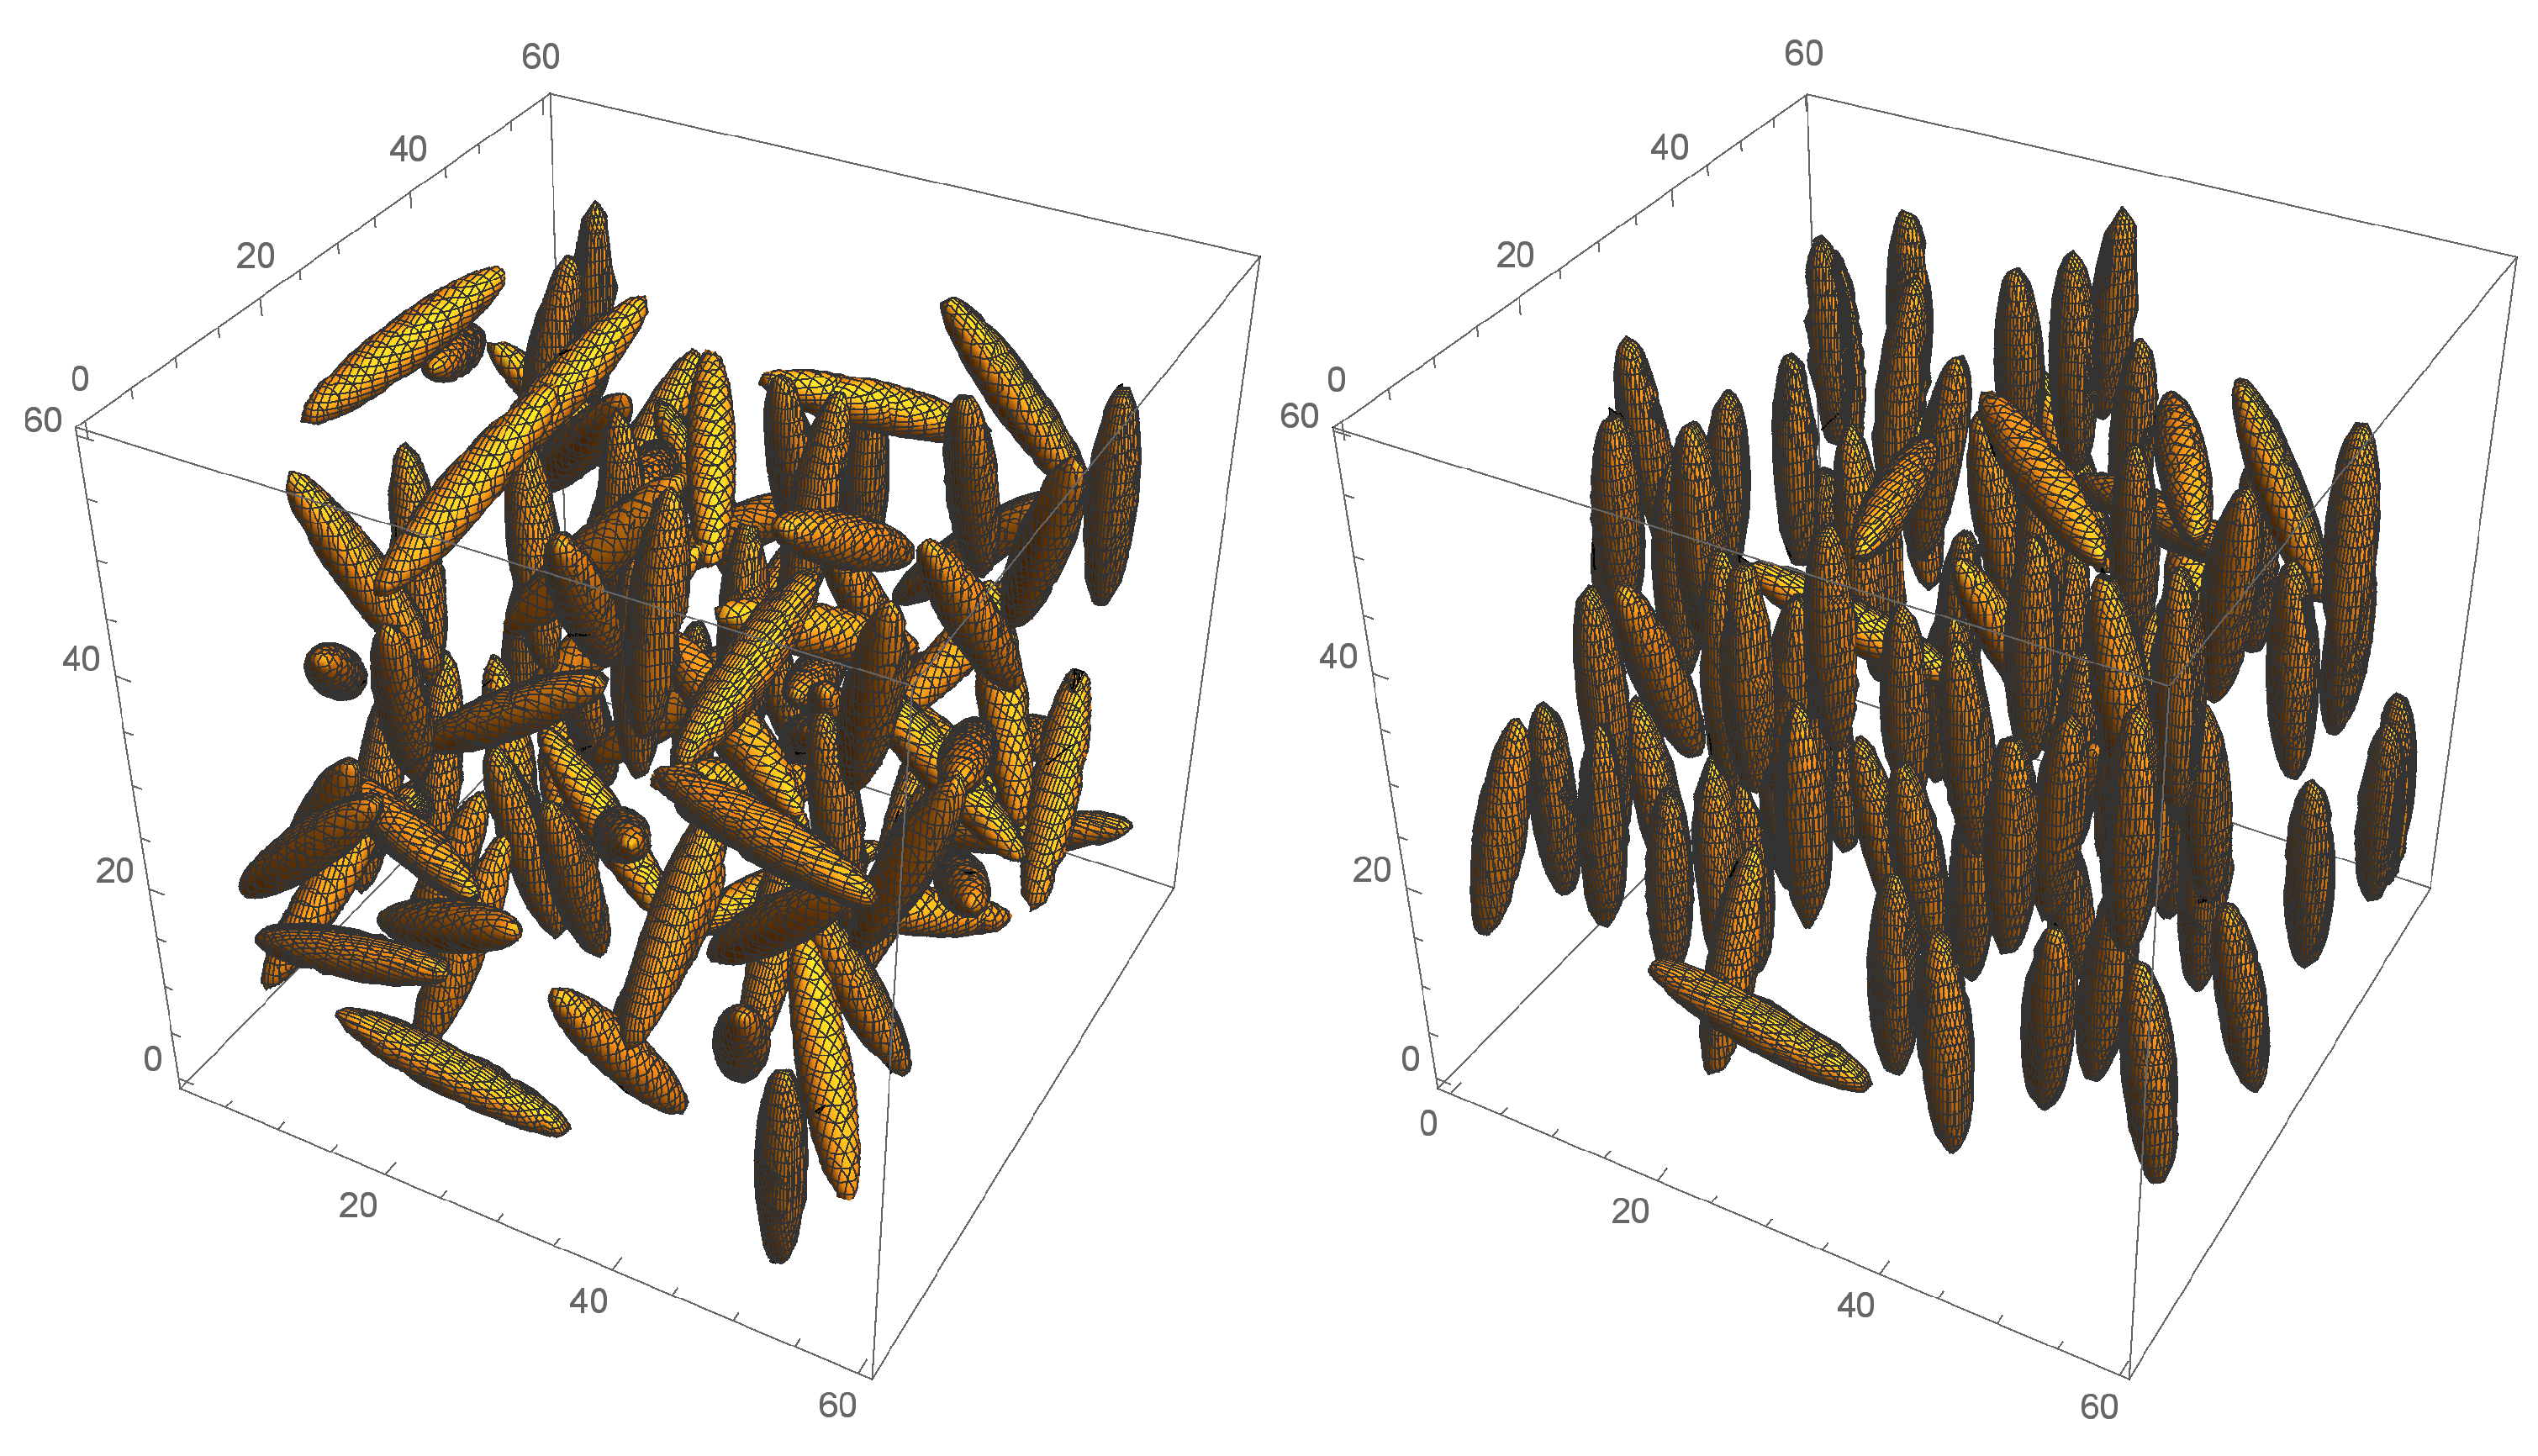
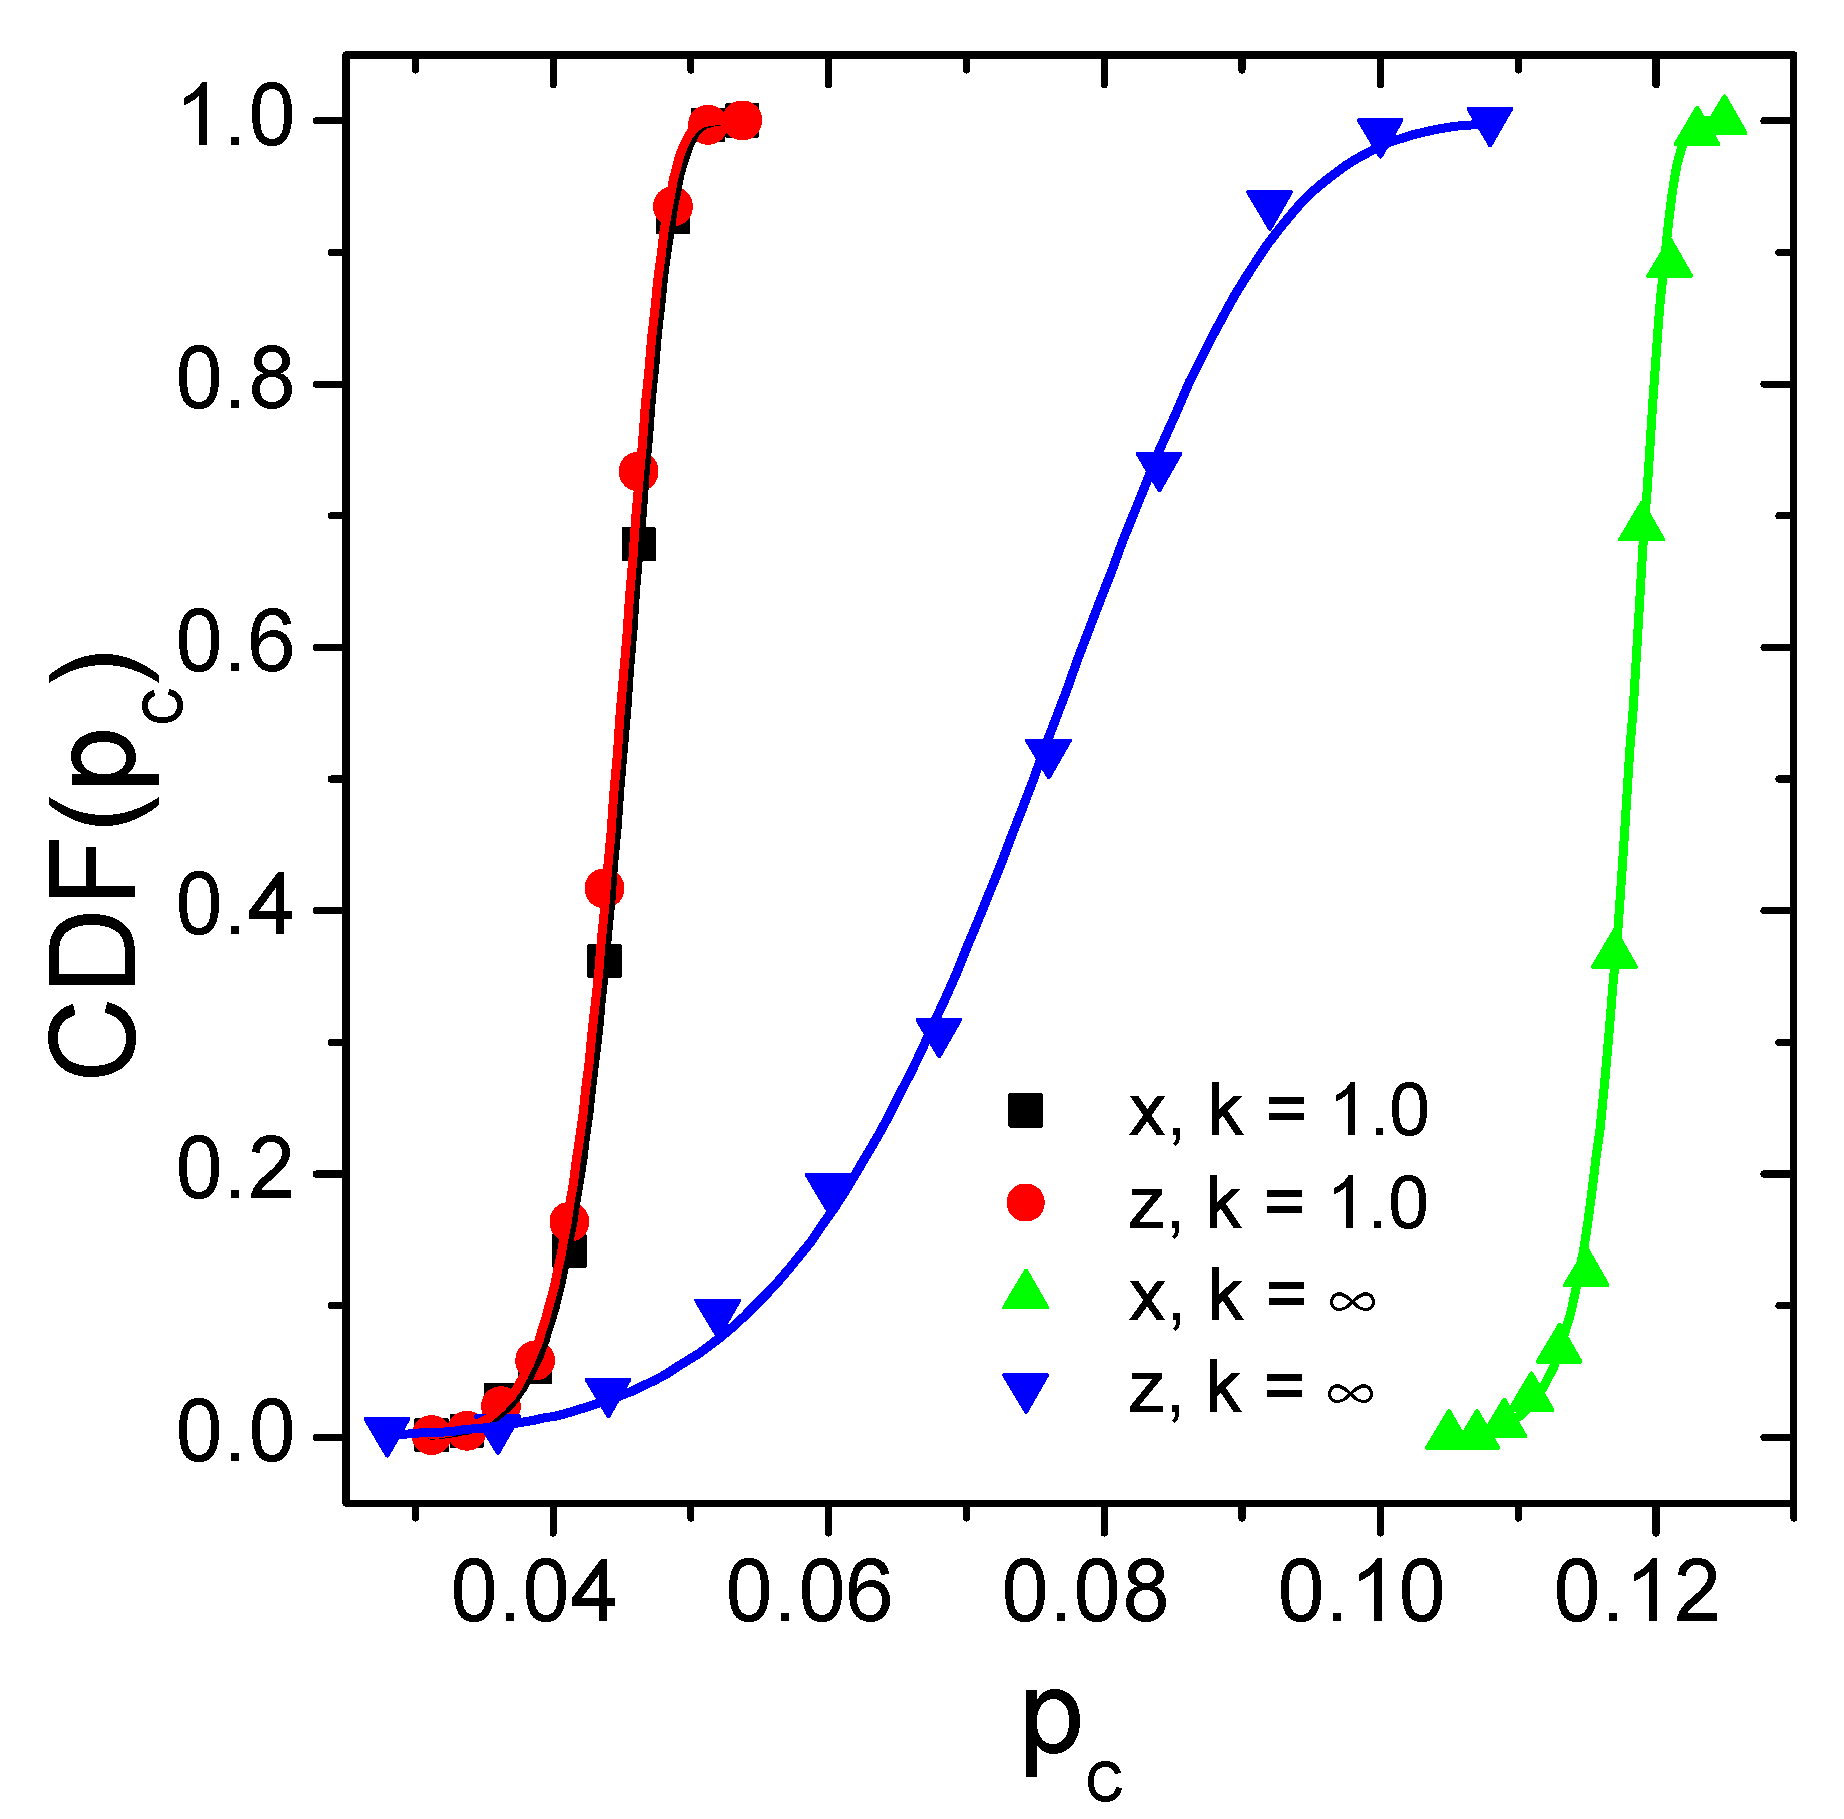
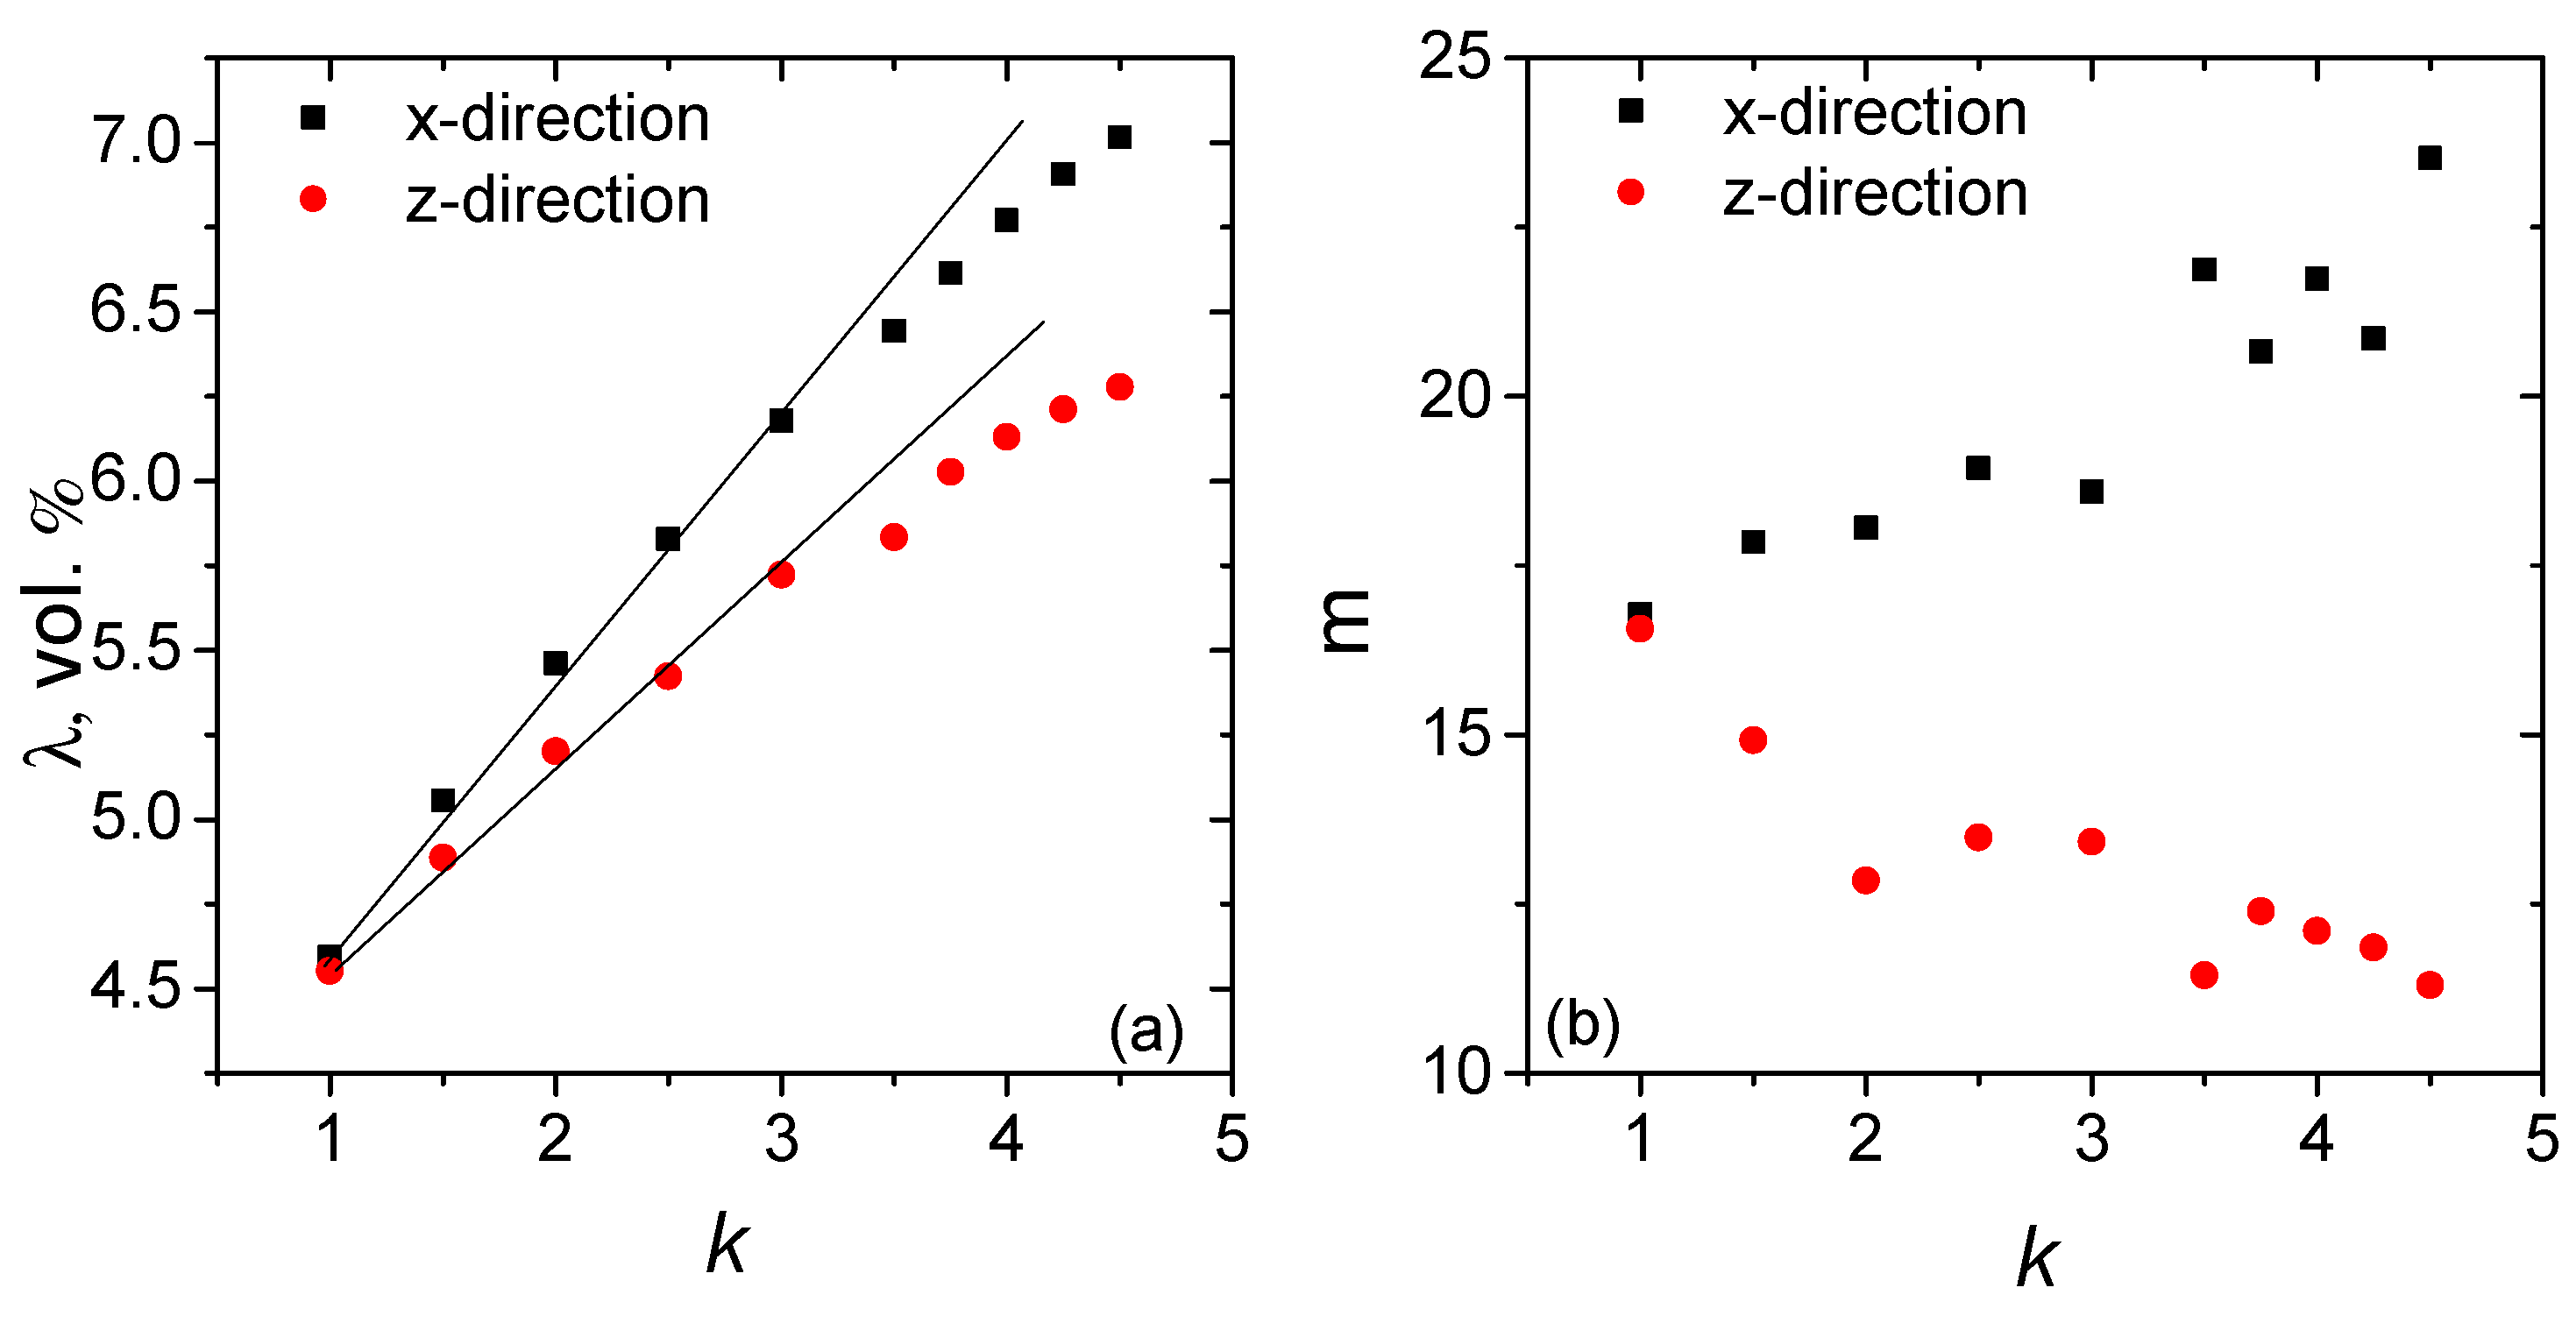
3.1. Percolation Computations

The comparison of the nanotubes angular distribution for the isotropic and heavily deformed composite is presented on Figure 2. For the visualisation purposes, the ellipsoids with small aspect ratio of 5 and the cubic unit cell with side length of 60 nm were used.
For the computations of the percolation threshold, the cubic unit cell with n = 3 was considered. Firstly, the system with uniform and fully aligned ( θ = 0 , k = ) angular distribution of the ellipsoids was studied. The empirical cumulative probability distribution (CDF) for the percolation concentration p c in non-deformed and aligned composites is presented in Figure 3. As it was expected, the distribution of the uniform composite coincides in different directions. Upon deformation, the percolation concentration increases in both directions, and the slope of CDF changes as well.
Obtained distribution follows the Weibull law [34]:
C D F W ( p c , λ , m ) = 1 e ( p c / λ ) m
where λ is the scale factor, and m is the slope or Weibull modulus. The mean value of percolation concentration is < p c > = λ Γ ( 1 + 1 / m ) λ , where Γ is the Euler gamma function. The values for λ of 0.12 and 0.079, and k of 53.69 and 6.00 were obtained for fully oriented composite in the x - and z - directions, correspondingly.
The dependencies of λ and m parameters on the deformation coefficient were also studied. The results were collected in Figure 4. For both directions, the Weibull scale factor λ increases with the deformation, so the minimal concentration is achieved for non deformed composite. This conclusion is supported with the measurement results [22,23,24].
Anisotropic properties of the deformed composite are confirmed by distinct behaviour of λ and m along the x - and z - directions. For low values of k (up to 3), the dependencies of λ versusk demonstrate linear increase both along x and z with the lower slope along the z - direction. In contrast to the scale factor λ , the Weibull modulus m demonstrates the decrease in the direction of the deformation and increase in the perpendicular one. This can be understood in terms of very different dimensionality of the inclusions network. Being isotropically distributed, the network of ellipsoids has 3D dimensionality, and, upon the deformation, the dimensionality changes toward 1D along the z - direction and 2D along the perpendicular one. As a result, a very small number of the particles (three, in the studied situation) may percolate with non-zero probability along z for fully aligned system. It is expected that both λ and k will asymptotically approach the above mentioned values for k = .

3.2. Piezoresistivity Computations

Firstly, the dependence of the conductivity distribution on the unit cell size and the isotropy of the non deformed composite were investigated checked (see Figure 5). The peak values of the conductivity coincide for different cell sizes, while the distribution becomes broader with the decrease of the cell size. The conductivity distributions for the composites above the percolation threshold are close to lognormal in agreement with literature [35]. We conclude, that the usage of the periodic boundary conditions (PBC) in Equations (3) and (4) allowed us to obtain the independence on the unit cell size. For further computations, the cell with n = 4 was used.
The conductivity dependence on the concentration p and deformation k is presented in Figure 6. The concentration dependencies of σ (Figure 6a) follows the power law [36]. After the deformation, σ decreases both along x - and z - directions, and this is supported by the experimental data [37,38,39]. Significant anisotropy (more than the order of magnitude) was observed for the deformed composite. It was previously shown, that the z - direction is preferable for the percolation in the deformed composites in comparison with x. But, being percolated, the composite has lower conductivity along z, than one along the perpendicular direction. In contrast to the percolation, where the appearance of only one conductive path is necessary, the conductivity strongly depends on the number of conductive paths through the unit cell and the total tunnelling distance.
Note that in the microwave and THz frequency regions the partial alignment of the nanotubes will lead to the increase of the conductivity and imaginary part of the permittivity along the deformation [32,40]. But in studied case the situation is opposite. That is related to very different mechanisms of the interaction of the electromagnetic radiation with the media at different frequencies. At microwave frequencies, the mechanism is the polarisation of the CNT [41]. In case of the direct current and quasistatic frequency range, where the tunnelling mechanism is dominant [42], the conductivity decreases due to the tunnelling distance increase.

Boundary Conditions Impact

In the introduction part it was mentioned, that there is the contradiction in the modelling results presented in literature, and several authors observe the maximum of the conductivity in the z-direction for slightly aligned composites. In our case the maximum is observed, if the conductivity is calculated without the PBC in Equations (3) and (4) (see Figure 7). The maximum is reached for k 1.5 . The conductivity along the x-direction decreases, similarly to presented in Figure 6b.
Both models with and without PBC should provide similar results for the infinitely large unit cell. But in the case of the PBC model, the independence of the conductivity on the cell size is demonstrated. Thus, the appearance of the maximum of the conductivity is the cell size related effect of the non-PBC model. Both PBC and non-PBC models are suitable for applications. For the thin films filled with aligned nanotubes the non-PBC model is preferable, while with the composite size increase, the PBC model should be used.

4. Conclusions

The composite filled with carbon nanotubes after the mechanical deformation was simulated. The nanotubes were modelled as randomly distributed non-overlapping ellipsoids. The mechanical stretching of the composite was introduced as the non uniformity of the angular distribution of the ellipsoids. It was shown that the uniform composite provides the higher conductivity and its percolation concentration is the lower, than that of the aligned composite. The anisotropy of the macroscopic properties was investigated. The percolation concentration and conductivity are lower along the direction of the partial orientation of the nanotubes in comparison with the perpendicular one. That can be understood in terms of the conductive paths tunnelling distance and the total number of the conductive paths formed in different directions.
The impact of the periodic boundary conditions was cleared. It was demonstrated, that very different behaviour of the conductivity upon the CNT alignment presented in literature may be explained by the boundary conditions. It was proved, that the model with the periodic boundary conditions provide more relevant conductivity results since the conductivity becomes unit cell size-independent.
The presented model may be used for strain sensor development. The utilisation of the model as pre-experimental step allows to find out the optimal conditions for the composite synthesis, taking into account the nanotube aspect ratio, concentration, the matrix-related properties (in terms of the tunnelling barrier value). At the same time, it allows to predict the behaviour of the main macroscopic parameters on the deformation.

Author Contributions

A.P. code developing, writing the draft; P.K., J.M. and M.Š. writing the final paper; D.L. and D.M. GPU computations; P.K., D.B., P.L. and J.B. conceptualization. All authors have read and agreed to the published version of the manuscript.

Funding

This research was partially funded by H2020 RISE 734164 Graphene 3D, H2020 RISE Project 823728 DiSeTCom. PK is supported by Horizon 2020 IF TURANDOT project 836816 and the Academy of Finland Flagship Programme, Photonics Research and Innovation (PREIN), decision 320166.

Acknowledgments

Massive GPU computations were performed on KAUST’s Ibex HPC. We thank KAUST Supercomputing Core Lab team and especially to Mohsin Shaikh and Passant Hafez for assistance with execution tasks on Volta and Pascal GPU nodes.

Conflicts of Interest

The authors declare no conflict of interest.

Abbreviations

The following abbreviations are used in this manuscript:
PBCPeriodic boundary conditions
CNTCarbon nanotube
PDFProbability density function
CDFCumulative distribution function

References

  1. Foygel, M.; Morris, R.; Anez, D.; French, S.; Sobolev, V. Theoretical and computational studies of carbon nanotube composites and suspensions: Electrical and thermal conductivity. Phys. Rev. B 2005, 71, 104201. [Google Scholar] [CrossRef]
  2. Fang, C.; Zhang, J.; Chen, X.; Weng, G.J. A monte carlo model with equipotential approximation and tunneling resistance for the electrical conductivity of carbon nanotube polymer composites. Carbon 2019, 146, 125–138. [Google Scholar] [CrossRef]
  3. Ni, X.; Hui, C.; Su, N.; Cutler, R.; Liu, F. A 3D percolation model for multicomponent nanocarbon composites: The critical role of nematic transition. Nanotechnology 2019, 30, 185302. [Google Scholar] [CrossRef] [Green Version]
  4. Hu, Y.; Huang, J.C. Mechanical Properties and Reinforcement Mechanisms of Carbon Nanotube Composites with Amine Functional Groups Based on Molecular Dynamics. J. Phys. Conf. Ser. 2019, 1176, 052054. [Google Scholar] [CrossRef]
  5. Liu, M.; Kinloch, I.A.; Young, R.J.; Papageorgiou, D.G. Modelling mechanical percolation in graphene-reinforced elastomer nanocomposites. Compos. Part B Eng. 2019, 178, 107506. [Google Scholar] [CrossRef] [Green Version]
  6. Sagalianov, I.; Vovchenko, L.; Matzui, L.; Lazarenko, O. Synergistic enhancement of the percolation threshold in hybrid polymeric nanocomposites based on carbon nanotubes and graphite nanoplatelets. Nanoscale Res. Lett. 2017, 12, 140. [Google Scholar] [CrossRef] [Green Version]
  7. Sagalianov, I.Y.; Lazarenko, O.A.; Vovchenko, L.L.; Matzui, L.Y. Monte-Carlo study of the percolation in a binary composites: Hardcore and softcore models comparison. In Proceedings of the 2017 IEEE 7th International Conference on Nanomaterials: Application & Properties (NAP), Zatoka, Ukraine, 10–15 September 2017. [Google Scholar]
  8. Oskouyi, A.; Sundararaj, U.; Mertiny, P. Tunneling conductivity and piezoresistivity of composites containing randomly dispersed conductive nano-platelets. Materials 2014, 7, 2501–2521. [Google Scholar] [CrossRef] [PubMed]
  9. Mai, C.K.; Liu, J.; Evans, C.M.; Segalman, R.A.; Chabinyc, M.L.; Cahill, D.G.; Bazan, G.C. Anisotropic thermal transport in thermoelectric composites of conjugated polyelectrolytes/single-walled carbon nanotubes. Macromolecules 2016, 49, 4957–4963. [Google Scholar] [CrossRef] [Green Version]
  10. Pan, T.W.; Kuo, W.S.; Tai, N.H. Tailoring anisotropic thermal properties of reduced graphene oxide/multi-walled carbon nanotube hybrid composite films. Compos. Sci. Technol. 2017, 151, 44–51. [Google Scholar] [CrossRef]
  11. Chen, J.; Wang, L.; Gui, X.; Lin, Z.; Ke, X.; Hao, F.; Li, Y.; Jiang, Y.; Wu, Y.; Shi, X.; et al. Strong anisotropy in thermoelectric properties of CNT/PANI composites. Carbon 2017, 114, 1–7. [Google Scholar] [CrossRef]
  12. Xie, X.L.; Mai, Y.W.; Zhou, X.P. Dispersion and alignment of carbon nanotubes in polymer matrix: A review. Mater. Sci. Eng. R Rep. 2005, 49, 89–112. [Google Scholar] [CrossRef]
  13. Radzuan, N.A.M.; Sulong, A.B.; Sahari, J. A review of electrical conductivity models for conductive polymer composite. Int. J. Hydrog. Energy 2017, 42, 9262–9273. [Google Scholar] [CrossRef]
  14. Sun, Y.; Bao, H.D.; Guo, Z.X.; Yu, J. Modeling of the electrical percolation of mixed carbon fillers in polymer-based composites. Macromolecules 2008, 42, 459–463. [Google Scholar] [CrossRef]
  15. Román, S.; Lund, F.; Bustos, J.; Palza, H. About the relevance of waviness, agglomeration, and strain on the electrical behavior of polymer composites filled with carbon nanotubes evaluated by a Monte-Carlo simulation. Mater. Res. Express 2018, 5, 015044. [Google Scholar] [CrossRef] [Green Version]
  16. Zhao, N.; Kim, Y.; Koo, J.H. 3D Monte Carlo simulation modeling for the electrical conductivity of carbon nanotube-incorporated polymer nanocomposite using resistance network formation. Mater. Sci. 2018, 2, 1. [Google Scholar] [CrossRef]
  17. Liu, Y.; Chen, X. Continuum models of carbon nanotube-based composites using the boundary element method. Electron. J. Bound. Elem. 2003, 1. [Google Scholar] [CrossRef] [Green Version]
  18. Liu, Y.; Nishimura, N.; Otani, Y. Large-scale modeling of carbon-nanotube composites by a fast multipole boundary element method. Comput. Mater. Sci. 2005, 34, 173–187. [Google Scholar] [CrossRef]
  19. Berhan, L.; Sastry, A. Modeling percolation in high-aspect-ratio fiber systems. I. Soft-core versus hard-core models. Phys. Rev. E 2007, 75, 041120. [Google Scholar] [CrossRef] [Green Version]
  20. Gong, S.; Zhu, Z.; Meguid, S. Anisotropic electrical conductivity of polymer composites with aligned carbon nanotubes. Polymer 2015, 56, 498–506. [Google Scholar] [CrossRef]
  21. Du, F.; Fischer, J.E.; Winey, K.I. Effect of nanotube alignment on percolation conductivity in carbon nanotube/polymer composites. Phys. Rev. B 2005, 72, 121404. [Google Scholar] [CrossRef] [Green Version]
  22. Zeng, X.; Xu, X.; Shenai, P.M.; Kovalev, E.; Baudot, C.; Mathews, N.; Zhao, Y. Characteristics of the electrical percolation in carbon nanotubes/polymer nanocomposites. J. Phys. Chem. C 2011, 115, 21685–21690. [Google Scholar] [CrossRef]
  23. Ghazavizadeh, A.; Baniassadi, M.; Safdari, M.; Atai, A.; Ahzi, S.; Patlazhan, S.; Gracio, J.; Ruch, D. Evaluating the effect of mechanical loading on the electrical percolation threshold of carbon nanotube reinforced polymers: A 3D Monte-Carlo study. J. Comput. Theor. Nanosci. 2011, 8, 2087–2099. [Google Scholar] [CrossRef]
  24. Li, C.; Chou, T.W. Electrical conductivities of composites with aligned carbon nanotubes. J. Nanosci. Nanotechnol. 2009, 9, 2518–2524. [Google Scholar] [CrossRef] [PubMed]
  25. Bao, W.; Meguid, S.; Zhu, Z.; Meguid, M. Modeling electrical conductivities of nanocomposites with aligned carbon nanotubes. Nanotechnology 2011, 22, 485704. [Google Scholar] [CrossRef]
  26. Dijkstra, E.W. A note on two problems in connexion with graphs. Numer. Math. 1959, 1, 269–271. [Google Scholar] [CrossRef] [Green Version]
  27. Glover, F. Tabu search—part II. ORSA J. Comput. 1990, 2, 4–32. [Google Scholar] [CrossRef]
  28. Glover, F. Tabu search—part I. ORSA J. Comput. 1989, 1, 190–206. [Google Scholar] [CrossRef]
  29. Glover, F.; Laguna, M. Tabu Search. In Handbook of Combinatorial Optimization; Springer: Berlin, Germany, 2013; pp. 3261–3362. [Google Scholar]
  30. Plyushch, A.; Lamberti, P.; Spinelli, G.; Macutkevič, J.; Kuzhir, P. Numerical Simulation of the Percolation Threshold in Non-Overlapping Ellipsoid Composites: Toward Bottom-Up Approach for Carbon Based Electromagnetic Components Realization. Appl. Sci. 2018, 8, 882. [Google Scholar] [CrossRef] [Green Version]
  31. Simmons, J.G. Generalized formula for the electric tunnel effect between similar electrodes separated by a thin insulating film. J. Appl. Phys. 1963, 34, 1793–1803. [Google Scholar] [CrossRef] [Green Version]
  32. Bychanok, D.; Kanygin, M.; Okotrub, A.V.; Shuba, M.; Paddubskaya, A.; Pliushch, A.; Kuzhir, P.; Maksimenko, S. Anisotropy of the electromagnetic properties of polymer composites based on multiwall carbon nanotubes in the gigahertz frequency range. Jetp Lett. 2011, 93, 607. [Google Scholar] [CrossRef]
  33. CUDA FORTRAN. Available online: https://developer.nvidia.com/cuda-fortran (accessed on 14 February 2020).
  34. Weibull, W. A statistical distribution function of wide applicability. J. Appl. Mech. 1951, 18, 293–297. [Google Scholar]
  35. Dagan, G. Higher-order correction of effective permeability of heterogeneous isotropic formations of lognormal conductivity distribution. Transp. Porous Media 1993, 12, 279–290. [Google Scholar] [CrossRef]
  36. Stauffer, D.; Aharony, A. Introduction to Percolation Theory; CRC Press: Boca Raton, FL, USA, 1994. [Google Scholar]
  37. Zhang, R.; Baxendale, M.; Peijs, T. Universal resistivity–strain dependence of carbon nanotube/polymer composites. Phys. Rev. B 2007, 76, 195433. [Google Scholar] [CrossRef]
  38. Alig, I.; Skipa, T.; Engel, M.; Lellinger, D.; Pegel, S.; Pötschke, P. Electrical conductivity recovery in carbon nanotube–polymer composites after transient shear. Phys. Status Solidi B 2007, 244, 4223–4226. [Google Scholar] [CrossRef]
  39. Hu, N.; Karube, Y.; Arai, M.; Watanabe, T.; Yan, C.; Li, Y.; Liu, Y.; Fukunaga, H. Investigation on sensitivity of a polymer/carbon nanotube composite strain sensor. Carbon 2010, 48, 680–687. [Google Scholar] [CrossRef]
  40. Bychanok, D.; Shuba, M.; Kuzhir, P.; Maksimenko, S.; Kubarev, V.; Kanygin, M.; Sedelnikova, O.; Bulusheva, L.; Okotrub, A. Anisotropic electromagnetic properties of polymer composites containing oriented multiwall carbon nanotubes in respect to terahertz polarizer applications. J. Appl. Phys. 2013, 114, 114304. [Google Scholar] [CrossRef] [Green Version]
  41. Shuba, M.; Slepyan, G.Y.; Maksimenko, S.; Thomsen, C.; Lakhtakia, A. Theory of multiwall carbon nanotubes as waveguides and antennas in the infrared and the visible regimes. Phys. Rev. B 2009, 79, 155403. [Google Scholar] [CrossRef] [Green Version]
  42. Li, C.; Thostenson, E.T.; Chou, T.W. Dominant role of tunneling resistance in the electrical conductivity of carbon nanotube–based composites. Appl. Phys. Lett. 2007, 91, 223114. [Google Scholar] [CrossRef]
Figure 1. Probability density function (PDF) for the zenith angle for different deformations (k) for the carbon nanotubes (CNTs).
Applsci 10 01315 g001
Figure 2. Visualisation of the CNT-filled composite with k = 1 and k = 10 .
Applsci 10 01315 g002
Figure 3. Empirical cumulative probability function for the percolation concentration in deformed and non-deformed composites (symbols), and Weibull cumulative probability distributions (CDFs) (5) (solid curves).
Applsci 10 01315 g003
Figure 4. Scale factor (a) and Weibull modulus (b) as a functions of the deformation.
Applsci 10 01315 g004
Figure 5. (a) Empirical PDF of the conductivity of the isotropic composite with 5 vol. % of CNTs with different cell size n. (b) Empirical CDF of the conductivity in different directions for the isotropic composite with 5 vol. % of CNTs with n = 4. 1500 realisations were collected.
Applsci 10 01315 g005
Figure 6. Conductivity dependence (a) on the concentration for the initial and deformed composite in different directions, and (b) on the deformation for the samples with 6 vol. % of the CNTs. Symbols stands for the mean values, and lines denote the 95 % confidence interval width.
Applsci 10 01315 g006
Figure 7. Conductivity dependence on the deformation for the samples with 4 vol. % of the CNTs, computed without boundary conditions. Symbols stands for the mean values, and lines denote the 95% confidence interval width.
Applsci 10 01315 g007

