Article

Optimisation of a Heat Source for Infrared Thermography Measurements: Comparison to Mehler Engineering + Service-Heater

1
Op3Mech Research Group, Faculty of Applied Engineering, University of Antwerp, 2020 Antwerp, Belgium
2
Computer Vision and Systems Laboratory, Department of Electrical and Computer Engineering, Université Laval, Quebec City, QC G1V 0A6, Canada
*
Author to whom correspondence should be addressed.
Appl. Sci. 2020, 10(4), 1285; https://doi.org/10.3390/app10041285
Submission received: 31 December 2019 / Revised: 31 January 2020 / Accepted: 5 February 2020 / Published: 14 February 2020
(This article belongs to the Special Issue Structural Health Monitoring & Nondestructive Testing)

Abstract

:

Featured Application

In order to optimise dynamic line scan thermography, one should use an optimised line heating source. The more the heat is concentrated in a single line, the higher the moving speed of samples could become in order to get the same amount of energy inserted in the sample. Higher movement speeds are needed in order to use the technique of dynamic line scanning in manufacturing processes inspecting the objects while they move over the conveyor belt.

Abstract

Using an optimised heating source in active thermography can facilitate the processing of measurement results. By designing a custom heat source for dynamic line scan thermography, we reduced the excitation power needed to heat the sample and decreased the unwanted side effects originating of a wide-range heating source. The design started from a regular halogen tube lamp and a reflector is composed to provide the desired heating power in a narrow band. The reflector shape is optimised using ray-tracing software to concentrate the electromagnetic radiation along with the heat in a slim line. A comparison between the optimised heat source and a commercially available line-heater is performed. The width of the heated region from the Mehler Engineering + Service-heater is larger than prescribed in the datasheet. The optimised line heater has several advantages over the comercially available heat source.

1. Introduction

Non-destructive testing (NDT) is globally progressing in the world of material inspections. The purpose of these tests is to inspect the structural integrity of objects without damaging the product itself. Until today, extra products needed to be produced to put them through destructive tests. Those non-destructive evaluations provide a swift, reliable and cost-effective manner to investigate objects without harming their purpose [1,2].
There exist two types of infrared thermography based on the source of the evaluated temperatures. Every object exceeding absolute zero (0K) emits infrared radiation. In passive thermography, the measured temperature differences are solely dependent on the emissivity and the temperature of the object to be inspected. Active thermography depends on exciting the test object using an external source in order to measure the temperature change between the heating and cooling phase. Multiple excitation sources exist in active thermography based on different heating techniques such as halogen lamps, flash lamps, laser heating ultrasonic excitation, microwaves, eddy currents excitation, etc. In order to choose the right source to perform infrared measurements, one should consider the advantages and disadventages of each source. Laser heating makes it possible to heat only small regions. Halogen lamps on the other have the advantage to heat the specimen in a cheaper and safer way.
Halogen lamps are widely used in infrared thermography because of the cost and broad wavelength spectrum. A disadvantage of using halogen lamps is the large heating region of the object to be inspected. One could try to minimise the heated region by using a slit allowing only a part of the heating energy to leave the reflector of the heating source. With the aid of a slit, the rays outside the desired heating area are blocked and a loss of possible heating energy occurs. One can see that the amount of blocked rays should be minimised. Additionally, diffraction causes the available rays to diverge out of the aperture further reducing the heating energy density. Figure 1 displays two preliminary set-ups that are used in our lab to minimise the heated region.
Designing an optimised reflector could offer a safe and cost-effective heating source when combined with a halogen tube lamp. It could be a great substitute for using laser excitation and could facilitate the further development of Dynamic Line Scan Thermography. To increase the temperature difference between the heating and cooling down of the object, the available heating power of the halogen lamp needs to be concentrated in a small region. Concentrating the power enables the possibility to deliver more excitation power in a small time period. This results in a powerful heating. The heating source approximates rather flash excitation than long step heating.
Several studies are performed in order to focus electromagnetic radiation in order to produce heat. Almost all these applications are powered by sunlight and use parabolas in order to focus the radiation in a single point [3,4,5]. According to the reflecting property of a parabola, rays originating in the focal point of the parabola will be reflected parallel to each other. Lee et al. [6,7] investigated the possibility to use parabolic and elliptical mirrors to generate local heating of high-strength steels. Unvala and Maries [8] checked the heating peculiarities of a tungsten halogen lamp combined with an elliptical reflector shape. Using a 1 kW heating source, a heated region of 2 cm with heating temperatures of 1200 °C were generated.
We propose an approach to merge the local heating of laser heating with the safety of tungsten halogen tube lamps. A lamp reflector is designed using ray tracing software in order to achieve the focussed power.

2. Methodology

2.1. Requirements

The heat source should meet several predefined requirements: the focus length is defined at about 10 cm based on the dimensions of the commercially available MES-heater [9]. Secondly, the used source should be a tungsten halogen lamp, also known as a halogen lamp. Tungsten halogen tube lamps are safe to use in almost all conditions and they are universally accessible. Furthermore, the heated region has to be as small as possible and we intend to concentrate a minimum of 80% of the heat radiation. The more the radiation is focussed into a smaller region, the less energy is needed to provide the same energy density.

2.2. Geometry

Multiple mathematical shapes exist with all different reflection characteristics: parabola, ellipse, etc. The reflective characteristic of a parabola is confirmed by multiple studies [10,11,12,13] and states that incident parallel rays are reflected to the focus point of the parabolic reflector. Consequently, rays originating in the focal point are always reflected parallel to the symmetry axis of the parabola. These reflected rays automatically create a wide heated region. We intend to concentrate the radiation in a small point for every section of the reflector in order to minimise the heated region; therefore, a parabola can not be used as a reflector shape for this purpose.
Another interesting mathematical shape is an ellipse because of its reflective property and could offer a solution for our application. This reflective property is better known as the focal property of an ellipse [14]. We could mount the tungsten halogen lamp in F1 of the ellipse to focus the radiation in F2. Thanks to this approach, all radiation originating in the halogen lamp will be reflected to the heated area on the specimen (F2). Figure 2 visualises the different properties of a parabola and an ellipse.
According to the focal property of an ellipse, it is theoretically possible to focus the electromagnetic radiation on a small point as long as the elliptical shape remains closed. As can be seen in Figure 2, cutting a part of the elliptical reflector results in rays not being reflected towards the second focal point. For our application, it is not possible to keep the elliptical reflector closed in order to be able to heat the object. The radiation has to leave the reflector in order to induce a temperature increase of the sample.
Removing a part of the elliptical reflector leads to a wider radiation pattern as a result of the rays not being reflected towards the focus point. Using simple mathematics, the percentage of direct heating rays reaching the object can be calculated. In Figure 3, a simplified representation of the halogen tube lamp and the direct heated region of the object can be seen. The desired focus distance of the heat source is represented by O F ¯ . The width of the opening in the reflector shape is called E 2 E ¯ and H 2 H ¯ describes the wanted illuminated region. In the right-angled triangle △OFE (the angle between O F ¯ and F E ¯ equals 90 degrees), the length of O E ¯ can be found using Pythagoras Theorem:
O E ¯ 2 = O F ¯ 2 + F E ¯ 2
The value for α can be found using:
α = s i n 1 ( O F ¯ O E ¯ )
The width of the total heated region equals F E ¯ and the wanted illuminated region is presented by F H ¯ . The length of the undesired heated region can easily be found by subtracting F H ¯ of F E ¯ . In triangle △OHE, the length of O H ¯ can be found using the law of cosines:
O H ¯ 2 = H E ¯ 2 + O E ¯ 2 2 H E ¯ O E ¯ c o s ( α )
Therefore, the angle between O H ¯ and O E ¯ can be calculated applying the law of cosines a second time:
H E ¯ 2 = O E ¯ 2 + O H ¯ 2 2 O E ¯ O H ¯ c o s ( β )
The area of the lamp heating the specimen outside the wanted region can be calculated by:
A outside = β r 2
This area is the combination of the circular sectors in the triangles △OHE and OH2E2. One should note that β is in radians to calculate the area of the circular sector. The percentage of the lamp heating the specimen directly can finally be found:
% outside = A outside Π r 2 100 % = β Π 100 %
Ending the elliptical reflector shape at 10 cm from the top leads to an illuminated region of 2.7 cm and the wanted maximum width of the region is 1 cm. Conforming to the previous calculations, the difference between the heated and desired region of 1.7 cm equals an area of 2.68% of our excitation source. The purpose of the research is to focus the light in a heated region of maximum 1 cm. Because of the opening in the elliptical reflector shape, a circular sector of the radiating tungsten halogen tube lamp will directly heat the specimen. To assure the wanted 1-cm-wide concentrated radiation area is attained, extra reflectors are added in the reflector shape. The length and the placement of the additional reflectors can be found using simple mathematics. Considering a rectangle with height O F ¯ and width F E ¯ , O E ¯ is a diagonal in this rectangle. The other diagonal starting in point F has the same equation as the additional reflector. The reflector starts at the intersection of the diagonal and O H ¯ and ends at the intersection of the diagonal and O E ¯ . This way, the unwanted heated region is nullified. Figure 3 shows the optimised reflector geometry as result of the ray-tracing simulations. The halogen tube lamp has a diameter bigger than the focal point of the ellipse; therefore, the radiation will not originate precisely in the focal point of the ellipse. Assuming that the radiation leaves the halogen tube lamp perpendicular to the length of it, the extended rays intersect the focus of the ellipse, authorising the use of an elliptical reflector.

2.3. Simulation

Designing the optimised reflector happened in multiple stages in order to divide the research into small parts. Initially, a simplified simulation model was built in COMSOL®. This model was used to validate all simulation parameters before starting the optimising of the reflector shape. Secondly, the ray-tracing model was combined with a batch-script to alter the parameters describing the parametric geometries. The batch-script made it possible to use parametric sweep over the parameters in order to find the reflector with the highest intensity in a predefined region.
The following assumptions were made in order to design an optimised geometry:
  • The reflector is made of aluminium.
  • The surface finish is very smooth, ensuring a reflection coefficient around 1.
  • The halogen tube lamp emits electromagnetic-radiation uniform along its length.
  • The heating source and reflector shape are considered to be indefinitely so the sides can be neglected.

2.3.1. Ray-Tracing Model

The simulation model in COMSOL® consists of a 2D ray-tracing model. A 2D simulation can be used to design the best shape for a section of the reflector geometry. There is no need for a 3D ray-tracing simulation model as a result of the simple geometry of a halogen tube lamp. The designed shape for a section can simply been extruded over the total length of the heat source. The simulation model exists of the halogen tube lamp, the reflector shape and an object on which the incident radiation will be measured. Figure 4 visualises the outcome of a ray-tracing simulation in ideal circumstances.

2.3.2. Automated Batch-Script
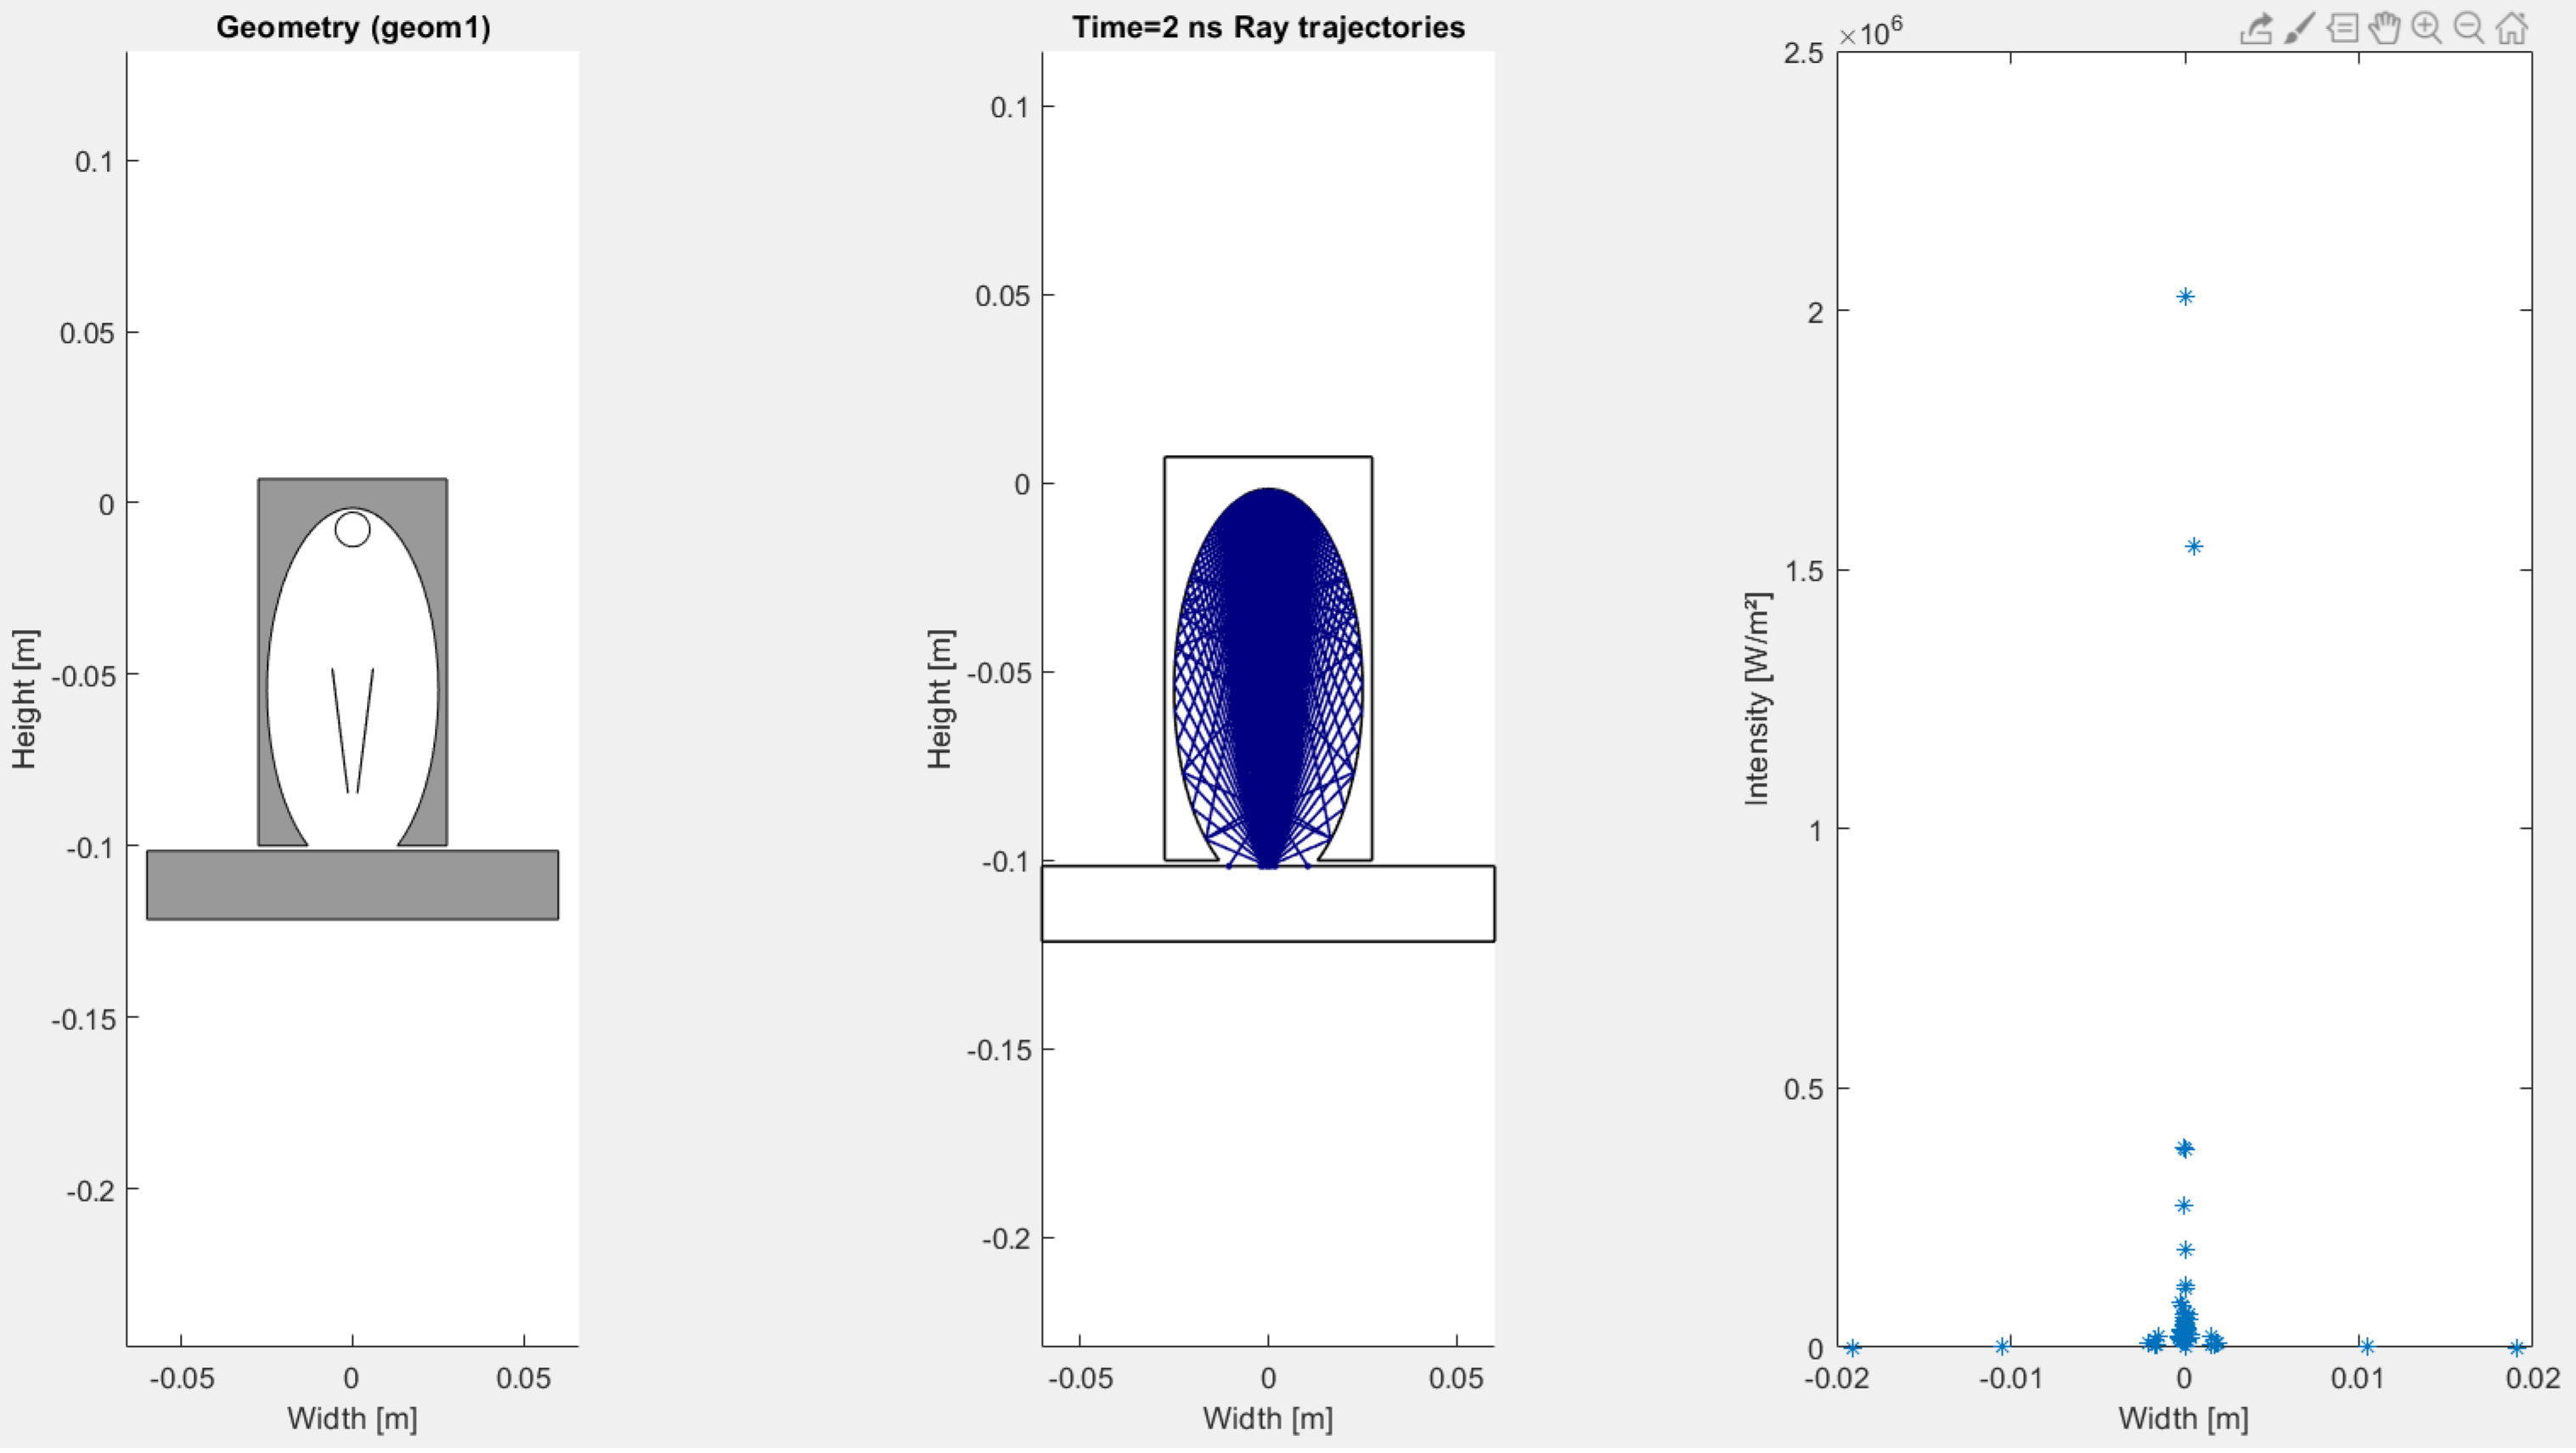
In order to find the optimal reflector shape, multiple shapes were examined. The curvature is described using the minor and major axis of the ellips in order to be able to automate the exploration for the best shape. A parametric sweep is performed using a batch-script. The elliptical reflector can be described by using two parameters: the width and the height (minor and major axis). These two parameters are used during this parametric sweep. For each design, the radiation intensity is calculated in a predefined region and this value is compared to the best simulation design at that moment. The script generates a visualisation of the optimised shape, the ray trajectories and the corresponding intensities.
As a result of the focal property of an ellipse, it is necessary to assemble the heat source accurately. An additional Matlab®-script is programmed to investigate the impact of faulty assembling the optimised heat source. Multiple placement heights of the halogen tube lamp are simulated to check the error size. This error is searched for three geometries to select the most appropriate one out of the simulated designs. Those designs are also compared to three experimental heating sources. Two of them are visible in Figure 1. Figure 4 visualises the output of the Matlab®-script used to investigate the impact of a faulty assembly of the heating source. This script is used with multiple placing heights to investigate the influence of bad assembly for the shown reflector shapes. Figure 5 shows the output for only one placement height. The script exposed that the third reflector shape has the least adverse effects of misplacing the tube lamp.

3. Results

The result of multiple simulations is an optimised line heating source with a heated region of 4 mm wide as can be seen in Figure 5. Recently, our research group bought a line heater source (MES) in order to perform dynamic line thermography. We have chosen to match the dimensions of the MES-heater to the dimensions in our simulation model. This makes it easy to compare the optimised heat source to the commercially available source regarding the width of the heated region. The overall dimensions of the MES-heater are 239 × 55 × 125 mm (L × W × H). The width of the heated region of the MES-heater is inspected using a cooled IR camera, FLIR X6540sc. According to the datasheet of the line heating source, the distance between the bottom of the housing and the specimen should be 1.5 cm. The gap is too narrow to measure the width of the heated region on the top of the object to be inspected. As an alternative, the heated region is being inspected using the IR camera in transmission: a piece of baking paper was inserted at a distance of 1.5 cm of the line heater and the camera captured the heated region. The measurement set-up can be found in Figure 6. The heated region of the MES line heater has a width of 1.13 cm according to the measurements (Figure 7). The optimised reflector on the other hand should deliver a heated width of 4 mm. One should notice that the comparison between the optimised reflector and the MES-heater only served the purpose to validate the results of the optimisation. The optimisation process, however, is generally suitable to optimise line heaters. Line heaters usually use an elliptical reflector [9,15]. Consequently, the improvements with respect to the MES-heater should be comparable to other line heaters as well.

4. Conclusions

It is possible to design a reflector in order to get a minimal heated region using an elliptical shape and additional straight reflectors. The heated region can be minimised to a width of less than 1 cm, which is similar to the heated region of a commercially available line heater. The biggest advantage of using an optimised reflector is the ability to use widely available halogen tube lamps. An optimised line heating source is necessary in order to further optimise the process of dynamic line scan thermography. The theoretical heated region of the optimised heating source is 4 mm and the width of the commercially available source is 1.13 cm. The resulting heated region is only 35% of the initial width leading to a better focus of the available energy and thereby a higher energy density. The MES-heater has an energy density of 44.25 [W/cm2] and the optimised heat source a density of 125 [W/cm2], which corresponds to an improvement of 282.5%, at least theoretically. In future work, the proposed source could be experimentally developed and tested in order to compare the theoretical data with experimental data.

Author Contributions

S.V.: Conceptualisation, Methodology, Validation, Writing—original draft. B.R.: Conceptualisation, Methodology, Writing—review & editing. X.M.: Supervision, Writing—review & editing. G.S.: Conceptualisation, Supervision, Resources, Funding acquisition, Writing—review & editing. All authors have read and agreed to the published version of the manuscript.

Funding

Research funded by: the TETRA fund of the Flanders Innovation & Entrepreneurship Agency (VLAIO) (HBC 0032 2017) “Smart Integration of Numerical modelling with Thermal inspection, SINT” and Research Foundation-Flanders under grant Doctoral (PhD) grant strategic basic research (SB) 1SC0819N (Simon Verspeek).

Conflicts of Interest

The authors declare that there are no conflicts of interest related to this article.

References

  1. Maldague, X.P. Theory and Practice of Infrared Thermography for Nondestructive Testing; Wiley: New York, NY, USA, 2001. [Google Scholar]
  2. Ciampa, F.; Mahmoodi, P.; Pinto, F.; Meo, M. Recent Advances in Active Infrared Thermography for Non-Destructive Testing of Aerospace Components. Sensors 2018, 18, 609. [Google Scholar] [CrossRef] [PubMed] [Green Version]
  3. Chen, J.; Yang, L.; Zhang, Z.; Wei, J.; Yang, J. Optimization of a uniform solar concentrator with absorbers of different shapes. Sol. Energy 2017, 158, 396–406. [Google Scholar] [CrossRef]
  4. Oommen, R.; Jayaraman, S. Development and performance analysis of compound parabolic solar concentrators with reduced gap losses—‘V’ groove reflector. Renew. Energy 2002, 27, 259–275. [Google Scholar] [CrossRef]
  5. Tian, M.; Su, Y.; Zheng, H.; Pei, G.; Li, G.; Riffat, S. A review on the recent research progress in the compound parabolic concentrator (CPC) for solar energy applications. Renew. Sustain. Energy Rev. 2018, 82, 1272–1296. [Google Scholar] [CrossRef] [Green Version]
  6. Lee, E.H.; Yang, D.Y.; Yang, W.H. Numerical modeling and experimental validation of focused surface heating using near-infrared rays with an elliptical reflector. Int. J. Heat Mass Transf. 2014, 78, 240–250. [Google Scholar] [CrossRef]
  7. Lee, E.H.; Hwang, J.S.; Lee, C.W.; Yang, D.Y.; Yang, W.H. A local heating method by near-infrared rays for forming of non-quenchable advanced high-strength steels. J. Mater. Process. Technol. 2014, 214, 784–793. [Google Scholar] [CrossRef]
  8. Unvala, B.A.; Maries, A. Radiant heating using an ellipsoidal reflector. J. Phys. E Sci. Instrum. 1974, 7, 4385–4390. [Google Scholar] [CrossRef]
  9. Mehler Engineering Service. Industrial Infrared Line Heater. Available online: https://www.m-e-s.de/en/infrared-drying-technology/infrared-line-radiators/ (accessed on 16 December 2019).
  10. Rashed, R. A Pioneer in Anaclastics: Ibn Sahl on Burning Mirrors and Lenses. Isis 1990, 81, 464–491. [Google Scholar] [CrossRef]
  11. Holland, F. The Reflective Property of a Parabola. Ir. Math. Soc. Bull. 2010, 66, 87–90. [Google Scholar]
  12. Williams, R.C.; By, E.; Hutchinson, J.P.; Wagon, S. A Proof of the Reflective Property of the Parabola. Am. Math. 1987, 94, 667–668. [Google Scholar] [CrossRef]
  13. Waghmare, S.A.; Gulhane, N.P. Design and ray tracing of a compound parabolic collector with tubular receiver. Sol. Energy 2016, 137, 165–172. [Google Scholar] [CrossRef]
  14. Berendonk, S. Proving the Reflective Property of an Ellipse. Math. Mag. 2014, 87, 276–279. [Google Scholar] [CrossRef]
  15. LineIR: Radiant Infrared Line Heater. Available online: http://www.researchinc.com/products/lineir (accessed on 3 February 2020).
Figure 1. Two experimental set-ups are displayed as they are used in our lab: (Left) cylindrical reflector constructed to concentrate the radiation in a narrow line. This heater is used in dynamic measurements as a hand-held heater. Starting from a hollow tube a slit was milled with the desired width in order to create the reflector shape. (Right) empirical test-setup for Dynamic Line Scan Thermography on a conveyor belt. A wooden plate wrapped in aluminium foil was mounted underneath a patio heater. In the middle of the plate, a slit with desired width and length was cut in order to create the reflector shape. Both setups use a thin slot to minimise the heated region. Only the electromagnetic radiation passing through the slit will heat up the specimen to be inspected. Other rays will be blocked and thereby a large amount of energy is wasted.
Applsci 10 01285 g001
Figure 2. The reflecting characteristics of a parabola and an ellipse are visualised. All parallel rays entering a parabolic reflector will be focussed on the focal point. Each ray leaving one focal point of the ellipse will be reflected to the other focal point of the ellipse. One can see that cutting the ellipse on the red line will result in rays not being reflected by the elliptical shape towards the second focal point.
Applsci 10 01285 g002
Figure 3. (Left) This figure shows a geometrical representation in order to calculate the amount of the radiation not being reflected by the elliptical reflector. The left image represents the complete set-up with the halogen tube lamp in point O and the focal point in point F. E 2 E ¯ represents the width of the illuminated region by direct rays leaving the tube lamp. The right image can be used to determine the angles needed to calculate the unwanted illuminated area. Representation of the optimised reflector shape and the related ray trajectories. (Middle) Optimised reflector shape established through ray-tracing simulations. The optimised heating source consists of an external reflector in the shape of an ellipse and additional straight reflectors in the middle. The halogen tube lamp is placed in the upper focal point of the ellipse. (Right) Ray trajectories according to ray-tracing simulation. The vast majority of the electromagnetic rays are focussed in the second focal point of the ellipse. The minority that intersects with the sample outside the focal point are reflected from the additional reflectors in the heat source. The heating power coming from these rays is negligible.
Applsci 10 01285 g003
Figure 4. Multiple geometries are compared to each other. The height location of the halogen tube lamp changes to find the heating difference as result of misplacing the halogen tube lamp. Initial dimensions were different than those of the optimised reflector.
Applsci 10 01285 g004
Figure 5. The optimised reflector shape as a result of the ray-tracing simulation can be found on the left, the rays are in the middle, and the intensity of each ray and the width of the heated region are in the right image. This reflector shape resulted in the smallest heated region and has the least adverse effects if the halogen tube lamp is placed at a non-optimal height. Other reflector shapes that were investigated are shown in Figure 4.
Applsci 10 01285 g005
Figure 6. In the left picture, the MES-heater is visible in the measurement setup. The setup consists of the line heating source, a baking paper clamped between two wooden frames and the FLIR X6540sc infrared camera. The baking paper is used to investigate the heated area of the sample in transmission mode. The baking paper was placed at a distance of 1.5 cm from the bottom of the line heater as recommended in the datasheet.
Applsci 10 01285 g006
Figure 7. Representation of the heated region with a temperature above 250 °C. A width of 1.13 cm is calculated using a Matlab®-script.
Applsci 10 01285 g007

