Experimental Study of Stepped-Lap Scarf Joint Repair for Spar Cap Damage of Wind Turbine Blade in Service


Abstract
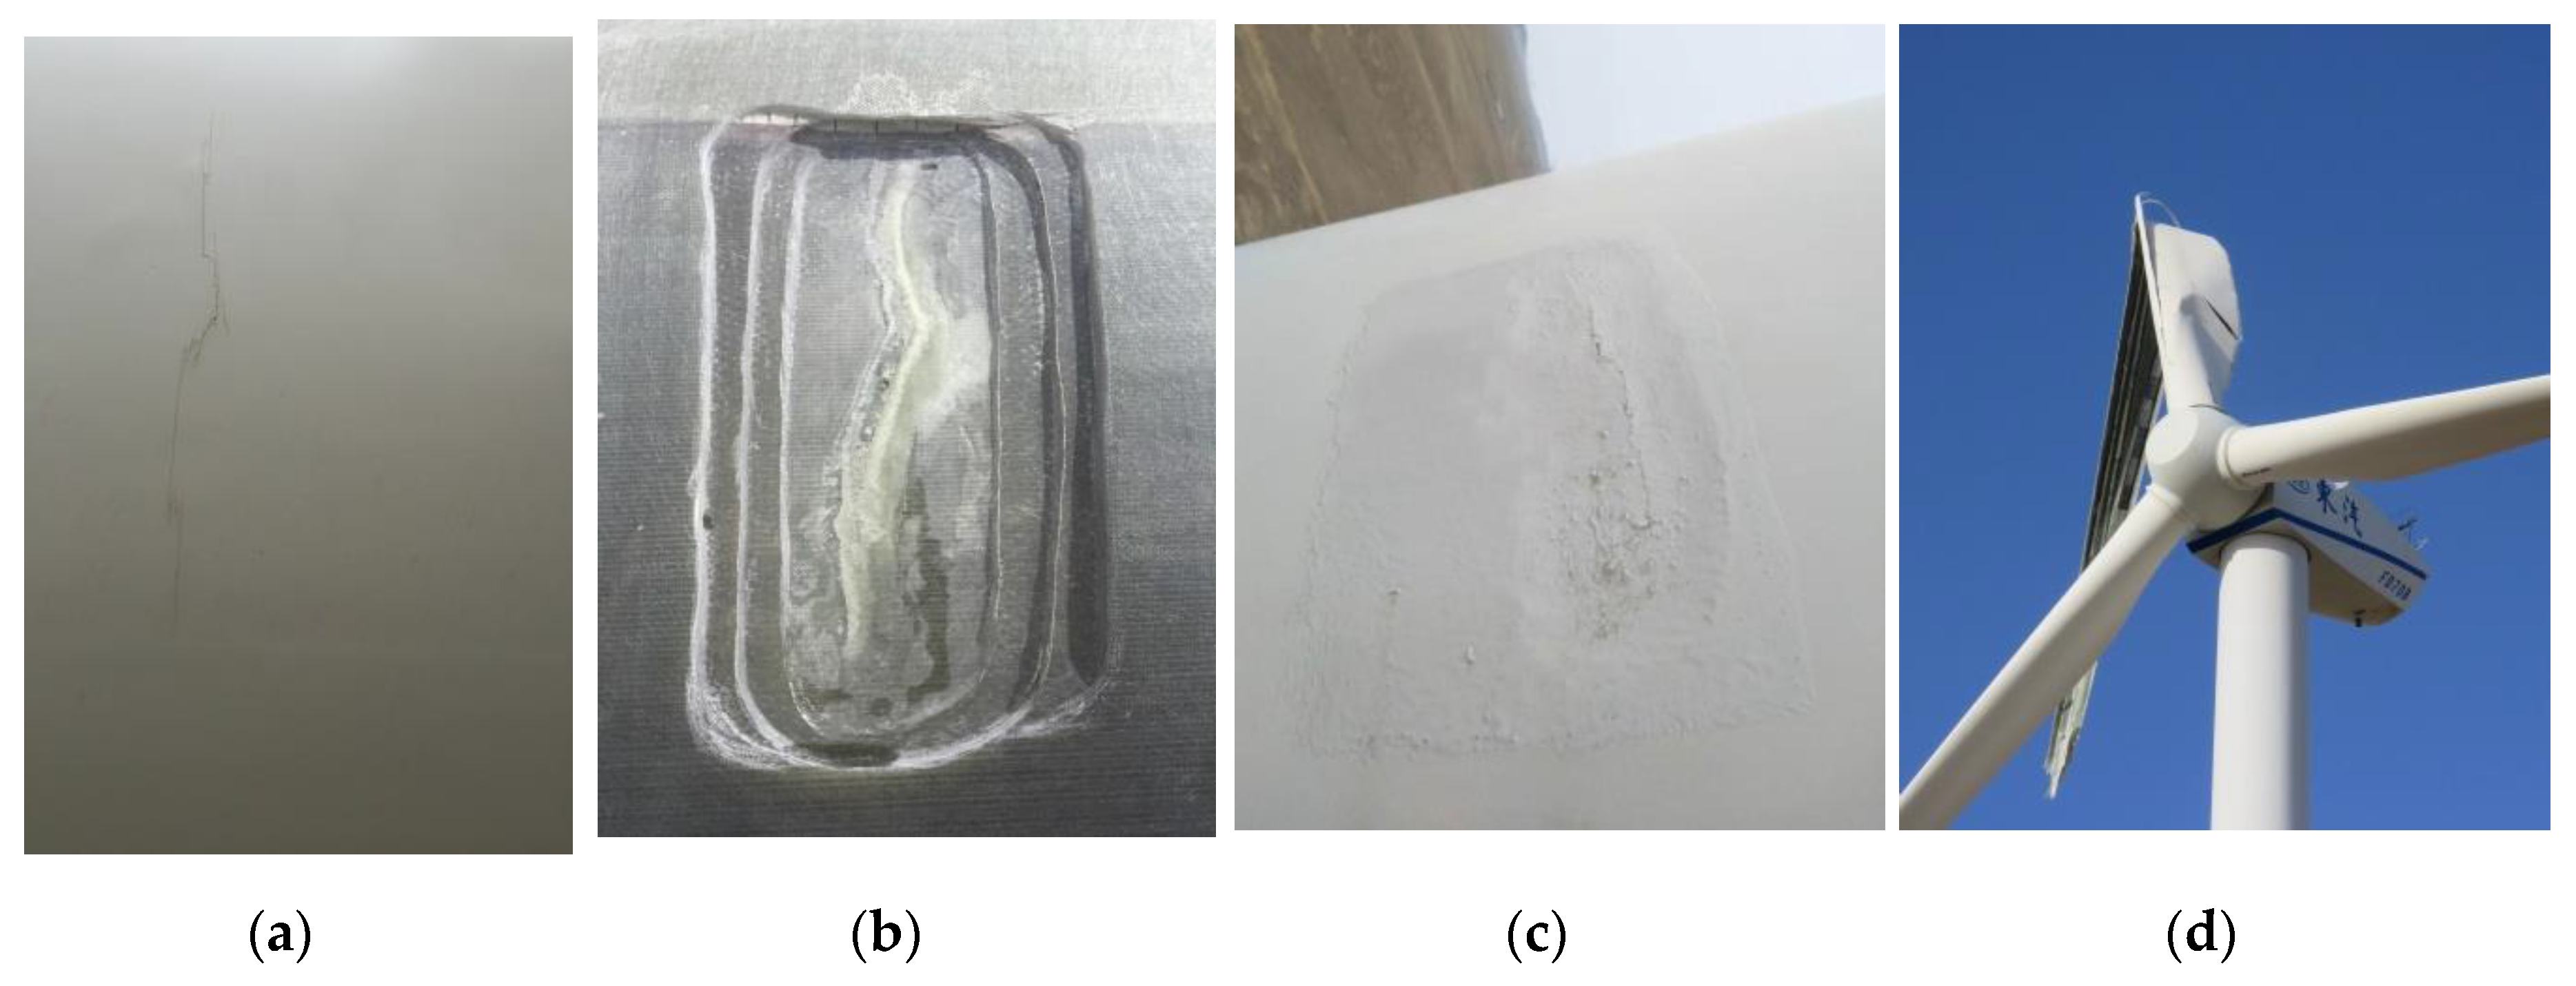
1. Introduction
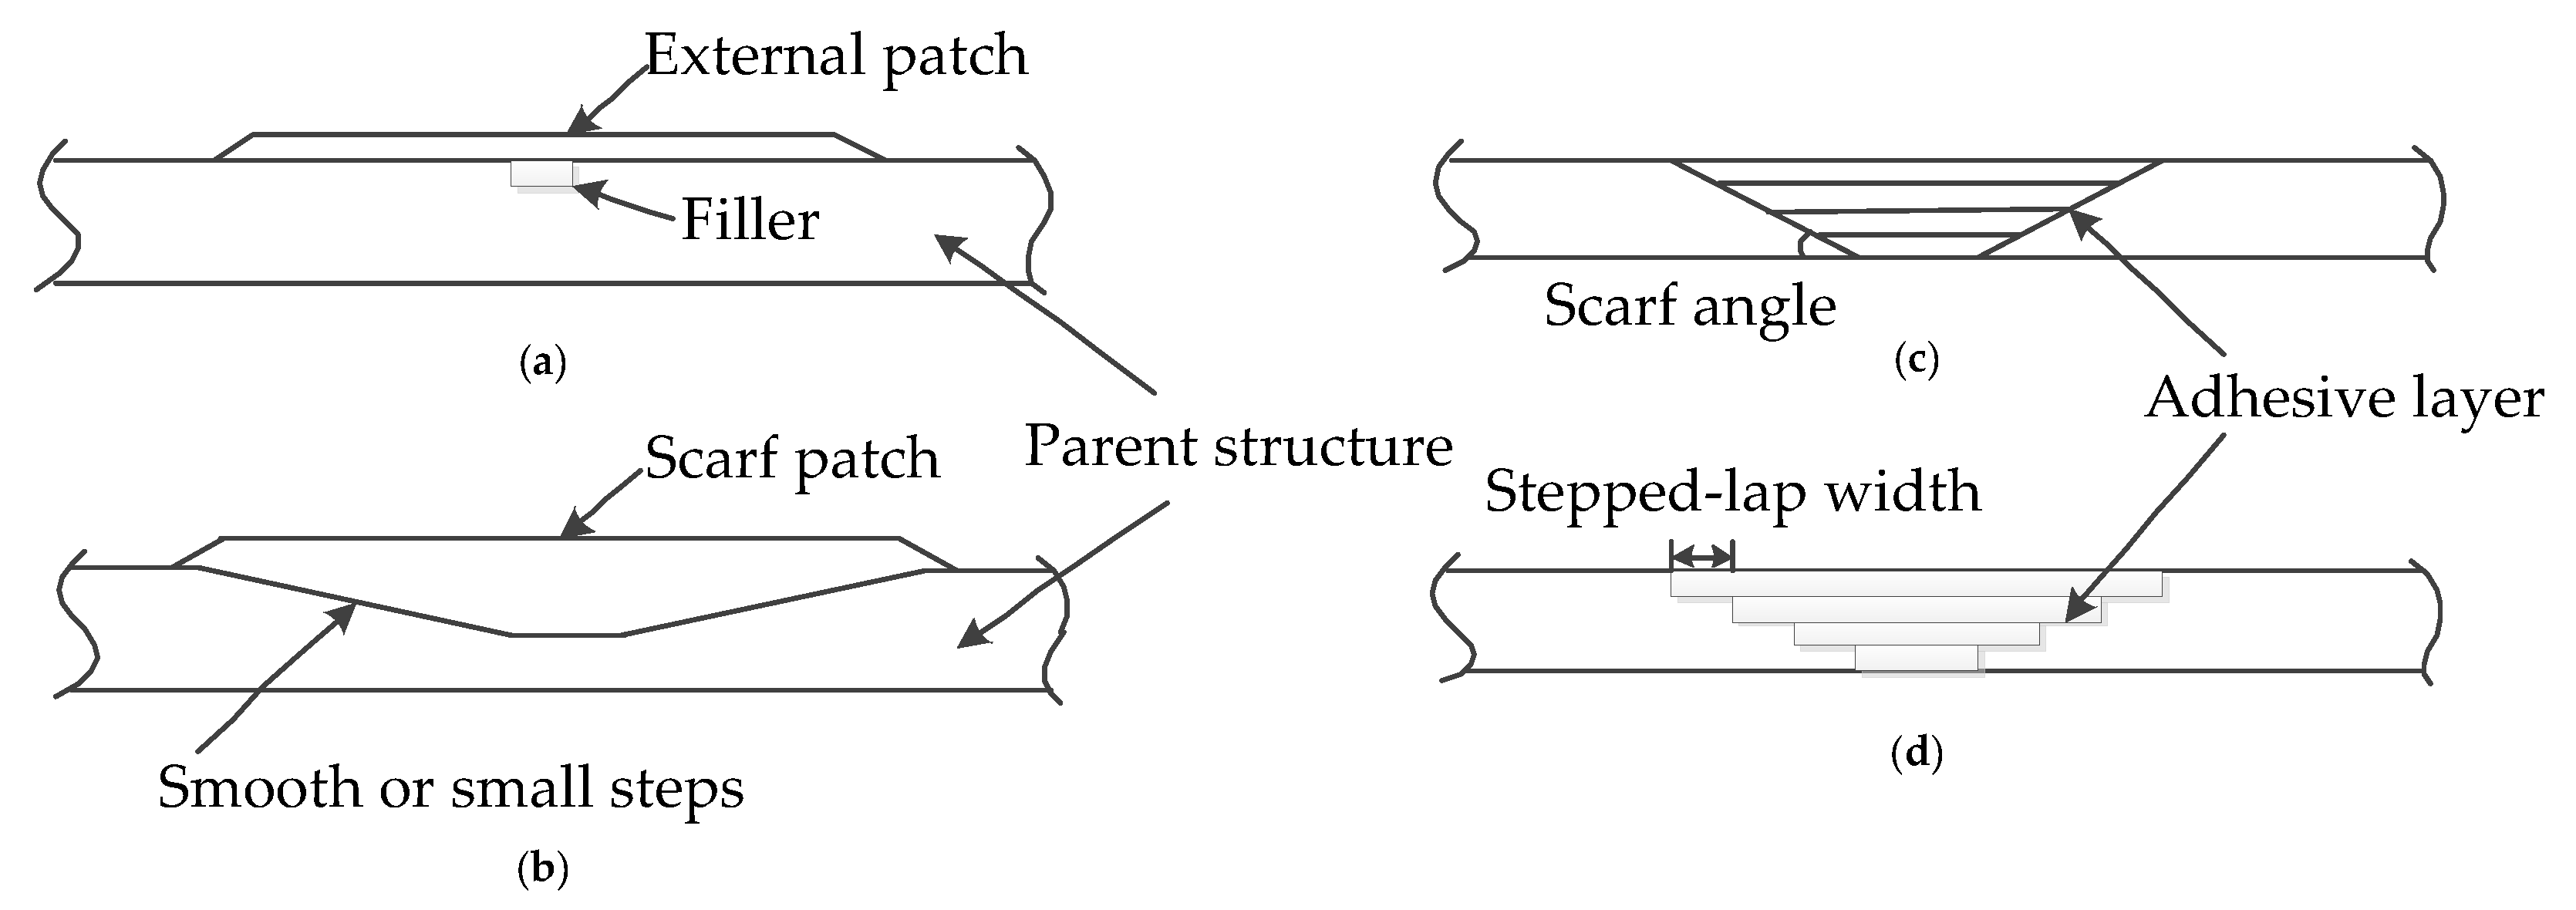
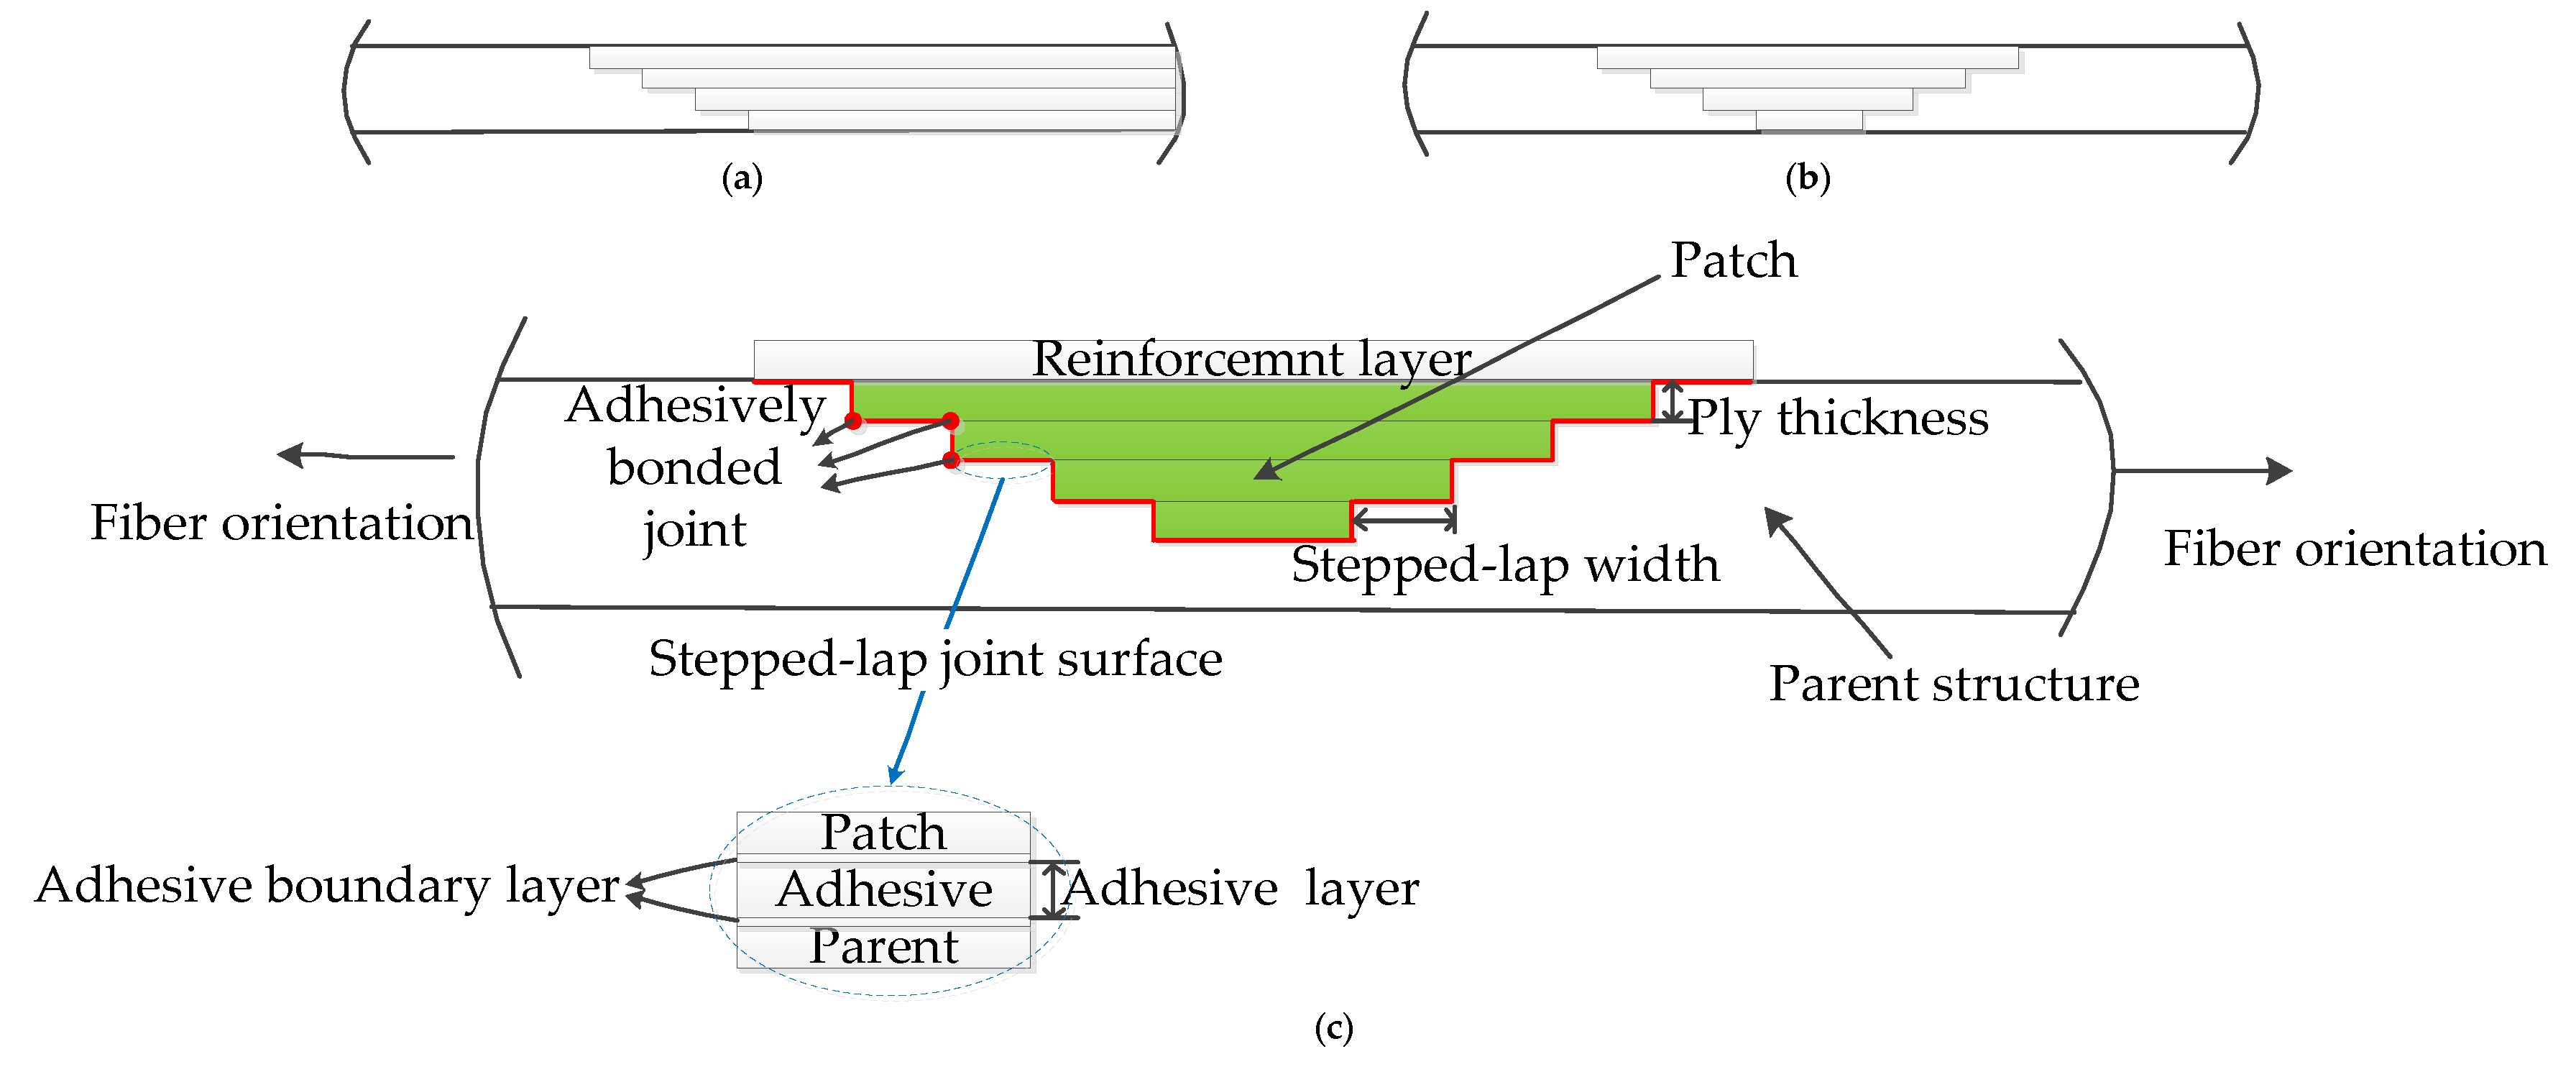
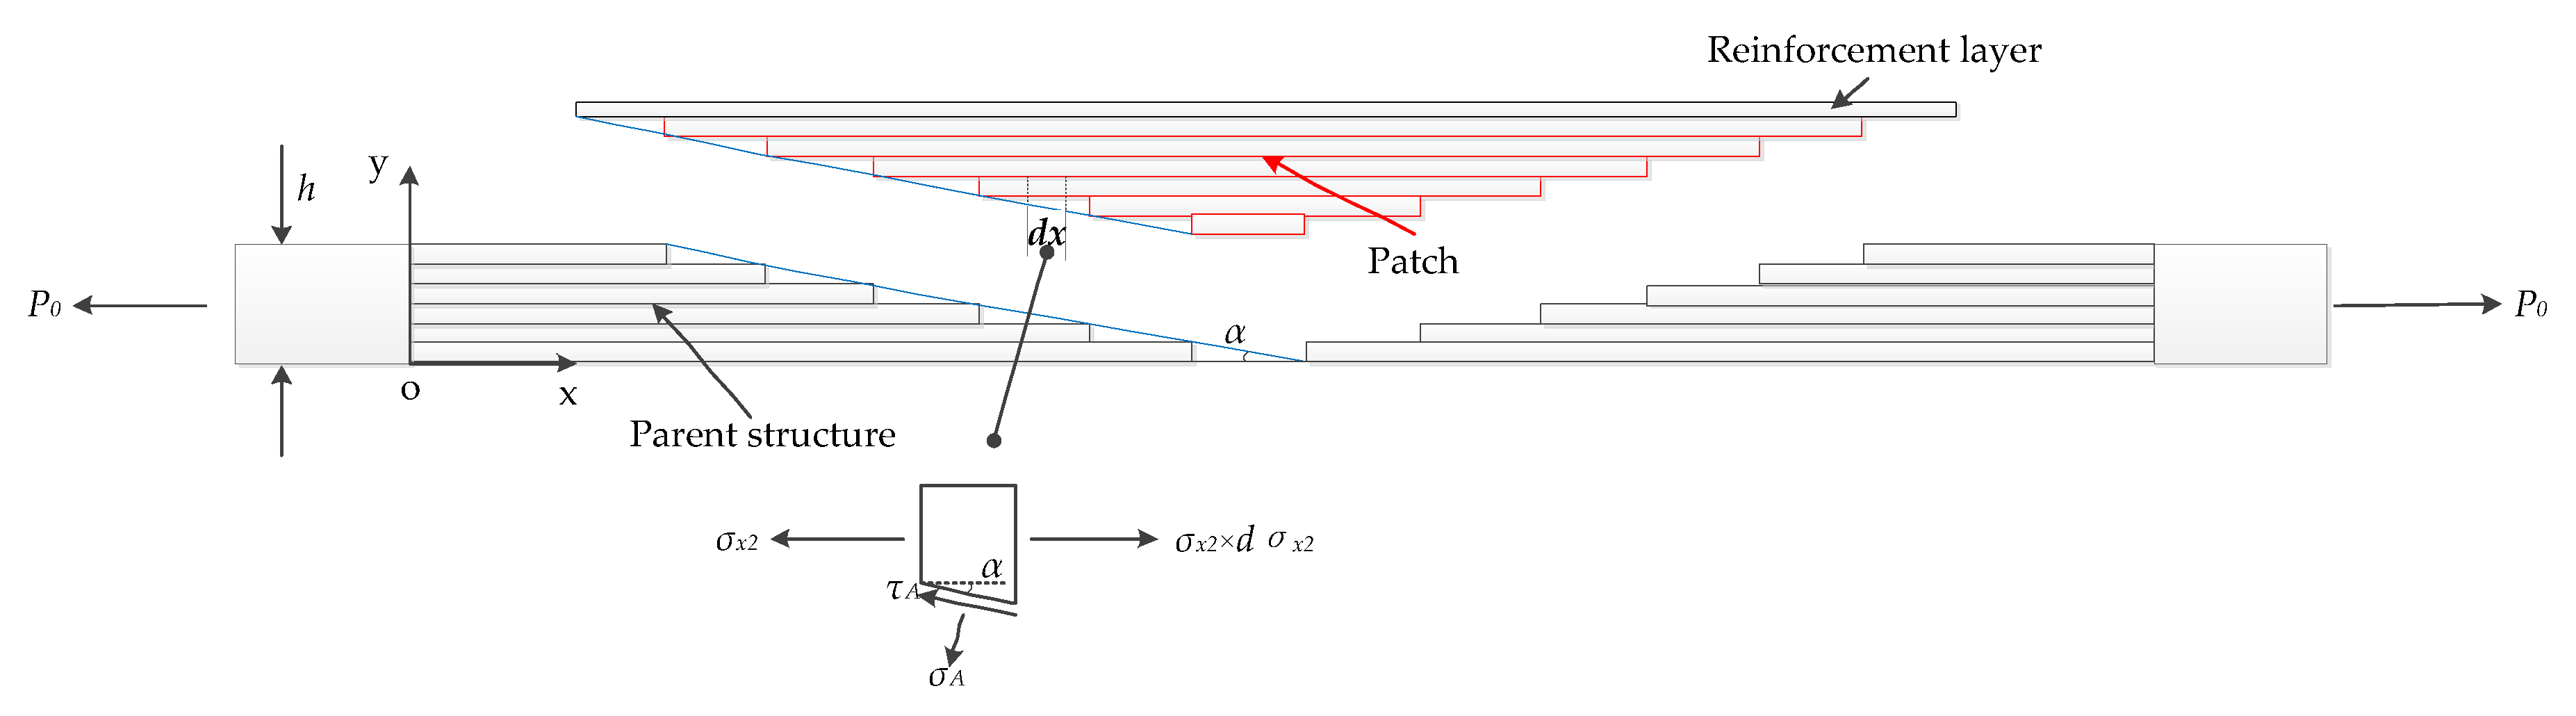
2. Stepped-Lap Scarf Joint Repairing Method
3. Tensile Test for the Unidirectional Tape Specimens with a Large Aspect Ratio Repaired Using Multiple Stepped-Lap Scarf Joint Method
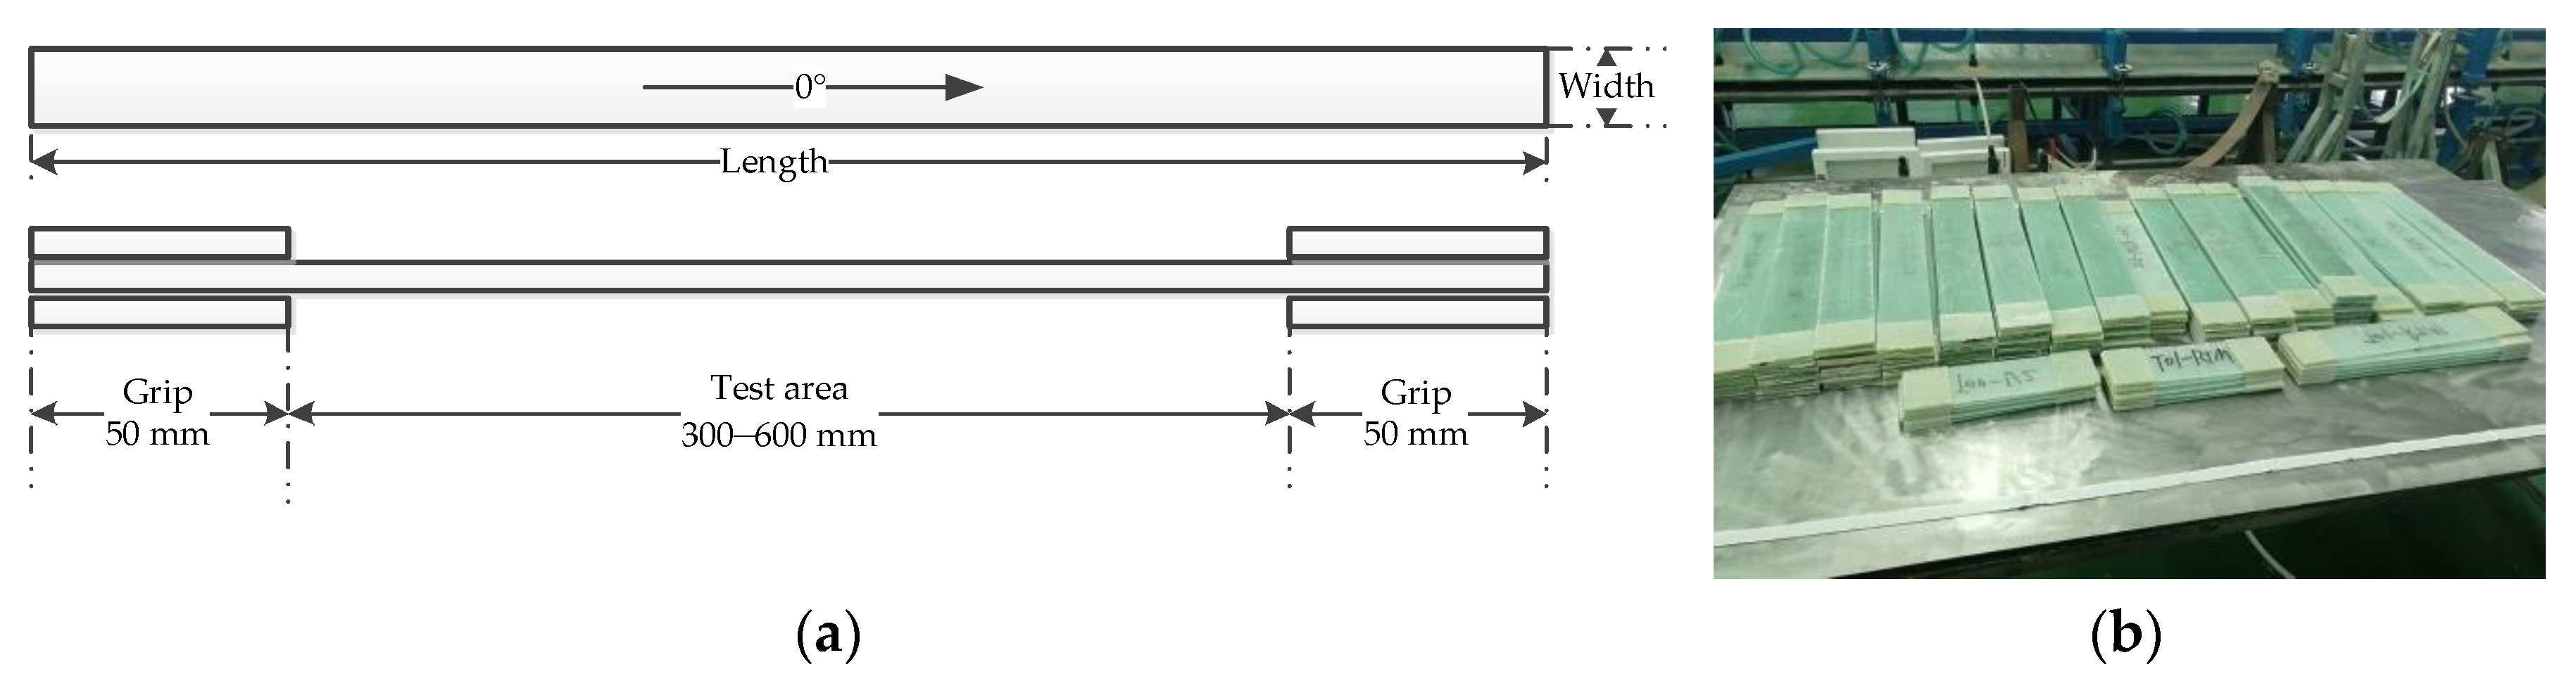
3.1. Experimental Basis
3.2. Results and Discussion
3.2.1. The Influence Analysis Regarding the Stepped-Lap Mode and Stepped-Lap Joint Surface Number
- The results of the three stepped-lap joint surfaces, two stepped-lap joint surfaces, and one stepped-lap joint surface experiments showed that the stepped-lap joint surface decreased the strength of the specimens. Whether using single stepped lap or double stepped lap, the load loss rates of the two and three stepped-lap joint surfaces were significantly larger than that of a one stepped-lap joint surface.
- Comparing single stepped-lap and double stepped-lap specimens with multiple stepped-lap joint surfaces, the failure load and tensile strength of these were basically the same. The results above showed that the stepped-lap mode itself had little influence on the strength of the specimens.
3.2.2. Analysis on Strength Attenuation of the Spar Cap Specimens Taken from the LZ37.5 Blade in Service
- Comparing W1-F with W1-J and W1-B with W1-K showed that as the service life increased, the blade’s spar cap in service for more than eight years had intensity attenuation.
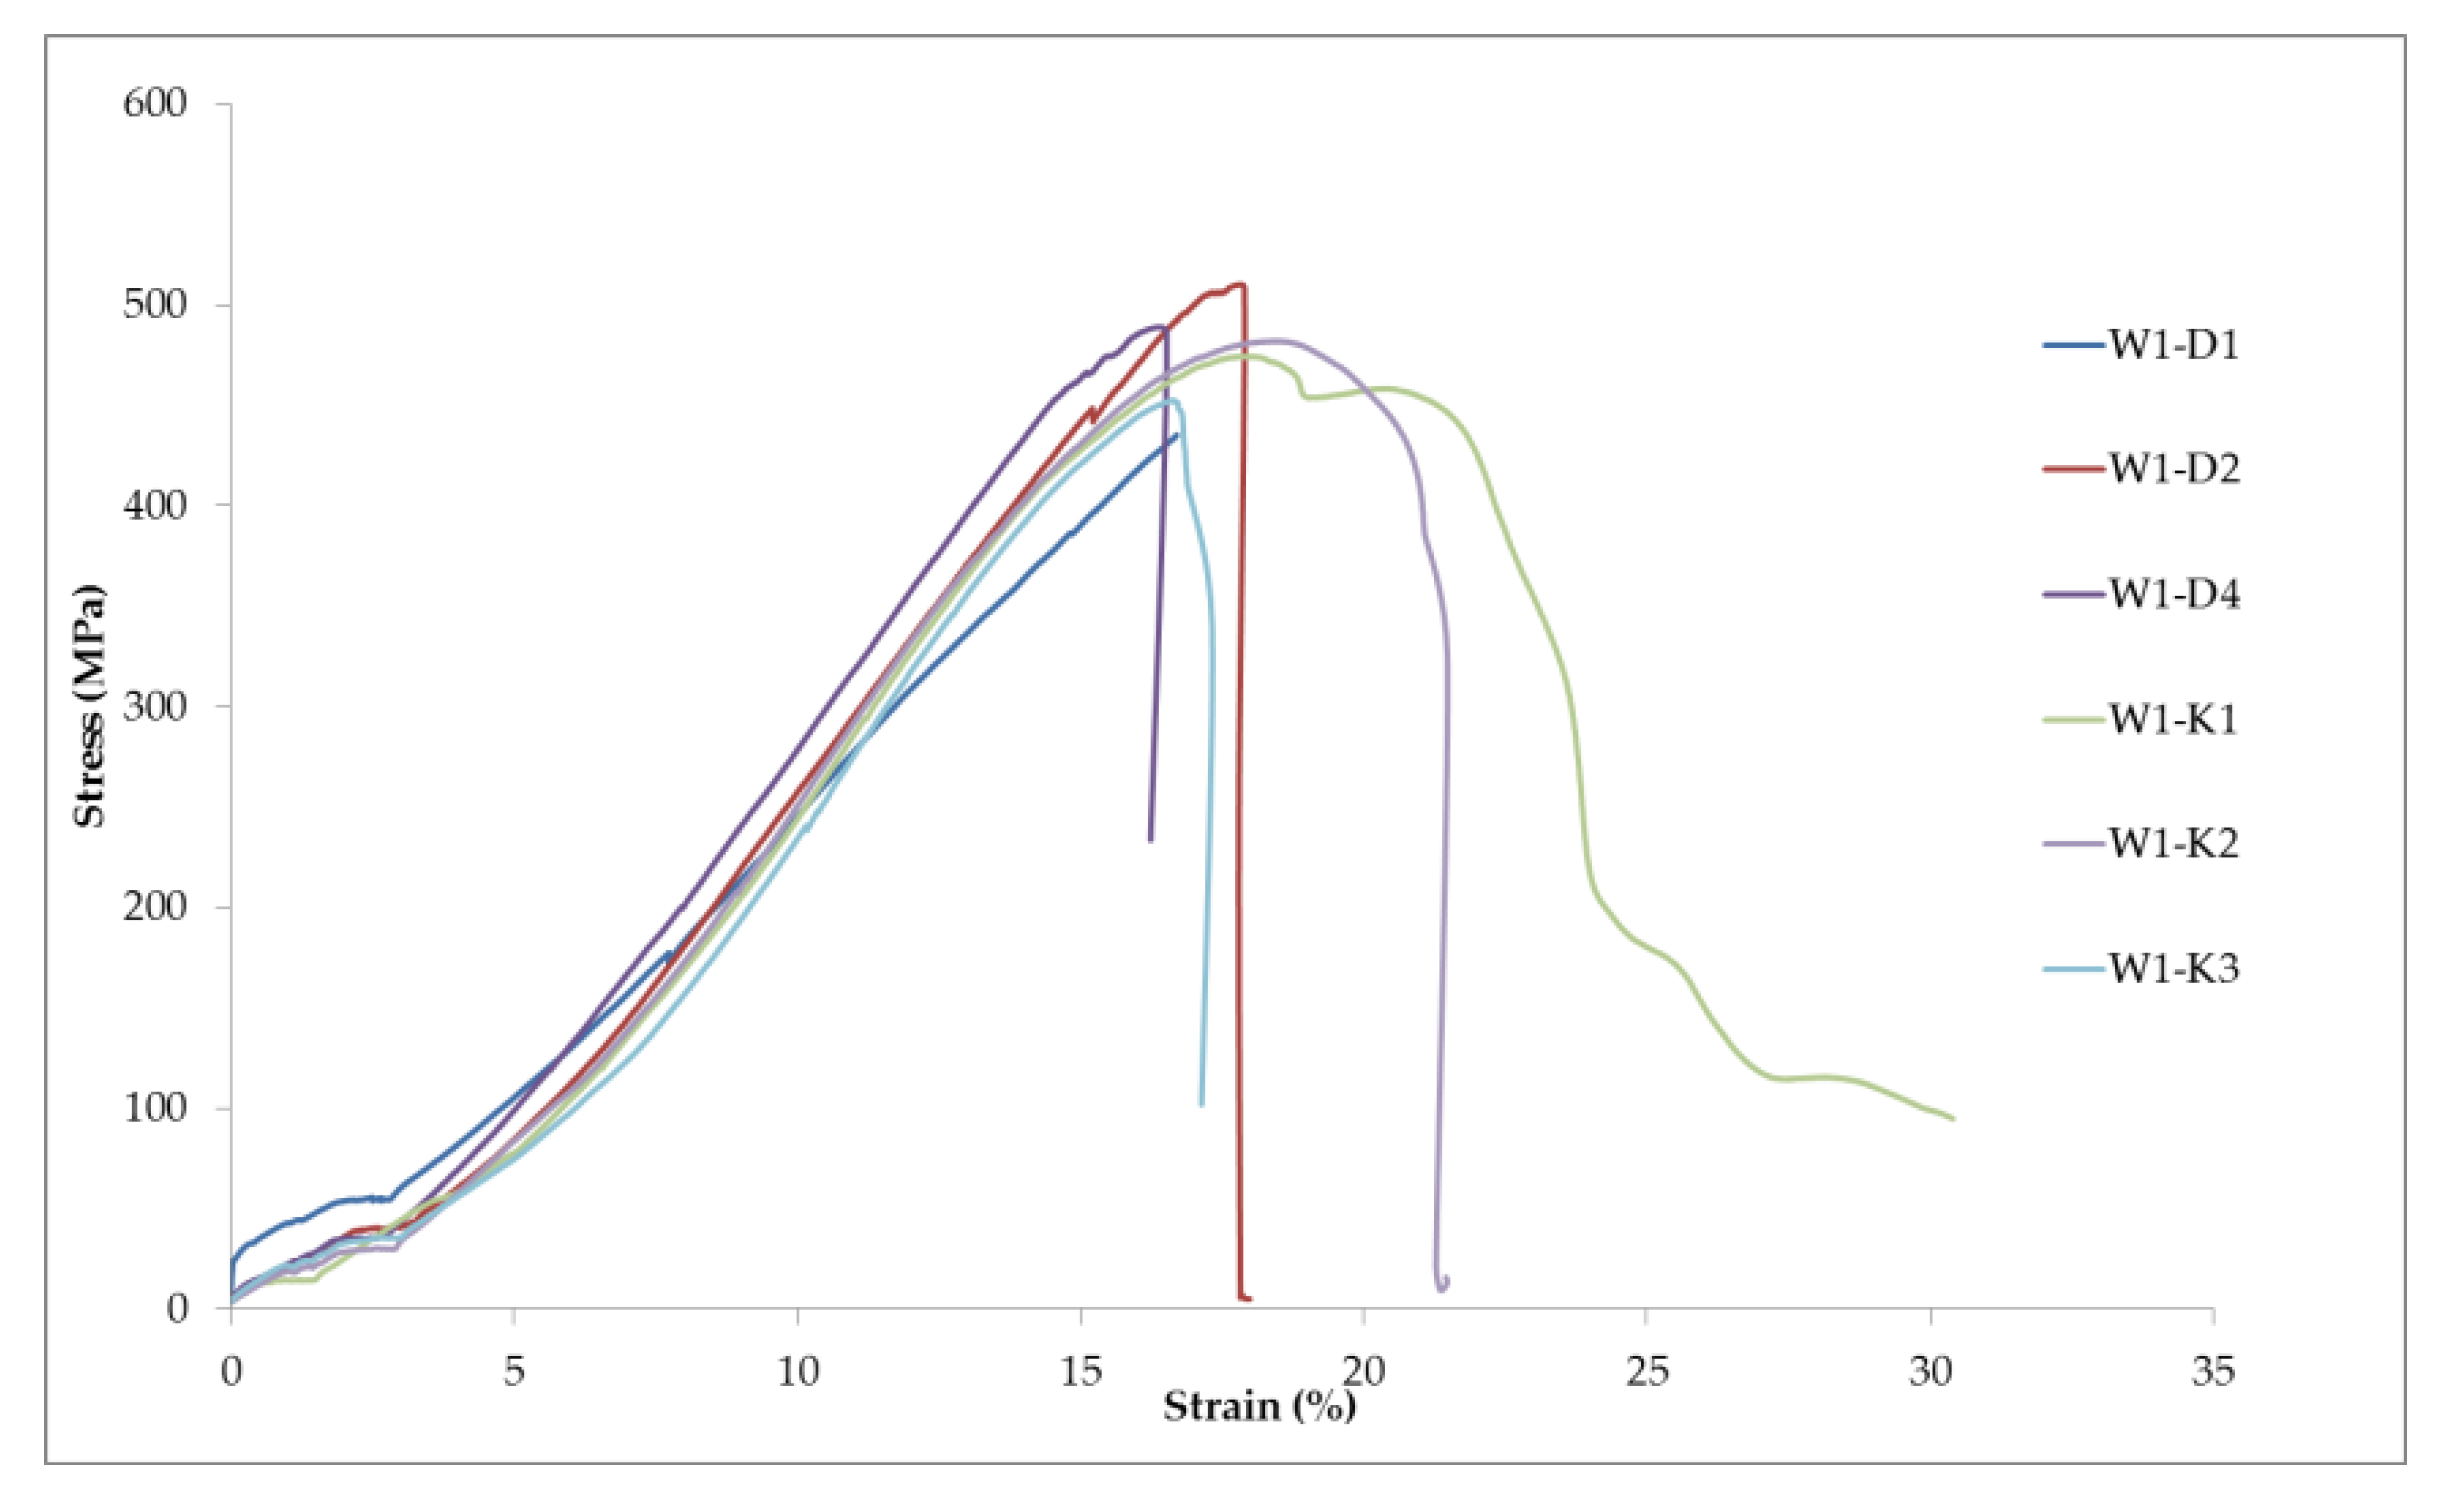
- In Figure 6, the stress–strain curves of the W1-K and W1-D specimens were basically identical before failure. It indicated that the load carried by the three-layer spar cap specimen repaired using a double stepped-lap scarf joint was basically consistent with the blade strength status of running for several years. The stress–strain curve of the W1-K specimen had an obvious nonlinear unloading section after failure, which was related to different degrees of stiffness attenuation after the specimen had been running for a certain number of years. It was indicated that there would be a serious performance degradation of the structural material after several years of operation.
3.2.3. Influence Analysis of the Reinforcement Layer
- The load loss rate of the one stepped-lap joint surface specimen was the biggest (34%). The load per width of the stepped-lap scarf joint repaired specimen could be effectively increased by adding a reinforcement layer. For example, the failure load of the W2-C specimens with the addition of two reinforcement layers was more than 4 times higher than that of the single stepped-lap W1-G specimens, and the load per width of the specimens increased from 0.56 to 1.20 kN/mm.
- By comparing the results of the reinforcement layer of one to three stepped-lap joint surfaces for single stepped-lap and double stepped-lap, it was determined that an N stepped-lap joint surfaces can be reinforced by N reinforcement layers, which could increase the failure load by 65% to 95% of the original value.
3.2.4. Failure Position and Failure Mode
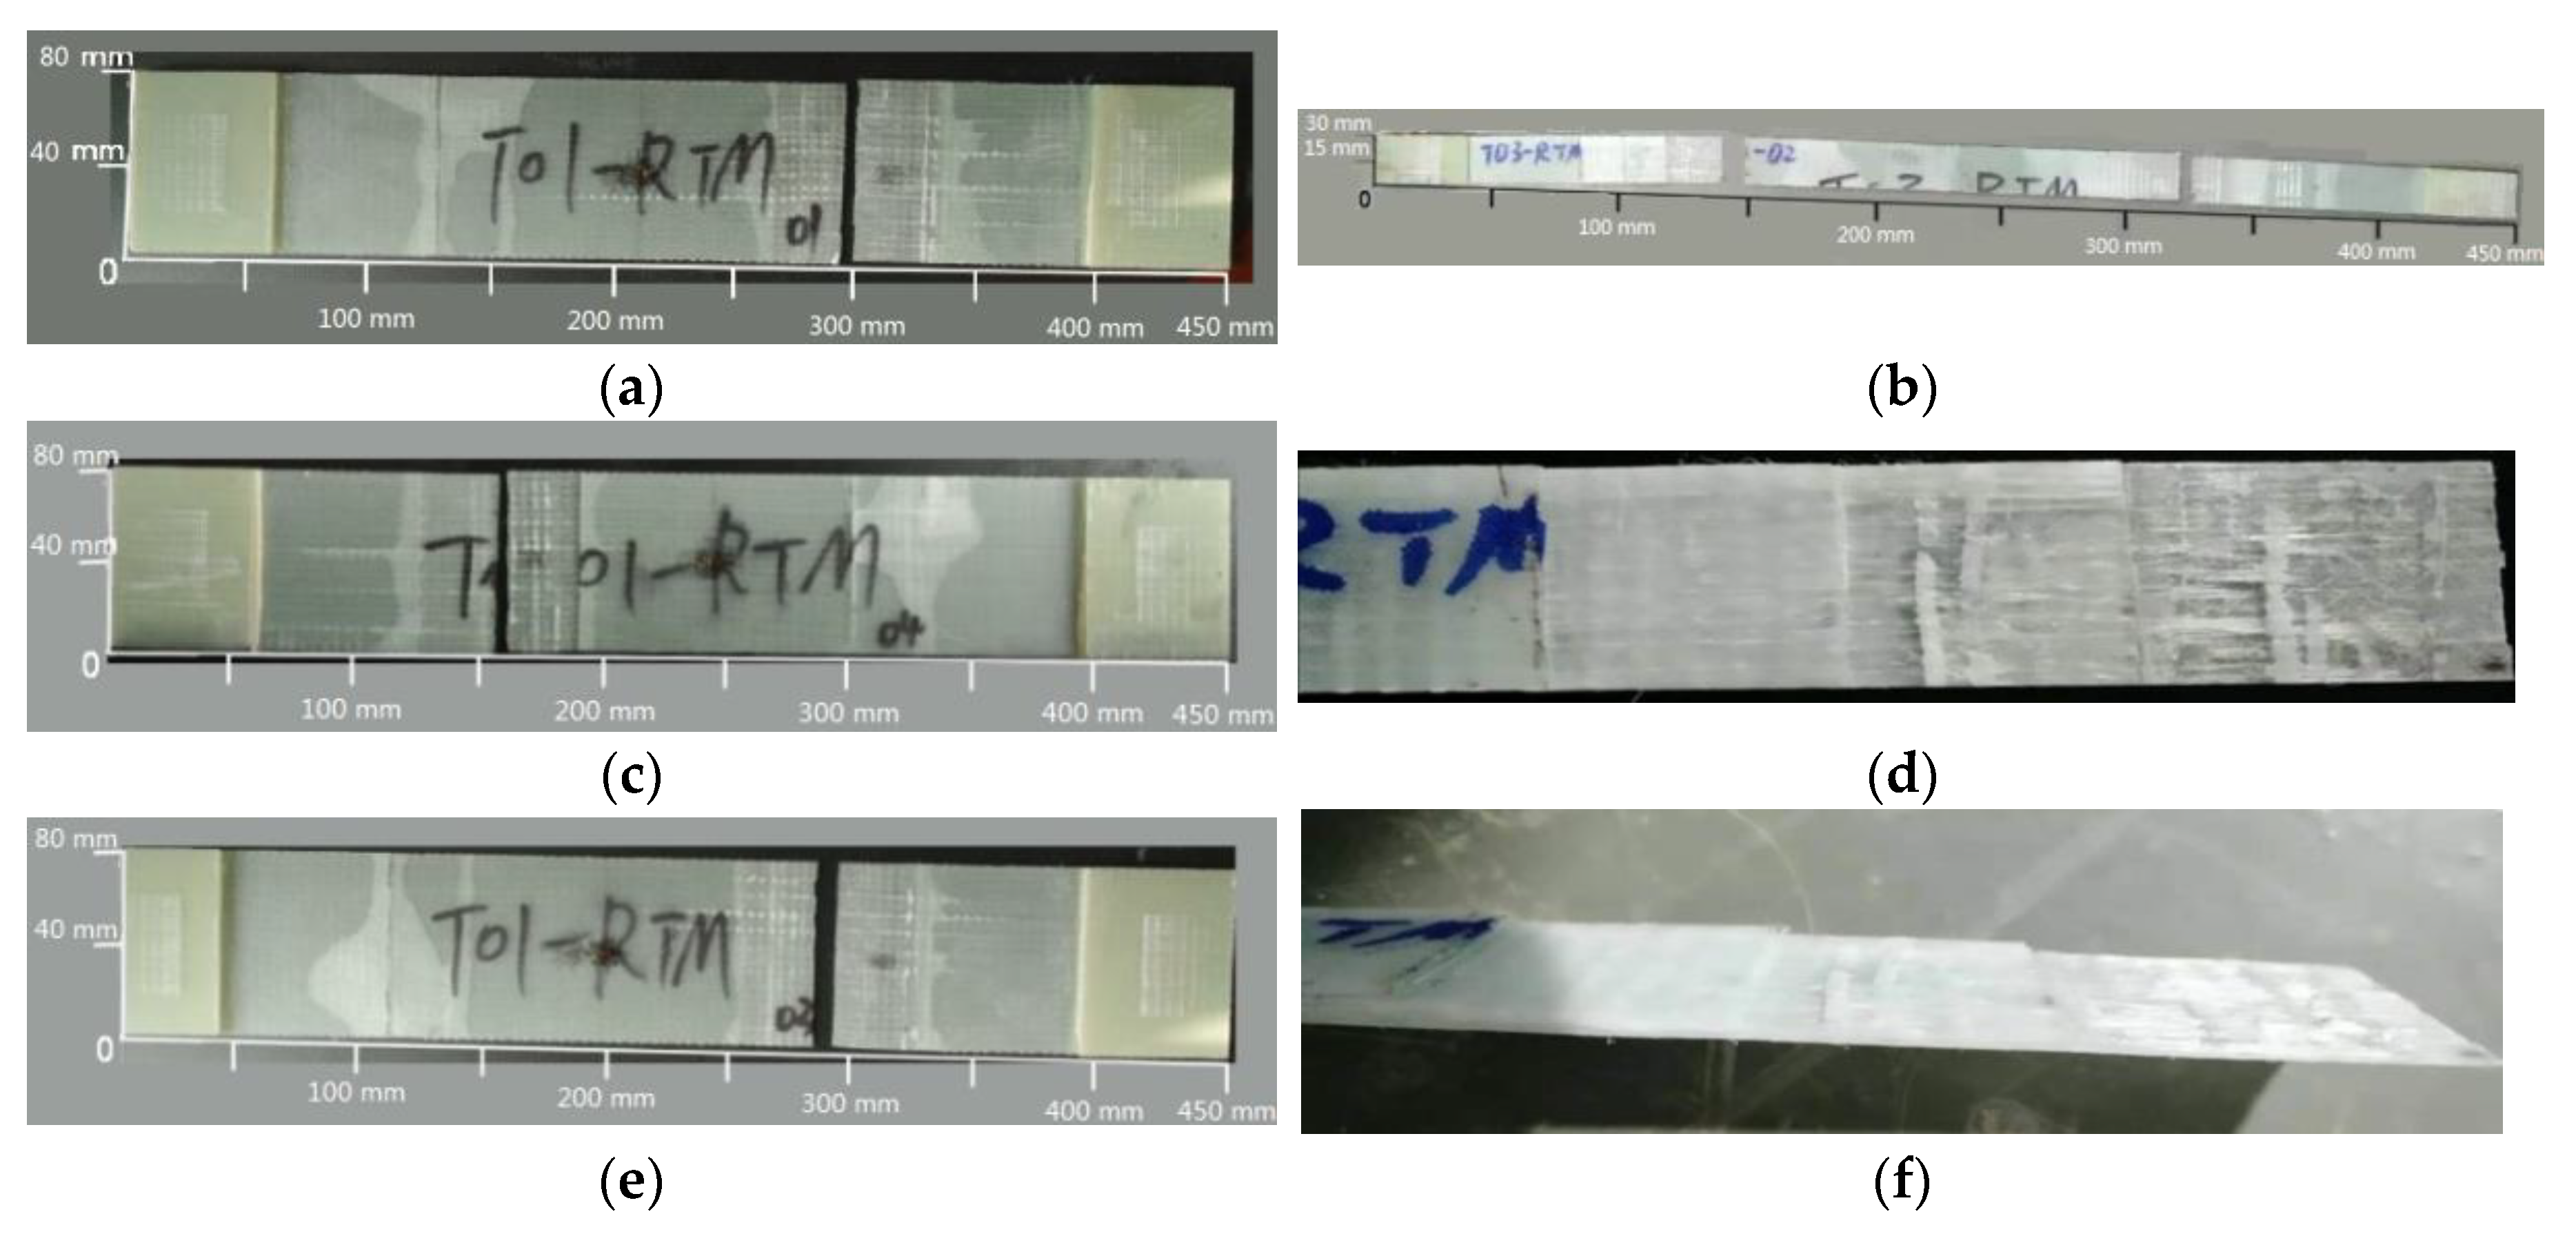
- The failure specimens for the tensile test of the one stepped-lap joint surface and three stepped-lap joint surfaces are shown in Figure 7, where all specimens failed on the stepped-lap joint surface. The initial failure mode of the stepped-lap joint surface appeared as delamination. The final failure of the specimens was characterized by the coupling mode of the shear failure of the adhesive layer and the fiber fracture on the stepped-lap joint surface.
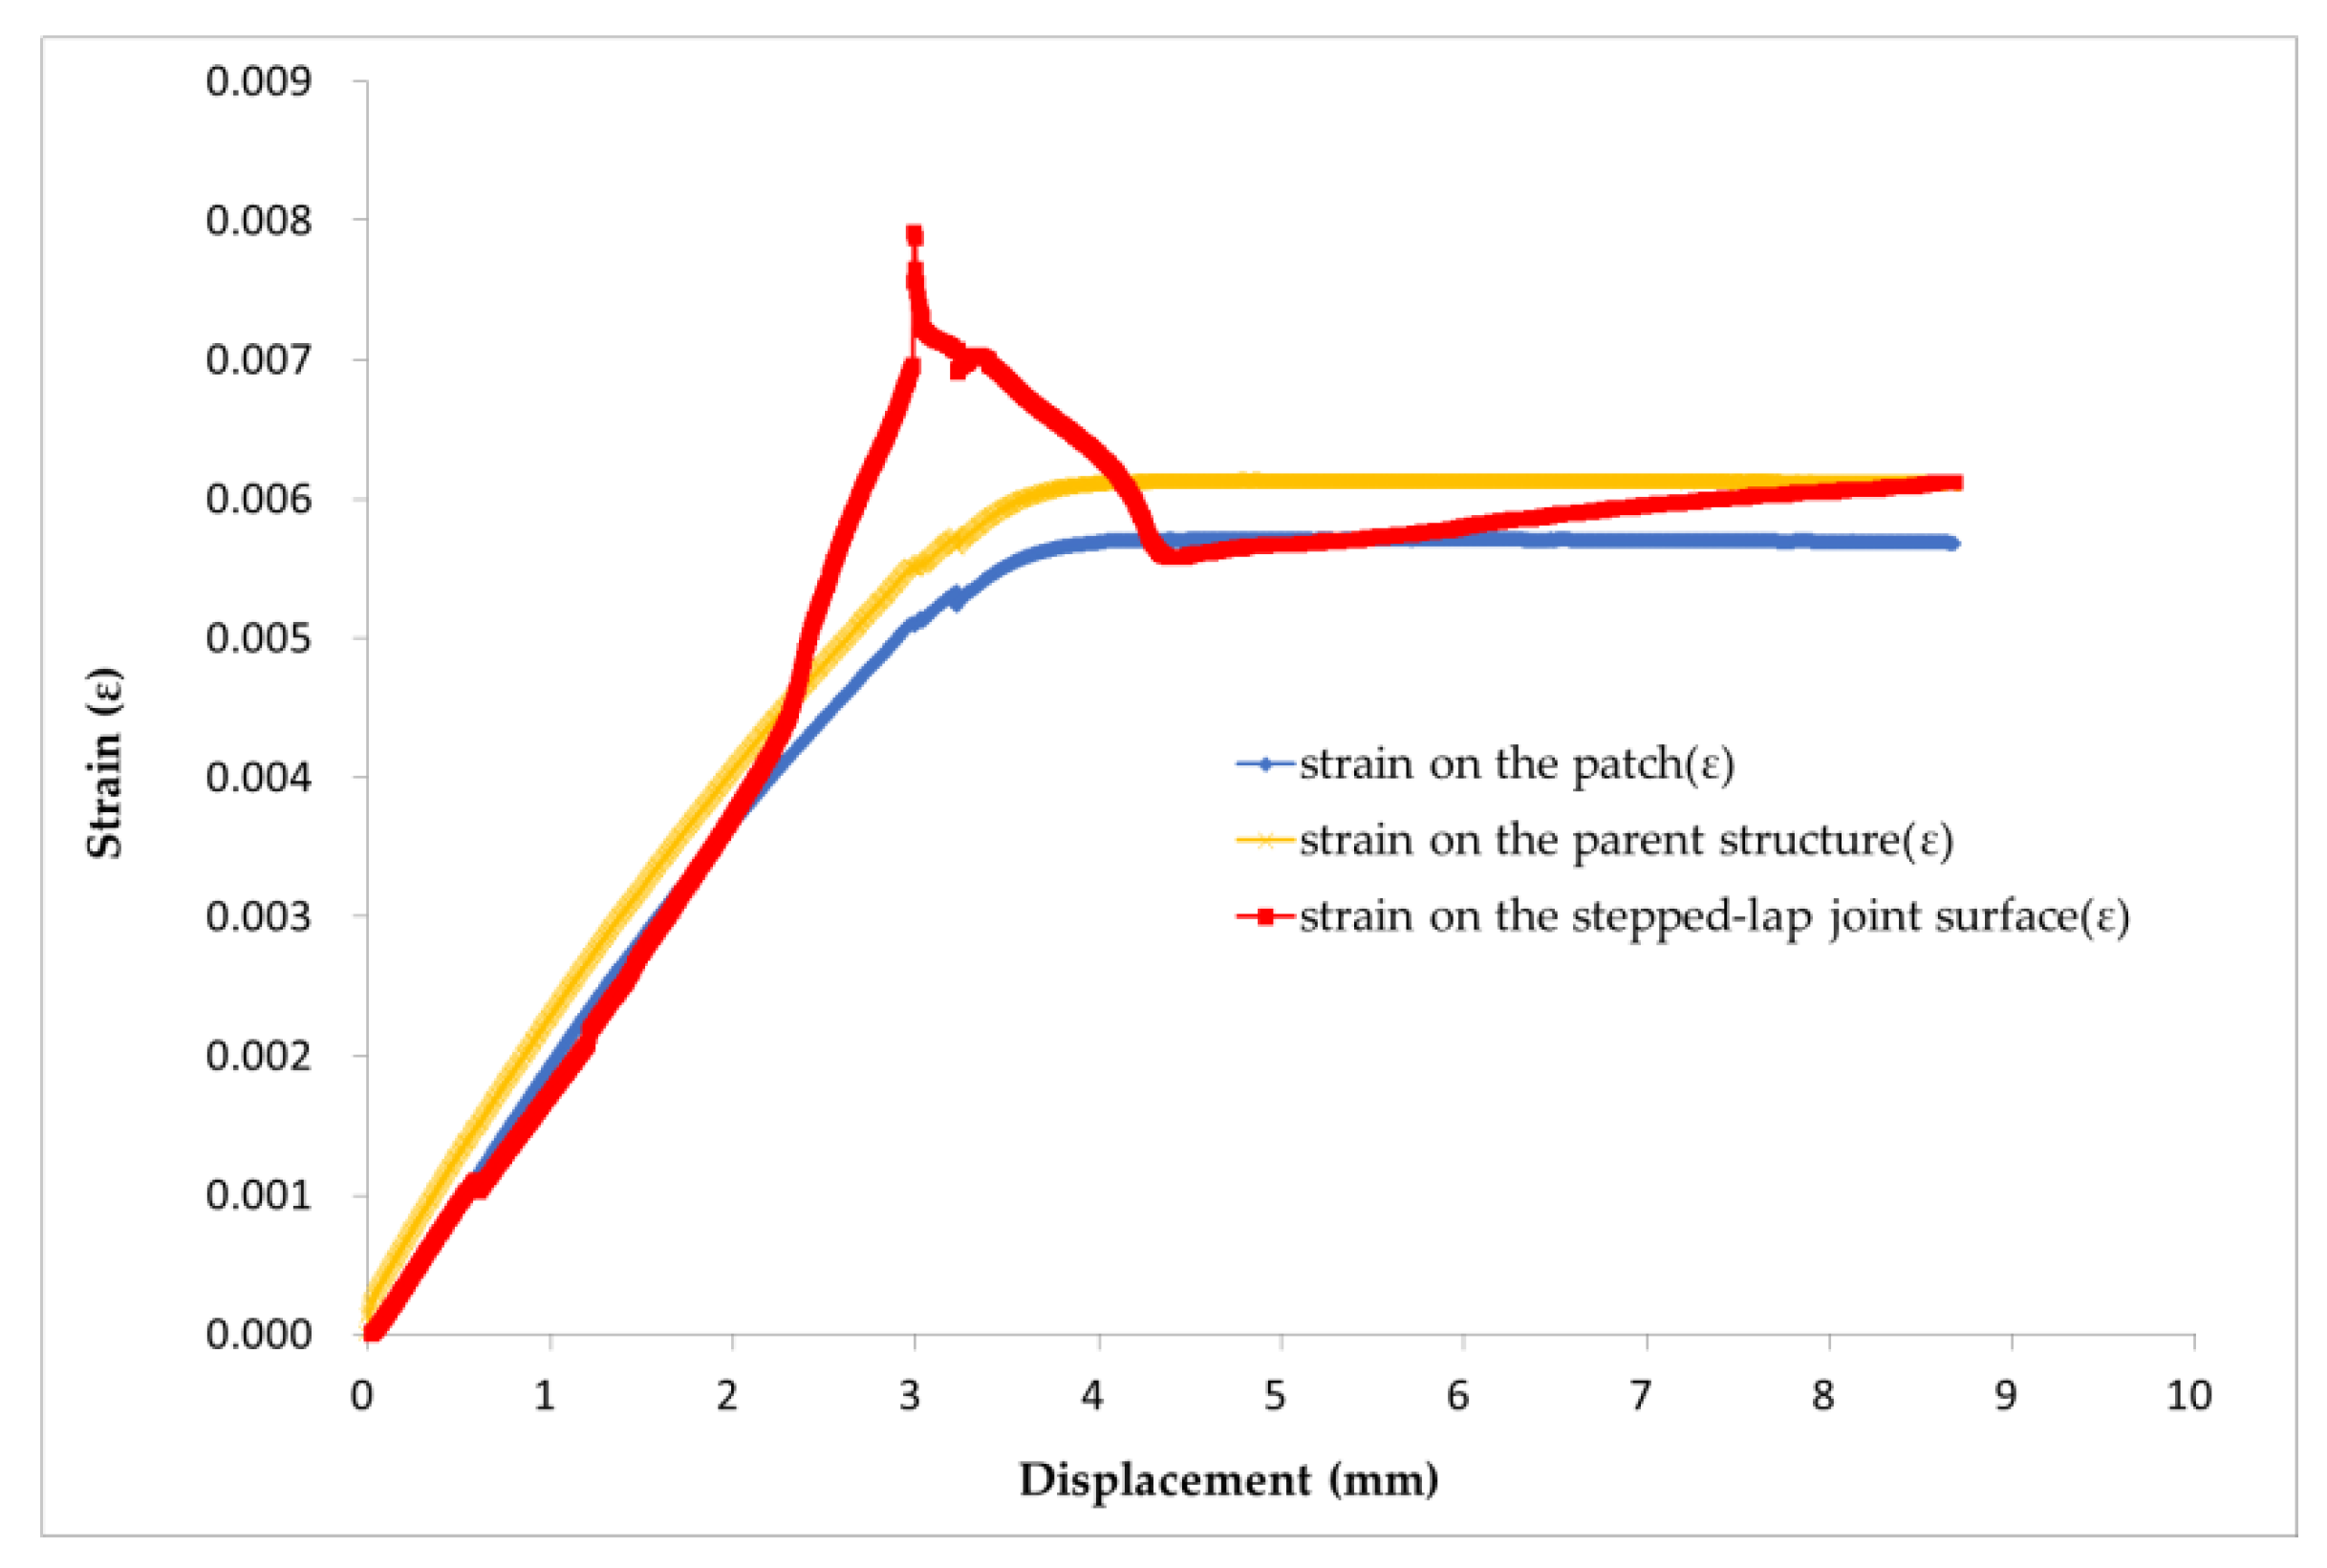
- In Figure 8, the strain of the stepped-lap joint surface increased rapidly in the rising section, then fell rapidly, which indicated that a certain damage had occurred there, while no strain agitation occurred in the patch and parent structure. Therefore, the initial damage failure position of the specimen was located at the stepped-lap joint surface.
4. The Research on the Quasi-Static and Fatigue Test of the Stepped-Lap Scarf Joint Repaired Monitoring Using Carbon Nanotube Buckypaper Sensors
4.1. Test Materials
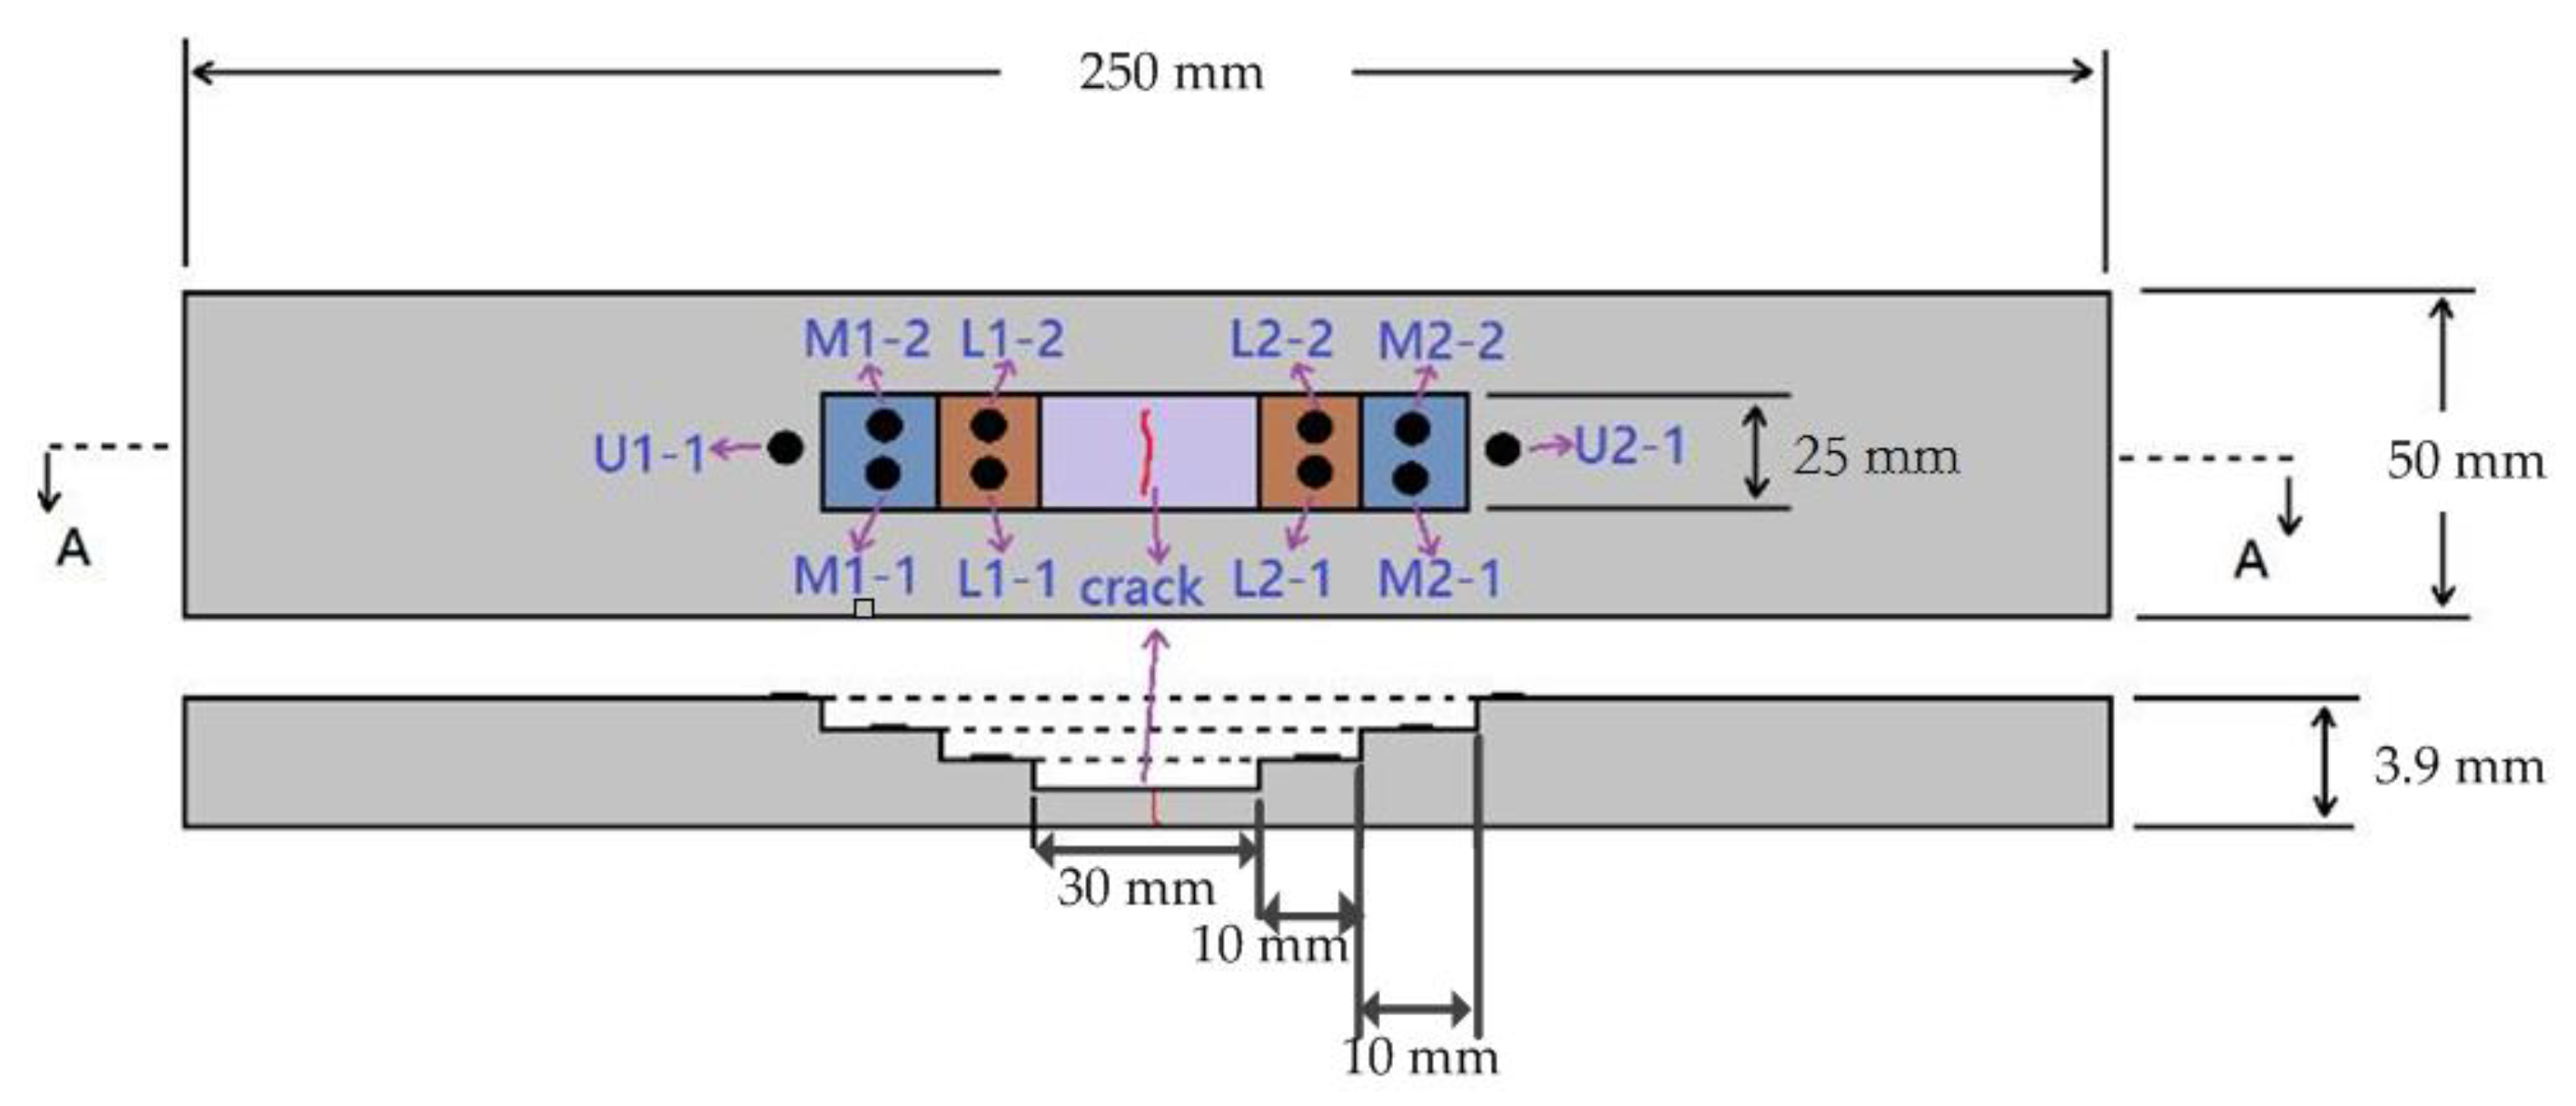
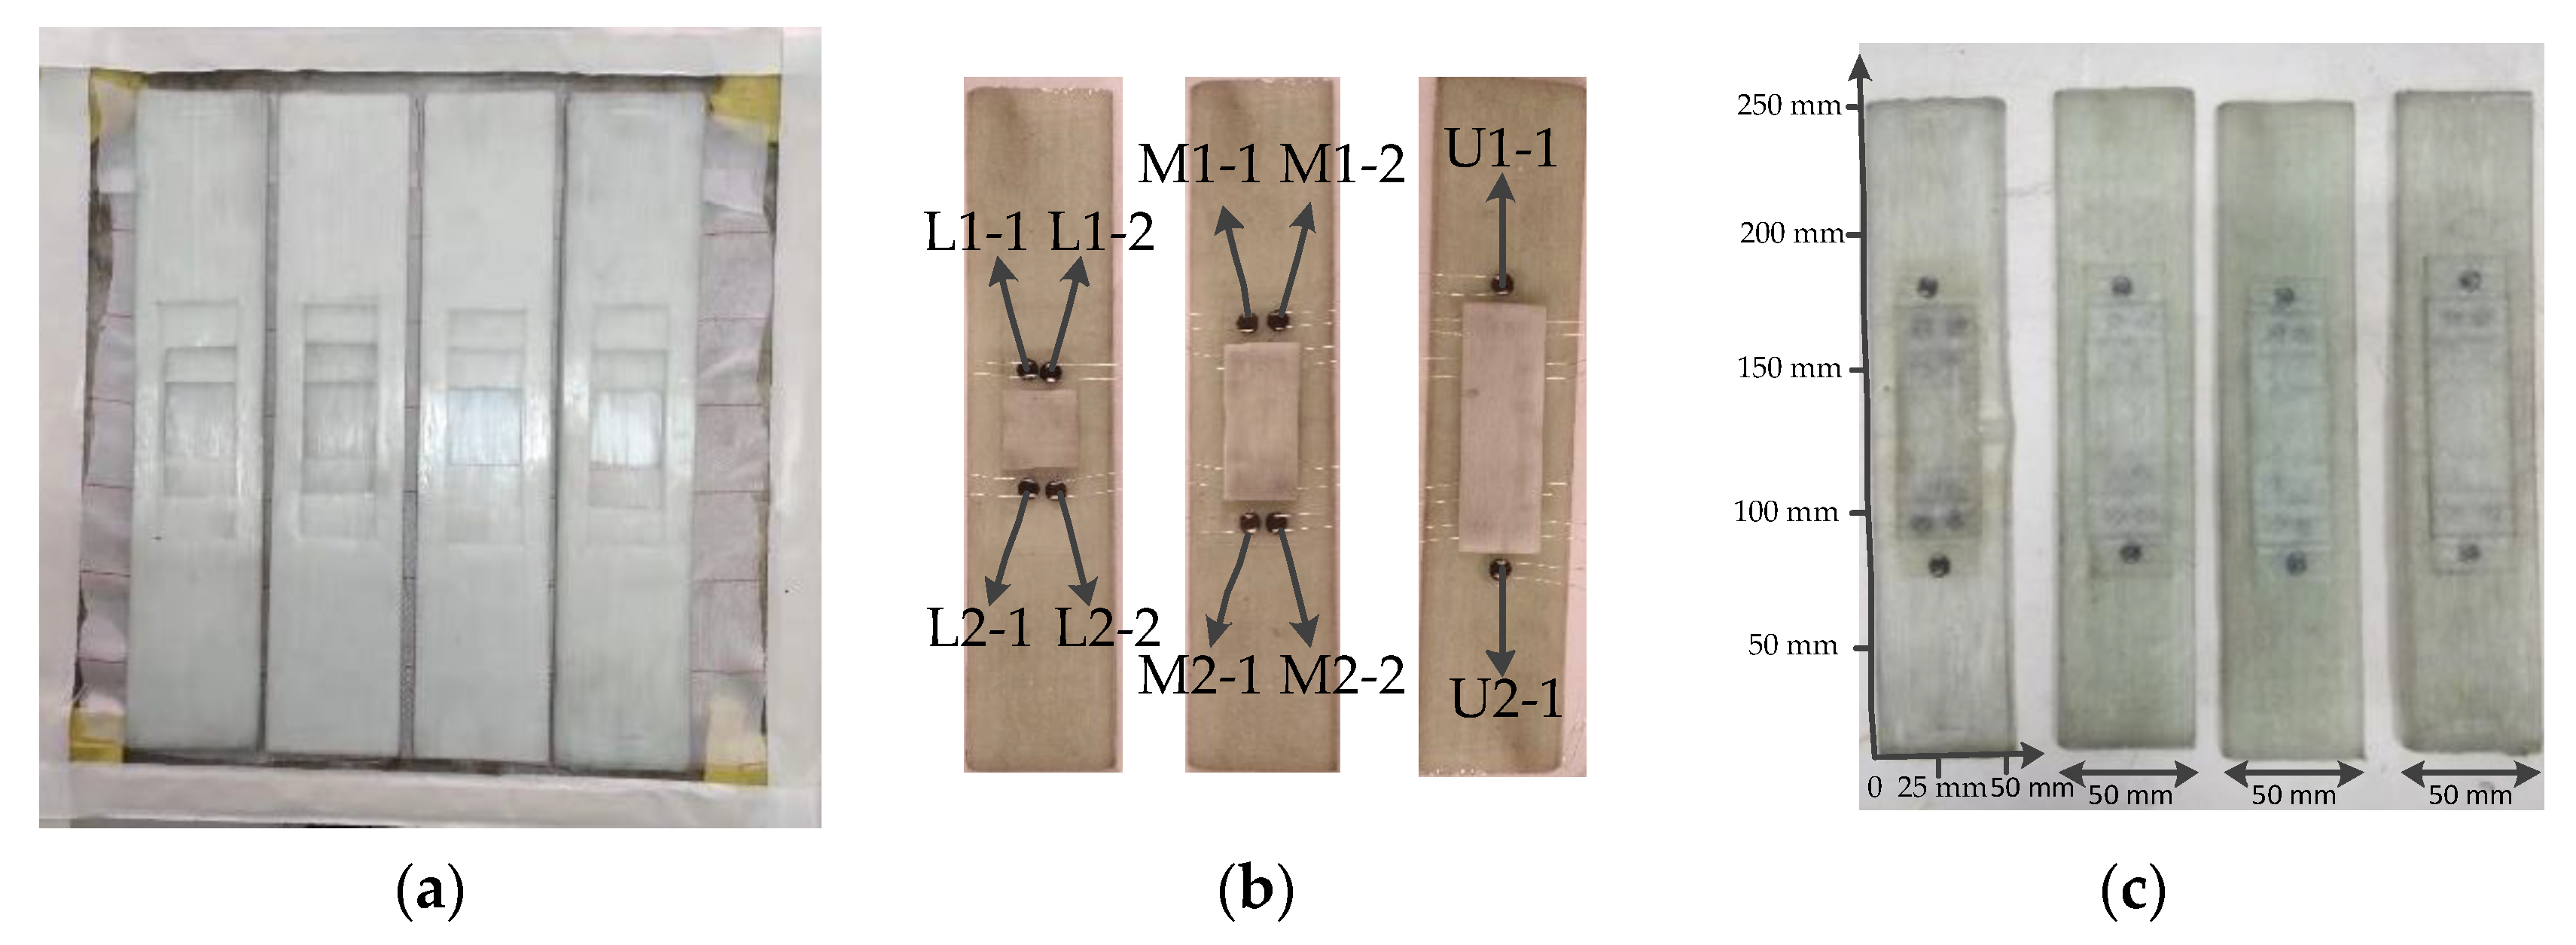
4.2. Specimen Design and Preparation
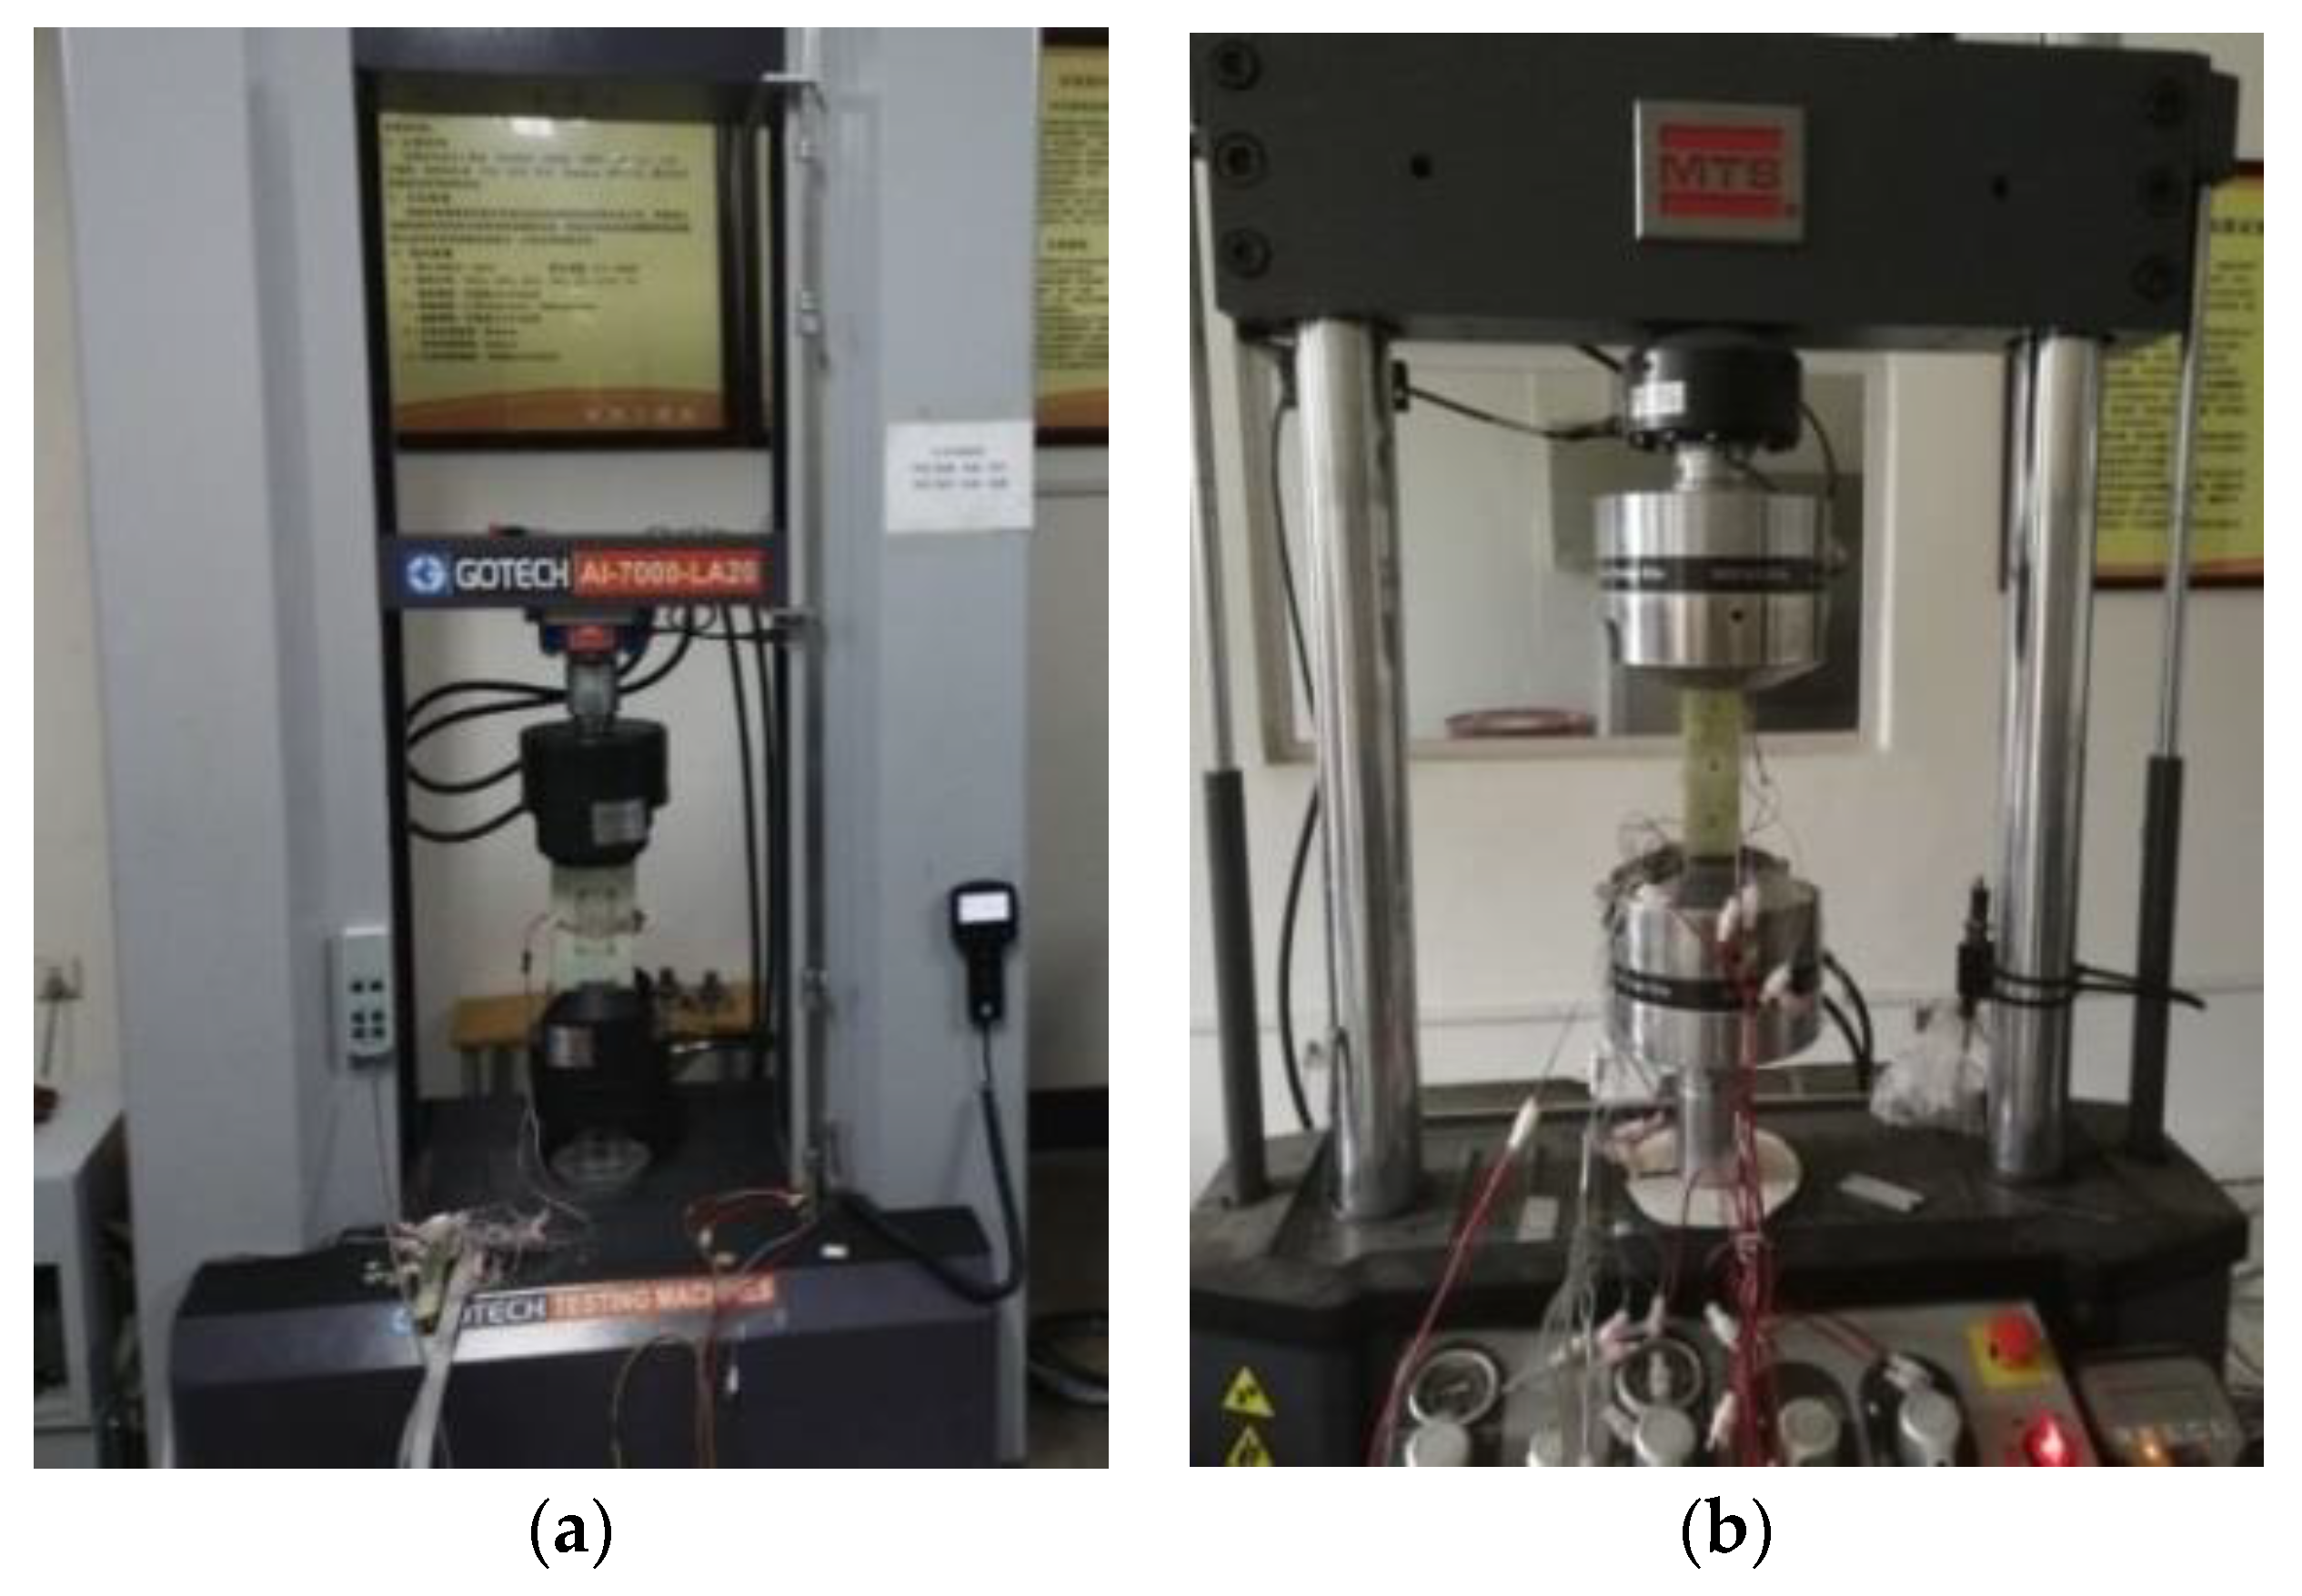
4.3. Load Test Design
4.4. Results and Discussion
4.4.1. Failure Process Analysis of the Quasi-Static Tensile Test
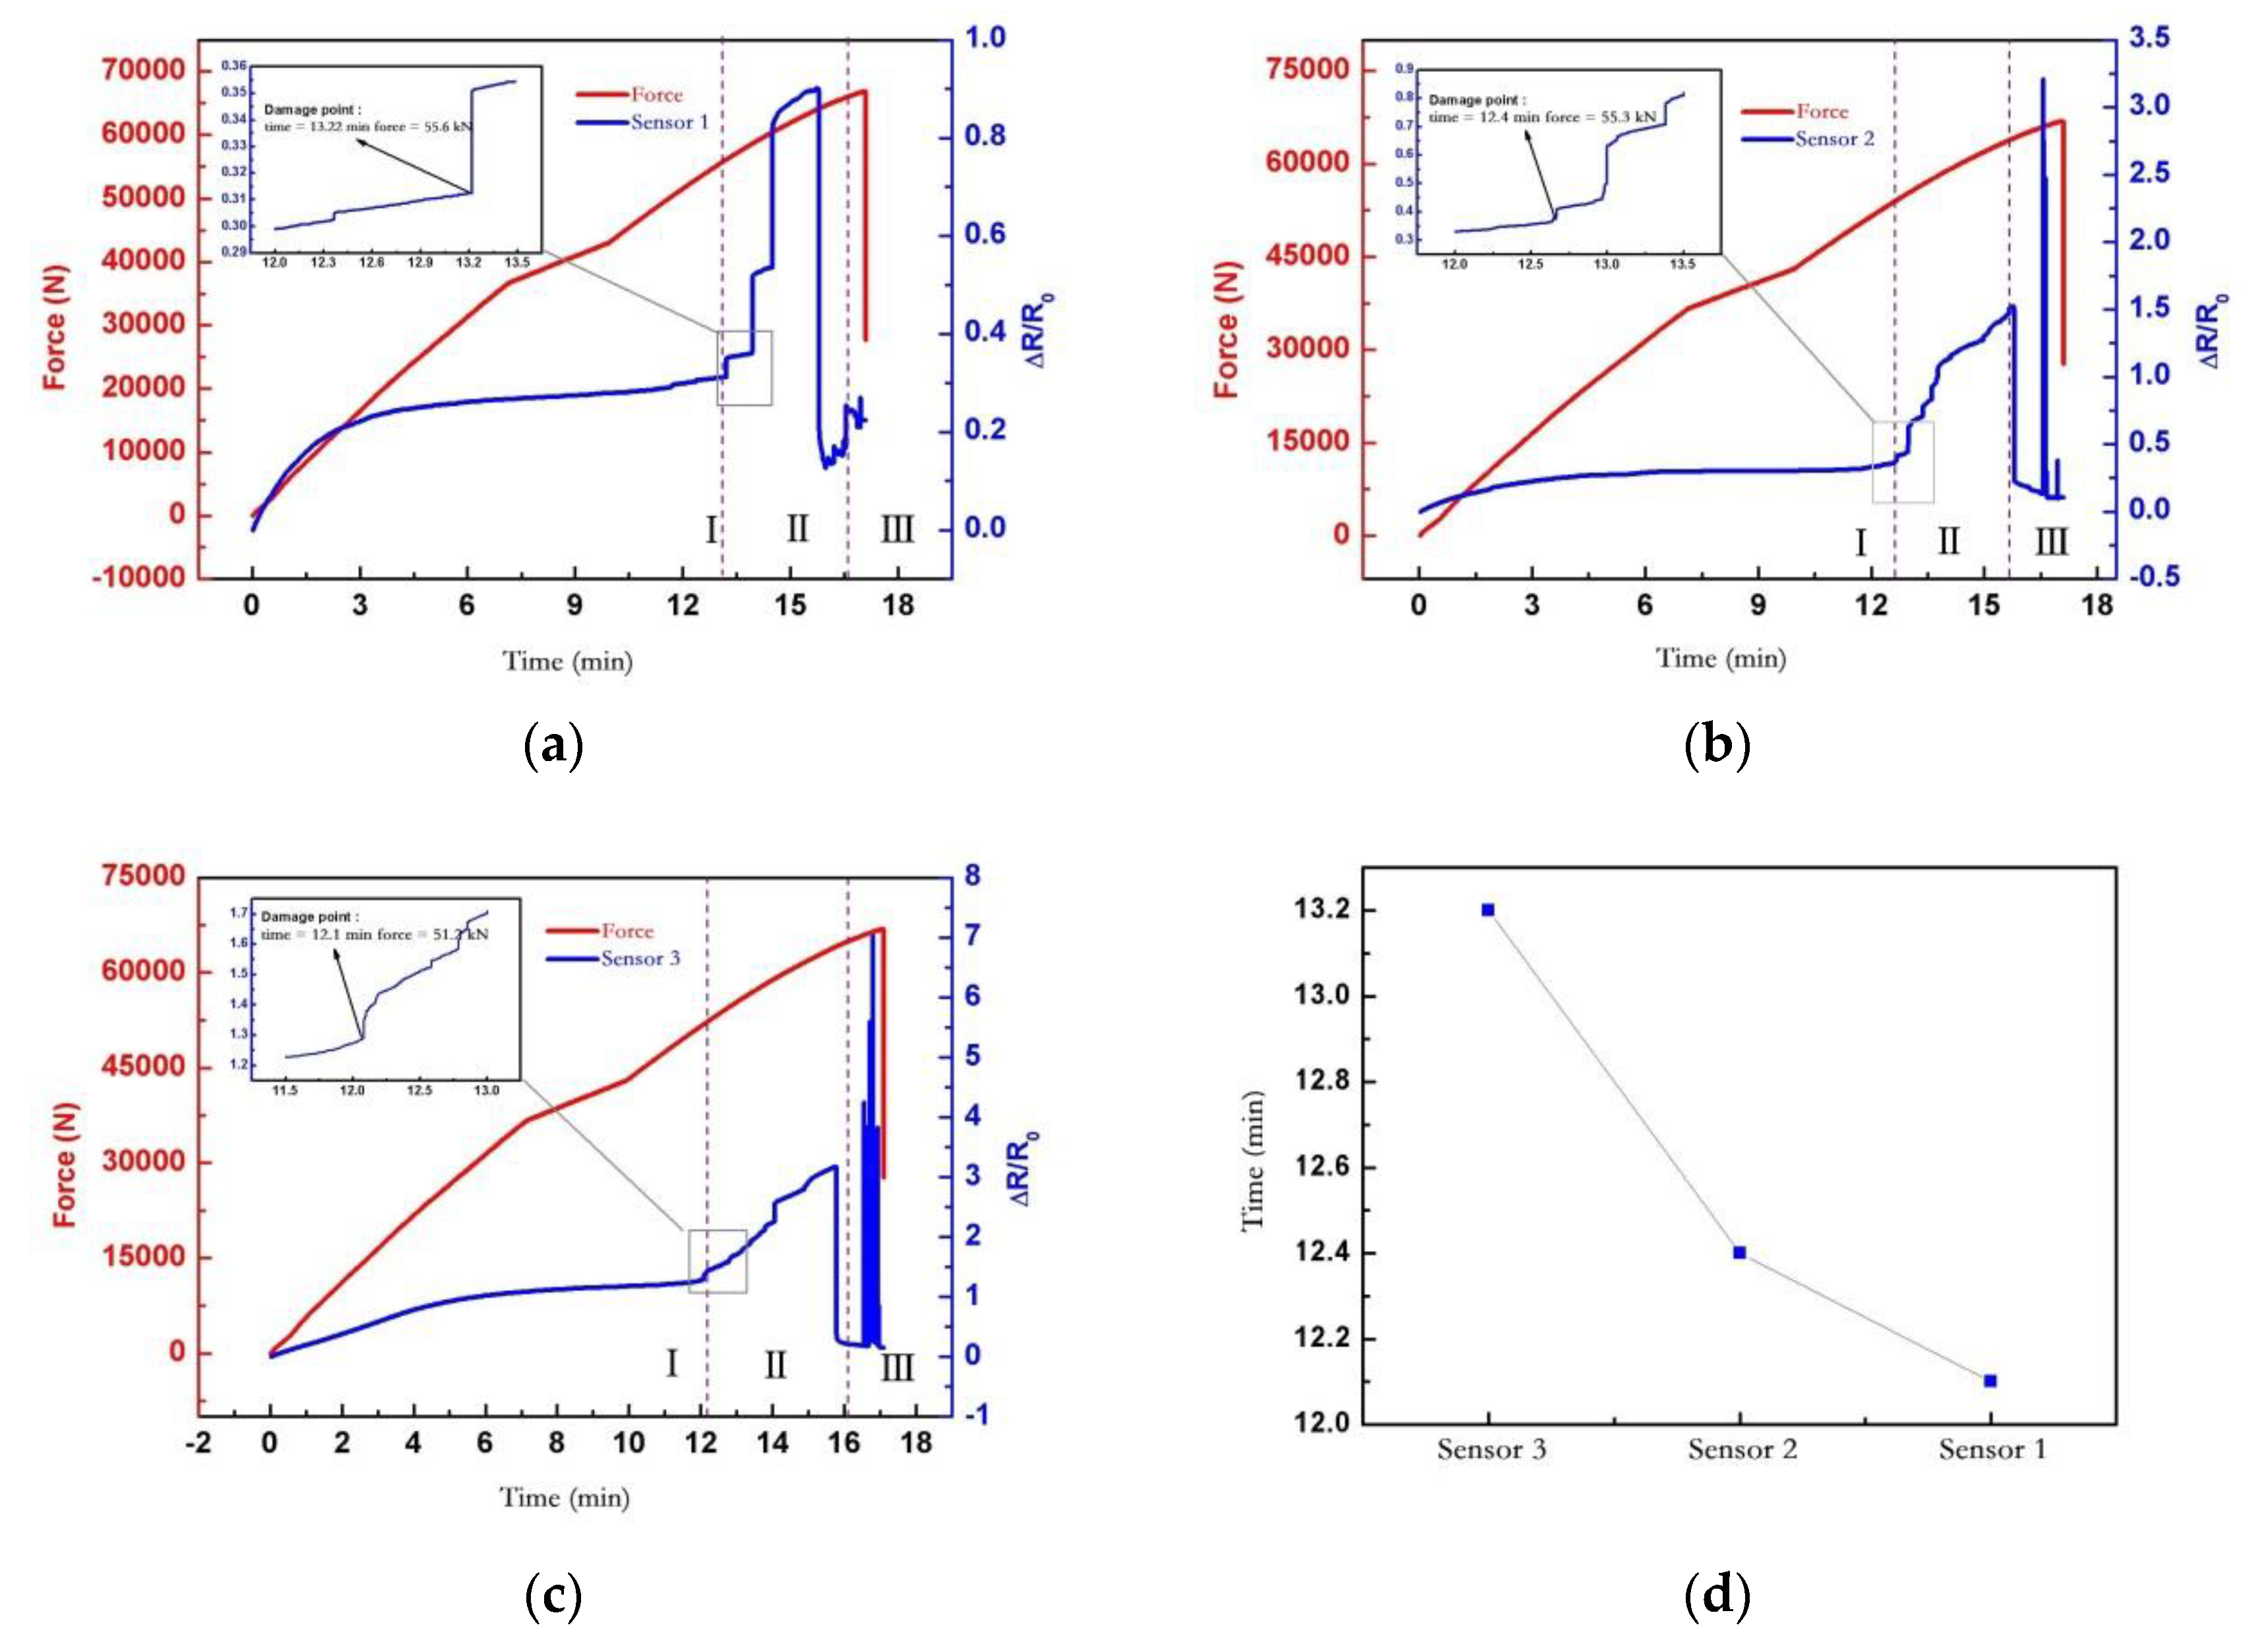
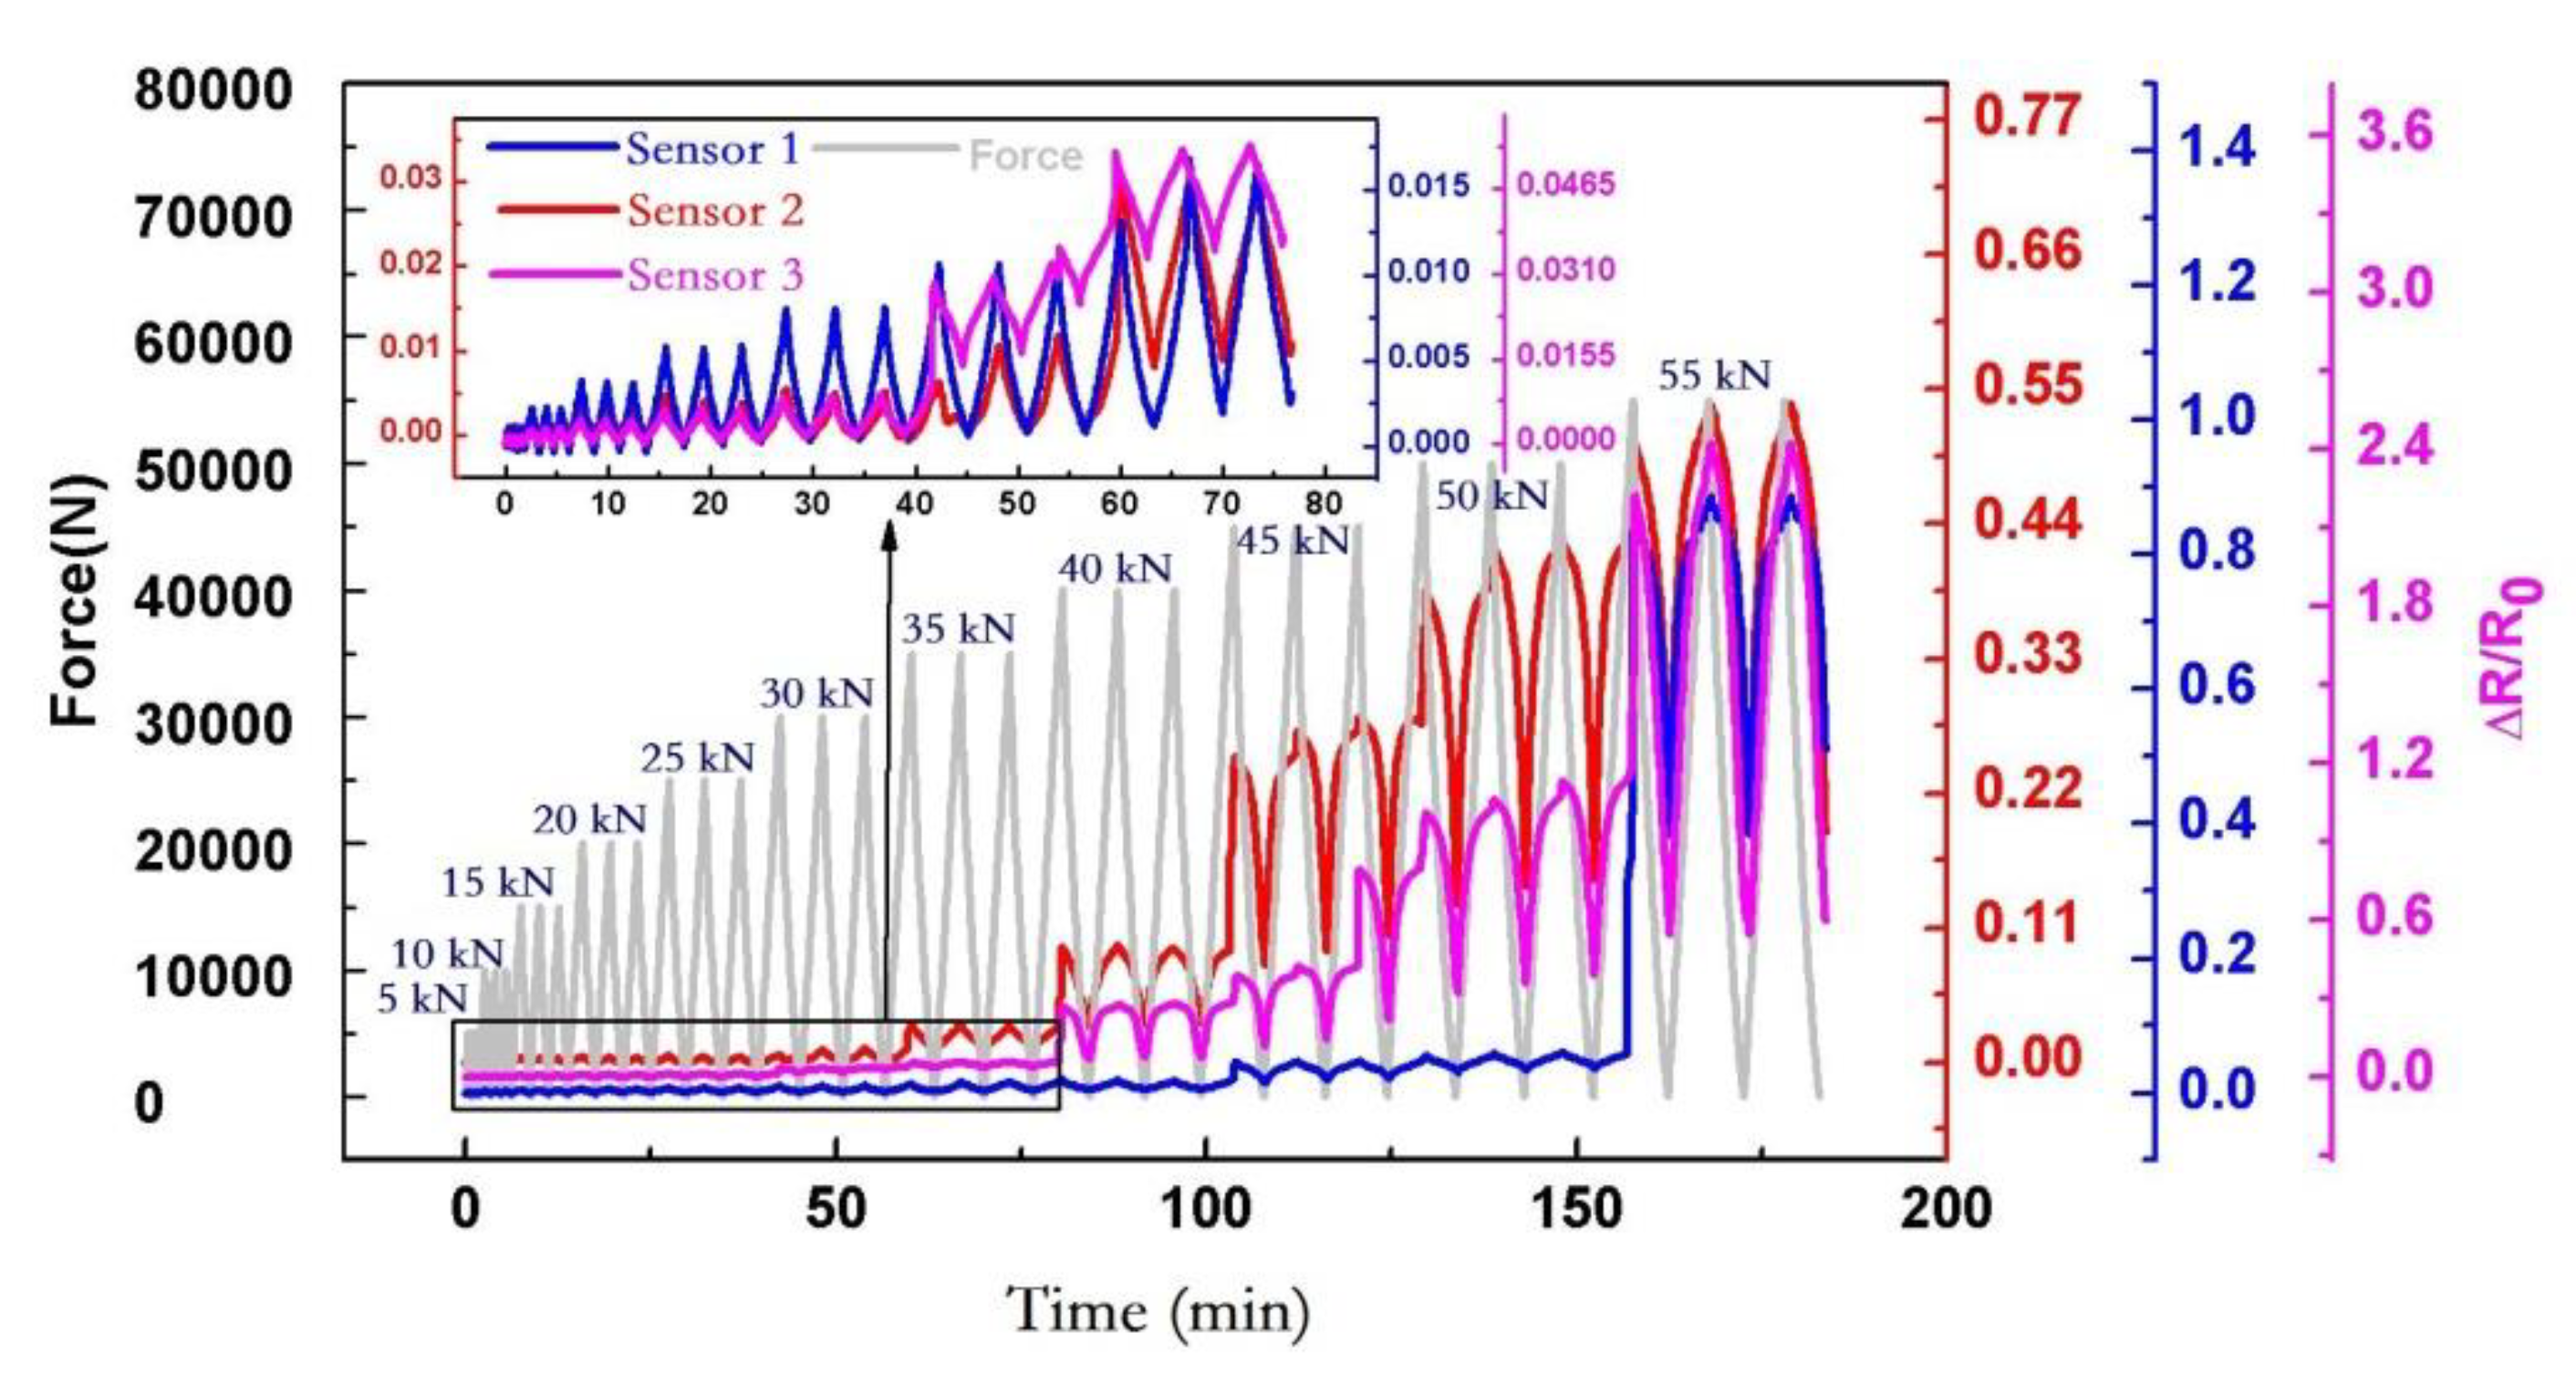
- When the displacement load was applied uniformly, the specimen was basically in a linear elastic state. When the applied load was about 38 kN, turning point A of the stiffness of the specimen appeared. Before point A, the response of the sensor changed with the elasticity. After point A, the resistance change of the sensor tended to be flat.
- When the applied load reached about 55 kN, the sensor resistance surged at point B, which was the initial derivation stage of the specimen damage; the overall strength of the specimen was not affected yet, and there was almost no damage in the structure of the A–B state segment. When further increasing the load, the sensor resistance increased sharply after point B, and the damage inside the specimen structure began to accumulate.
- As the load increased, the sensor resistance increased dramatically and dropped suddenly, where point C was the sensor resistance’s drop point, the load effect was about 63 kN, and the B–C state segment was the damage evolution inside the structure. When reaching point C, the internal structure of the specimen formed an initial crack, the stress was suddenly released, and the whole structure of the specimen had not reached the failure level. When further increasing the load, after point C, the resistance of the sensor dropped suddenly.
- After a sudden steep drop in the sensor resistance, the resistance response became disordered and the sensor failed. The sensor’s failure preceded the complete failure of the specimen. After the sensor failed, the specimen was completely destroyed when the load only increased by 3 kN. Therefore, the failure of the sensor could be used as an early warning of the complete failure of the specimen. When the applied load reached 66.8 kN, the load suddenly dropped to point D, and the crack of the specimen rapidly propagated to structural failure.
- The damage time of the three sensors on the stepped-lap joint surface differed by about 1 min when the whole specimen was uniformly loaded, which indicated that the model of a stepped-lap scarf joint unidirectional tape had a stable structural response on the stepped-lap joint surface.
4.4.2. Failure Mode Analysis of the Quasi-Static Tensile Test
4.4.3. Analysis of the Tensile-Tensile Fatigue Test
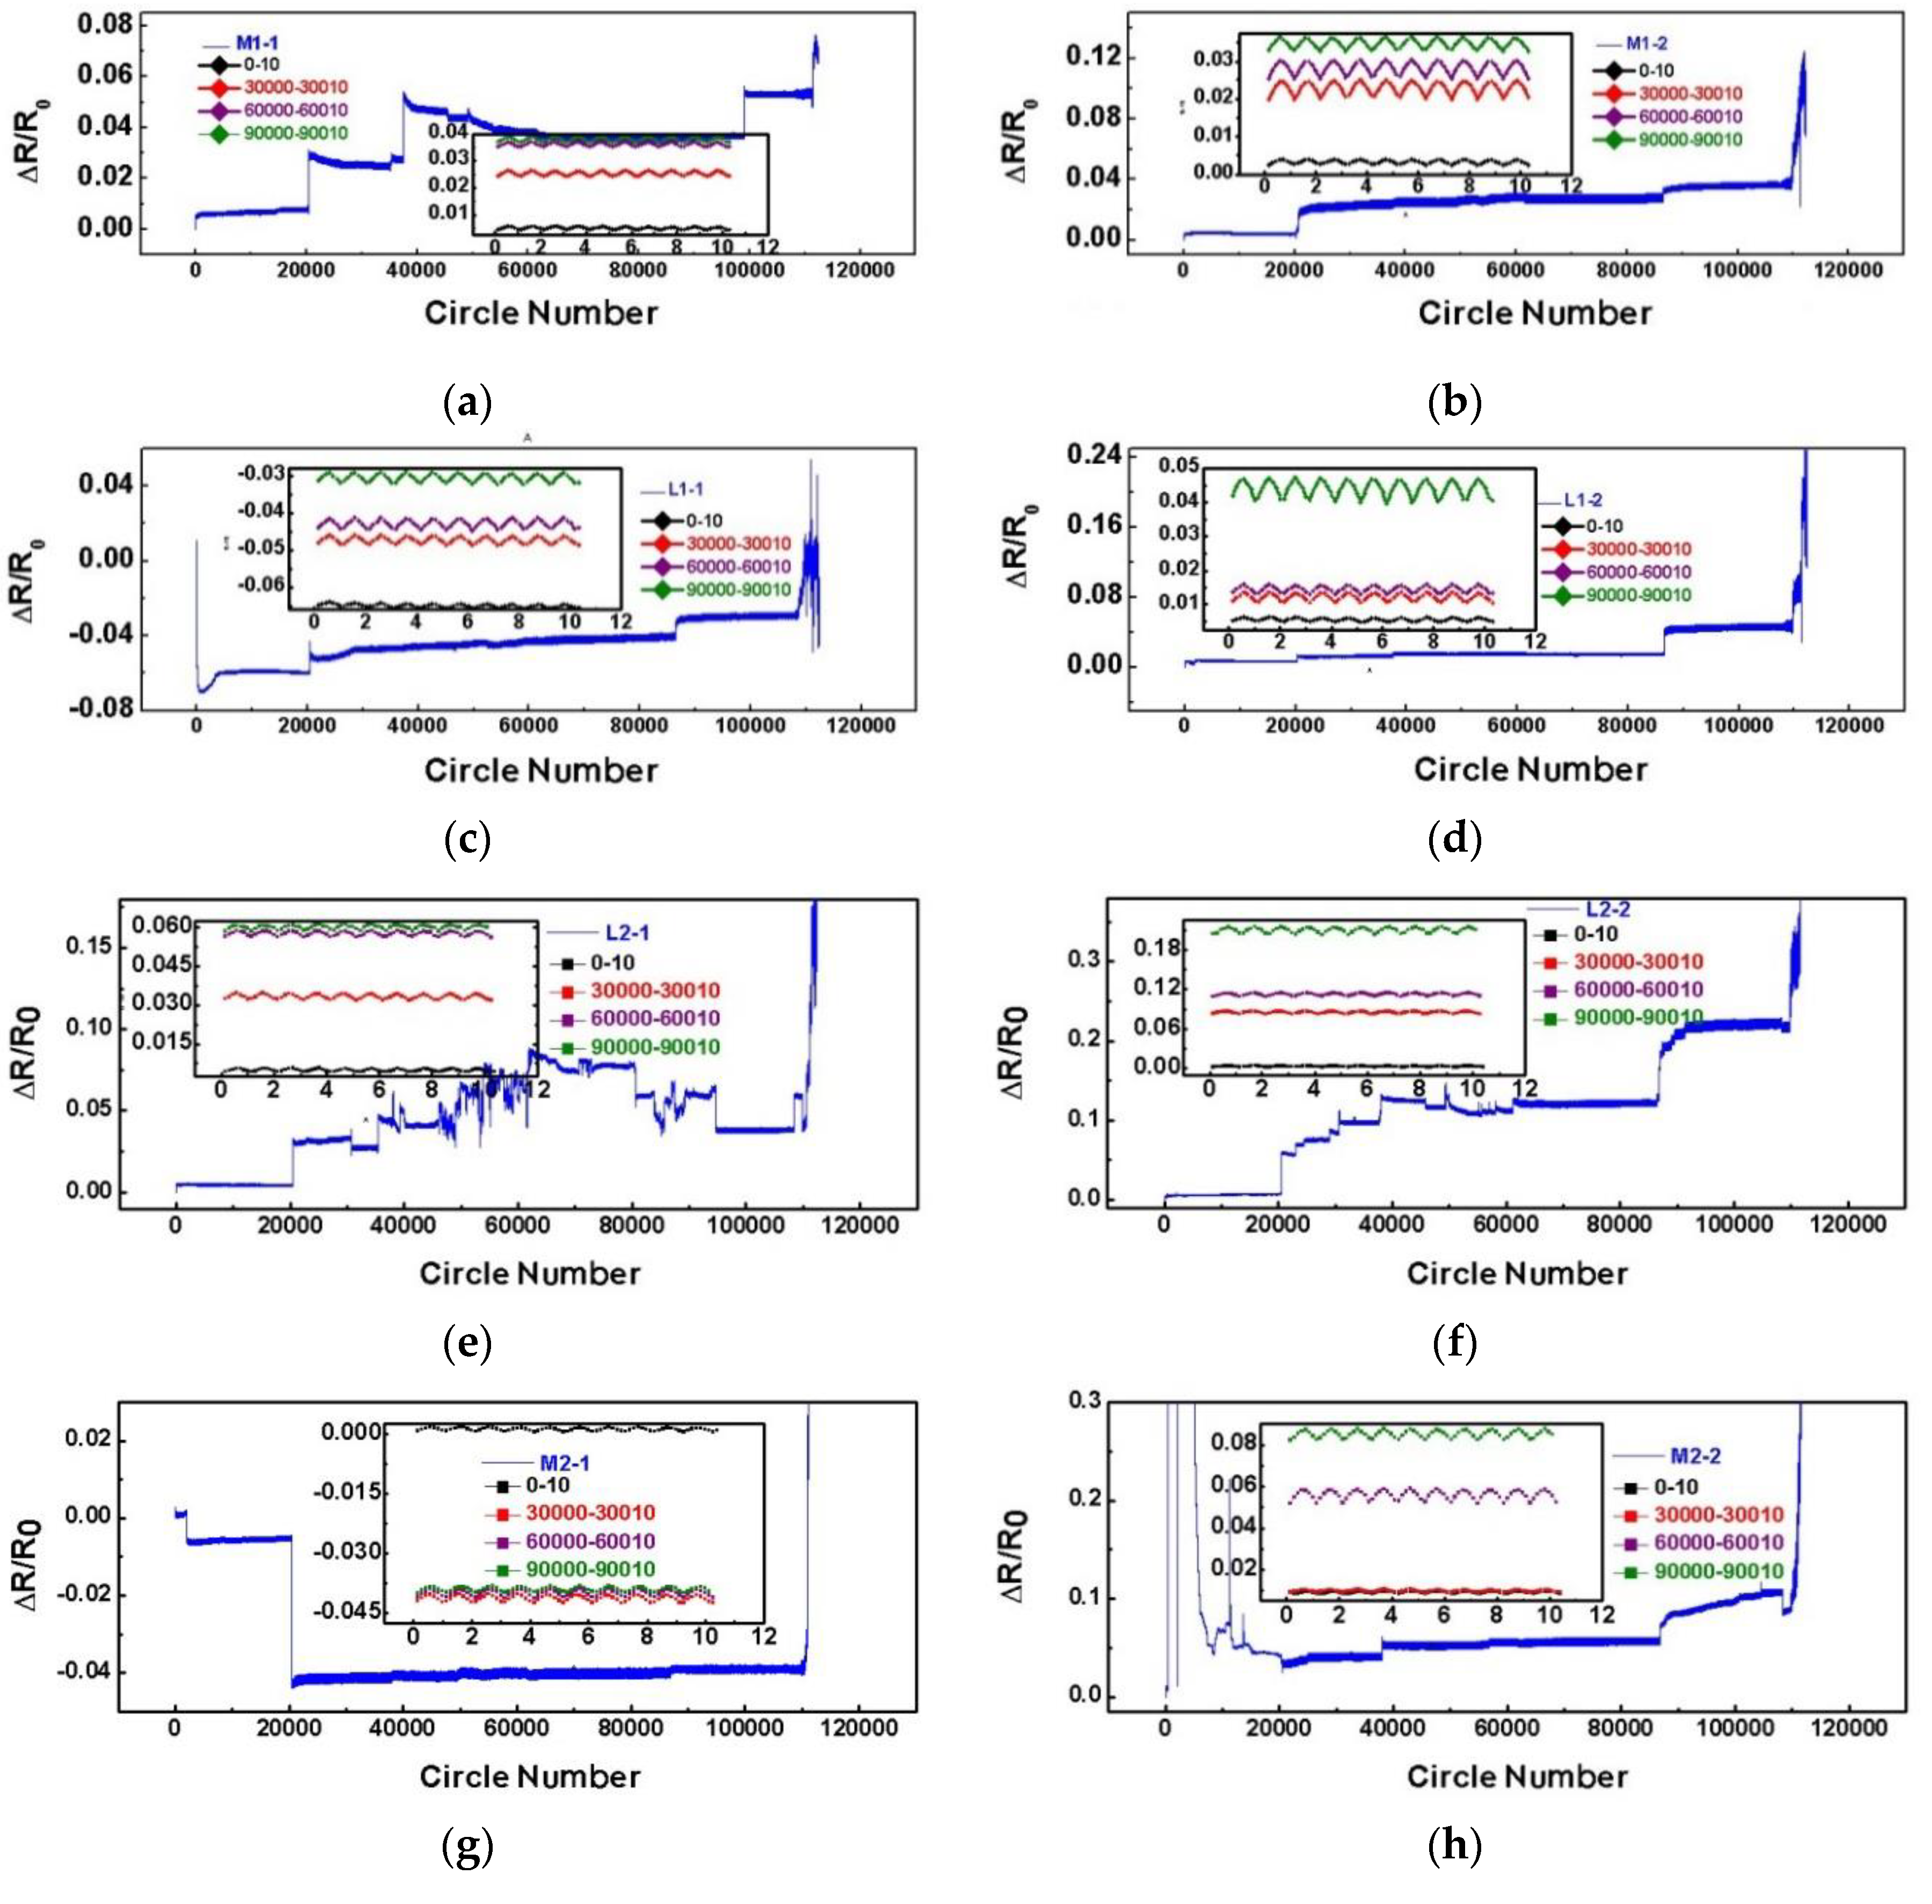
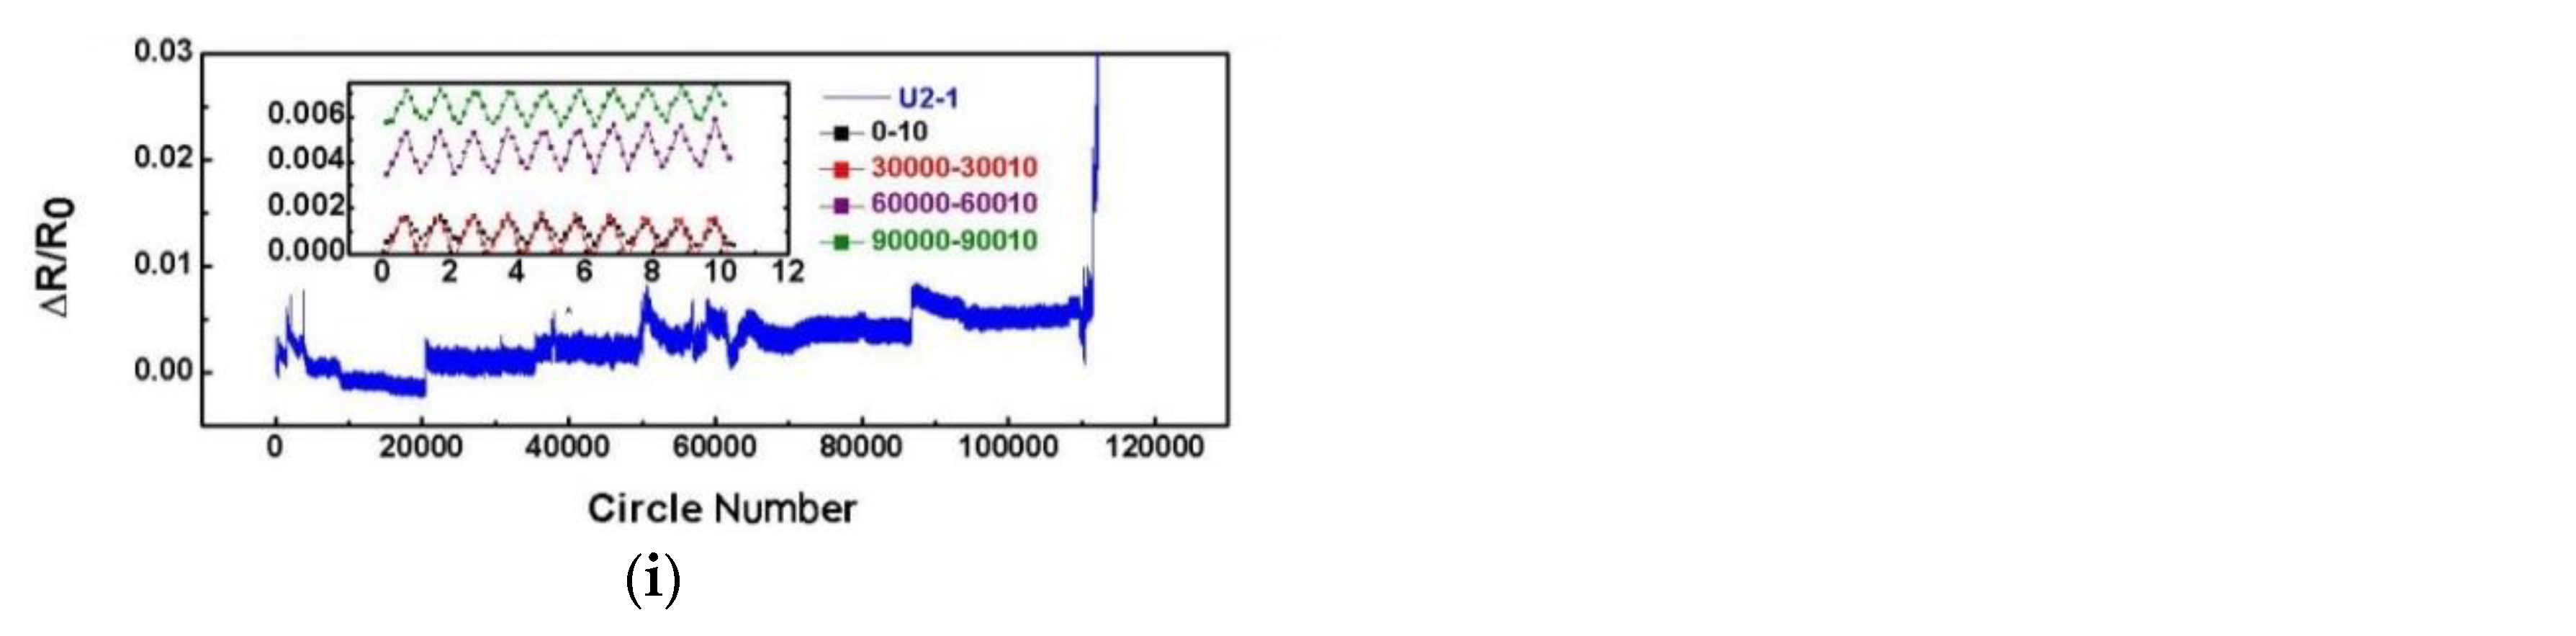
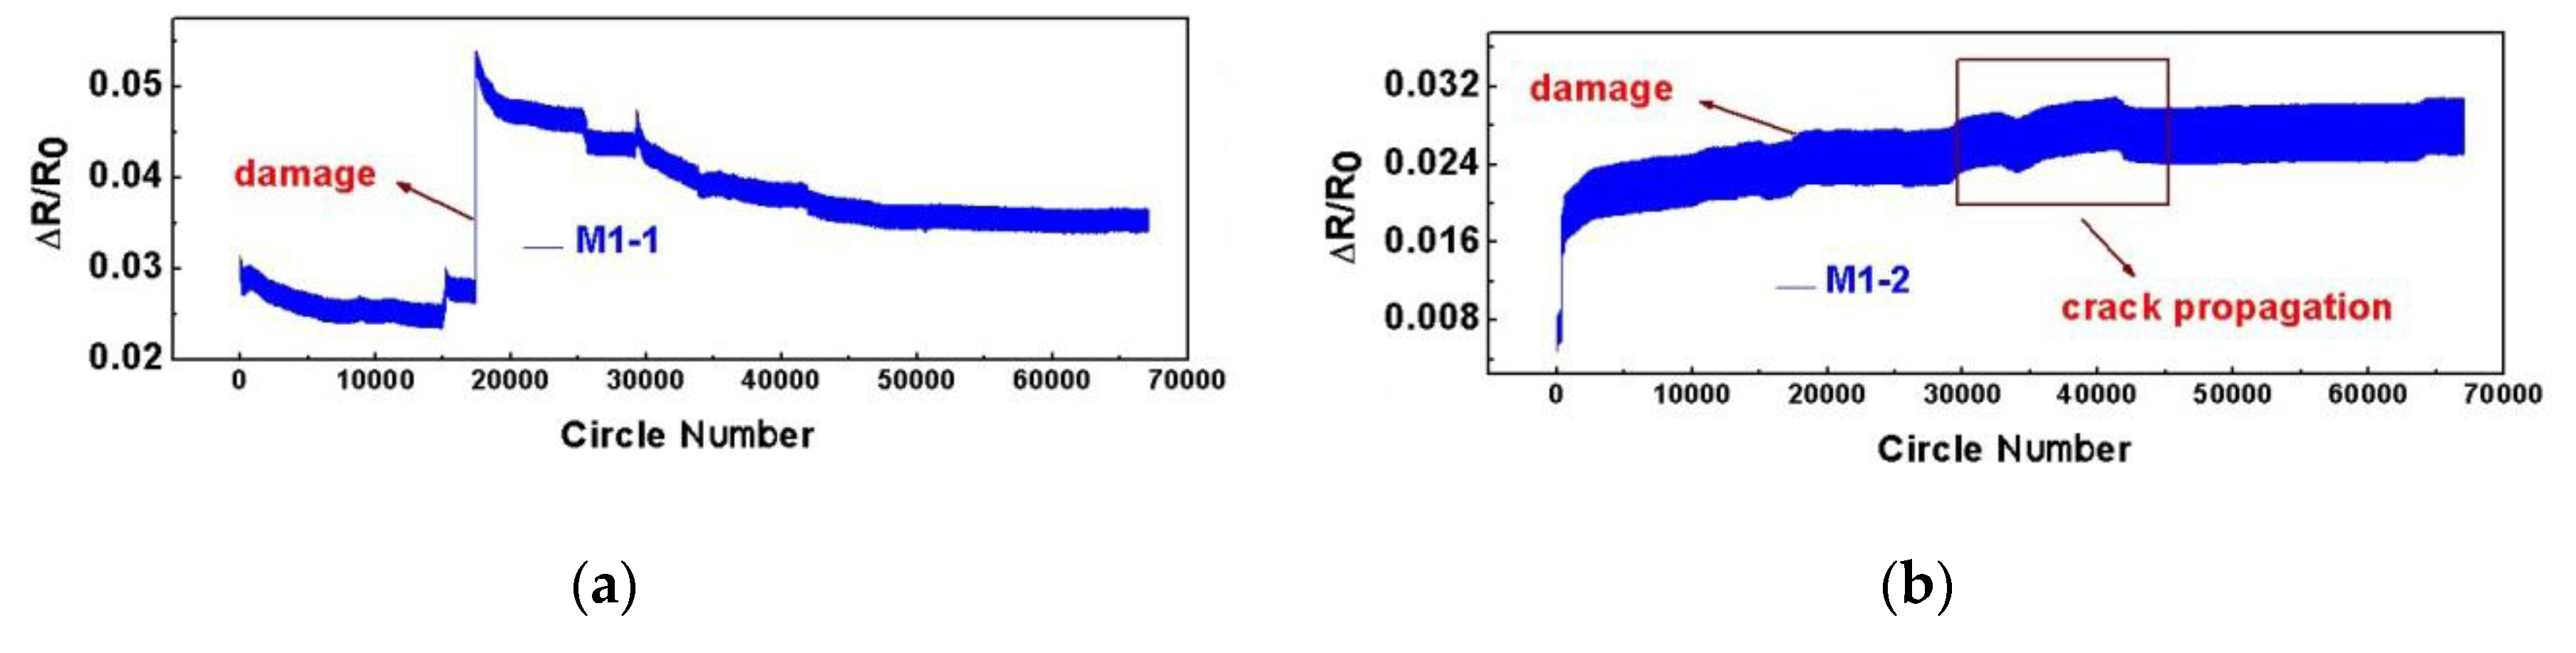
- Figure 15 shows the response of the tensile–tensile fatigue test: with the increase of fatigue cycles, the resistance change rate of all sensors increased gradually. The damage of the whole specimen accumulated gradually during the fatigue test while the material properties of the whole structure were deteriorating. Figure 15 shows the tensile–tensile fatigue test of all effective sensors and the local magnification of the resistance change rates with cycles 0–10, 30,000–30,010, 60,000–60,010, and 90,000–90,010. The results showed that with the increase of the fatigue cycle, the resistance change rate of all sensors increased gradually. As can be seen from the local amplification diagram of each sensor, the resistance responses of the sensors arranged at different positions were completely different. With the increase of the cycle numbers, the increase rate of resistance change at different stages varied greatly. For example, the resistance of the M1-1 sensor changed rapidly for 0–60,000 cycles, while the resistance of L1-2 changed very gently. This indicated that the resistance response of the carbon nanotube buckypaper sensors was very sensitive to the damage changes around the stepped-lap joint surface. The sensors could accurately capture the damage severity degree at different stages.
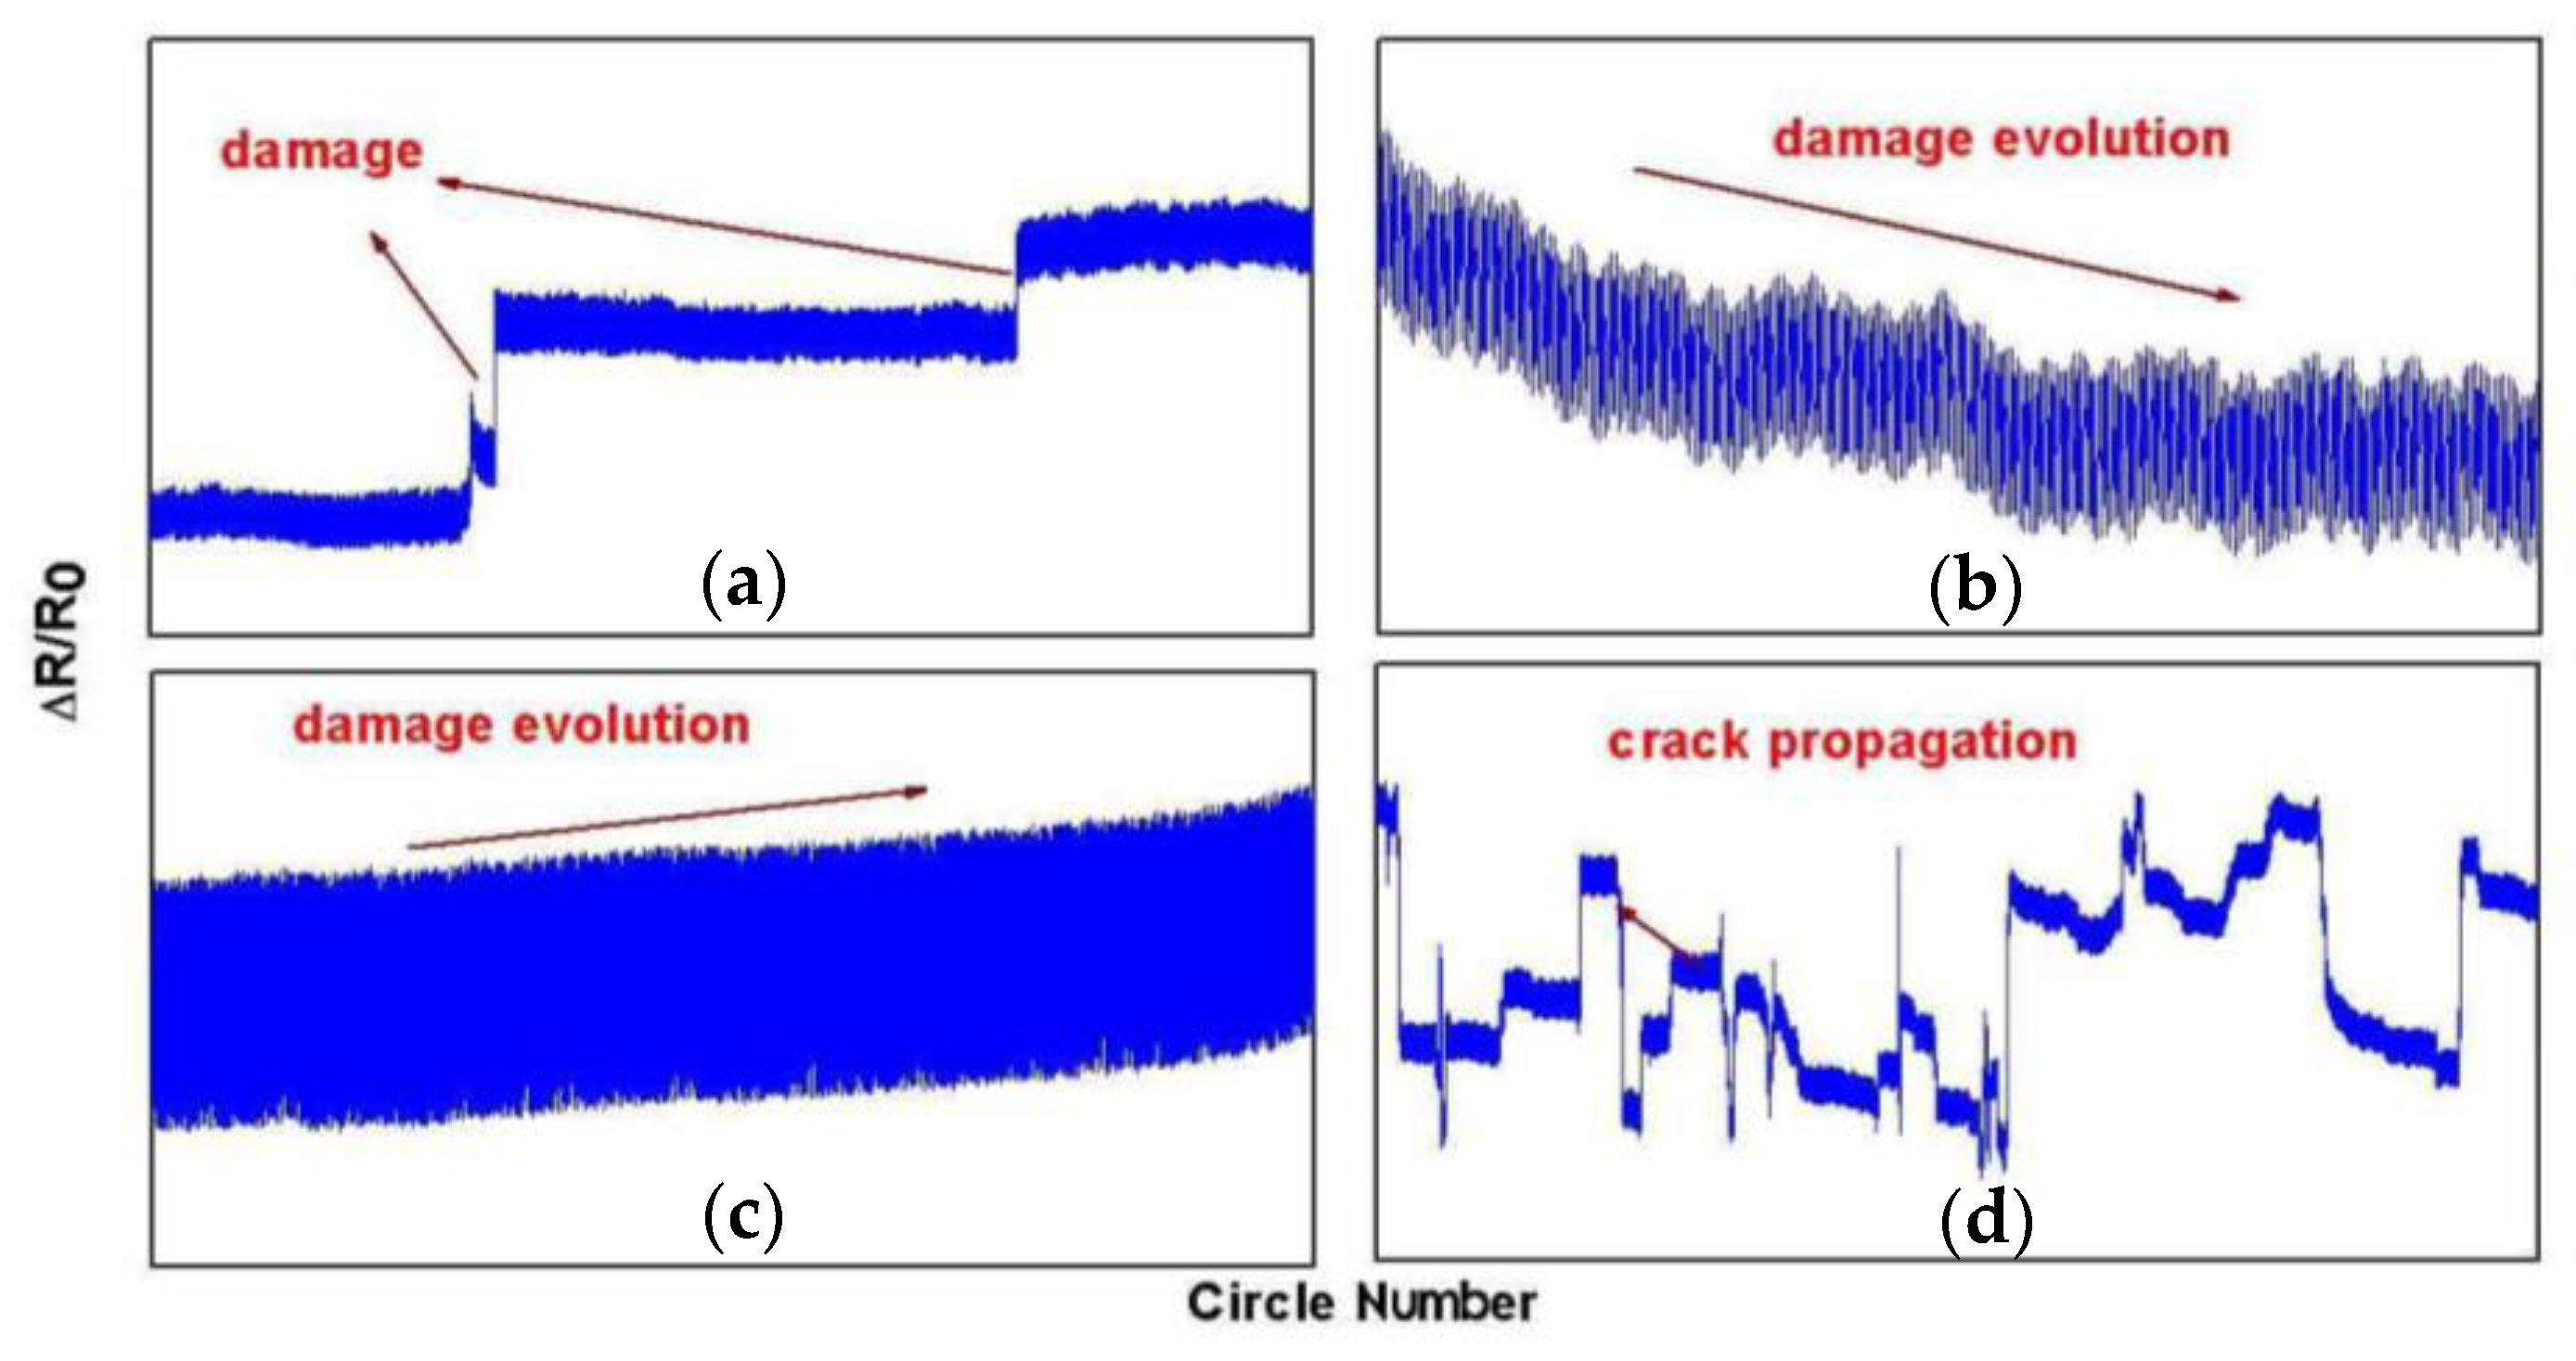
- During the whole fatigue cycle test, the response of the sensor could mainly represent four kinds of structural status of the specimen: the response of the sensor when the damage was derived, as shown in Figure 16a; the response of stiffness degradation when the damage was accumulated, as shown in Figure 16b,c; and the response of the initial crack and crack propagation, as shown in Figure 16d.
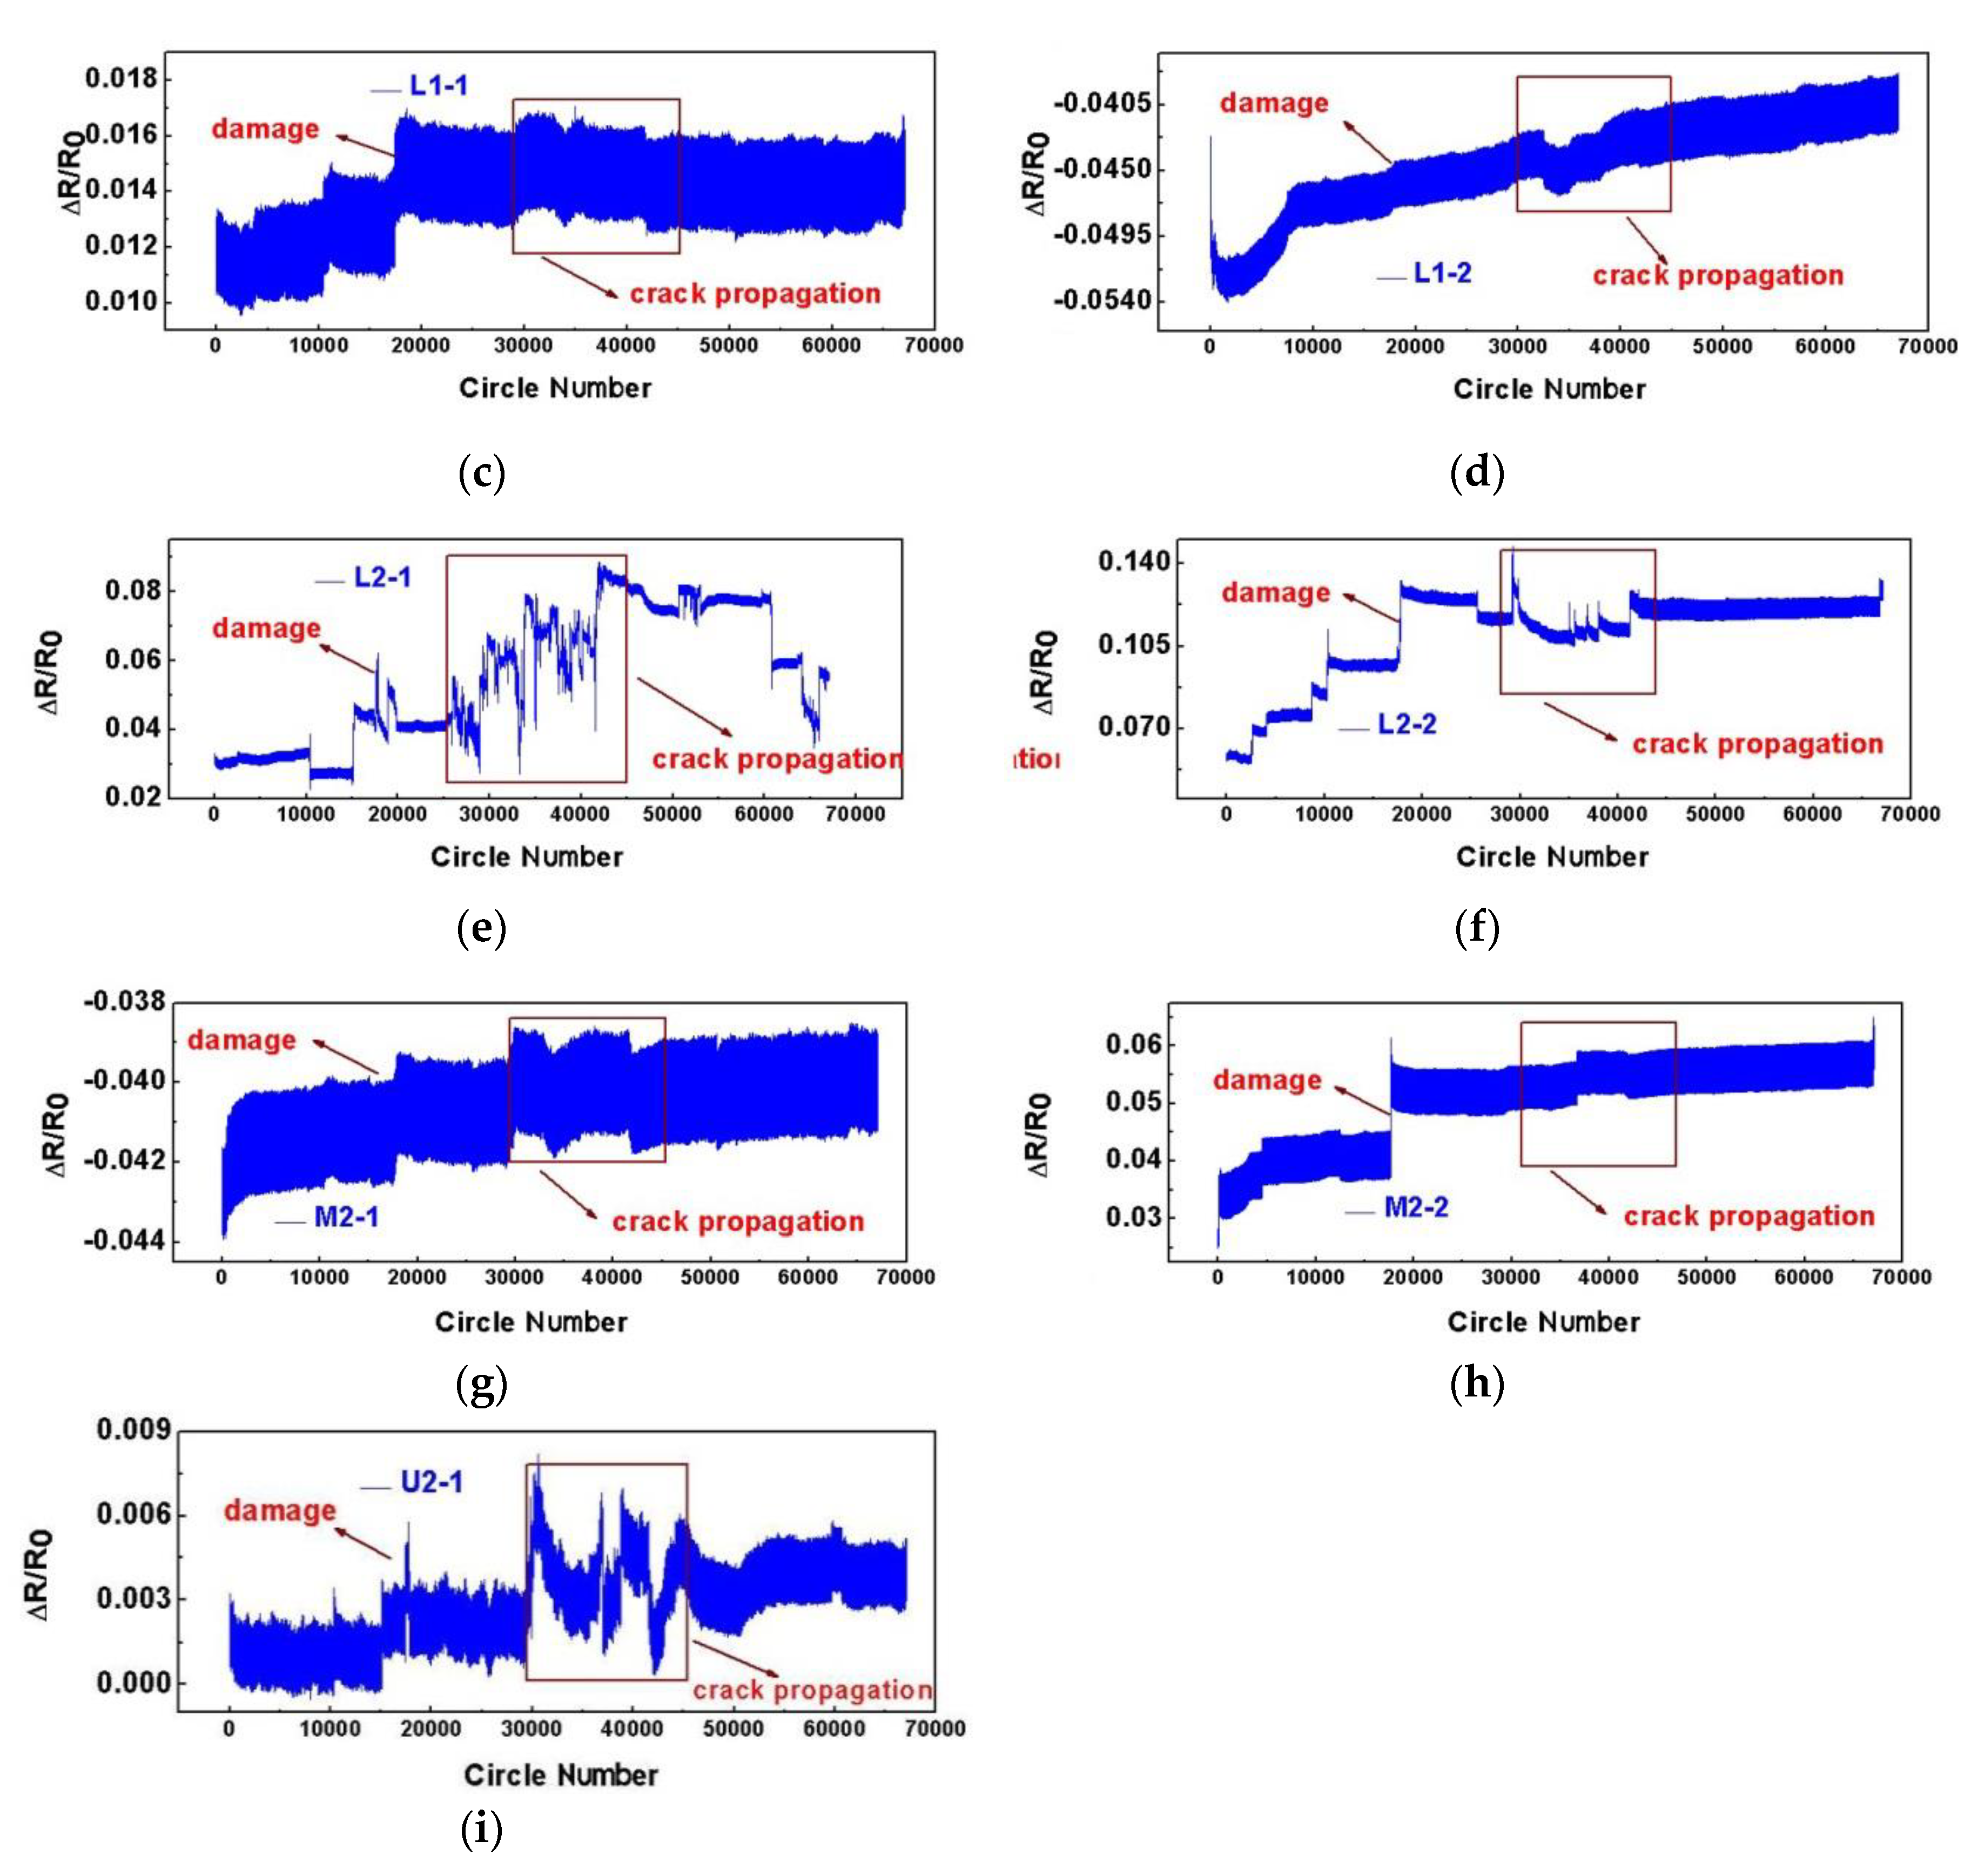
- Figure 17 showed the response results of 60,000 fatigue tests with a 10–20 kN load. When the fatigue cycle of all the sensors reached about 18,000, the resistance response of all the sensors presented different degrees of steps. It indicated that the specimen suffered serious structural damage at this moment, which could affect the response of all the sensors on the specimen.
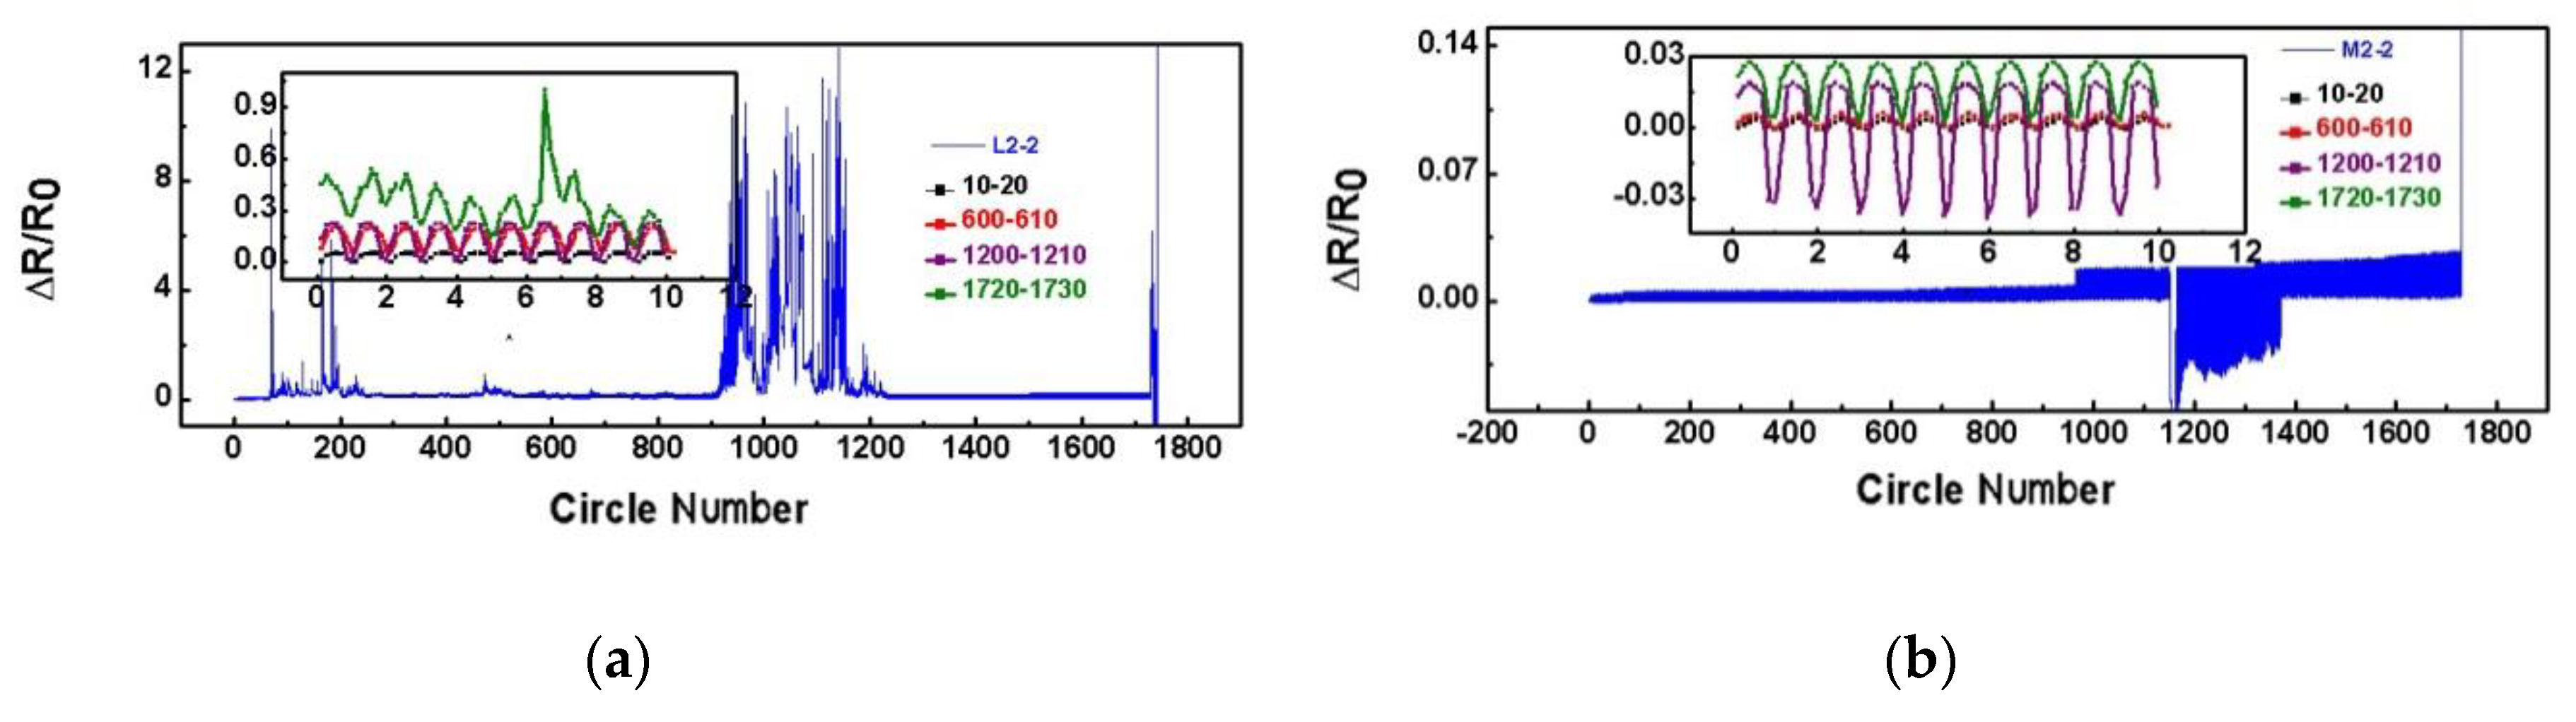
- When the number of fatigue cycles of all sensors was at around 30,000–45,000 cycles, irregular fluctuations occurred, as shown in Figure 17. The crack was in the accelerated propagation during this time, and the L2-1 and L2-2 sensors fluctuated violently. This indicated that the crack was near the monitoring area of L2-1 and L2-2.
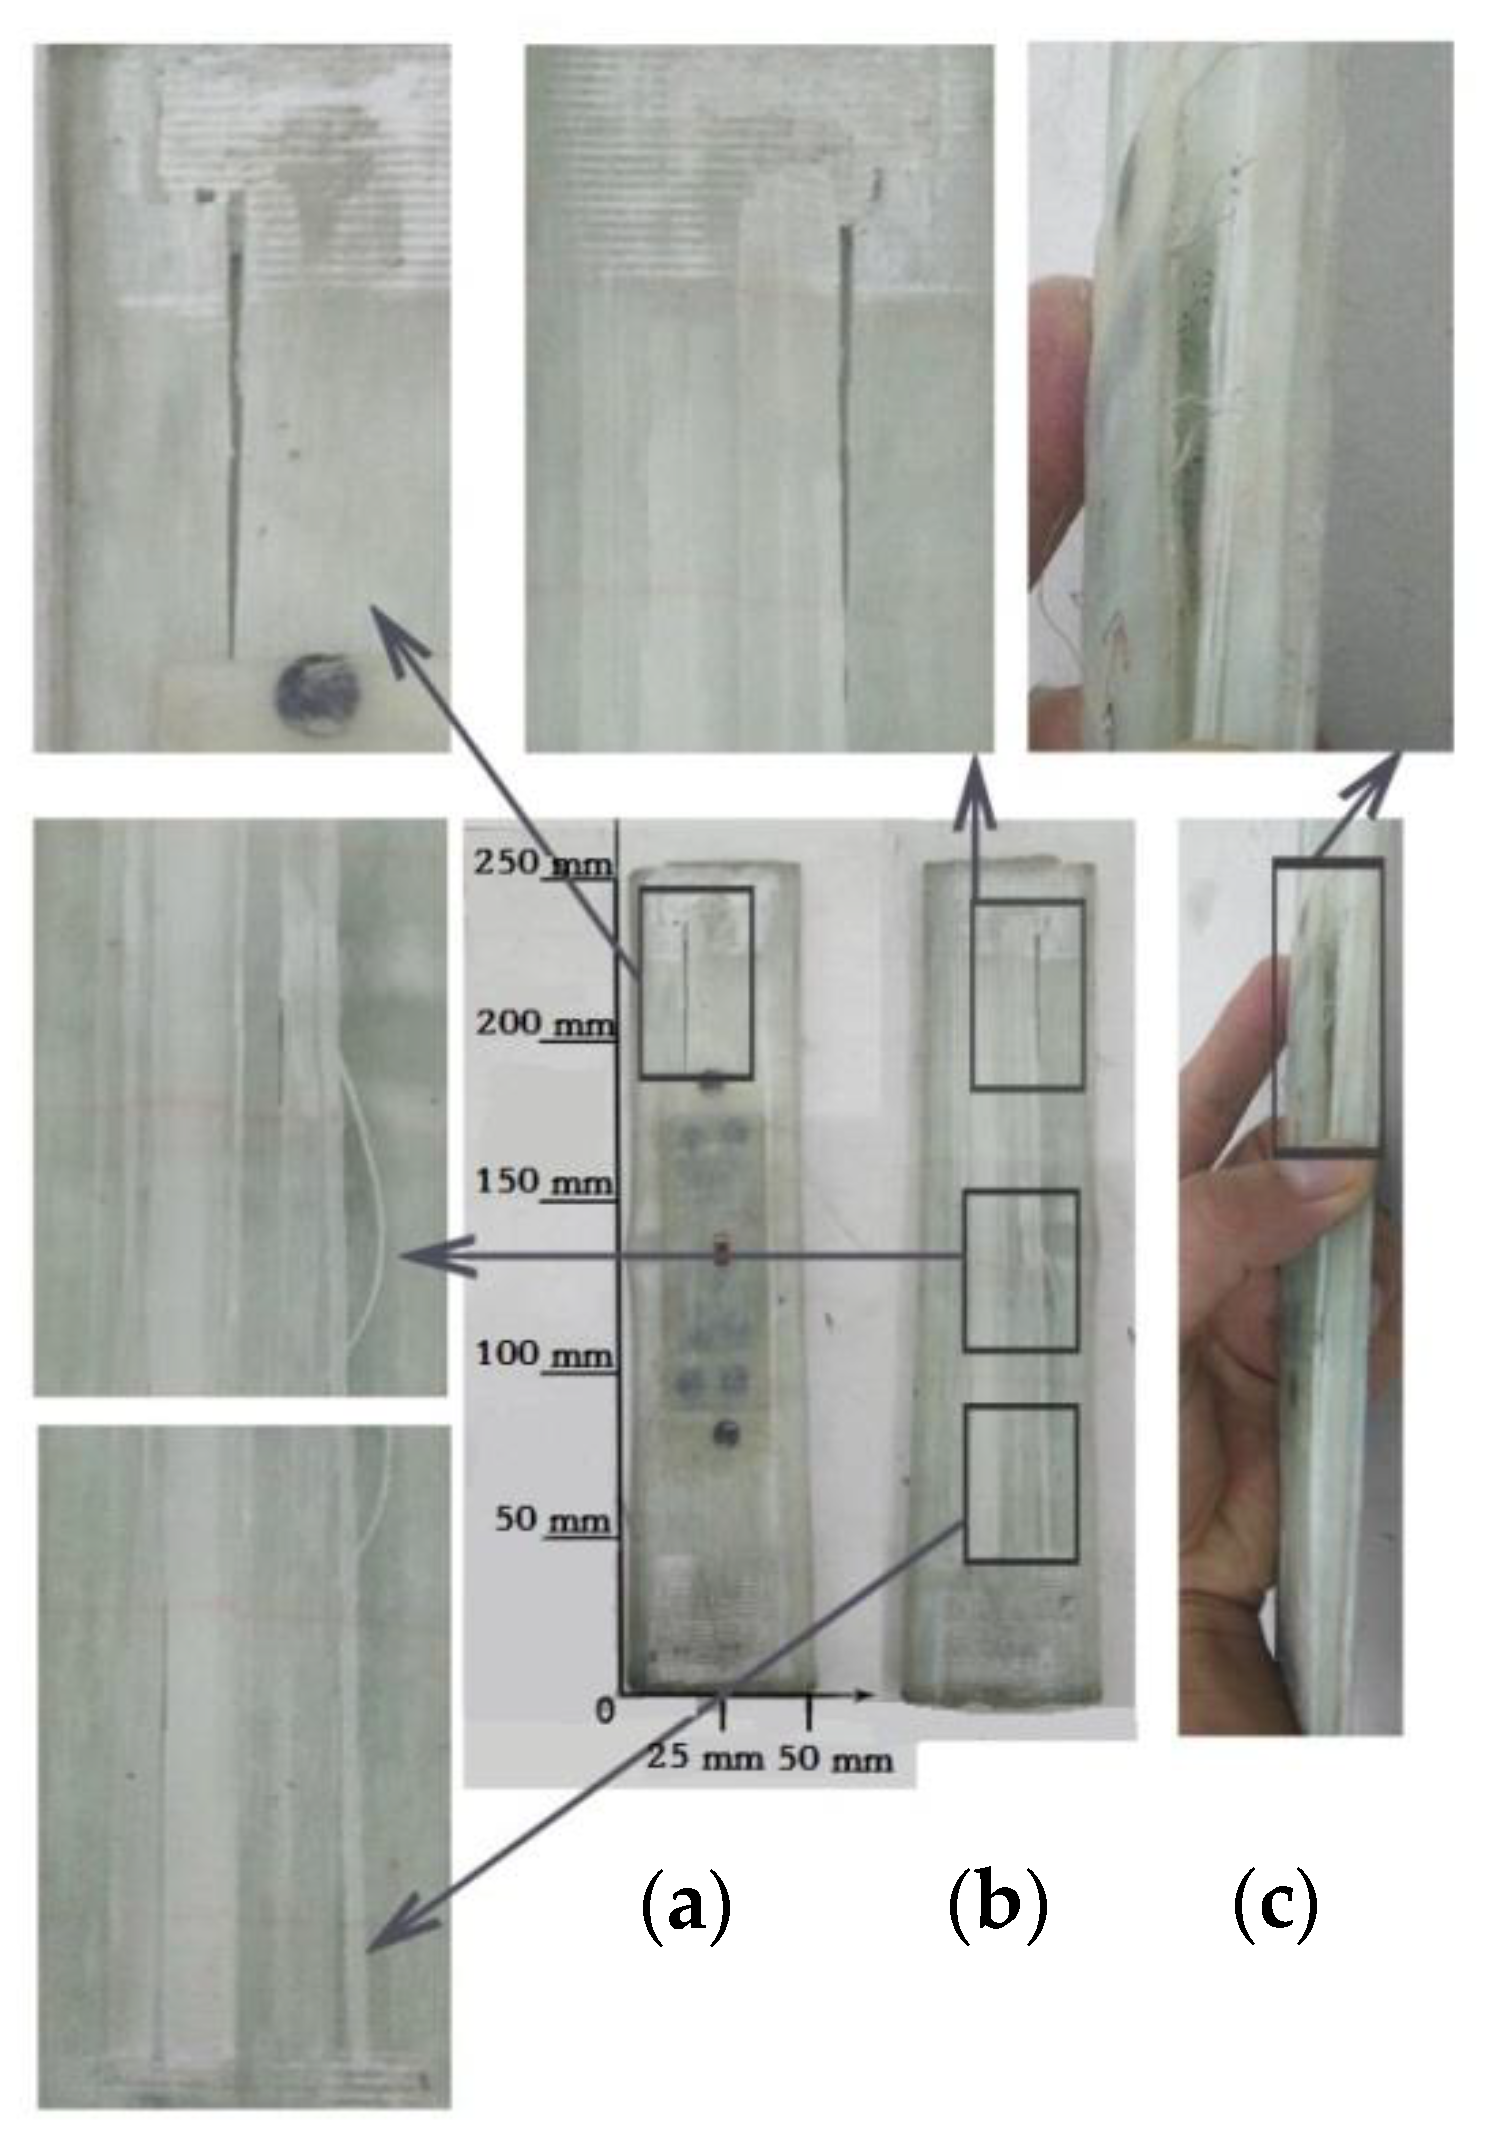
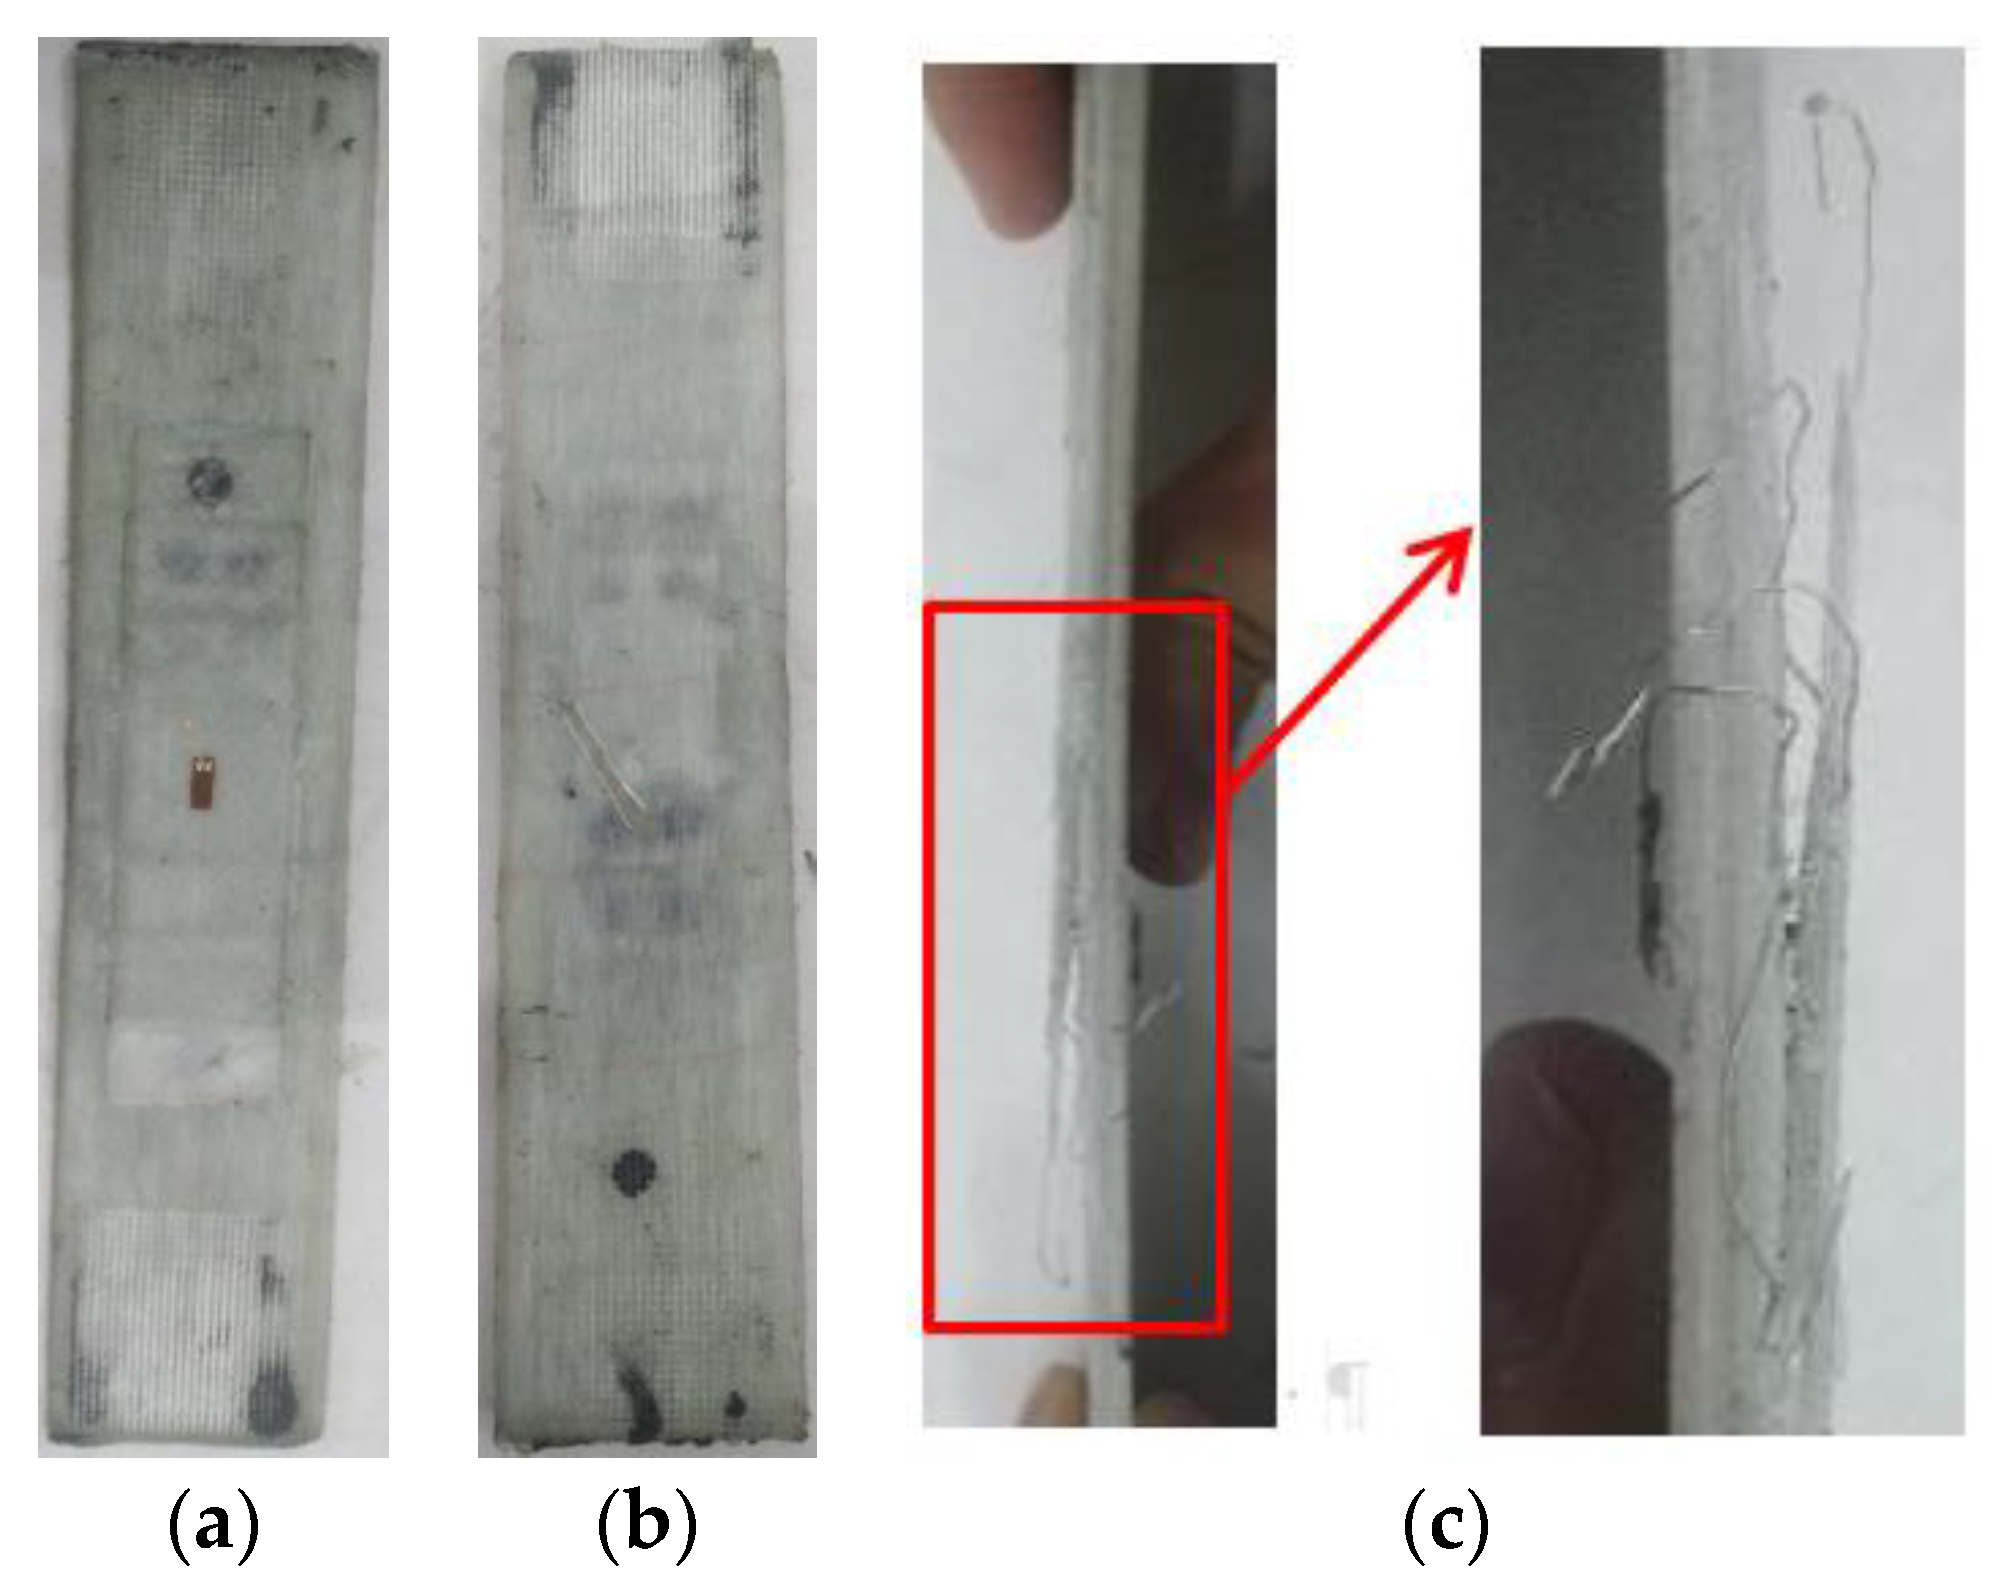
- At each loading stage of the fatigue test, the change rate of the sensor residual resistance on the left side of the specimen was generally lower than that on the right side. Until fatigue failure, the change rate of the residual resistance of the sensor on the left reached 0.25 at most, while the sensor on the right failed completely. It could be inferred that the right sensor’s stepped-lap joint surface was completely delaminated. This was consistent with the development results after the failure of the fatigue specimen (Figure 18), which indicated that the carbon nanotube buckypaper sensor could accurately detect the progressive damage of the stepped-lap scarf joint repaired unidirectional tape specimen.
4.4.4. Analysis of the Tensile–Compressive Fatigue Test
5. Conclusions
- Three groups of test specimens with 64 different configuration parameters of stepped-lap scarf joint repair unidirectional tape were designed to carry out tensile tests. The results made clear the influence of the stepped-lap mode, stepped-lap joint surface number, and reinforcement layer on the failure load. The reinforcement layer could effectively improve the load-carrying capacity of the repair zone and it was confirmed that using N reinforcement layers to reinforce N stepped-lap joint surfaces could increase the failure load by 65–95% of the original value. This provided an important parameter basis of the repair scheme design for a spar cap with different damage degrees.
- Under tension loading, the initial failure mode of the spar cap repaired using the stepped-lap scarf joint method was the delamination of the stepped-lap joint surface. The ultimate failure appeared as the shear failure of the adhesive layer on the stepped-lap joint surface and the coupling of the fiber fracture at the adhesively bonded joint. The stepped-lap joint surface was identified as the weak part of the spar cap repair and the healthy operation status of the surface should be monitored.
- The quasi-static tensile test and fatigue test of the specimens that were repaired using the reinforcement layer of the double stepped-lap scarf joint method were carried out via embedding the carbon nanotube buckypaper sensors on the stepped-lap joint surface. The sensors successfully monitored the damage and crack propagation signals.
- The quasi-static tensile test for health monitoring confirmed the failure processes: the stiffness turning point, damage evolution, crack propagation, and fracture. The results provided an important basis for monitoring the failure on the stepped-lap joint surface with carbon nanotube buckypaper sensors and verified that the shear failure of the adhesive layer on the stepped-lap joint surface was the main failure mode of the repaired structure.
- The fatigue test of the health monitoring successfully captured the progressive failure: the initial damage, damage accumulation, initial crack, and crack propagation to structural failure. The resistance change rate of all sensors increased with the increase of the fatigue cycle. The carbon nanotube buckypaper sensors could accurately detect the progressive damage of the specimen repaired using a stepped-lap scarf joint method. The results provided an important basis for fault judgment when carbon nanotube buckypaper sensors were applied to the health monitoring of a spar cap after repair.
Author Contributions
Funding
Conflicts of Interest
References
- Marsh, G. Meeting the challenge of wind turbine blade repair. Reinf. Plast. 2011, 4, 32–36. [Google Scholar] [CrossRef]
- Rajadurai, J.S.; Thanigaiyarasu, G. Structural analysis, failure prediction, and cost analysis of alternative material for composite turbine blades. Mech. Adv. Mater. Struct. 2009, 16, 467–487. [Google Scholar] [CrossRef]
- Jensen, F.M.; Puri, A.S.; Dear, J.P.; Branner, K.; Morris, A. Investigating the impact of non-linear geometrical effects on wind turbine blades-Part 1: Current status of design and test methods and future challenges in design optimization. Wind Eng. 2011, 14, 239–254. [Google Scholar] [CrossRef]
- Marin, J.C.; Barroso, A.; Paris, F.; Canas, J. Study of damage and repair of blades of a 300 kW wind turbine. Energy 2008, 33, 1068–1083. [Google Scholar] [CrossRef]
- Dai, J.C.; Yang, X.; Wen, L. Development of wind power industry in China: A comprehensive assessment. Renew. Sustain. Energy Rev. 2018, 97, 156–164. [Google Scholar] [CrossRef]
- Chawla, T.S.; Cavalli, M.N. Mechanical evaluation of repair resins for fiber-glass wind turbine blades. J. Compos. Mater. 2015, 49, 1115–1125. [Google Scholar] [CrossRef]
- Shohag, M.A.; Hamme, E.C.; Olawale, D.O.; Okoli, O. Damage mitigation techniques in wind turbine blades: A review. Wind Eng. 2017, 41, 185–210. [Google Scholar] [CrossRef]
- Lekou, D.J.; Vionis, P. Report on Repair Techniques for composite parts of Wind Turbine blades. Optimat Blades 2002, 1–15. [Google Scholar]
- STANDARD. DNV-GL-0376. Rotor blades for wind turbines. Available online: https://rules.dnvgl.com/docs/pdf/DNVGL/ST/2015-12/DNVGL-ST-0376.pdf (accessed on 1 December 2015).
- Chen, X.; Qin, Z.W.; Yang, K.; Zhao, X.L.; Xu, J.Z. Numerical analysis and experimental investigation of wind turbine blades with innovative features: Structural response and characteristics. Sci. China Technol. Sci. 2015, 58, 1–8. [Google Scholar] [CrossRef]
- Zhu, J.; Cai, X.; Pan, P.; Gu, R.G. Optimization design of spar cap layup for wind turbine blade. Front. Struct. Civ. Eng. 2012, 6, 53–56. [Google Scholar] [CrossRef]
- Liao, C.C.; Zhao, X.L.; Wang, J.L.; Shi, K.Z. Optimization design of the frequency based on wind turbine blade layers. J. Eng. Thermophys. 2011, 32, 1311–1314. [Google Scholar]
- Riddle, T.W.; Cairns, D.S.; Nelson, J.W. Characterization of Manufacturing Defects Common to Composite Wind Turbine Blades: Flaw Characterization. In Proceedings of the 52nd AIAA/ASME/ASCE/AHS/ASC Structures, Structural Dynamics and Materials Conference, Denver, CO, USA, 4–7 April 2011. [Google Scholar] [CrossRef]
- Nelson, J.W.; Cairns, D.S.; Riddle, T.W. Manufacturing Defects Common to Composite Wind Turbine Blades: Effects of Defects. In Proceedings of the 52nd AIAA/ASME/ASCE/AHS/ASC Structures, Structural Dynamics and Materials Conference, Denver, CO, USA, 4–7 April 2011. [Google Scholar] [CrossRef]
- Yang, J.S.; Peng, C.Y.; Xiao, J.Y.; Zeng, J.C. Structural investigation of composite wind turbine blade considering structural collapse in full-scale static tests. Compos. Struct. 2013, 97, 15–29. [Google Scholar] [CrossRef]
- Overgaard, L.C.T.; Lund, E. Structural collapse of a wind turbine blade. Part B Progressive interlaminar failure models. Composites Part A: Appl. Sci. Manuf. 2010, 41, 271–283. [Google Scholar] [CrossRef]
- Toft, H.S.; Branner, K.; Berring, P.; Sørensen, J.D. Defect distribution and reliability assessment of wind turbine blades. Eng. Struct. 2011, 33, 171–180. [Google Scholar] [CrossRef]
- Chen, X.; Zhao, W.; Zhao, X.L.; Xu, J.Z. Preliminary failure investigation of a 52.3 m glass/epoxy composite wind turbine blade. Eng. Fail. Anal. 2014, 44, 345–350. [Google Scholar] [CrossRef]
- Chou, J.S.; Chiu, C.K.; Huang, I.K.; Chi, K.N. Failure analysis of wind turbine blade under critical wind loads. Eng. Fail. Anal. 2013, 27, 99–118. [Google Scholar] [CrossRef]
- Katnam, K.B.; Comer, A.J.; Roy, D.; Da Silva, L.F.M.; Young, T.M. Composite Repair in Wind Turbine Blades: An Overview. J. Adhes. 2015, 91, 113–139. [Google Scholar] [CrossRef]
- Chen, X.; Xu, J.Z. Structural failure analysis of wind turbines impacted by super typhoon Usagi. Eng. Fail. Anal. 2016, 60, 391–404. [Google Scholar] [CrossRef]
- Halliwell, S. Repair of Fibre Rinforced Polymer Structures. National Composites Network Best Practice Guide; National Composites Network: Chesterfield, UK, 2006. [Google Scholar]
- Liu, W.X. The Method of Analysis for Vacuum-assisted Wet-layup Flush Repaired Composite Laminates. Ph.D. Thesis, Nanjing University of Aeronautics and Astronautics, Nanjing, China, 2013. [Google Scholar]
- Kong, J.Y.; Yan, D.X. Bond repair process for composites structure and influencing factor. Manuf. Maint. 2013, 443, 114–117. [Google Scholar]
- Wegman, R.F.; Tullos, T.R. Handbook of Adhesive Bonded Structural Repair; Noyes: Park Ridge, NJ, USA, 1992. [Google Scholar]
- Chen, S.S. Composite Structure Repair Guide; Aviation Industry Press: Beijing, China, 2001. [Google Scholar]
- Zhang, J.; Cheng, X.; Hu, R.; Bao, J. Tensile and Compressive Properties of Scarf-Repaired Composite Laminates. Polym. Mater. Sci. Eng. 2018, 34, 178–183. [Google Scholar]
- Masmanidis, I.T.; Philippidis, T.P. Modeling the progressive failure of scarf joint for wind turbine blade repair. J. Compos. Mater. 2018, 52, 2243–2254. [Google Scholar] [CrossRef]
- Campilho, R.D.S.G.; De Moura, M.F.S.F.; Pinto, A.M.G.; Morais, J.J.L.; Domingues, J.J.M.S. Modelling the tensile fracture behavior of CFRP scarf repairs. Compos. Part B: Eng. 2009, 40, 149–157. [Google Scholar] [CrossRef]
- Liao, L.J.; Huang, C.G.; Sawa, T. Effect of adhesive thickness adhesive type and scarf angle on the mechanical properties of scarf adhesive joint. Int. J. Solids Struct. 2013, 50, 4333–4340. [Google Scholar] [CrossRef]
- Goh, J.Y.; Georgiadis, S.; Orifici, A.C.; Wang, C.H. Effects of bondline flaws on the damage tolerance of composite scarf joints. Compos. Part A: Appl. Sci. Manuf. 2013, 55, 110–119. [Google Scholar] [CrossRef]
- Baig, Y.; Cheng, X.Q.; Hasham, H.J.; Abbas, M. Failure mechanisms of scarf-repaired composite laminates under tensile load. J. Braz. Soc. Mech. Sci. Eng. 2016, 38, 2069–2075. [Google Scholar] [CrossRef]
- Wang, S.; Xie, Z.; Li, X. Experimental study of composite laminate adhesively tapered-scarf repair. J. Harbin Inst. Technol. 2017, 49, 56–61. [Google Scholar]
- Feng, W.; Xu, F.; Yuan, J.L.; Zang, Y.Y.; Zhang, X.Y. Focusing on in-service repair to composite laminates of different thicknesses via scarf-repaired method. Compos. Struct. 2019, 207, 826–835. [Google Scholar] [CrossRef]
- Truong, V.H.; Yoo, J.S.; Kim, C.H.; Park, M.Y.; Choi, J.H.; Kweon, J.H. Failure load prediction of laminates repaired with a scarf-bonded patch using the damage zone method. Adv. Compos. Mater. 2017, 26, 115–133. [Google Scholar] [CrossRef]
- Ichikawa, K.I.; Shin, Y.; Sawa, T. A three-dimensional finite-element stress analysis and strength evaluation of stepped-lap adhesive joint subjected to static tensile loadings. Int. J. Adhes. Adhes. 2008, 28, 464–470. [Google Scholar] [CrossRef]
- Wu, C.; Chen, C.; Yan, W.Y. Comparison on damage tolerance of scarf and stepped-lap bonded composite joint under quasi-static loading. Compos. Part B: Eng. 2018, 155, 19–30. [Google Scholar] [CrossRef]
- Campilho, R.D.S.G.; De Moura, M.F.S.F.; Domingue, J.J.M.S. Stress and failure analyses of scarf repaired CFRP laminates using a cohesive damage mode. J. Adhes. Sci. Technol. 2007, 21, 855–870. [Google Scholar] [CrossRef]
- Jones, R.; Peng, D.; Michopoulos, J.G.; Phan, N.; Berto, F. On the analysis of bonded step lap joints. Theor. Appl. Fract. Mech. 2018, 97, 457–466. [Google Scholar] [CrossRef]
- Kimiaeifar, A.; Lund, E.; Thomsen, O.L.; Sørensen, J.D. Asymptotic Sampling for reliability analysis of adhesive bonded stepped lap composite joint. Eng. Struct. 2013, 49, 655–663. [Google Scholar] [CrossRef]
- Beylergil, B.; Aktas, A.; Cunedioglu, Y. Buckling and compressive failure of stepped-lap joint repaired with composite patch. J. Compos. Mater. 2012, 46, 3213–3230. [Google Scholar] [CrossRef]
- Mishnaevsky, L. Repair of wind turbine blades: Review of methods and related computational mechanics problems. Renew. Energy 2019, 140, 828–839. [Google Scholar] [CrossRef]
- Lu, S.W.; Zhao, C.X.; Zhang, L.; Chen, D. Real time monitoring of the curing degree and the manufacturing process of fiber reinforced composites with a carbon nanotube buckypaper sensor. RSC Adv. 2018, 39, 22078–22085. [Google Scholar] [CrossRef]
- Lu, S.W.; Chen, D.; Wang, X.Q.; Shao, J.Y.; Ma, K.M.; Zhang, L.; Araby, S.; Meng, Q.S. Real-time cure behaviour monitoring of polymer composites using a highly flexible and sensitive CNT buckypaper sensor. Compos. Sci. Technol. 2017, 152, 181–189. [Google Scholar] [CrossRef]
- Xu, T.; Qiu, Q.D.; Lu, S.W.; Ma, K.M.; Wang, X.Q. Multi-direction health monitoring with carbon nanotube film strain sensor. Int. J. Distrib. Sens. Netw. 2019, 15. [Google Scholar] [CrossRef]
- Huo, Q.S.; Jin, J.Q.; Lu, S.W.; Zhang, L.; Ma, K.M.; Wang, X.Q. Self-sensing properties of bending deformation of buckypaper composites. Mater. Res. Express 2019, 6. [Google Scholar] [CrossRef]
- Webber, J.P.H. Scarf Repair Joints in Carbon Fibre Reinforced Plastic Strips. J. Adhes. 1981, 12, 257–281. [Google Scholar] [CrossRef]


| Specimen Number | Length (mm) | Width (mm) | Stepped-Lap Mode | Stepped-Lap Width (mm) | Number of Stepped-Lap Joint Surfaces | Reinforcement Layer | Effective Sample Quantity |
|---|---|---|---|---|---|---|---|
| W1-A | 600 | 50 | Double | 80 | 3 | None | 4 |
| W1-B | 600 | 50 | None | None | None | None | 4 |
| W1-C | 600 | 50 | Single | 80 | 3 | None | 3 |
| W1-D | 520 | 50 | Double | 100 | 2 | None | 4 |
| W1-E | 520 | 50 | Single | 100 | 2 | None | 4 |
| W1-F | 520 | 50 | None | None | None | None | 2 |
| W1-G | 320 | 25 | Single | 100 | 1 | None | 4 |
| W1-H | 320 | 25 | None | None | None | None | 3 |
| W1-I | 320 | 25 | Double | 100 | 1 | None | 3 |
| W1-J | 300 | 25 | None | None | None | None | 3 |
| W1-K | 300 | 25 | None | None | None | None | 3 |
| W2-A | 420 | 50 | Single | 100 | 1 | One side, one layer reinforced | 4 |
| W2-B | 420 | 50 | Single | 100 | 1 | One layer reinforced for each side | 4 |
| W2-C | 600 | 50 | Single | 100 | 1 | One side, two layers reinforced | 4 |
| W2-D | 520 | 50 | Double | 100 | 1 | One side, two layers reinforced | 3 |
| W2-F | 620 | 50 | Double | 100 | 1 | One side, two layers reinforced | 4 |
| W3-A | 620 | 50 | Single | 100 | 2 | One layer, reinforced for each side | 4 |
| W3-B | 620 | 50 | Single | 100 | 2 | One layer reinforced on one side, and two layers on the other side | 4 |
| Serial Number | Width (mm) | Thickness (mm) | Tensile Strength (MPa) | Tensile Strain (%) | Failure Load (kN) | Load per Width (kN/mm) | Load Loss Rate (%) |
|---|---|---|---|---|---|---|---|
| W1-A | 48.1 | 3.2 | 465.4 | 1.5 | 71.6 | 1.49 | 26 |
| W1-B | 48.1 | 3.0 | 553.8 | 1.6 | 77.1 | 2.02 | - |
| W1-C | 48.6 | 3.1 | 491.0 | 1.6 | 73.8 | 1.52 | 25 |
| W1-D | 49.2 | 2.1 | 506.5 | 1.5 | 53.0 | 1.08 | 27 |
| W1-E | 48.1 | 2.4 | 466.5 | 1.4 | 54.7 | 1.14 | 23 |
| W1-F | 48.7 | 1.6 | 780.8 | 1.9 | 61.4 | 1.48 | - |
| W1-G | 23.9 | 1.5 | 364.4 | 0.8 | 13.3 | 0.56 | 31 |
| W1-H | 24.8 | 0.8 | 1013.8 | 1.2 | 20.1 | 0.81 | - |
| W1-I | 23.6 | 1.7 | 318.6 | 0.9 | 12.6 | 0.54 | 34 |
| W1-J | 23.5 | 5.5 | 528.9 | 1.3 | 67.8 | 2.88 | - |
| W1-K | 23.2 | 6.1 | 469.5 | 1.4 | 66.2 | 2.85 | - |
| W2-A | 49.9 | 2.6 | 370.2 | 1.3 | 47.4 | 0.95 | - |
| W2-B | 48.6 | 3.7 | 299.2 | 1.2 | 53.9 | 1.10 | - |
| W2-C | 48.4 | 3.5 | 347.8 | 1.7 | 58.1 | 1.20 | - |
| W2-D | 48.3 | 2.5 | 420.3 | 0.3 | 51.2 | 1.06 | - |
| W2-F | 49.9 | 3.2 | 317.8 | 2.0 | 50.5 | 1.01 | - |
| W3-A | 48.3 | 5.2 | 363.8 | 0.2 | 90.6 | 1.88 | - |
| W3-B | 49.4 | 4.3 | 445.0 | 0.3 | 95.1 | - |
© 2020 by the authors. Licensee MDPI, Basel, Switzerland. This article is an open access article distributed under the terms and conditions of the Creative Commons Attribution (CC BY) license (http://creativecommons.org/licenses/by/4.0/).
Share and Cite
Li, H.; Chen, C.; Wang, T.; Wang, L. Experimental Study of Stepped-Lap Scarf Joint Repair for Spar Cap Damage of Wind Turbine Blade in Service. Appl. Sci. 2020, 10, 922. https://doi.org/10.3390/app10030922
Li H, Chen C, Wang T, Wang L. Experimental Study of Stepped-Lap Scarf Joint Repair for Spar Cap Damage of Wind Turbine Blade in Service. Applied Sciences. 2020; 10(3):922. https://doi.org/10.3390/app10030922
Chicago/Turabian StyleLi, Hui, Cheng Chen, Tongguang Wang, and Long Wang. 2020. "Experimental Study of Stepped-Lap Scarf Joint Repair for Spar Cap Damage of Wind Turbine Blade in Service" Applied Sciences 10, no. 3: 922. https://doi.org/10.3390/app10030922
APA StyleLi, H., Chen, C., Wang, T., & Wang, L. (2020). Experimental Study of Stepped-Lap Scarf Joint Repair for Spar Cap Damage of Wind Turbine Blade in Service. Applied Sciences, 10(3), 922. https://doi.org/10.3390/app10030922