Article

Green Roofs as Effective Tools for Improving the Indoor Comfort Levels of Buildings—An Application to a Case Study in Sicily

1
Department of Engineering, University of Palermo, Viale delle Scienze Bld. 9, 90128 Palermo, Italy
2
ERIN—Environmental Research & Innovation Department, Luxembourg Institute of Science and Technology (LIST), 41 rue du Brill, L-4422 Belvaux, Luxembourg
3
Institute of Biomedicine and Molecular Immunology, National Research Council of Italy, via Ugo La Malfa 153, 90146 Palermo, Italy
4
Research Center for Plant protection and Certification, Council for Agricultural Research and Economics, Italy—SS 113; Km 245, 500-90011 Bagheria, Palermo, Italy
*
Author to whom correspondence should be addressed.
Appl. Sci. 2020, 10(3), 893; https://doi.org/10.3390/app10030893
Submission received: 27 December 2019 / Revised: 21 January 2020 / Accepted: 22 January 2020 / Published: 29 January 2020
(This article belongs to the Special Issue Sustainable Environmental Solutions)

Abstract

:
In the line of pursuing better energy efficiency in human activities that would result in a more sustainable utilization of resources, the building sector plays a relevant role, being responsible for almost 40% of both energy consumption and the release of pollutant substances in the atmosphere. For this purpose, techniques aimed at improving the energy performances of buildings’ envelopes are of paramount importance. Among them, green roofs are becoming increasingly popular due to their capability of reducing the (electric) energy needs for (summer) climatization of buildings, hence also positively affecting the indoor comfort levels for the occupants. Clearly, reliable tools for the modelling of these envelope components are needed, requiring the availability of suitable field data. Starting with the results of a case study designed to estimate how the adoption of green roofs on a Sicilian building could positively affect its energy performance, this paper shows the impact of this technology on indoor comfort and energy consumption, as well as on the reduction of direct and indirect CO2 emissions related to the climatization of the building. Specifically, the ceiling surface temperatures of some rooms located underneath six different types of green roofs were monitored. Subsequently, the obtained data were used as input for one of the most widely used simulation models, i.e., EnergyPlus, to evaluate the indoor comfort levels and the achievable energy demand savings of the building involved. From these field analyses, green roofs were shown to contribute to the mitigation of the indoor air temperatures, thus producing an improvement of the comfort conditions, especially in summer conditions, despite some worsening during transition periods seeming to arise.

1. Introduction

The reduction of energy consumption and the related decrease of greenhouse gases emissions represent important aspects to which much attention has been paid at global, European and countries levels, especially with regard to the building sector.
Worldwide, energy consumption in the building sector is responsible for 36% of total energy use (corresponding to a 39% of energy-related CO2 emissions) [1,2], while at the European level, the energy consumption in the same sector accounts for a share of the total energy comprised between 25% and 40% (corresponding to about 35% of CO2 emissions throughout Europe) [3,4,5].
From this perspective, various strategies have been implemented. At the global level, the UN 2030 Agenda for Sustainable Development, along with the 17 Sustainable Development Goals (SDGs) [6], need to be mentioned.
At the European scale, the EU has been very committed to this issue by setting the well known ambitious targets for 2020 (“climate and energy package”) [7], and even more so for 2030 (“climate and energy framework”) [8,9] and 2050 (“long-term strategy”) [10,11]. Other relevant goals have been set out in the seventh Environment Action Program (EAP) [12] aimed at decarbonizing and making more sustainable European cities. Among European standards and regulations issued on this matter, the EPBD Directive and its recast must be cited [13,14,15].
Italy’s National Energy Strategy 2017 [16] lays down the actions to be achieved by 2030, in accordance with the long-term scenario drawn up in the EU Energy Roadmap 2050, which translate to a reduction of emissions by at least 80% from their 1990 levels.
However, despite these standards and regulations being in force, in recent years, the energy consumption in the building sector has increased, particularly in Italy [17]. That is why more effort in promoting actions and finding new strategies to improve energy savings and efficiency are necessary [18].
Generally speaking, apart from all the design strategies typical of the principles of bioclimatic architecture (such as, for instance, space organisation, wall-window-ratio, orientation, thermal mass, operation management [19,20]), more relevant energy savings achievable in buildings can be attributed to two main categories of components: technical plants (HVAC system) and the building envelope, which have a synergistic relationship. In fact, a reduction in energy consumption related to the HVAC consists in the use of active systems which entail further energy consumption. As regards the building envelope, passive systems (not energy depending) can be used, which allow to actually obtain a reduction of the energy consumption (and at the same time, to also save on the use and the size of the HVAC system). Clearly, the occupants’ behaviours and attitudes might also significantly influence energy saving, as demonstrated, for instance, in [21,22,23,24]. Starting from the above considerations, in this work, it was decided to pay attention to the use of a passive system to be applied to the building envelope, that is, green roofs equipped with different vegetation types.
Among the passive systems, green roofs are becoming more and more popular due to their capability of reducing the energy needs for the climatization of buildings [25,26,27], especially for cooling purposes [28,29,30].
At the same time, vegetated roofs also have a positive impact on the outdoor urban environment in terms of regenerative sustainability, allowing to induce various environmental benefits [26,31], such as reducing air pollution [32,33], mitigating noise [34,35], improving the management of runoff water [32,36,37], easing the urban heat island (UHI) effects [38,39,40], and increasing the urban biodiversity [41,42]. Moreover, the European Union is evaluating the possibility of including criteria specifically referring to green coverings within the EU Ecolabel scheme for buildings [43].
In addition to experimental studies [44,45,46], the effect on the built environment of vegetated roofs in diverse climates has also been investigated from analytical [47,48,49] and modelling points of view [50,51,52] over the years. In particular, the relevant parameters for energy modelling of green roofs have been explored in the literature, particularly referring to the role played by leaves and solar radiation in the thermal exchanges between vegetated layers and the surrounding environment [53].
The reported literature indicates that green roofs represent very promising building components, also in the Mediterranean context, as demonstrates the incremental number of studies and analyses carried out in recent years concerning both the experimental [44,54] and the simulating approach [47,55].
Other studies have underlined that additional issues would probably need more attention regarding plants growing on the roof, especially their influence on the thermal performance of green roofs [56,57], and the influence of the evapotranspiration component on the green roof heat and mass transmission [50,58].
Taking into account the studies reported above, it is evident how green roofs can have a strong impact in attenuating the average radiant temperature on building roofs [44,59,60]. This capability of acting as thermal insulation positively influences the indoor comfort conditions for the occupants of the rooms sited under the roof [27,45,61,62]: this aspect has always been critical in the design phase of a building envelope.
Kuan-Teng Lei et al. [63], by means of a field experiment performed in a school building in Taipei, have developed a finite element analysis model for the improvement of indoor thermal comfort in the presence of extensive green roofs. The researchers found a decrease of the indoor temperature up to 4 °C, compared to bare roofs. Costa Junior et al. [64], through an experimental analysis conducted in the city of Recife, Pernambuco (Brazil), compared the performance of four roofs made up of chanana green roof (Turnera subulata), daisy green roof (Sphagneticola trilobata), parsley green roof (Ipomoea asarifolia), and fiber cement tile. Through the comparison, the index of discomfort (ID), effective temperature (ET) and the human comfort index (HCI) were calculated. The three vegetated options mitigated both the internal air temperature with a reduction of 0.71°C, 0.19°C and 0.35°C, respectively and the internal surface temperature with a reduction of 1.5°C, 0.8°C and 0.8°C, respectively, compared to the fiber cement tile-made roof. Di Giuseppe and Orazio [65] experimentally analysed the effect of cool and green roofs compared to traditional ones in a Nearly Zero Energy Building, on the internal comfort and the air temperatures of the surrounding environment. The outcomes, on one hand, confirmed the effectiveness of green and cool roofs for the mitigation of the Urban Heat Island effect, and on the other hand, indicated the little effectiveness of high-albedo materials on roofing systems with a very low U-value for internal comfort.
Furthermore, the impact of green walls on thermal comfort have been compared to that of green roofs. For instance, Malys et al. [66], using the SOLENE-microclimat tool, compared the effect caused by different ‘greening strategies’ on buildings’ energy consumption and indoor comfort in the summer season. The outcomes of the investigation indicate that, while green roofs seemingly mainly affect the upper floor, green walls directly affect the indoor comfort throughout the entire building.
To help to provide a contribution to this important and often overlooked matter, the aim of this paper was to assess the influence that green roofs have on the indoor thermal comfort levels, particularly considering the indoor radiative heat exchanges. For this purpose, a case study was conducted to estimate how the adoption of the proposed interventions could impact the indoor thermal comfort and the energy consumption of a building and contribute to the reduction of the direct and indirect CO2 emissions. In particular, the ceiling temperatures of some rooms located underneath six different types of green roofs were monitored. The choice of detecting this parameter resides on the circumstance that the ceiling internal surface’s temperature is a relevant component of the mean radiant temperature of the room that, in turn, greatly affects the value of the indoor parameter PMV [67]. Subsequently, the obtained data were used as input data for one of the most widely used simulation models (EnergyPlus [68]) to evaluate the indoor comfort levels and the achievable energy demand savings of the involved building.
Three scenarios were adopted. Scenarios #1 and #2 refer to a building equipped with a green roof; Scenarios #3 refers to the pre-existing roof. The simulation of Scenario #2 is made by means of the Energy Plus code, through its resident routine; on the other hand, Scenario #1 is modelled by imposing, for the indoor temperatures of the ceiling, the experimental data detected on the site. The aim of this approach was to compare the PMVs obtained from Energy Plus with those calculated on the basis of the monitored experimental data, i.e., the indoor ceiling surface temperatures.

2. Materials and Methods

The presented study is part of a joint research project between the University of Palermo and the “Consiglio per la ricerca in agricoltura e l’analisi dell’economia agraria - CREA”, operating in Sicily. To accomplish the task mentioned in the Introduction, a mixed approach, partly modelling and partly experimental, was used in the work.
At the same time, the impact that green roofs have on the energy consumption of a building was evaluated. In addition, the estimation of the achievable savings in direct and indirect CO2 emissions due to the use of such building component is reported as well.

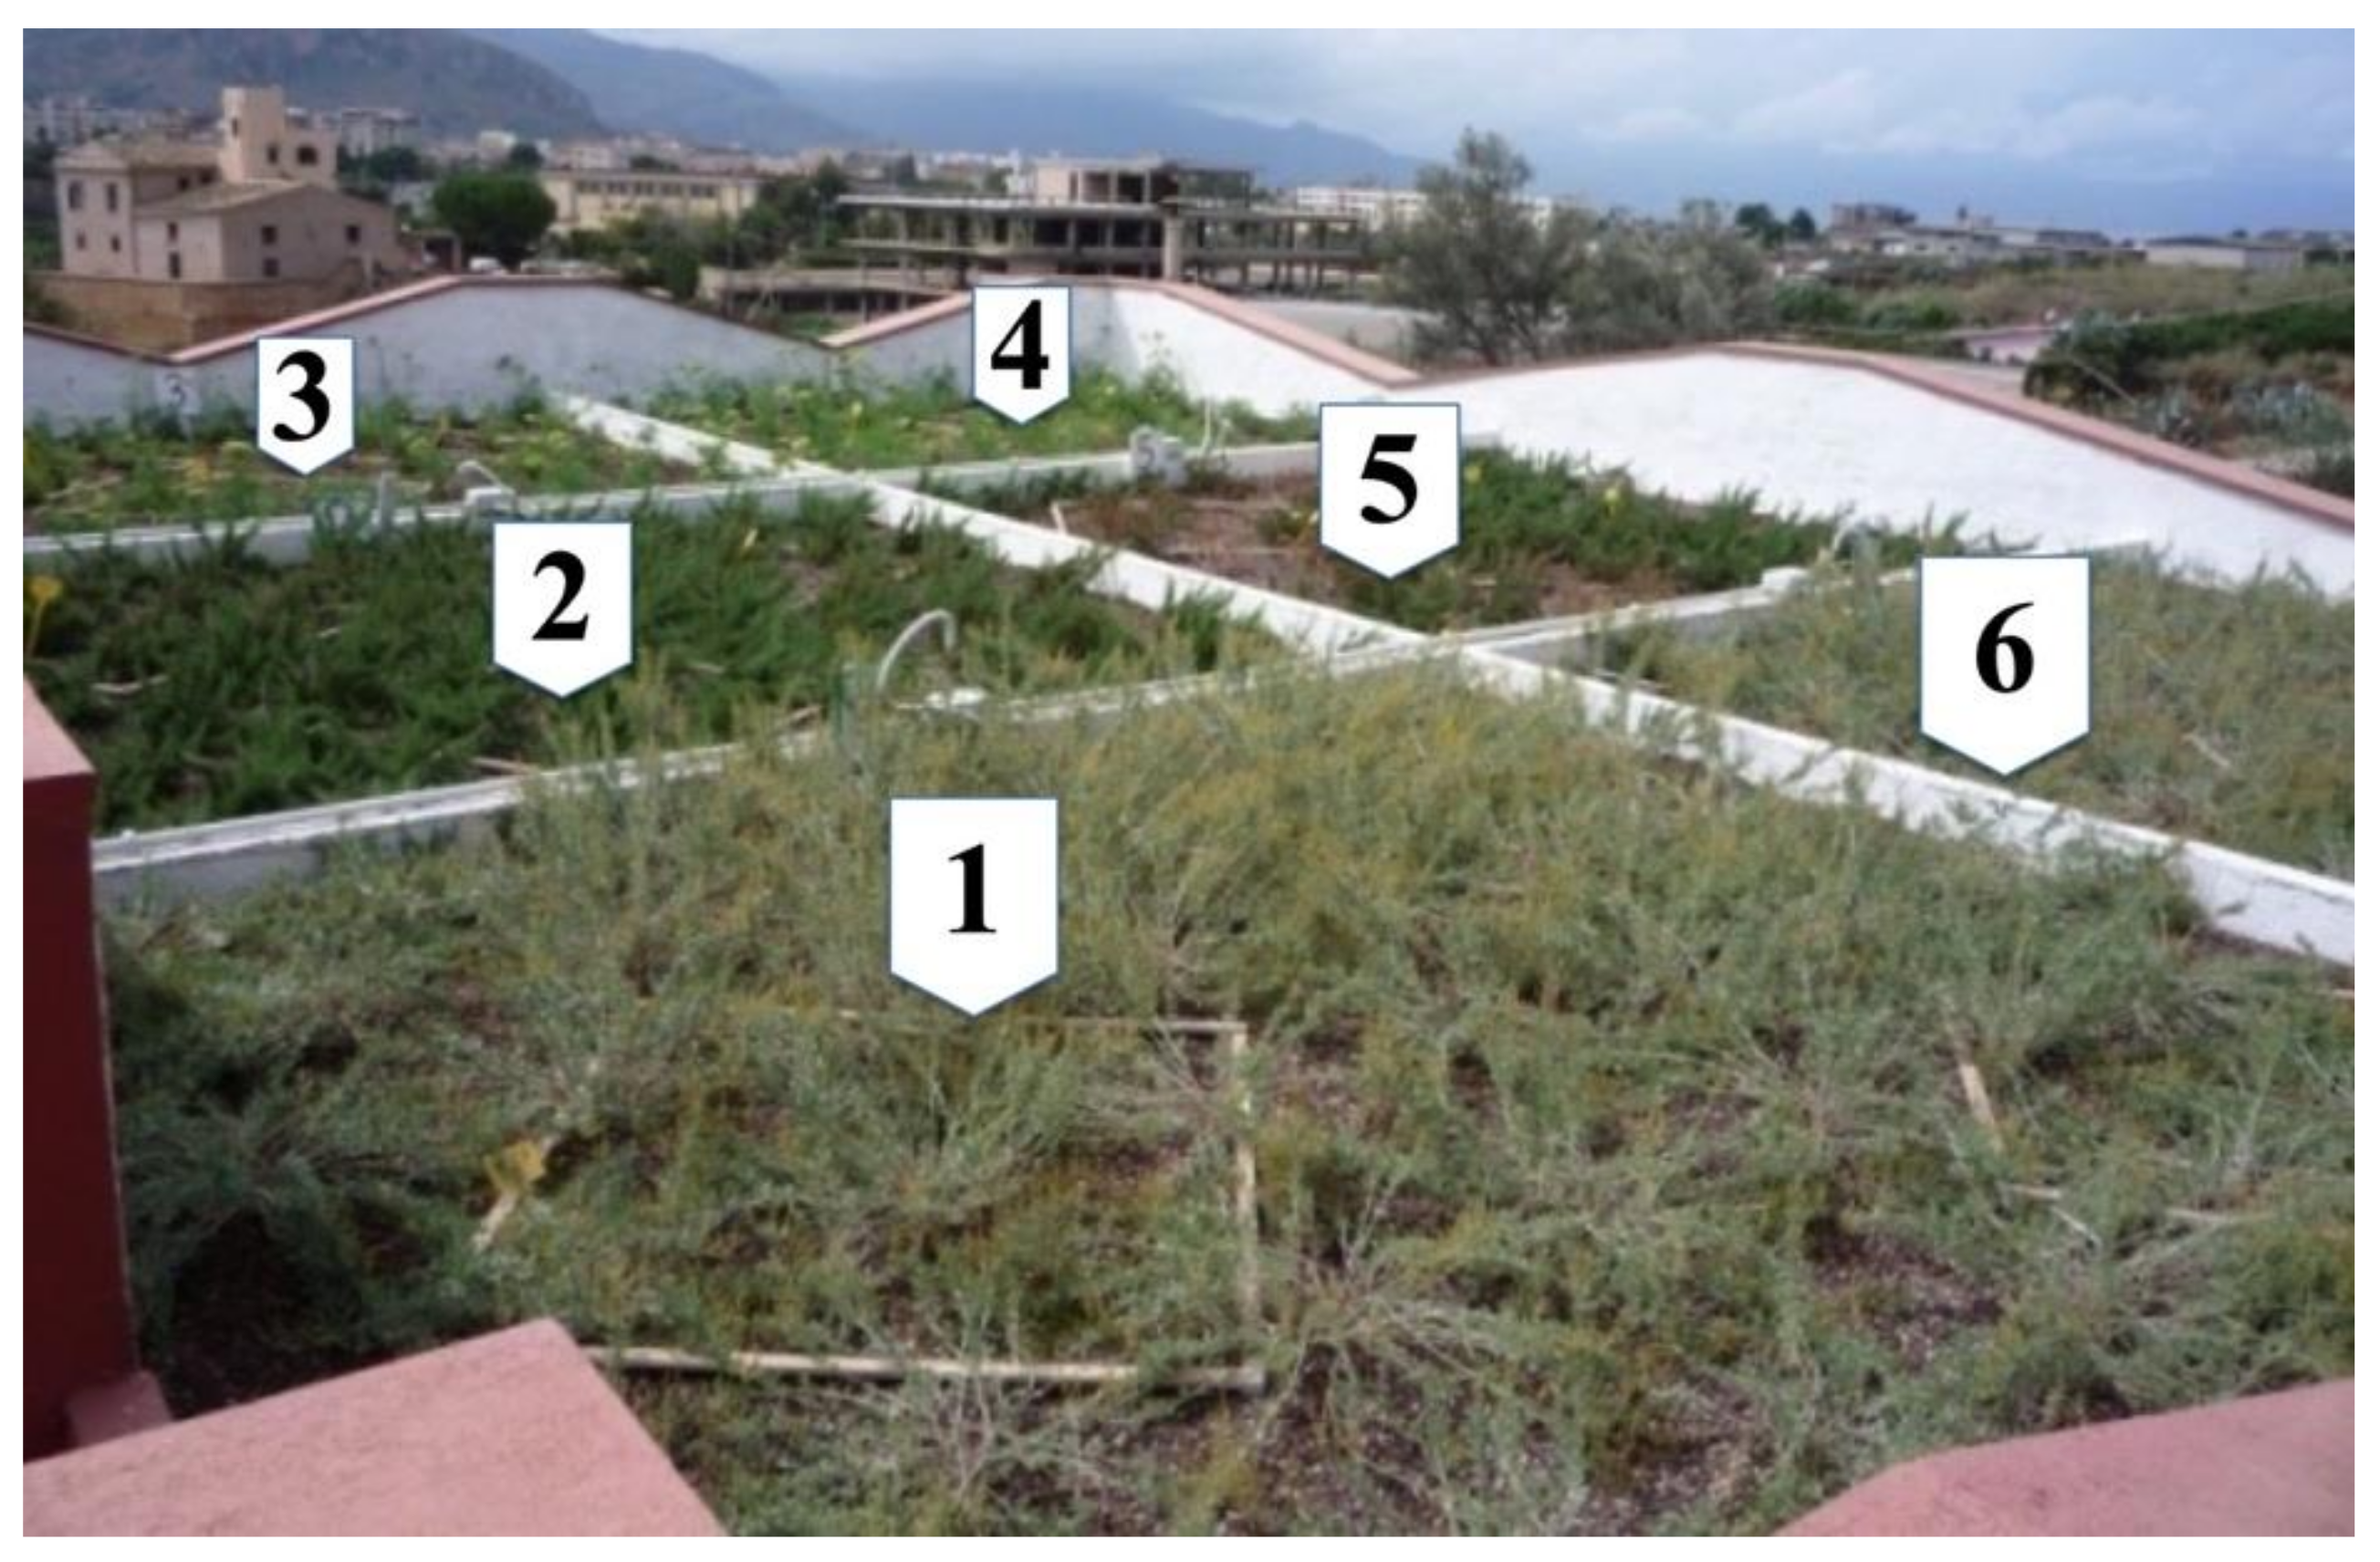
2.1. Description of the Experimental Site

The installation of the experimental green roof was settled by the CREA Research Center and the University of Palermo with the support of a building materials enterprise, on the roof of a one-storey detached house (Figure 1) owned by CREA and sited in Bagheria, a Sicilian town near Palermo (Southern Italy).
To conduct the present case study, it was decided to install the green coverage on the pre-existing roof of the building, made of hollow bricks, with a surface of approximately 80 m2.
As regards the weather conditions of the site, they were typical of the South of Italy, characterized by a temperate climate with warm summers and mild winters. Figure 2, Figure 3 and Figure 4 show the trend of outdoor air temperature (T), relative humidity (RH) and solar radiation (IR), respectively, during the monitoring period of one year.

2.2. Description of the Analysed Green Roof Installed in the Experimental Site

Going from the indoor to the outdoor sides of the building, as shown in Figure 5, the green roof compound is composed of the following layers: a root barrier (with a waterproofing membrane), a drainage layer (made of a polyethylene geo-net, hot-coupled with a non-woven geotextile with filtering functions), a water storage layer (constituted by cushions filled with expanded perlite), a filter fabric (composed by a geotextile felt, 100% polypropylene calendered), a growing medium (which is a mixture of peat, lapillus, pumice, zeolite and slow releasing fertilizers and is infesting weeds free) and the vegetation layer.
In order to also analyse the effects provided by different plant species and different thicknesses of the water storage layer on the green roof thermal behaviour, the roof was divided into six sectors, where three different Mediterranean autochthonous species (Halimione Portulacoides, Rosmarinus Officinalis Prostratus and Crithmum Maritimum) and two different thicknesses of the water storage layer (10 cm for plots 1, 2, 3 – P1, P2, P3 – and 15 cm for plots 4, 5, 6 – P4, P5, P6 –) were used according to the scheme reported in Figure 6.
A brief structural description of each layer is reported in Table 1.
Table 2 reports, instead, the main physical parameters characterizing each of the green roofs’ six plots. The data listed in Table 2 are the same as those used in [69].
In addition to thermal conductivity, density and specific heat, which characterize the thermo-physical behaviour of the soil, some other properties typical of the specific plants, which have an important impact on the heat exchanges through the green-roof, were also considered.
Particularly, the “leaf reflectance” (dimensionless), that is, the ratio of the incoming light which is reflected by a leaf, and the “leaf area index”—LAI (m2/m2)—defined as the one-sided green leaf area per unit of ground surface area. The latter, in particular, which has a great influence on the shading and transpiration effects, has a positive effect, especially during summer seasons; in fact, the higher the LAI, the higher the cooling reduction [50,69,70].
As for the vegetation characteristics, Figure 7 shows how the Halimione Portulacoides (both P1 and P6) and the Rosmarinus Officinalis Prostratus (only P5) reached full coverage (100%) in less than 12 months while the Rosmarinus Officinalis Prostratus in P2 achieved a maxim coverage of about 85% in the same period and the Crithmum Maritimum (both P3 and P4) did not accomplish more than 40%–60%, showing the difficulty of establishing it in the considered environment [52].

2.3. Data Monitoring System Adopted

The field experimental part of the proposed approach essentially consisted in a monitoring campaign of the ceiling temperature values of the building.
Since the monitoring of the temperatures profiles of the ceiling was aimed at checking the effects of the presence of the green roof on the indoor conditions, particularly in terms of thermal comfort levels, measures were performed in the center of the rooms’ ceiling, far from thermal bridges and lights fixtures, as shown in Figure 8.
Concerning the measuring method, temperatures were recorded with a sample rate of 10 minutes, during both the winter and the summer seasons, by means of insulated T type thermocouple probes.
The monitoring campaign lasted one year and started six months after the installation of the green roofs in order to have the green coverage well stabilized and to allow the testing of the acquisition system.

2.4. Simulations Performed in the Study

The modelling part of the proposed approach consisted in utilizing the very popular EnergyPlus simulation code to run the building’s thermal calculations. For this purpose, different scenarios were implemented, specifically:
  • Scenario #1, in which the monitored ceiling temperatures were utilized in the simulation as boundary fixed conditions for the ceiling of the investigated rooms. In this scenario, a detailed schedule for the HVAC was implemented, based on assumptions made of its "real" use according to the typical time of occupation of the building, considering a power capacity of 10000 Watt. This value was obtained from simulations previously conducted using the climatic design-day typical of the examined area, characterized by a temperature of 5.2°C (± 0) for winter conditions and 31°C (± 6) for summer conditions.
  • Scenario #2, in which the simulation was carried out utilizing the green roof configuration provided by EnergyPlus (EP+GR), trying to simulate the previously described six plots as faithfully as possible by using the parameters reported in Table 1 and Table 2. In fact, the EnergyPlus green roof simulation tool sets numerical limits for some parameters, which could not therefore have been set according to their real values.
  • Scenario #3, in which the simulation was conducted by implementing a standard case (STD), that is, considering the original roof of the building without the presence of green coverage.
Regarding the HVAC schedule of Scenario #2 and Scenario #3, it was decided to use a simple on/off schedule, with the HVAC working between 7:00 and 17:00, considering the same power capacity as that used in Scenario #1.
The authors would like to underline here that Scenarios #1 and #2 are characterized by the presence of green roofs, while Scenario #3 refers to a standard roof. The difference consists in the fact that, while the simulation of Scenario #2 totally complies with the Energy Plus code (by utilizing its typical green roof simulation routine), Scenario #1 is modelled by forcing the Energy Plus code, that is, imposing the monitored indoor ceiling temperatures as boundary conditions. In this way, the model was driven with real data based on the presence of the experimental green roof, avoiding the actual simulation of the green roof element itself. Hence, this allowed us to compare the PMVs obtained from the Energy Plus green roof simulation tool (with its relative assumptions limits) with those calculated on the basis of the real monitored experimental data.
In order to assess the direct and indirect reduction of CO2 emissions, in this work, a value of 85 kgCO2/ha per year [71] was considered for the direct reduction of CO2 emission, based on the extension of green covering, while a value of 0.531 tCO2/MWh (the average emissions for the current electric Italian energy mix [34]) was used to estimate the indirect reduction of CO2 emission based on energy saving for climatization purposes and having set a COP value equal to 3 for the cooling season and 3.5 for the heating season.

3. Results and Discussions
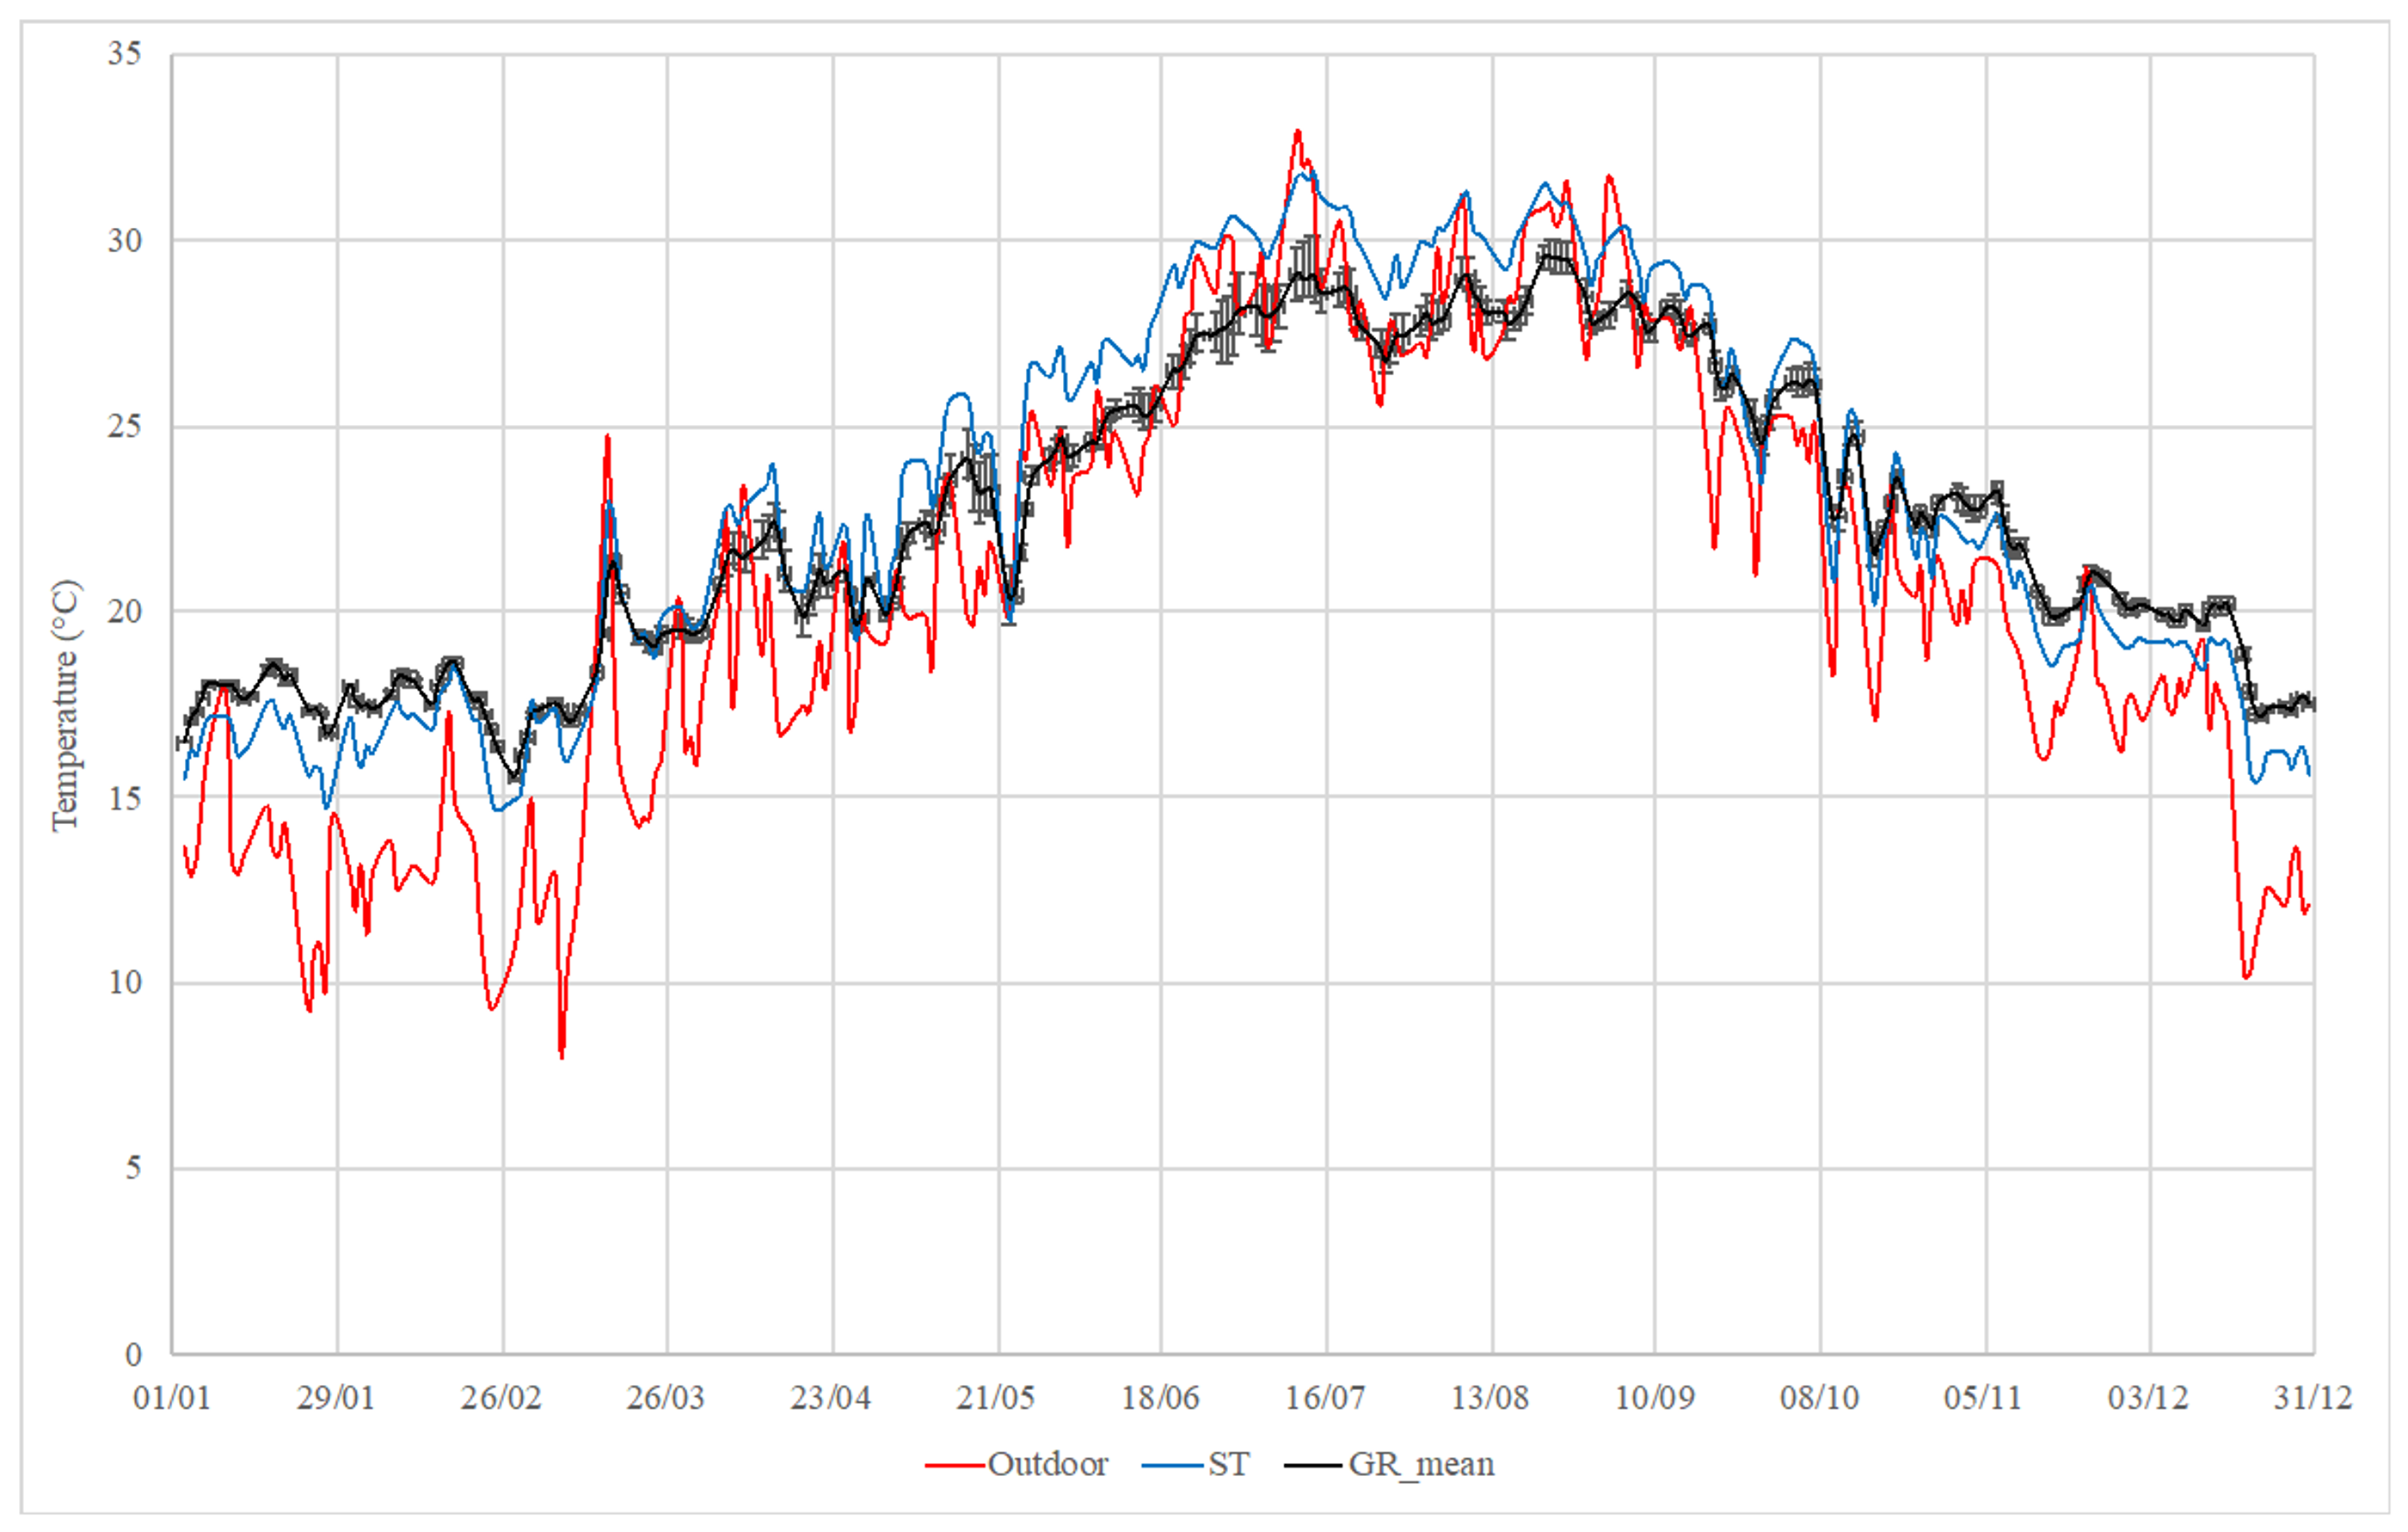
In this section, the results relative to the monitoring campaign and to the energy performance simulations are reported.

3.1. Monitored Data

Table 3 shows the average temperatures measured on the ceiling of each room sited below the green roof’s six plots, for summer (July) and winter (February) conditions, in periods during which the air-conditioning system was working.
The monitoring results point out a general tendency to attain lower temperatures when the green coverage is higher, i.e., P1 (Halimione Portulacoides). Indeed, this plot shows that ceiling temperatures were generally 1–3 °C lower with respect to the other plots in summer and 1–2 °C higher during winter, hence representing a benefit for both the summer and winter seasons.
Moreover, it must be noted that the LAI has a positive influence on the green-roof thermal behaviour; P1 and P6 have, in fact, higher LAI, unlike P3 and P4. In addition, another factor that could have influenced the obtained results is represented by the light colour of the plants’ leaf surface, which enabless a higher amount of solar radiation to be reflected.
The results shown in Table 3 also highlight the influence of the different type of plants. In particular, Halimione Portulacoides (P1 and P6) reduces temperature peaks more consistently. Therefore, this type of plant seems to be more suitable for lowering the summer temperature values and increasing the winter temperature peaks.
Anyway, as reported in Table 3, it should be pointed out that during the summer season, a mean temperature of about 26.6 °C has been recorded by the thermocouples placed on the rooms’ ceilings under P1 (Halimione Portulacoides), with maximum peaks of 27 °C, that lies within the suggested range for the indoor comfort in summer conditions [72]. The same cannot be stated for the other plots, where, even with a 100% green coverage, ceiling temperatures of about 27–28 °C were registered, with maximum peaks going beyond 30 °C.
The above-discussed outcomes demonstrate the importance of selecting a proper plant species during the green roof design phase.
Apart from these considerations, strictly related to the physical characteristics of the green roof, it is also necessary to take into consideration some aspects related to the building features that may have influenced the monitored ceiling temperatures, in particular:
  • the room located underneath the plot P1, facing North, is almost always in the shade (and not often sunlit); therefore, it is likely that the indoor environment is characterized by an air temperature lower than that of the other rooms;
  • the room sited below the plot P4, on the other hand, is subjected both to greater solar radiation levels on the west-faced external wall and to heat released by several refrigerators aimed at the storage of biomass; it is then possible that the temperature inside such a space is constantly higher than that of the other rooms;
  • the sensors located under plots P2 and P3, despite being associated to two different plant species, are located within a single large environment, which could make the distinction of their readings quite difficult;
  • the rooms where the sensors relative to plots P3 and P4 are placed in, border on the left with a small greenhouse that, reasonably, is characterized by a higher air temperature than the outdoor.

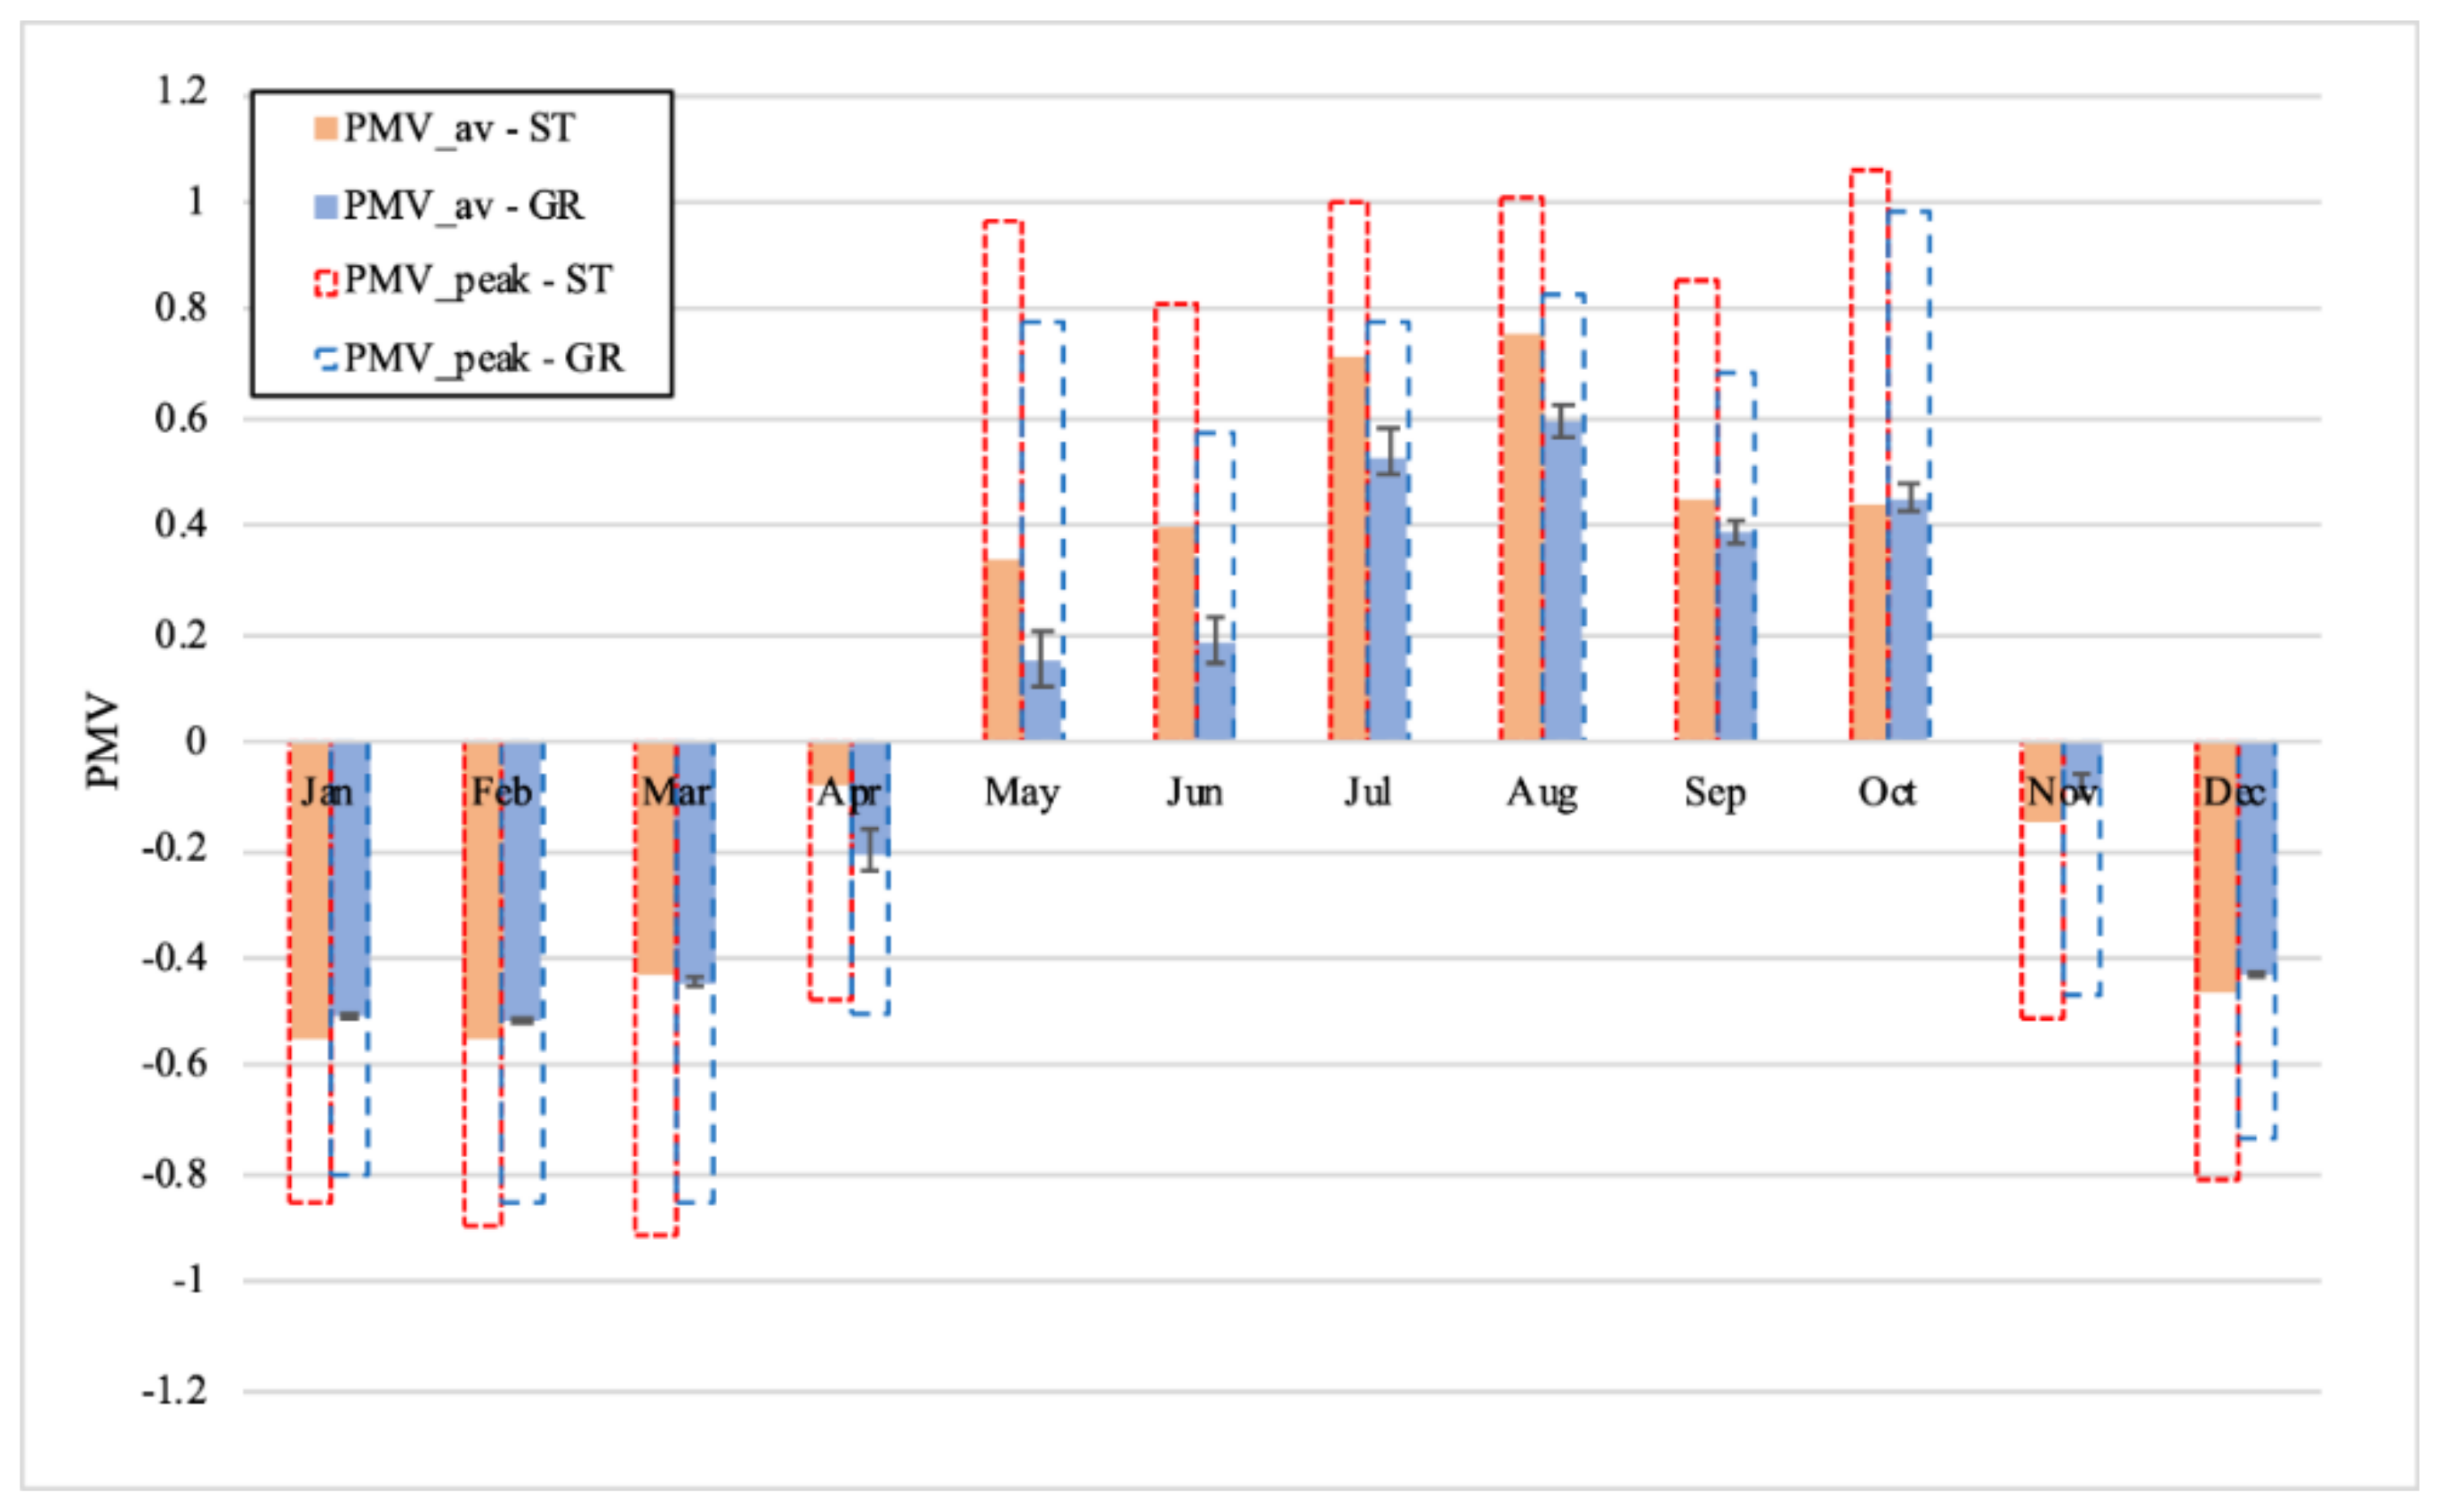
3.2. Outcomes of Energy Simulations

Since the main aim of this work was to assess how the use of green roofs can affect the indoor comfort and the energy consumption of a building, it was decided to report, in the first part of this section, a comparison between the simulation results of Scenario #1 and Scenario #3. In particular, considering that such estimation is affected by the temperature changes during the actual HVAC system operating periods and in light of the detailed schedule utilized to run the simulations, it was chosen to divide the resulting data into two five-days periods representative of winter (Figure 9, on the left) and summer (Figure 9, on the right) conditions. Specifically, in Figure 9, the green lines represent an average of the values obtained for the six plots (Scenario #1), with its relative ranges of variation and the blue lines represent the standard case (Scenario #3); on the other hand, the red lines indicate the HVAC system start-up intervals.
Looking at Figure 9, it can be noted how after an initial start-up phase of the HVAC system, the presence of a green roof during the winter season does not seem to improve the indoor thermal conditions, while during the summer season, it brings a noticeable improvement of the indoor comfort levels. It must be underlined here that the amplitude of the variation range relative to the green roofs’ temperature values is due to the fact that as reported in Section 2.2, the six plots are characterized by different features and therefore, describing parameters; in particular, the type of species and its relative coverage percentage have a strong influence on the monitored temperatures.
The temperature differences noticed also had an impact on the energy consumption. Over the representative five-day periods considered, in fact, a 18% increase for heating needs (220.05 kWh for the standard roof against 259.59 kWh for the green roof) and a 44% saving for cooling needs (189.38 kWh for the standard roof against 106.37 kWh for the green roof) were observed.
As mentioned earlier, after this first comparison, the authors wondered what results would have been obtained by simulating a green roof similar to the real one using the green roof configuration tool provided by EnergyPlus. The second part of this section shows, therefore, a comparison between the results obtained from the Scenario # 1 and Scenario # 2 simulations.
Similarly to the previously reported Figure 9, Figure 10 contains the obtained results for the two five-days periods representative of winter (on the left) and summer (on the right) conditions. In particular, the green lines (Scenario #1) and the red lines (HVAC system start-up intervals) are the same as shown in Figure 9, while the black lines represent an average of the values obtained for the six plots, with the relative ranges of variation, using the Scenario #2 EnergyPlus settings.
By analysing Figure 10, it can be seen how, in the winter conditions, the green roof simulated according to Scenario #2 shows a very similar behaviour to that in Scenario #1, particularly during the air-conditioning working periods. In winter conditions, however, Scenario #2 allows to obtain higher temperatures than Scenario #1, corresponding to a further improvement in the indoor comfort levels. Furthermore, in summer conditions, contrarily to Scenario #1, Scenario #2 shows an evident very variable temperature trend between day and night, typical of a context highly influenced from solar radiation, which does not seem to reflect reality.
As for the fact that the changes of the Scenario #2 temperatures range are much narrower than those in Scenario #1, it must be observed that this is most likely due to the fact that, as previously highlighted, the model used by EnergyPlus does not allow to set all the parameters of the green roof freely but imposes some constraints to their numerical values. Due to this reason, in fact, the Scenario #2 results show no differences relating to the two different thicknesses of water storage used for each species, but only some small differences between the different species.
As for the energy consumption of Scenario #2, over the representative five-day periods considered, a 4% saving for heating needs (220.05 kWh for the standard roof against 212.34 kWh for the green roof) and a 41% saving for cooling needs (189.38 kWh for the standard roof against 112.54 kWh for the green roof) were observed.
Finally, in the last part of this section, it was decided to report a rough estimate, on a monthly basis, relative to both aspects of indoor comfort improvement and energy consumption savings. In this regard, it was chosen to compare the results deriving from the simulations of Scenarios #2 and #3. This choice was suggested due to the fact that, given the intended use of the building (i.e., research laboratory) and its real use (i.e., infrequent), especially in terms of the HVAC system, it was assumed that the results of Scenario #1 were not considered actually representative for a long-term estimate.
Once again, in order to make the results visually more easily readable, an average of the results obtained for the green roof six plots was used to display the results of Scenario #2.
To compare Scenario #2 with Scenario #3 in relation to indoor comfort levels, it was decided to report, in Figure 11, a graph of the monthly temperatures. The graph indeed allows to show the deviations of the average values of the green roof ceiling temperatures (Δtav,ceiling) compared to those of the standard roof, where the black bars represent the range of deviation from the average values.
Figure 11 highlights the positive effects due to the presence of the green roof, which, with respect to the standard roof, allows maintaining higher ceiling temperatures in winter and lower ceiling temperatures during summer.
Other than the temperature, another important indicator when assessing the indoor comfort levels is represented by the PMV (Predicted Mean Vote). For this reason, it was also decided to report, in Figure 12, a comparison between the monthly PMV average and peak values of Scenario #2 (GR) and Scenario #3 (ST).
By looking at the differences in the obtained PMV average values (Figure 12) with and without the presence of the green roof, especially those relative to July and August, it arises that the presence of the green roof reduces PMV average values from more than 0.7 to approximately 0.5. Hence, accordingly to the standard currently in force for the design of the indoor environment, i.e., EN 16798-1:2019 [72], the presence of the green roof contributes to shift the indoor thermal environmental conditions from Category III (acceptable, moderate level of expectations) to Category II (normal level of expectation). In other words, the presence of the green roof contributes to bring the building within comfort conditions (PMV = 0.5), starting from a slight warm condition (PMV = 0.7).
Moreover, by analysing Figure 12, it can also be seen how, although a general positive effect due to the presence of the green roof is evident, some critical issues emerged in the months of April and October (transition months), for which the standard roof seems to perform better than the green roof. This condition, which needs to be better investigated, is probably due to the additional thermal inertia that the presence of the green roof brings to the structure: this slows down the response of the green roof compound to the changes of climatic conditions occurring in the transition periods of the end of spring (April) and the beginning of winter (October).
For the sake of completeness, it was decided to report, in Figure 13, an annual plot where the average daily external temperatures (Outdoor) are compared with those of the ceiling in the presence of the green roof (GR_mean) and with those relative to the standard roof (ST).
Regarding the energy consumptions for heating and cooling needs, these are summarized in Table 4 by reporting the absolute values (kWh) obtained for the standard roof scenario and the correlated average percentage deviations (including the respective variation ranges) relative to the achievable savings due to the green roof presence.
Specifically, for each month, the amount energy consumed for both heating and cooling with and without the presence of the green roof is listed. The use of the bold character is intended to show more easily the actual HVAC working periods, that is December–March for winter conditions and June–September for summer conditions. Therefore, in Table 4, data related to months when the HVAC is working have been highlighted using the colour black. The results confirm the advantage of using green roofs as a solution capable of achieving valuable energy savings.
Moreover, the mean indirect reduction of CO2 emissions due to the green roof installation was 145.6 ± 13.8 tCO2/year, while for the direct reduction, a value of only 56 gCO2/year was observed.
Finally, some further considerations need reporting. When an energy restoration of a roof is in context, such as the one considered in this work, it is easier and safer to add a vegetated coverage to an existing roof than making it larger. That is why here, it was chosen to exclude a theoretical comparison between a green roof and a hypothetical alternative high massive one and to limit the analysis to a specific comparison between the behaviour of the pre-existent standard roof equipping the building and the improvements brought by the installation of the green coverage. For this purpose, the thermo-physical characteristics of the roof are those typical of the building habit of the considered geographical area.
In addition, the benefits of the presence of a green roof cannot be simply evaluated in terms of thermal insulation, since it generates other positive effects regarding the evaporative phenomena and the change of the albedo of the roof. Therefore, it was decided to exclude a comparison with insulated roofs too, in accordance with existing literature studies—such as that by Niachou et al. [73]—demonstrating that the presence of green roof on an insulated roof is practically irrelevant.

4. Conclusions

The capability of green roofs in reducing the electric energy needs for the climatization of buildings and their environmental benefits has been extensively demonstrated in the literature.
The idea behind the presented work derived from considerations regarding the possible influence of green roofs on the indoor thermal comfort levels; that is, instead, an aspect often overlooked when estimating the performance of such building components. Therefore, the analysis methodology approach utilized (partly modelling and partly experimental) was implemented in light of such considerations.
Accurate knowledge of the internal temperatures of the ceiling is indeed an important prerequisite for establishing both achievable indoor comfort conditions and the energy demand for the air conditioning of the building itself. A lowering of the indoor temperatures in summer, and a rise during winter, lead, in fact to an improvement in the comfort levels for the occupants, and consequently, a saving on the use of the HVAC system, which, in turn, translates into a reduction of polluting emissions.
For this purpose, the comparison between Scenario #1 (where the monitored ceiling temperatures were used as boundary conditions) and Scenario #3 (standard roof case), and that between Scenario #2 (where the green roof configuration provided by EnergyPlus was utilized) and Scenario #3, allowed to prove how the presence of the experimental green roof on the monitored building improved the indoor comfort levels during summer by moderating the ceiling temperatures (Figure 9, Figure 10, Figure 11 and Figure 13), despite some worsening during winter periods seeming to occur. Moreover, the temperature differences noticed had also a positive impact on the building energy consumption and the CO2 emissions.
On the other hand, by comparing Scenario #1 with Scenario #2, it was possible to highlight the possible limits of the code’s ability in adequately simulating the green roof behaviour. These limits are mainly represented by the lack of flexibility that EnergyPlus allows in the setting-process of some of the green roof physical parameters and in the way in which the code takes into account the solar radiation components.
Another aspect which should be better investigated, regards the PMV results (Figure 12). In fact, even though, also, in this case, a general positive effect due to the presence of the green roof can be seen, some criticalities emerged during some transition periods, for which the standard roof seems to perform slightly better than the green roof.
In conclusion, the proposed analysis made it possible to highlight how it is possible to assess the impact that green roofs have specifically on the indoor comfort levels, other than on the energy consumption.
Furthermore, the availability of field data put into evidence the importance of adequate simulation tools to facilitate the green roof design and assessment processes.

Author Contributions

All authors contributed equally to the design, experimental analyses and editing of this research. Conceptualization, L.C., M.L.G., G.P., G.R., G.S. (Gianluca Scaccianoce), G.S. (Giancarlo Sorrentino) and S.A.; Data curation, L.C., M.L.G., G.P., G.R., G.S. (Gianluca Scaccianoce), G.S. (Giancarlo Sorrentino) and S.A.; Methodology, L.C., M.L.G., G.P., G.R., G.S. (Gianluca Scaccianoce), G.S. (Giancarlo Sorrentino) and S.A.; Writing—original draft, L.C., M.L.G., G.P., G.R., G.S. (Gianluca Scaccianoce), G.S. (Giancarlo Sorrentino) and S.A.; Writing—review and editing, L.C., M.L.G., G.P., G.R., G.S. (Gianluca Scaccianoce), G.S. (Giancarlo Sorrentino) and S.A. All authors have read and agreed to the published version of the manuscript.

Funding

This research received no external funding.

Conflicts of Interest

The authors declare no conflict of interest.

References

  1. International Energy Agency (IEA). 2018 Global Status Report—Towards a Zero-Emission, Efficient and Resilient Buildings and Construction Sector Global Alliance for Buildings and Construction—UN Environment; International Energy Agency (IEA): Paris, France, 2018. [Google Scholar]
  2. International Energy Agency. CO2 Emissions from Fuel Combustion Highlights; International Energy Agency (IEA): Paris, France, 2017. [Google Scholar]
  3. Tsemekidi-Tzeiranaki, S.; Bertoldi, P.; Labanca, N.; Castellazzi, L.; Serrenho, T.; Economidou, M.; Zangheri, P. Energy Consumption and Energy Efficiency Trends in the EU-28 for the Period 2000–2016; JRC Science for Policy Report; Joint Research Centre (JRC): Brussels, Belgium, 2018. [Google Scholar]
  4. Energy Performance of Buildings. Statistics from European Commission on Energy Performance of Buildings. Available online: https://ec.europa.eu/energy/en/topics/energyefficiency/energy-performance-of-buildings (accessed on 4 September 2019).
  5. European Union. EU Energy in Figures Statistical Pocketbook; European Commission: Brussels, Belgium, 2017. [Google Scholar]
  6. Sustainable Development Goals. Available online: https://www.un.org/sustainabledevelopment/sustainable-development-goals/ (accessed on 4 September 2019).
  7. European Commission. Communication from the Commission Europe 2020. A strategy for Smart, Sustainable and Inclusive Growth; 3 March 2010 COM(2010)2020; European Commission: Brussels, Belgium, 2010. [Google Scholar]
  8. United Nations. Transforming our World: The 2030 Agenda for Sustainable Development; A/RES/70/1; General Assembly. Distr.: General 21 October 2015; United Nations: New York, NY, USA, 2015. [Google Scholar]
  9. European Commission. Communication from the Commission to the European Parliament, the Council, the European Economic and Social Committee and the Committee of the Regions. A Policy Framework for Climate and Energy in the Period from 2020 to 2030; 22 January 2014 COM(2014) 15 final; European Commission: Brussels, Belgium, 2014. [Google Scholar]
  10. European Commission. A Roadmap for Moving to a Competitive Low Carbon Economy in 2050; COM(2011) 112 final; European Commission: Brussels, Belgium, 2011. [Google Scholar]
  11. European Commission. Communication from the Commission to the European Parliament, the European Council, the Council, the European Economic and Social Committee, the Committee of the Regions and the European Investment Bank. A Clean Planet for All a European Strategic Long-Term Vision for a Prosperous, Modern, Competitive and Climate Neutral Economy; 28 November 2018 COM(2018) 773 final; European Commission: Brussels, Belgium, 2018. [Google Scholar]
  12. The European Parliament and the Council. Decision No 1386/2013/EU of the European Parliament and of the Council of 20 November 2013 on a general Union environment action programme to 2020 ‘living well, within the limits of our planet’. Off. J. Eur. Union 2013, L 354/171. [Google Scholar]
  13. The European Parliament and the Council. Directive 2002/91/EC of the European parliament and of the council of 16 December 2002 on the energy performance of buildings. 4.1. Off. J. Eur. Communities 2003, L 1/65. [Google Scholar]
  14. The European Parliament and the Council. Directive 2010/31/EU of the European Parliament and of the Council of 19 May 2010 on the energy performance of buildings (recast) 18.6. Off. J. Eur. Union 2010, L 153/13. [Google Scholar]
  15. European Commission. Commission Delegated Regulation (EU) No 244/2012 of 16 January 2012 supplementing Directive 2010/31/EU on the energy performance of buildings. Off. J. Eur. Union 2012, L 081. [Google Scholar]
  16. Ministero dello Sviluppo Economico; Ministero dell’Ambiente e della tutela del Territorio e del Mare. Italy’s National Energy Strategy (2017); Ministero dello Sviluppo Economico: Rome, Italy; Ministero dell’Ambiente e della tutela del Territorio e del Mare: Rome, Italy, 2017.
  17. Agenzia Nazionale per le Nuove Tecnologie, l’Energia e lo Sviluppo Economico Sostenibile (ENEA). Rapporto Annuale Efficienza Energetica (RAEE) 2019; Agenzia Nazionale per le Nuove Tecnologie, l’Energia e lo Sviluppo Economico Sostenibile (ENEA): Rome, Italy, 2019; ISBN 978-88-8286-382-1. [Google Scholar]
  18. Bisegna, F.; Cirrincione, L.; Casto, B.M.L.; Peri, G.; Rizzo, G.; Scaccianoce, G.; Sorrentino, G. Fostering the energy efficiency through the energy savings: The case of the University of Palermo. In Proceedings of the 2019 IEEE International Conference on Environment and Electrical Engineering and 2019 IEEE Industrial and Commercial Power Systems Europe, EEEIC/I and CPS Europe 2019, Palermo, Italy, 11–14 June 2019. [Google Scholar]
  19. Hens, H. Applied Building Physics. Boundary Conditions, Building Performance and Material Properties; Ernst and Sohn: Berlin, Germany, 2012; ISBN 978-3-433-02962-6. [Google Scholar]
  20. Underwood, C.P.; Yik, H.F.W. Modelling Methods for Energy in Buildings; Blackwell Science: Hoboken, NY, USA, 2004; ISBN 0-63205936-2. [Google Scholar]
  21. Caniato, M.; Gasparella, A. Discriminating people’s attitude towards building physical features in sustainable and conventional buildings. Energies 2019, 12, 1429. [Google Scholar] [CrossRef] [Green Version]
  22. Diaz Lozano Patino, E.; Siegel, J.A. Indoor environmental quality in social housing: A literature review. Build. Environ. 2018, 131, 231–241. [Google Scholar] [CrossRef]
  23. Castaldo, V.L.; Pigliautile, I.; Rosso, F.; Cotana, F.; de Giorgio, F.; Pisello, A.L. How subjective and non-physical parameters affect occupants’ environmental comfort perception. Energy Build. 2018, 178, 107–129. [Google Scholar] [CrossRef] [Green Version]
  24. Sant’Anna, D.O.; Dos Santos, P.H.; Vianna, N.S.; Romero, M.A. Indoor environmental quality perception and users’ satisfaction of conventional and green buildings in Brazil. Sustain. Cities Soc. 2018, 43, 95–110. [Google Scholar] [CrossRef]
  25. Silva, C.M.; Gomes, M.G.M.; Silva, M. Green roofs energy performance in Mediterranean climate. Energy Build. 2016, 116, 318–325. [Google Scholar] [CrossRef]
  26. Shafique, M.; Kima, R.; Rafiq, M. Green roof benefits, opportunities and challenges—A review. Renew. Sustain. Energy Rev. 2018, 90, 757–773. [Google Scholar] [CrossRef]
  27. La Roche, P.; Berardi, U. Comfort and energy savings with active green roofs. Energy Build. 2014, 82, 492–504. [Google Scholar] [CrossRef]
  28. Colmenar-Santos, A.; de Lober, L.N.T.; Borge-Diez, D.; Castro-Gil, M. Solutions to reduce energy consumption in the management of large buildings. Energy Build. 2013, 56, 66–77. [Google Scholar] [CrossRef]
  29. Ascione, F.; Bianco, N.; de’ Rossi, F.; Turni, G.; Vanoli, G.P. Green roofs in European climates. Are effective solutions for the energy savings in air-conditioning? Appl. Energy 2013, 104, 845–859. [Google Scholar] [CrossRef]
  30. Cao, J.J.; Hu, S.; Dong, Q.; Liu, L.J.; Wang, Z.L. Green roof cooling contributed by plant species with different photosynthetic strategies. Energy Build. 2019, 195, 45–50. [Google Scholar] [CrossRef]
  31. Di Lorenzo, D.; Lupo, V.; Peri, G.; Rizzo, G.; Scaccianoce, G. A simple methodology for comparing cost-benefit of traditional, green and cool roofs. In Proceedings of the 13th REHVA World Congress CLIMA 2019, Bucharest, Romania, 26–29 May 2019. [Google Scholar]
  32. Zhang, Q.; Miao, L.; Wang, X.; Liu, D.; Zhu, L.; Zhou, B.; Sun, J.; Liu, J. The capacity of greening roof to reduce stormwater runoff and pollution. Landsc. Urban Plan. 2015, 144, 142–150. [Google Scholar] [CrossRef]
  33. Abhijith, K.V.; Kumar, P.; Gallagher, J.; McNabola, A.; Baldauf, R.; Pilla, F.; Broderick, B.; Di Sabatino, S.; Pulvirenti, B. Air pollution abatement performances of green infrastructure in open road and built-up street canyon environments—A review. Atmos. Environ. 2017, 162, 71–86. [Google Scholar] [CrossRef]
  34. Van Renterghem, T. Green roofs for acoustic insulation and noise reduction. In Nature Based Strategies for Urban and Building Sustainability; Pérez, G., Perini, K., Eds.; Butterworth-Heinemann: Oxford, UK, 2018; Chapter 3.8; pp. 167–179. ISBN 9780128121504. [Google Scholar]
  35. Liu, C.; Hornikx, M. Effect of water content on noise attenuation over vegetated roofs: Results from two field studies. Build. Environ. 2018, 146, 1–11. [Google Scholar] [CrossRef]
  36. Soulis, K.X.; Ntoulas, N.; Nektarios, P.A.; Kargas, G. Runoff reduction from extensive green roofs having different substrate depth and plant cover. Ecol. Eng. 2017, 102, 80–89. [Google Scholar] [CrossRef]
  37. Vijayaraghavan, K.; Reddy, D.H.K.; Yun, Y.-S. Improving the quality of runoff from green roofs through synergistic biosorption and phytoremediation techniques: A review. Sustain. Cities Soc. 2019, 46, 101381. [Google Scholar] [CrossRef]
  38. Yang, J.; llamathy, D.; Kumar, M.; Pyrgou, A.; Chong, A.; Santamouris, M.; Kolokotsa, D.; Lee, S.E. Green and cool roofs’ urban heat island mitigation potential in tropical climate. Sol. Energy 2018, 173, 597–609. [Google Scholar] [CrossRef]
  39. Peri, G.; Rizzo, G.; Scaccianoce, G.; Sorrentino, G. Role of green coverings in mitigating heat island effects: An analysis of physical models. Appl. Mech. Mater. 2013, 261–262, 251–256. [Google Scholar] [CrossRef]
  40. Bevilacqua, P.; Mazzeo, D.; Bruno, R.; Arcuri, N. Surface temperature analysis of an extensive green roof for the mitigation of urban heat island in southern Mediterranean climate. Energy Build. 2017, 150, 318–327. [Google Scholar] [CrossRef]
  41. Köhler, M.; Ksiazek-Mikenas, K. Green roofs as habitats for biodiversity. In Nature Based Strategies for Urban and Building Sustainability; Pérez, G., Perini, K., Eds.; Butterworth-Heinemann: Oxford, UK, 2018; Chapter 3.14; pp. 239–249. ISBN 9780128121504. [Google Scholar]
  42. Francis, L.F.M.; Jensen, M.B. Benefits of green roofs: A systematic review of the evidence for three ecosystem services. Urban For. Urban Green. 2017, 28, 167–176. [Google Scholar] [CrossRef]
  43. Peri, G.; Rizzo, G. The overall classification of residential buildings: Possible role of tourist EU Ecolabel award scheme. Build. Environ. 2012, 56, 151–161. [Google Scholar] [CrossRef]
  44. Porcaro, M.; Ruiz de Adana, M.; Comino, F.; Peña, A.; Martín-Consuegra, E.; Vanwalleghem, T. Long term experimental analysis of thermal performance of extensive green roofs with different substrates in Mediterranean climate. Energy Build. 2019, 197, 18–33. [Google Scholar] [CrossRef]
  45. Tang, M.; Zheng, X. Experimental study of the thermal performance of an extensive green roof on sunny summer days. Appl. Energy 2019, 242, 1010–1021. [Google Scholar] [CrossRef]
  46. Ferrante, P.; La Gennusa, M.; Peri, G.; Rizzo, G.; Scaccianoce, G. Vegetation growth parameters and leaf temperature: Experimental results from a six plots green roofs’ system. Energy 2016, 115, 1723–1732. [Google Scholar] [CrossRef]
  47. Brunetti, G.; Porti, M.; Piro, P. Multi-Level numerical and statistical analysis of the hygrothermal behavior of a non-vegetated green roof in a Mediterranean climate. Appl. Energy 2018, 221, 204–219. [Google Scholar] [CrossRef]
  48. Morakinyo, T.E.; Dahanayake, K.W.D.K.C.; Ng, E.; Chow, C.L. Temperature and cooling demand reduction by green-roof types in different climates and urban densities: A co-simulation parametric study. Energy Build. 2017, 145, 226–237. [Google Scholar] [CrossRef]
  49. Ferrante, P.; La Gennusa, M.; Peri, G.; Scaccianoce, G.; Sorrentino, G. Comparison between conventional and vegetated roof by means of a dynamic simulation. Energy Procedia 2015, 78, 2917–2922. [Google Scholar] [CrossRef] [Green Version]
  50. Li, S.-X.; Qin, H.-P.; Peng, Y.-N.; Khu, S.T. Modelling the combined effects of runoff reduction and increase in evapotranspiration for green roofs with a storage layer. Ecol. Eng. 2019, 127, 302–311. [Google Scholar] [CrossRef]
  51. Heusinger, J.; Sailor, D.J.; Weber, S. Modeling the reduction of urban excess heat by green roofs with respect to different irrigation scenarios. Build. Environ. 2018, 131, 174–183. [Google Scholar] [CrossRef]
  52. Zirkelbach, D.; Mehra, S.R.; Sedlbauer, K.P.; Künzel, H.M.; Stöckl, B. A hygrothermal green roof model to simulate moisture and energyperformance of building components. Energy Build. 2017, 145, 79–91. [Google Scholar] [CrossRef]
  53. Peri, G.; Rizzo, G.; Scaccianoce, G.; La Gennusa, M.; Jones, P. Vegetation and soil—Related parameters for computing solar radiation exchanges within green roofs: Are the available values adequate for an easy modeling of their thermal behavior? Energy Build. 2016, 129, 535–548. [Google Scholar] [CrossRef]
  54. Saiz Alcazar, S.; Olivieri, F.; Neila, J. Green roofs: Experimental and analytical study of its potential for urban microclimate regulation in Mediterranean-continental climates. Urban Clim. 2016, 17, 304–317. [Google Scholar] [CrossRef]
  55. Karteris, M.; Theodoridou, I.; Mallinis, G.; Tsiros, E.; Karteris, A. Towards a green sustainable strategy for Mediterranean cities: Assessing the benefits of large-scale green roofs implementation in Thessaloniki, Northern Greece, using environmental modelling, GIS and very high spatialr esolution remote sensing data. Renew. Sustain. Energy Rev. 2016, 58, 510–525. [Google Scholar] [CrossRef]
  56. Vaz Monteiro, M.; Blanusa, T.; Verhoef, A.; Richardson, M.; Hadley, P.; Cameron, R.W.F. Functional green roofs: Importance of plant choice in maximizing summertime environmental cooling and substrate insulation potential. Energy Build. 2017, 141, 56–68. [Google Scholar] [CrossRef]
  57. Zhao, M.; Tabares-Velasco, P.C.; Srebric, J.; Komarneni, S.; Berghage, R. Effects of plant and substrate selection on thermal performance of green roofs during the summer. Build. Environ. 2014, 78, 199–211. [Google Scholar] [CrossRef]
  58. Marasco, D.E.; Culligan, P.J.; McGillis, W.R. Evaluation of common evapotranspiration models based on measurements from two extensive green roofs in New York City. Ecol. Eng. 2015, 84, 451–462. [Google Scholar] [CrossRef] [Green Version]
  59. Di Lorenzo, D.; Maini Lo Casto, B.; Peri, G.; Rizzo, G.; Scaccianoce, G.; Tambani, C. Enhancing values of roofs albedo for lowering cities air temperature and electric demand of buildings: A simple economic evaluation. In Proceedings of the 10th International Conference on Indoor Air Quality, Ventilation and Energy Conservation in Buildings (IAQVEC 2019), Bari, Italy, 5–7 September 2019. [Google Scholar]
  60. Yin, H.; Kong, F.; Dronova, I.; Middel, A.; James, P. Investigation of extensive green roof outdoor spatio-temporal thermal performance during summer in a subtropical monsoon climate. Sci. Total Environ. 2019, 696, 133976. [Google Scholar] [CrossRef]
  61. Calvino, F.; La Gennusa, M.; Nucara, A.; Rizzo, G.; Scaccianoce, G. Evaluating human body area factors from digital images: A measurement tool for a better evaluation of the ergonomics of working places. Occup. Ergon. 2005, 5, 173–185. [Google Scholar]
  62. Marino, C.; Nucara, A.; Peri, G.; Pietrafesa, M.; Pudano, A.; Rizzo, G. An MAS-based subjective model for indoor adaptive thermal comfort. Sci. Technol. Built Environ. 2015, 21, 114–125. [Google Scholar] [CrossRef]
  63. Lei, K.T.; Tang, J.S.; Chen, P.H. Numerical simulation and experiments with green roofs for increasing indoor thermal comfort. J. Chin. Inst. Eng. 2019, 42, 346–356. [Google Scholar] [CrossRef]
  64. Costa, C.R., Jr.; Cordeiro, J.J.F., Jr.; Omar, A.J.S.; Guiselini, C.; Loges, V.; Silva, G.R., Jr.; Pandorfi, H. Thermal comfort in rural buildings with green roofs. Acta Hortic. 2018, 1215, 291–294. [Google Scholar] [CrossRef]
  65. Di Giuseppe, E.; D’Orazio, M. Assessment of the effectiveness of cool and green roofs for the mitigation of the Heat Island effect and for the improvement of thermal comfort in Nearly Zero Energy Building. Archit. Sci. Rev. 2015, 58, 134–143. [Google Scholar] [CrossRef]
  66. Musy, M.; Malys, L.; Inard, C. Direct and indirect impacts of vegetation on building comfort: A comparative study of lawns, greenwalls and green roofs. Procedia Environ. Sci. 2017, 38, 603–610. [Google Scholar] [CrossRef]
  67. Marino, C.; Nucara, A.; Peri, G.; Pietrafesa, M.; Rizzo, G. A generalized model of human body radiative heat exchanges for optimal design of indoor thermal comfort conditions. Sol. Energy 2018, 176, 556–571. [Google Scholar] [CrossRef]
  68. EnergyPlus. Available online: https://energyplus.net (accessed on 1 November 2019).
  69. La Gennusa, M.; Peri, G.; Scaccianoce, G.; Sorrentino, G.; Aprile, S. A case-study of green roof monitoring: The building of council for agricultural research and economics in Bagheria, (Italy). In Proceedings of the 2018 IEEE International Conference on Environment and Electrical Engineering and 2018 IEEE Industrial and Commercial Power Systems, Palermo, Italy, 12–15 June 2018. [Google Scholar]
  70. Kotsiris, G.; Androutsopoulos, A.; Polychroni, E.; Nektarios, P.A. Dynamic U-value estimation and energy simulation for green roofs. Energy Build. 2012, 45, 240–249. [Google Scholar] [CrossRef]
  71. Cascone, S.; Catania, F.; Gagliano, A.; Sciuto, G. A comprehensive study on green roof performance for retrofitting existing buildings. Build. Environ. 2018, 136, 227–239. [Google Scholar] [CrossRef]
  72. European Committee for Standardization. EN 16798-1:2019—Energy Performance of Buildings—Ventilation for Buildings—Part 1: Indoor Environmental Input Parameters for Design and Assessment of Energy Performance of Buildings Addressing Indoor Air Quality, Thermal Environment, Lighting and Acoustics—Module M1-6—CEN; European Committee for Standardization: Brussels, Belgium, 2019. [Google Scholar]
  73. Niachou, A.; Papakonstantinou, K.; Santamouris, M.; Tsangrassoulis, A.; Mihalakakou, G. Analysisi of green roof thermal properties and investigation of its energy performance. Energy Build. 2001, 33, 719–729. [Google Scholar] [CrossRef]
Figure 1. Site of the installation of the experimental field (source: Google-Earth).
Applsci 10 00893 g001
Figure 2. Trend of the outdoor air temperature during the monitoring period.
Applsci 10 00893 g002
Figure 3. Trend of the outdoor air relative humidity during the monitoring period.
Applsci 10 00893 g003
Figure 4. Trend of the solar radiation during the monitoring period.
Applsci 10 00893 g004
Figure 5. Sketch of the green-roof layers.
Applsci 10 00893 g005
Figure 6. Scheme of the plant species planted in the different sectors.
Applsci 10 00893 g006
Figure 7. The six-plots green coverages system.
Applsci 10 00893 g007
Figure 8. Layout of the building, green roof plots’ arrangement and positions of probes for the temperature measurement.
Applsci 10 00893 g008
Figure 9. Comparison between Scenario #1 (green lines) and Scenario #3 (blue lines) for winter (left) and summer (right) conditions.
Applsci 10 00893 g009
Figure 10. Comparison between Scenario #1 (green lines) and Scenario #2 (black lines) for winter (left) and summer (right) conditions.
Applsci 10 00893 g010
Figure 11. Deviations of the average values of the green roof ceiling temperatures compared to those of the standard roof.
Applsci 10 00893 g011
Figure 12. Monthly PMV average and peak values for Scenario #2 (GR) and Scenario #3 (ST).
Applsci 10 00893 g012
Figure 13. Annual average daily temperatures (i.e. Toutdoor air, Tceiling with GR and Tceiling without GR) trends.
Applsci 10 00893 g013
Table 1. Description of the layers constituting the green roof plot.
LayerElement TypeThickness [cm]Plant Species
1Structural support20Hollow brick
2Waterproofing membrane and root barrier-Bituminous paint
3Drainage layer0.5Polyethylene geo-net, hot-coupled with a no woven geotextile
4Water storage layer10 (P1, P2, P3)Pillows filled with expanded perlite
15 (P4, P5, P6)
5Filter fabric-Geotextile felt, 100%polypropylene calendered
6Growing medium15Pumice, lapillus and peat
7Vegetation layer-Halimione Portulacoides (P1 and P6)
Rosmarinus Officinalis Prostratus (P2 and P5)
Crithmum Maritimum (P3 and P4)
Table 2. Description of the layers constituting the green roof plot.
ParametersPlots
P1P2P3P4P5P6
Water storage layer thickness (cm)151515101010
Height of Plants (m)0.350.280.120.120.220.30
Leaf Area Index (-)4.02.81.20.92.33.8
Leaf Reflectivity (-)0.190.180.170.200.210.21
Substrate total thickness (m)0.300.300.300.250.250.25
Thermal conductivity of dry soil (W/m∙K)0.07380.07380.07380.08160.08160.0816
Density of dry soil (kg/m3)530530530446446446
Specific heat of dry soil (J/kg∙K)105010501050106010601060
Table 3. Monitoring results of the green roofs six plots.
PlotsPlant SpeciesWater Storage Layer Thickness (cm)Maximum Green Coverage (%)Tavg (°C) of the Ceiling
FebruaryJuly
P1Halimione Portulacoides10100%18.1 ± 2.126.6 ± 0.2
P2Rosmarinus Officinalis Prostratus1085%16.0 ± 1.827.5 ± 0.9
P3Crithmum Maritimum1058%15.8 ± 1.426.9 ± 1.1
P4Crithmum Maritimum1538%17.9 ± 1.230.8 ± 0.8
P5Rosmarinus Officinalis Prostratus15100%17.6 ± 1.228.5 ± 0.6
P6Halimione Portulacoides15100%19.0 ± 1.128.2 ± 0.3
Table 4. Monitoring results of the green roofs six plots.
Standard Roof
(kWh)
Green Roof
(% Savings)
JanHeating655.117.9 ± 1.7%
Cooling0
FebHeating610.612.5 ± 1.8%
Cooling0
MarHeating409.92.2 ± 3.5%
Cooling0
AprHeating15.9−43.6 ± 34.3%
Cooling0
MayHeating4.42.1 ± 24.2%
Cooling0
JunHeating0
Cooling239.650.1 ± 9.8%
JulHeating0
Cooling534.228.7 ± 7.4%
AugHeating0
Cooling630.024.7 ± 4.9%
SepHeating0
Cooling323.120.4 ± 4.7%
OctHeating2.062.9 ± 6.7%
Cooling45.933.0 ± 10.7%
NovHeating69.559.3 ± 7.0%
Cooling0
DecHeating429.826.4 ± 2.5%
Cooling0

