Featured Application
Mission management for cooperative autonomous robotics.
Abstract
In recent years there has been an increasing interest in the use of autonomous underwater vehicles (AUVs) for ocean interventions. Typical operations imply the pre-loading of a pre-generated mission plan into the AUV before being launched. Once deployed, the AUV waits for a start command to begin the execution of the plan. An onboard mission manager is responsible for handling the events that may prevent the AUV from following the plan. This approach considers the management of the mission only at the vehicle level. However, the use of a mission-level manager in coordination with the onboard mission manager could improve the handling of exogenous events that cannot be handled fully at the vehicle level. Moreover, the use of vehicle virtualization by the mission-level manager can ease the use of older AUVs. In this paper, we propose a new mission-level manager to be run at a control station. The proposed mission manager, named Missions and Task Register and Reporter (MTRR), follows a decentralized hierarchical control pattern for self-adaptive systems, and provides a basic virtualization in regard to the AUV’s planning capabilities. The MTRR has been validated as part of the SWARMs European project. During the final trials we assessed its effectiveness and measured its performance. As a result, we have identified a strong correlation between the length of mission plan and the time required to start a mission (). We have also identified a possible bottleneck when accessing the repositories for storing the information from the mission. Specifically, the average time for storing the received state vectors in the relational database represented only 18.50% of the average time required for doing so in the semantic repository.
1. Introduction
The use of autonomous underwater vehicles (AUVs) for marine interventions has attracted increasing interest in recent years from ocean scientists, marine industries and the military [1,2,3]. However, the use of this kind of robotic system for underwater operations faces a series of challenges that include: the power required to operate them, the constrained nature of underwater communications, the limited perception capabilities of the aforementioned systems, the lack of an underwater positioning system, and the reduced scope of existing underwater maps and the need for autonomous adaption to achieve a certain degree of delegation [1].
This latter delegation challenge has usually been tackled by defining a sequence of tasks assigned to an AUV, and known as a mission plan [4,5]. In the early uses of AUVs, the mission plan was typically created manually by human operators, being replaced recently by the use of deterministic planning algorithms [3]. The full mission plan is typically loaded into the AUVs to be launched, either from an onshore facility or a support vessel. Once loaded into each AUV, the mission plan is usually referred to as a vehicle plan (for single AUV missions it may still be called the mission plan). Then the AUV is transferred to the launching point, and once it is deployed on the sea surface, it is kept idle until the reception of the start command to begin the mission [2,6].
The AUV is then responsible for executing the tasks in the pre-loaded vehicle plan in the given order. In consequence, when an event that prevents the execution of a given task occurs, the plan is considered as broken. The most basic AUVs will then abort the mission, and use fail-safe mechanisms to navigate to a previously defined recovery location. Most up-to-date AUVs can improve the response by including an onboard planner that is capable of performing some adaptive planning techniques [7,8], like trying to repair the plan [9,10,11], or just making a new one [10]. This behavior, that can be part of a subsumption approach [12], introduces the use of self-adaptive models at the vehicle level, like the Observe, Orient, Decide, Act (OODA) loop [13] used in the Intelligent Control Architecture (ICA) proposal [14,15], the Sense-Plan-Act [12] that inspired the Teleo-Reactive EXecutive architecture (T-REX) proposal [16,17], the Event-Condition-Action [18], and the autonomic manager model [18,19], better known as MAPE-K due to its four functional parts (Monitor, Analyze, Plan, Execute), and the use of shared knowledge among them.
However, exogenous events beyond the control of the vehicles can affect the preconditions of some tasks in the plan, or even produce a deviation in the outcome of a running action [20]. In these cases, even the self-adaptive capabilities of the AUVs may not be enough to solve the situation. Thus, the vehicle plan must still be aborted, and when a mission uses multiple AUVs, this can lead to aborting the full mission plan.
In the literature reviewed in Section 2 we have found that once the mission plan has been loaded into the vehicles, the mission management is usually considered only at the vehicle level. This means that when a vehicle plan fails, the rest of the AUVs participating in a multiple-vehicle mission remain oblivious to the problem. Adding a mission manager at an upper layer can be useful for handling these situations in multiple vehicle missions.
Another issue that we have found is that typically each proposal is aimed at the use of a specific vehicle or a set of vehicles with the same capabilities regarding the supervision and execution of a vehicle plan. This implies that there is no consideration for the reuse of older AUVs with fewer capabilities. The use of a virtualization model within the upper layer mission manager can enable the integration of legacy systems in new missions.
In summary, the issues introduced in the previous paragraphs indicate a research gap with regards to the following statements:
- Adaptation is mostly delegated to the vehicles. There is a lack of consideration of the use of a distributed adaptation including a global mission manager.
- Vehicles’ capabilities are typically tightly coupled to the architectures, specifically in regard to mission management at the vehicle level. There is a lack of consideration to the use of vehicles with heterogeneous mission-management capabilities.
- In underwater interventions, the mission plan is typically loaded into the vehicles before being launched. Consequently, there is also a lack of consideration to the possibility of online transferring of the mission plan to the vehicles.
The purpose of this paper is to propose a new mission manager component designed and developed for the SWARMs middleware [21] as part of the efforts of the SWARMs European research project [22]. This mission manager has been designed and developed to be run in a computer at a control station, and not in the vehicles, using the managing-managed subsystem approach from MAPE-K [23] where the AUVs, as the managed subsystems, have also their own self-adaptive capabilities. This approach follows a hierarchical control pattern for decentralized control in self-adaptive systems [23]. The proposed mission manager also includes a basic virtualization of the planning capabilities of the AUVs participating in a mission, enabling the simultaneous use of AUVs with and without onboard planners.
Besides, instead of the typical pre-loading of the full mission plan into the AUVs before their deployment, in SWARMs the AUVs are pre-launched and remain in stand-by on the sea surface waiting for the reception of their first task in the mission plan. Then, the proposed mission manager dispatches the assigned tasks to the AUVs one by one. At that moment, the AUV starts the execution of the received tasks and the next one is dispatched by the mission manager as it receives the progress notifications of the current one.
In summary, the proposed mission manager fills the gaps previously mentioned by:
- Using a hierarchical control pattern for decentralized control, that is novel in the use of mission management architectures for cooperative autonomous underwater vehicles.
- Designing a virtualization approach related to the mission planning capabilities of the vehicles.
- Using an online dispatching method for transferring the mission plan to the AUVs.
The proposed mission manager was validated for the SWARMs project during its final trials. The results obtained from the performance analysis carried out during the trials show the effectiveness of this approach, and have also provided some interesting results that have allowed us to identify a strong correlation between the mission plan length and the time required to start a mission (), as well as a possible bottleneck in the accessing to the repositories to store the live status vectors received from the AUVs during a mission.
The rest of this paper is organized as follows. Section 2 presents some related works related to mission management architectures for AUVs and identifies the open issues that are covered by the proposed mission manager. Section 3 provides a brief description of the SWARMs architecture and the components and information models related to the mission manager proposal. Section 4 describes the proposed mission manager that has been designed, developed and validated in the SWARMS European research project. Section 5 describes the validation methodology that was used for the proposed mission manager. Section 6 presents and discusses the results from the validation. Finally, Section 7 includes the conclusions obtained from the validation, and discusses some possible future work.
2. Related Works
As an early effort in the definition of a control system for an AUV, Rødseth proposed in [24] an object-oriented system for AUV control called Administrative System for AUV Control Software (ASACS). The ASACS architecture focused on the control at the vehicle level, and included a plan dispatch subsystem, also called captain in the proposal, responsible for activating the items from the mission plan, that is, the tasks (or actions) that are part of it. This work has been used as a reference for other architectures, like the hybrid Command and Control (C2) architecture proposed in [25,26]. In this later work, the authors borrowed “captain” idea from the ASACS proposal, and included it at the supervisory level of a three-layer architecture, being responsible for the start, coordination, supervision and control of the execution of the mission. The captain is in direct connection with the Executive Officer component at the mission level, which is responsible for the interpretation of the mission plan provided by the Captain and passing to the Navigator component the required actions according to the plan.
In [27], the authors proposed a Mission Management System (MMS) to guide the AUV Martin [28] during the execution of preprogrammed survey missions. The proposed MMS consisted of a group of modules, including a mission control module named “Captain”, and a mission execution module for controlling the execution of the mission plan. In this proposal the mission control is in charge of starting and stopping a mission, triggering the re-planning when needed and applying the emergency procedures. The mission execution module receives the detailed parts of the plan and sends the required commands to the navigator module.
T-REX [16,17], developed by the Autonomy Group at the Monterey Bay Aquarium Research Institute (MBARI), was conceived of as a goal-oriented system with embedded automated planning and adaptive execution. It was essentially inspired by the sense-plan-act [12] adaptive model, using concurrent control loops to respond to exogenous events, and to distribute the deliberation process among the components of a T-REX agent. A T-REX agent is defined as the coordinator of a group of concurrent control loops, where each control loop is in a teleo-reactor (or just reactor) that encapsulates the details of its internal logic. Some examples of a T-REX system include a mission manager reactor, defined as a reactor that provides the high-level directives to satisfy the scientific and operational goals for the mission. In an example of a T-REX integrated system design [29], the authors proposed a mission manager reactor to receive the goals from the operator. In this example, the mission manager reactor may generate a plan from the goals and send the generated plan to a navigator reactor its own goals. Also, an executive implementation of T-REX has been developed for the Robot Operating System (ROS) platform [30].
The Generic Executive Reactor (GER) [31], based on T-REX, is a module designed for autonomous controllers intended to be generic to be adaptable to any robotic platform. Its functionality is restricted to the dispatching of the goals from upper reactors to the robotic platform, and it has been tested for simulated UAVs and real unmanned ground vehicles (UVGs).
The Reconfigurable AUV for Intervention missions project (RAUVI) [32] served for the proposal of a distributed architecture as a result of the combination of two pre-existing architectures with a mission control system (MCS) [33]. In this proposal, a human operator with the role of a mission programmer uses a graphical interface to generate a mission plan expressed in XML using a mission control language (MCL) [34,35]. The generated mission plan is then parsed by a MCL compiler that generates a Petri Net and the result, once adapted to the specific architecture, is loaded into the vehicle, which is responsible for its complete execution.
The ICA [14] was proposed as part of the works developed in the TRIDENT project [36] for the research of new methodologies for multipurpose underwater intervention tasks. The ICA architecture followed a typical three-layer architecture, where a mission plan consisting of a hierarchy of goals is managed at the deliberative layer. The mission plan is delivered to module named Mission Spooler at the executive layer. This module identifies the available agents, and using a Service Matchmaker module it establishes the relations between goals and services, and then it dispatches the goals to the agents that provide those services at the behavioral layer. ICA also uses a decision-making cycle defined as an OODA loop [13,15].
As described so far, mission management architectures proposed for AUV management are considered mainly at the vehicle level. Indeed, in [6] it is specified that, for the automation part, a pre-programmed mission shall be stored previously in the AUV and that the execution shall begin after a starting order. In other published surveys exploring mission planning and management systems for AUVs, we have found the same pattern [37,38].
In conclusion, architectures for the management of missions for multiple autonomous maritime vehicles do not consider the mission management from the command and control station, and thus do not provide:
- A distributed self-adaptive system where the deployment of self-adaptive controls is both on the managed and the managing subsystems [23]. The usual solution is to use self-adaptive mechanisms only at the vehicle level.
- A virtualization of the vehicle capabilities.
- An online mission plan dispatching mechanism running from a central mission manager.
3. Overview of the SWARMs Architecture
In order to have a better grasp of the proposed mission manager, we will introduce an overview of the SWARMs architecture [21] in this section, paying special attention to the used components and information models.
3.1. The SWARMs Architecture
Figure 1 shows an overview of the SWARMs architecture. At the top layer we find the application layer where two applications were developed:
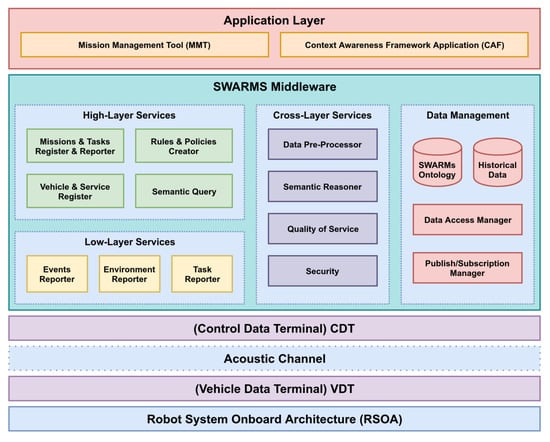
Figure 1.
SWARMs architecture overview.
- A Mission Management Tool (MMT), used by a human operator to supervise the global mission, to track the situational changes, and to generate the mission plan.
- A Context Awareness Framework (CAF) application, used to provide a visual interface to the context awareness to a human operator.
The applications at the application layer interact directly with the SWARMs middleware. Located between the communication network with the vehicles and the application layer, the middleware is responsible for:
- Centralize the communications.
- Serve as a mission executive, providing execution and control mechanisms.
- Define a common information model.
- Use a semantic management.
- Provide a registry of all available vehicles and services.
- Track and report the progress status of a mission.
- Define mechanisms and functionalities for understanding the surrounding environment of the vehicles participating in a mission.
- Define mechanisms for data validation.
With that into consideration, the SWARMs architecture follows a hierarchical control pattern for decentralized self-adaptive control [23].
Finally, to make transparent the SWARMs Data Distribution Service (DDS) communication through the acoustic network between the Command and Control Station (CCS) where the middleware will be running and the vehicles, two interface modules are used [39,40]:
- The Control Data Terminal (CDT), that provides an interface between the middleware components at the CCS and the acoustic communication system used to communicate with the vehicles.
- The Vehicle Data Terminal (VDT), that provides an interface between the communication system and the vehicle.
Among all the components in the SWARMs middleware, the proposed mission manager, called here Missions and Tasks Register and Reporter (MTRR), is the component responsible for the treatment and supervision of all the mission related interactions within the middleware. In a general overview, it is responsible for mediating between a MMT application, used by a human operator to generate the mission plan and supervise the mission progress, and a DDS [41] used as the paradigm of communications with the vehicles participating in a mission [21]. In the middleware, the MTRR interacts with the Semantic Query from the high-level services block, with the Publish/Subscription Manager component from the Data Management and with all the three reporter components from the Low-level Services block. It also makes use of the mission plan structure defined in the SWARMs information model [42]. The following subsections give a brief description of the components interacting with the MTRR and the mission plan model being used.
3.1.1. The Semantic Query Component and the Data Repositories
There are several repositories defined in SWARMs:
- A semantic ontology has been created for the SWARMs project, as described in [42]. This ontology defines a common information model that provides a non-ambiguous representation of a swarm of maritime vehicles and missions. It is also in charge of storing the information obtained from different domains, including mission and planning, and environment recognition and sensing among others. Besides the information model, the ontology is also used to store the last updated values, as they are also used automatically to infer events by means of the use of semantic reasoners [43,44,45].
- In order to perform requests on the SWARMs ontology, Apache Jena Fuseki has been utilized, as it can provide server-like capabilities for resource storage, along with the protocols used for the SPARQL Protocol and RDF Query Language (SPARQL) queries needed to retrieve data from the SWARMs ontology. The combined Fuseki server sending SPARQL requests to the SWARMs ontology that is accessed and the ontology itself are referred in this manuscript as the semantic repository. There are several reasons for having chosen Fuseki as the way to interact with the ontology. To begin with, it offers the SPARQL 1.1 Protocol for queries and updates, which enable for an easier access to the ontology. Secondly, by having a server with a web-based front end, data management and monitoring of the ontology status becomes easier. Lastly, specific resources can be provided to server in terms of, for example, memory allocation, thus making it more flexible to execute depending on the capabilities of the hardware that runs it. It must be noted that the MTRR has been conceived to send and store information used for mission planning, execution and data retrieval and is oblivious to the ontology that is used for this purpose, due to the fact that the MTRR has been designed, implemented and tested as software capable of sending information to an ontology, regardless of which one is used. Development works strictly related to ontologies and ontologies for underwater vehicles can be tracked in [42].
- A historical data repository that allows to have a record of the progress of the missions, and to be used by decision-making algorithms to compute the recommended choices using the information from past situations. As it was expected that the volume of the historical data would be large, it was decided to use a relational database for this repository instead of the ontology.
The access to both repositories from the proposed MTRR is done through the Semantic Query component. This component abstracts the use of the Data Access Manager component for inserting and retrieving information for any of the repositories. Even though the name suggests that all the queries requests sent to it will be semantic and, therefore, related to the ontology, in fact it provides the methods for accessing both the ontology and the relational database. It also provides a high-level interface to the application layer so the applications can forward the queries they need.
3.1.2. The Publish/Subscription Manager Component
The Publish/Subscription Manager is a DDS-based component responsible to provide reliable non-blocking communications between the middleware and the underwater vehicles. It uses a publish/subscribe paradigm for data communications, generating and managing a collection of DDS topics. A detailed description of how DDS communications are managed in SWARMs is given at [21].
3.1.3. The Reporters
The reporters are located at the low-level services section of the middleware and are in charge of receiving the raw data from the vehicles through the DDS Manager, processing the data to generate a report and delivering the report to the MTRR. The procedure followed is:
- The Task Reporter receives the data regarding the status of the tasks being executed in a mission carried out by a vehicle, generates the corresponding report, and dispatches the report to the MTRR for further processing.
- The Environment Reporter receives the environmental data that the vehicles publish periodically to the DDS Manager, generates the corresponding report, and dispatches the report to the MTRR for further processing.
- The Event Reporter receives the events published by the vehicles to the DDS Manager, generates the corresponding report, and dispatches the report to the MTRR for further processing.
3.2. The Mission Plan
The SWARMs ontology [42] defines a mission plan as a “sequence of scheduled low-level tasks (operator and vehicle level tasks) that need to be carried out to achieve a mission, with dependencies between tasks and approximate time duration”. Figure 2 illustrates the SWARMs ontology for mission and planning.
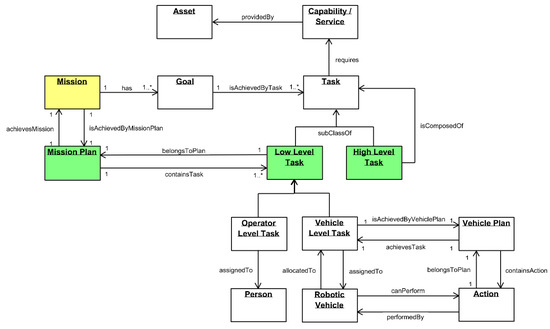
Figure 2.
The SWARMs mission and planning ontology.
The mission plan is generated at the MMT using one of the available high-level planners [46,47,48], and sent to the MTTR through an Apache Thrift [49,50] interface using an ad hoc format whose structure is shown in Figure 3.
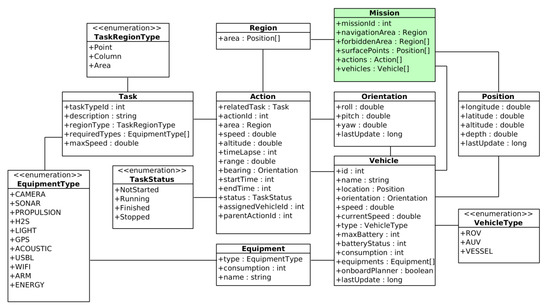
Figure 3.
Structure of a SWARMs mission plan.
Each mission plan is identified by its missionId, and consists of a hierarchical list of actions and the list of vehicles participating in the mission. The rest of the attributes shown in Figure 3 are only used at the MMT to feed the planners with the areas and points of interest for a mission.
Every action in the action list is assigned to a vehicle. They can also have a parent action, forming a hierarchical structure where the high-level actions are those without a parent, and the low-level actions are the vehicle-level tasks from the SWARMs ontology. A graphical depiction of this structure is shown in Figure 4. In this figure we can see a mission plan including three AUVs named NTNU, PORTO 1 and PORTO 2. For each AUV, we have a two-level hierarchical mission plan.
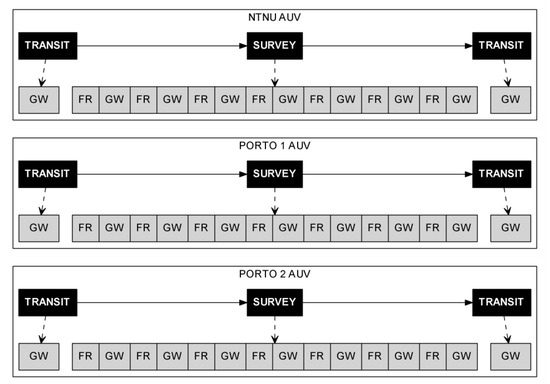
Figure 4.
Example of a mission for three autonomous underwater vehicles (AUVs) named NTNU, PORTO 1 and PORTO 2. In this figure GW refers to the low-level task GOTO-WAYPOINT, and FR, refers to the low-level task FOLLOW_ROW.
For instance, the mission plan corresponding to the NTNU AUV in Figure 4 has a high-level plan consisting of three high-level tasks, starting with a TRANSIT, followed by a SURVEY and finishing with another TRANSIT. And the low-level plan consists of splitting the high-level tasks into low-level ones: both TRANSIT high-level tasks are split in one GOTO_WAYPOINT low-level task each; the high-level SURVEY is decomposed in a sequence of FOLLOW_ROW and GOTO_WAYPOINT low-level tasks.
The vehicles in SWARMs may be equipped with an onboard planner, meaning that these vehicles are capable of understanding high-level tasks and generating the required low-level tasks. In consequence, only one of the two levels of the hierarchy needs to be dispatched to the vehicles: the high-level tasks when the vehicles have an onboard planner and the low-level tasks otherwise.
4. Description of the Missions and Tasks Register and Reporter (MTRR)
In a general sense, the MTRR is responsible for the mission execution and control at the middleware layer. From top-down, the MTRR receives the mission plan generated at the MMT, processes it and dispatches the tasks to the corresponding vehicles, storing the mission-related information in the SWARMs repositories. From bottom-up, the MTRR receives the reports from the vehicles participating in a mission, processes and stores them into the SWARMs repositories, and if required, notifies the MMT about events of interest. In a more detailed description, these are the functionalities defined for the MTRR:
- Mission information retrieval. The different parameters that are fixed at the MMT in the mission plan as a way to establish what kind of plan will be executed or what maritime vehicles should be involved are transferred to the MTRR. Those parameters are: coordinates of the area to be inspected or surveyed, stages of the plan to be executed (going to a specific point, having an autonomous vehicle executing a particular trajectory) or transferring back to the MMT data about the mission progress.
- Mission status collection. The MTRR provides information to the high end of the system regarding what stages of the mission were completed. Depending on the actions to be carried out by the vehicles, high-level tasks such as “SURVEY” (used by the AUV to maneuver in a land mower pattern), “TRANSIT” (used to go to a coordinate) or “HOVER” (used by Autonomous Surface Vehicles to navigate the surface of an area to be surveyed in a circular pattern) will need to be sent. Missions are created following a sequential order for the tasks to be executed, so each of those tasks will be sent to the vehicles through the MTRR, which will notify when they are completed. Also, the MTRR is in charge of sending the “ABORT” signal to the vehicles when the mission has to be finished abruptly due to any major reason.
- Information storage invocation. Data about how vehicles have progressed in a specific mission are retrieved via state vectors that contain, among other pieces of information, their location, speed, depth or altitude from the seabed, according to a data format specifically developed for the project [51]. The MTRR invokes the necessary operations that involve other software components in the middleware responsible for storing the data gathered. In this way, the MTRR makes the information available for all the other applications that require the data to perform their actions, such as the context awareness component (used to assess the level of danger in certain situations) or a plume simulator (which would simulate information about salinity concentration during a pollution leak event).
As anticipated in Section 3.1, the MTRR is a software component with close interactions with other parts of the SWARMs architecture. Those that are most notorious are related to the MMT, but there are also other components that make use of the information retrieved to perform their own functionalities. While these other components are usually not directly involved in the execution of missions, they provide several functionalities to the overall middleware architecture and rely in a critical manner on the MTRR. These interactions have been further summarized in Table 1.

Table 1.
Relations between the Missions and Tasks Register and Reporter (MTRR) and other middleware components.
A Unified Modeling Language (UML) perspective of these relations has been depicted in Figure 5. Note that each of the locations of the middleware components that interact with the MTRR has also been included as well so there is a better understanding on the application domain of their functionalities.
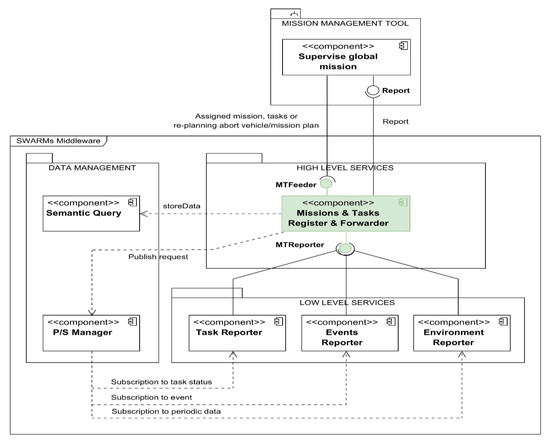
Figure 5.
MTRR-centered SWARMs components diagram.
Additionally, it is shown in Figure 6 how the different interfaces and classes of the component have been designed and implemented. There are two interfaces, MTReporter and MTFeeder, which define the methods that must be used to transfer the information to the components responsible for reports (which require either raw or processed data and an identifier for the mission that is taking place) in case of the former, and what kind of actions are to be expected from missions for the latter. Some other classes are used for information parsing regarding vehicle information and data format (like MissionParser and MessageFormater), whereas other ones are used to compare actions of local or global nature (that is to say, ActionComparator and ActionComparatorGlobal). An additional class called ThriftCientToMMT is used to interface the Mission Management Tool, whereas MessageCONSTANTS and MTRRException are support classes that are used to include constants and throw exceptions when required.
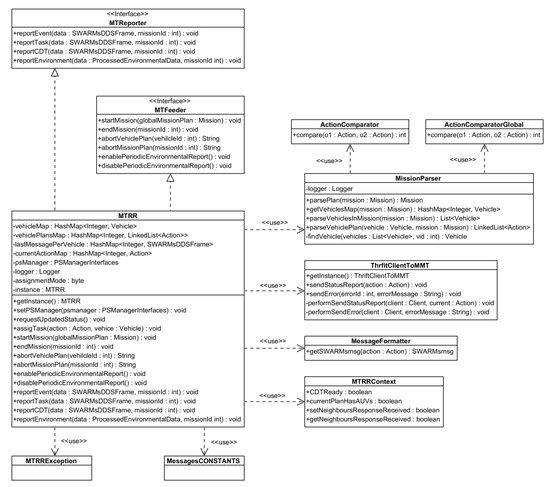
Figure 6.
MTRR component class diagram.
4.1. Autonomous Underwater Vehicle (AUV) Virtualization at the MTRR
Virtualization can be defined as the creation of a virtual representation of physical entities, including hardware platforms like AUVs. The Internet of Things Architecture (IoT-A) reference model provides an interesting domain model that includes the virtualization of physical entities by associating their capabilities to resources that are exposed as service [52]. Figure 7 illustrates this part of the IoT-A domain model.
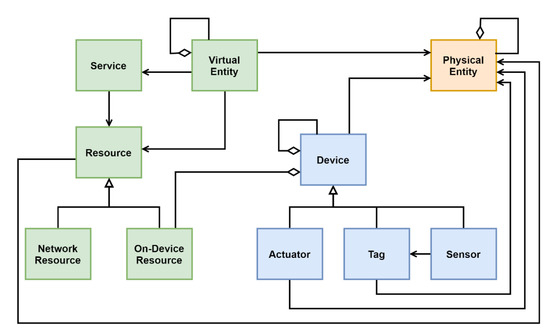
Figure 7.
Internet of Things Architecture (IoT-A) domain model restricted to the virtual representation of a physical entity [52].
In the MTRR we have adopted internally a similar approach for the AUVs and unmanned surface vehicles (USVs) used in a mission. Figure 8 shows an overview of the internal virtualization used.
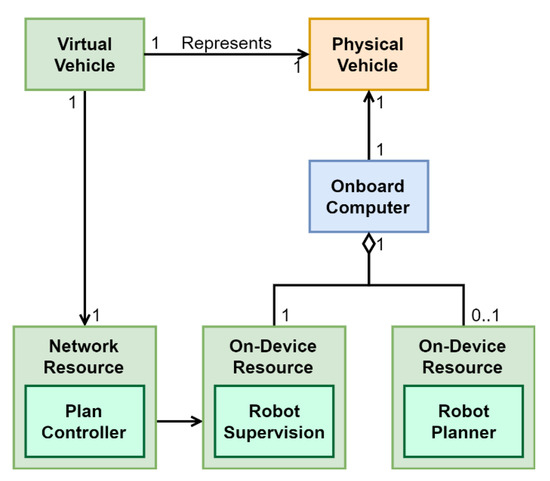
Figure 8.
Overview of the vehicle virtualization used at the MTRR.
The physical vehicle has an onboard computer. In this onboard computer there is a software robot supervision module and depending on its capabilities, a robot planner module. On the other hand, running inside the MTRR (hence identified as a “network resource” following the IoT-A terminology), there is the “plan controller”, accessed as a part of the virtual vehicle that represents the physical one.
The virtual representation of a vehicle is created when the MTRR receives a new mission plan. As part of the start mission procedure, the MTRR parses the vehicles assigned to the mission, and extracts its corresponding mission plan, creating an internal virtual representation. The purpose of this virtualization is to abstract the dispatcher part of the MTRR regardless of whether the vehicles have an on-board planner or not. In this way, the dispatcher part of the MTRR only has to request to dispatch the next task in the plan for the virtual representation of the vehicle, and it is this virtual representation that is responsible for selecting if it has to follow the high-level or low-level tasks of the corresponding part of the mission plan.
4.2. Activities Performed by the MTRR
The MTRR performs the following activities:
- Starting a mission.
- Receiving and recording mission status reports.
- Receiving and recording environmental reports.
- Receiving and recording events reports.
- Aborting a mission.
These activities are discussed in detail in the following sub-sections.
4.2.1. Starting a Mission
Figure 9 shows the functional overview of the start of a mission within the SWARMs architecture. From the MTRR point of view, the start of a mission begins when it receives a new mission plan from the MMT (step 1). After verifying that the plan is valid and parsing it into the corresponding vehicle plans, the MTRR stores the information in the SWARMs repository (both historic data at the relational database and semantic data at the ontology) through the Semantic Query component (step 2). Then the MTRR publishes the mission plan to the DDS through the Publish/Subscription Manager component (step 3), and it is finally delivered to the vehicles (step 4).
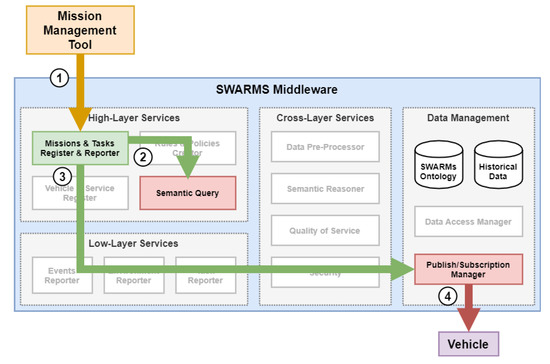
Figure 9.
Functional overview of the start of a mission.
Internally, when the MTRR receives a new mission from the MMT, it performs the following actions in the given order.
- Validation of the mission plan.
- Storage of the reference coordinates into the semantic repository (that is, the ontology via Fuseki server).
- Storage of the mission plan into the semantic repository.
- Parsing the vehicles assigned to the mission plan.
- Storage of assigned vehicles into the semantic repository.
- Subscription to vehicles events.
- Parsing the actions assigned to each vehicle in the mission plan.
- Publication of the first assigned action for each vehicle in the SWARMs DDS partition.
The validation of the mission plan (activity 1) is just the sequence of verifications depicted in Figure 10. In essence, the validation just checks if there is no other active mission, if the mission is not empty, if it has a plan, and finally if it has assigned vehicles. If the validation is passed, then the corresponding new mission ID is stored in the P/S Manager.

Figure 10.
Flow diagram for the plan validation undertaken at the MTRR.
Once the validation result has been positive, the MTRR stores the relevant information in the ontology using the methods provided by the Semantic Query component (activities 2 and 3). Afterwards, the MTRR checks if the vehicles statuses have been updated, and if not, it requests them for an update. Usually this request has been made previously by the MMT, just before making a new plan and through the proper MTRR service created for that. After the MTRR confirms that the vehicles statuses are updated, it subscribes itself to the events from them (activity 6). This part of the startMission method is depicted in Figure 11.
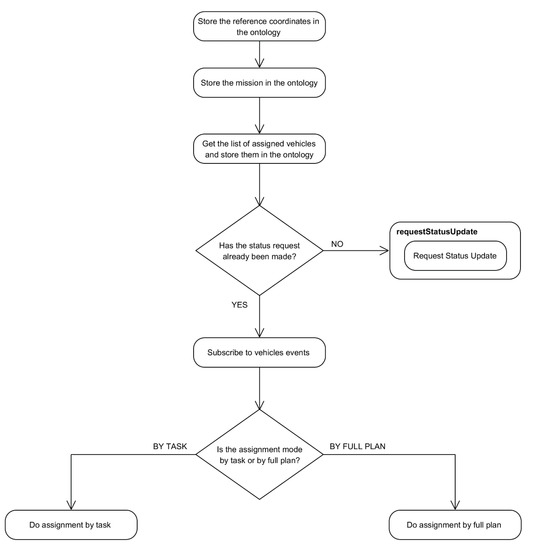
Figure 11.
Flow diagram for mission data extraction and storage done at the MTRR.
Finally, the MTRR assigns the actions in the plan to each vehicle (activities 7 and 8). Each vehicle is able to perform high-level actions (if they have an onboard planner) or low-level actions (if they do not have an onboard planner), and the MTRR is responsible for sending them the adequate action list according to their capabilities. This is supported by a MissionParser as part of the MTRR component. Also the assignment of the plan to each vehicle can be done in two ways:
- Sending the full plan to each vehicle.
- Sending just the first action in the plan to each vehicle. Subsequent actions will be sent from the TaskReport whenever requested by the vehicle.
The second style of assignment was added to the startMission in the MTRR as requested by some vehicle providers in the SWARMs project.
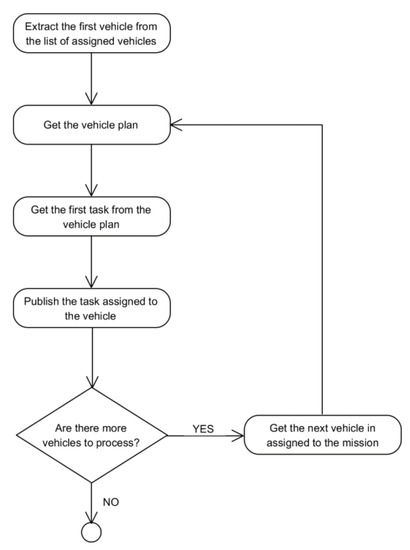
Figure 12.
Flow diagram for the task assignment when done by wait for completion.
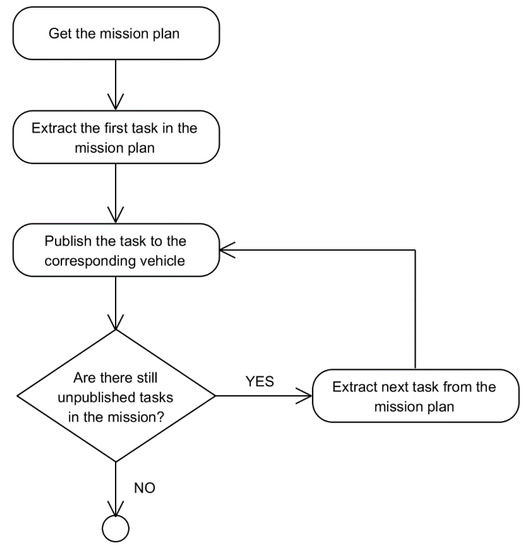
Figure 13.
Flow diagram for the task assignment when done by full plan.
The full sequence diagram is detailed in Figure 14.
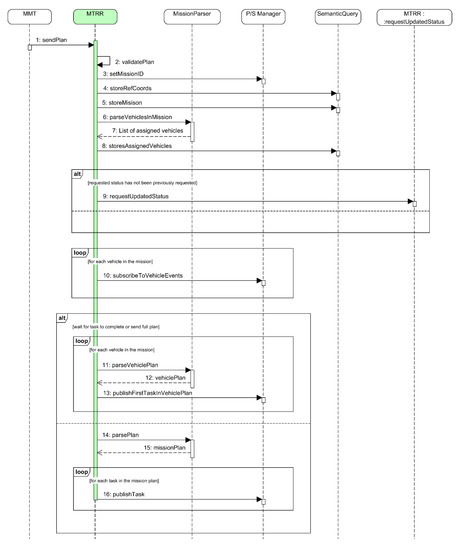
Figure 14.
Sequence diagram for the startMission procedure performed by the MTRR.
4.2.2. Receiving and Recording Mission Status Reports
Figure 15 shows the functional overview of how a mission status report sent by a vehicle is processed within the SWARMs architecture. It starts with the vehicle publishing the corresponding mission status part to a specific DDS topic (step 1). The Task Reporter component, which is subscribed to that topic, receives the published data (step 2), processes it, and sends the generated report to the MTRR (step 3). The MTRR then processes the report, stores the relevant information into the SWARMs repository through the Semantic Query component (step 4), notifies the MMT (step 5), and if there are pending tasks in the vehicle plan, publishes the next one to the specific DDS topic through the Publish/Subscription Manager (step 6).
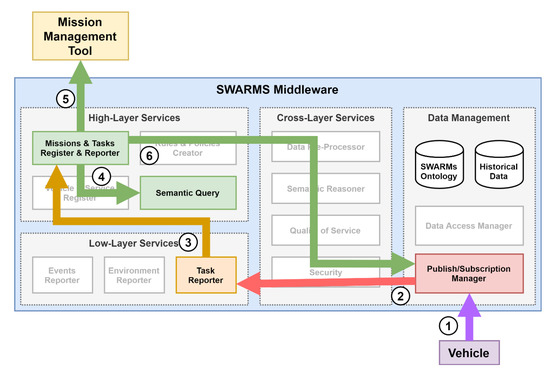
Figure 15.
Functional overview of the processing of a mission status report from a vehicle.
In summary, the reception of a new mission status report in the MTRR has three main responsibilities:
- To extract and store the status report in the ontology using the Semantic Query component.
- Notifying the MMT if there is any important status update, like the vehicle being unable to fulfill the mission.
- If the assignment mode was set to wait until task completion for requesting the next task in the mission plan, then the assignment of the tasks to the vehicles besides the first one is performed also when receiving a mission status report with a status of COMPLETED.
The first part is straightforward: it is just the extraction of the status from the report and its storage into the ontology using the interface provided by the Semantic Query.
The second part is also straightforward: if the received status is of interest for the MMT, then the MTRR will send a notification to it.
The third part is also very simple, as depicted in Figure 16. If the task status report indicates that the task has been completed, the next task for the vehicle, if any, is extracted from the vehicle plan and published through the P/S Manager.
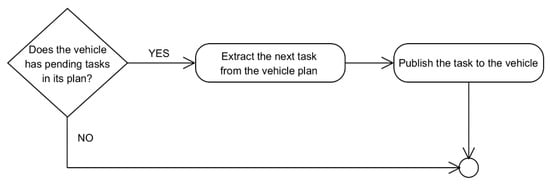
Figure 16.
Flow diagram for next task assignment when received a COMPLETED task status.
Figure 17 shows the sequence diagram for the full procedure performed by the MTRR when receiving a new task status report.
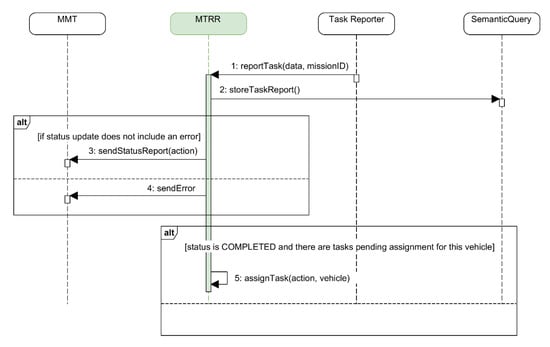
Figure 17.
Sequence diagram for the task report method in the MTRR.
4.2.3. Receiving and Recording Environmental Reports
The functional overview for processing an environmental report is shown in Figure 18. The flow is similar to that for the mission status reports. As before, it starts when the vehicle publishes data, in this case environmental data from the onboard sensors, to the DDS topic for environmental information (step 1). This time the Environmental Reporter component is the one that is subscribed to that topic. Consequently, it receives the published environmental data (step 2), generates an environmental report from the received data, and sends the report to the MTRR (step 3). Finally, the MTRR processes the environmental report and stores the information in the SWARMs repository through the Semantic Query (step 4).
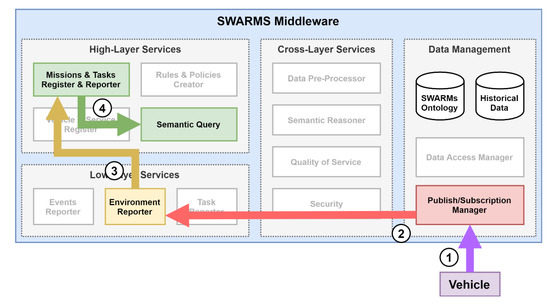
Figure 18.
Functional overview of the processing of an environmental report.
When the MTRR receives an environmental report it stores the data from the report in the historical database and in the ontology using the interface provided by the Semantic Query. It also checks if the report includes salinity concentration information, as it requires a specific method in the interface to the Semantic Query. The full sequence diagram for this method is shown in Figure 19.
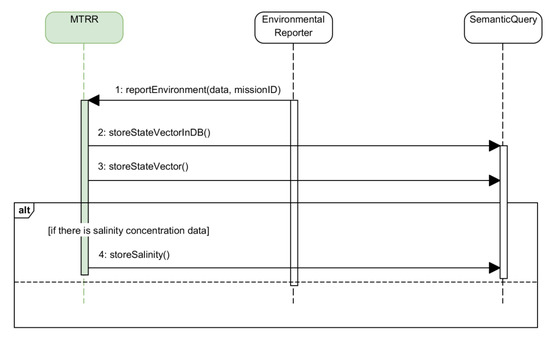
Figure 19.
Sequence diagram for the management of an environment report.
4.2.4. Receiving and Recording Events Reports
The reception of an event report implies notifying the MMT about the event as well as storing the event into the database. The sequence diagram for this method is provided in Figure 20.
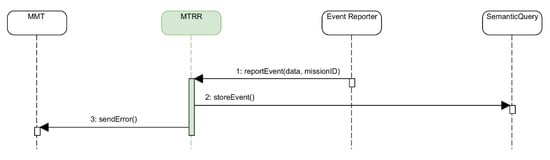
Figure 20.
Sequence diagram for the management of an event report.
4.2.5. Aborting a Mission
A mission can be aborted manually for whatever reason the operator considers appropriate. The operator can decide whether to just abort the part of the mission assigned to a vehicle, or the full mission. Figure 21 and Figure 22 show the sequence diagrams for aborting a vehicle plan and the full mission respectively.
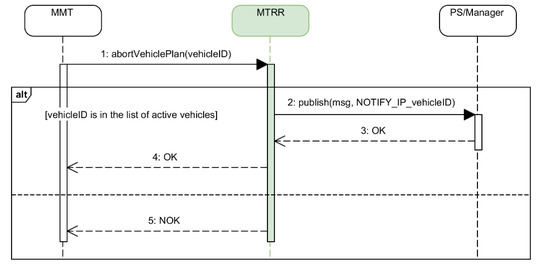
Figure 21.
Sequence diagram for aborting a vehicle plan.
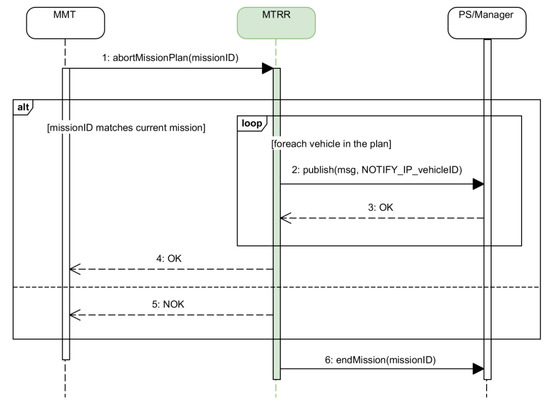
Figure 22.
Sequence diagram for aborting the full mission.
5. Validation
5.1. Validation Goals
The main purpose of the validation of the MTRR is to verify its effectiveness and compliance with the SWARMs project Scientific and Technical Objectives (STO), and in particular with the development of a semantic middleware and common information model for managing the interoperability, cooperation and coordination [22]. Specifically, the MTRR is responsible for the mission management from within the SWARMs middleware, having a significant role.
In summary, the validation goals of the MTRR are:
- Verification of the effectiveness of the procedures for starting a mission, processing a task status report and dispatching the next task whenever there is any pending assignment, and processing the received environmental reports. The MTRR will be considered effective if it produces the expected results in terms of interoperability, cooperation and coordination.
- Characterization of the startMission activity of the MTRR by measuring the times required for each of its internal sub-activities, and identifying possible bottlenecks and correlations.
- Characterization of the reportTask activity of the MTRR by measuring the times required for each of its internal sub-activities, and identifying possible bottlenecks.
- Characterization of the reportEnvironment activity of the MTRR by measuring the times required for each of its internal sub-activities, identifying possible bottlenecks and comparing the efficiency of storing the state vector in the semantic and the relational databases.
5.2. Validation Scenario
The MTRR was validated during the integration and final demonstration for the SWARMs project. These tests were done at the Trondheim Biological Station (TBS). The test area used for the validation is shown in Figure 23.
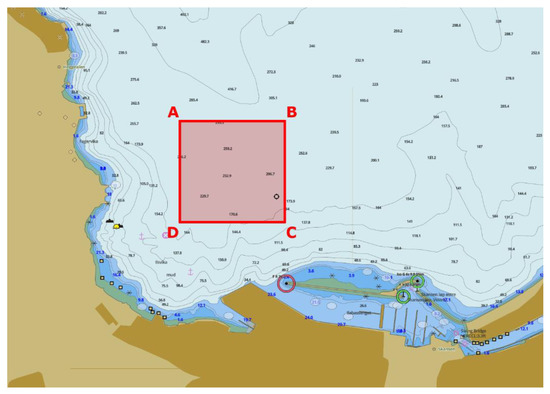
Figure 23.
Final SWARMs demo test area used for validation.
A Central Control Station (CCS) was deployed at the TBS facilities as the on-shore control operations room. The CCS consisted of five computers connected to the same private IP network. Figure 24 shows how the different parts of the system were distributed among the CCS computers. Note that the MMT and CAF computers are in charge of running the MMT and CAF applications respectively, and two more Personal Computers are used for plume and vehicle simulations.
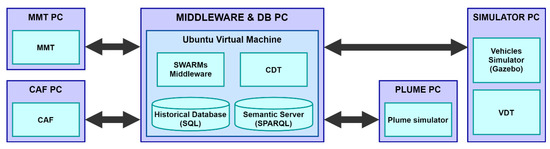
Figure 24.
Distribution of the Central Control Station (CCS) computers.
Regarding the middleware and the repositories of information, a virtual machine solution was chosen. Both the relational database and the Fuseki server used to query the ontology were deployed in the same virtual machine as the middleware.
All the communications from the middleware to the vehicles, as explained in Section 3, were done through the CDT. If the mission was simulated, the CDT was configured to connect to the VDTs from the simulator PC at the same CCS. Should the mission use real vehicles deployed underwater, the CDT would be configured to communicate to the VDTs on board those vehicles. Therefore, from the point of view of the rest of the system, the use of the simulator or the real vehicle was transparent.
The plume simulator [53] that is also shown in Figure 24 was used in the following way: when the Environment Reporter component from the middleware received a new report from the vehicles (either real or simulated), it queried the plume simulator for the concentration values corresponding to the position of the vehicle. The returned data, if any, were aggregated to the report sent to the MTRR.
5.3. Technical Details
5.3.1. Equipment Used for Running the MTRR
The MTRR, as part of the SWARMs middleware, was deployed in a VMware virtual machine running Ubuntu 14.04 LTS with a Linux kernel version 4.2.0-42-generic. The virtual machine was configured with 2 GB of RAM, 4 cores and 20 GB of hard disk storage (prior tests were carried out with just 1 core). It was run on top of a Windows 10 machine with 16 GB of RAM and 8 i7 cores using VMware Workstation Player 12.
The MTRR was integrated with the rest of the SWARMs middleware as a Java application, and executed using a Java SE Runtime Environment version 8u101 from Oracle. Also, although the middleware could be run as standalone software, it was decided to run it from the development environment used, which was Eclipse Mars. All the invocations between the middleware components were done through Java method calls.
The historical database was deployed as a relational database using MySQL Server version 5.5.55, (package version 5.5.55-0ubuntu0.14.04.1 installed directly from the Ubuntu repositories) and it was deployed in the same virtual machine as the SWARMs middleware (and therefore the MTRR). The required resources to query the SWARMs ontology were deployed as a SPARQL server using Apache Jena Fuseki version 3.4.0, and it was also deployed in the same virtual machine as the SWARMs middleware, with a specific maximum memory allocation of 1200 MB.
5.3.2. Other Equipment and Materials Used for the Tests Involving the MTRR
The integration and final demonstration for SWARMs was carried out through simulations and real deployments. The real deployments used a group of AUVs, an USV or both. The details of the vehicles used in the tests are listed Table 2, and the vehicles themselves are shown in Figure 25.
Table 2.
Details for the vehicles used during the tests involving the MTRR.
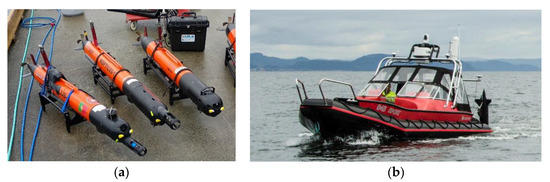
Figure 25.
(a) AUVs Noptilus-1, Noptilus-2, and Fridtjof; (b) Telemetron.
A hardware-in-the-loop approach was used for the simulations. This approach allowed us to test everything as if real vehicles were used. As shown in Figure 24 the simulated vehicles were run in a dedicated computer deployed at the CCS. They used exactly the same software as the real vehicles, and it was executed using a Gazebo simulator for underwater intervention and multi-robot simulation [54,55] running in the simulator computer. In consequence, from the middleware perspective the use of a simulated or a real vehicle was transparent, with no impact in its internal operations.
5.4. Tests Details
During the integration and the final demonstration, a lot of tests were conducted. Regarding the validation for the MTRR, a total of 45 missions were registered. The basic details of each mission are shown in Table 3, including the total number of actions in the mission, how many were high-level ones, and how many were low-level, the vehicles assigned for the mission, and whether the mission was real or simulated.
Table 3.
Details for each registered mission.
The approach used for the mission assignment for all the missions was by individual tasks due to the constraints in the Robotic System On-board Architecture (RSOA) used in the vehicles. This means that when a mission starts, only the first action for each vehicle is sent to them. The rest of the actions in the mission plan are sent when a COMPLETED status report is received from a vehicle for its current action.
Mission 27 was aborted after sending the first action in the mission plan to each vehicle as there were unexpected underwater obstacles that prevented them to fulfill the mission. Missions 35, 36, 44 and 45 were those performed during the SWARMs final audit.
6. Results
In this section we will analyze the results obtained from the records acquired from the missions listed in the previous section.
The validation of the MTRR focuses on the processing time for each of the activities it executes as described in Section 4, as the processing time could introduce issues in the mission management when the task assignment is done by task. As a reminder, these activities are:
- Starting a mission.
- Reporting the status of a vehicle.
- Reporting the state vector from a vehicle.
The results obtained for each activity are discussed in the following subsections.
6.1. Starting a Mission
From the MTRR perspective, the start of a mission begins when it receives a new mission plan from the MMT. When this happens, the MTRR performs the activities described in Section 4.1. For debugging purposes, the MTRR also recorded logs of the mission plan that just consisted of parsing the mission and logging it into a log file for further verification.
The time registered for each sub-activity, as well as the total time required for the starting mission activity, is shown in Table 4. The time for parsing the actions assigned to each vehicle in the mission plan and to publish the first assigned action for each one is included as . The time for validating the mission plan, (re)loading the MTRR configuration, and checking if there are AUVs in the mission is included as .
Table 4.
Times for starting a mission in the MTRR after receiving it from the Mission Management Tool (MMT, ms).
In Figure 26 we can see the distribution of the times required for each sub-activity and each mission separately, along with the length of the mission plan for each mission.
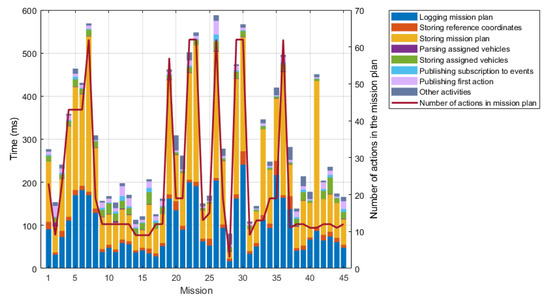
Figure 26.
Distribution of times for starting a mission in the MTRR.
The graph depicted in Figure 26 seems to suggest a possible correlation between the mission plan length () and the time required to start it (). Figure 27 represents a scatterplot for the relationship between both.
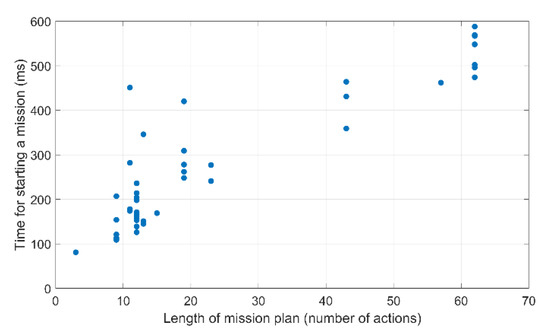
Figure 27.
Relation between the length of the mission plan and the time required to start it.
The scatterplot also suggests a definite positive correlation between and . However, as shown in Figure 28, both sets of data do not seem to follow a normal distribution.
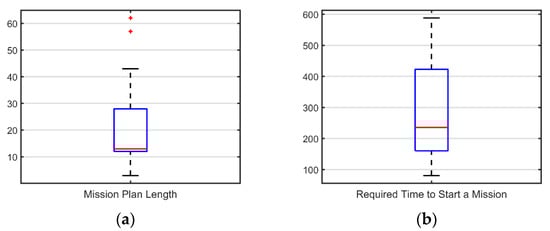
Figure 28.
(a) Boxplot for the Mission Plan Length (). The median is completely displaced to the lower quartile, and there are also a couple of outliers; (b) boxplot for the time required to start a mission ().
In the first case, we can see that the whiskers for are of approximate equal length. But the median is too close to the lower quartile, and we also have a couple of outliers. In the second case, for , we can see that the distance between the lower quartile and the lower whisker is shorter than the upper one, and the median is also displaced from the center. Therefore, a Spearman’s correlation was run, instead of Pearson’s, to determine the relationship between the 45 mission plan lengths and the total time required for starting each mission. As a result, we have ascertained that there is a strong positive monotonic correlation between these two values (). To better understand the contribution of each sub-activity to the total time required for starting a mission, Figure 29 shows the Pareto chart with the average distribution of time for each sub-activity. It is quite clear that the sub-activity contributing most is the one in charge of storing the mission plan into the semantic repository, followed by the logging of the mission plan actions to the human operator, other activities, and the storing of the vehicles assigned to the mission and the reference coordinates into the semantic repository. If we take into consideration that the logging of the mission plan actions to the human operator was done for debugging purposes and it is not required for the normal operation of the MTRR, we can affirm that the most consuming activities when starting a mission are those related to the storage of information into the semantic repository.
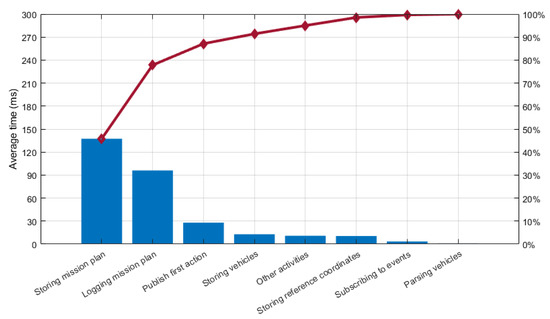
Figure 29.
Pareto chart for the average distribution of time for each activity performed by the MTRR when starting a mission.
If we just remove the time for logging the mission to the operator, we can observe in Figure 30 how storing the mission plan into the semantic repository is the activity that takes more time, representing 67.37% of the total time required for the procedure of starting a mission, as shown in the Pareto chart in Figure 30. Indeed, all the activities related to the storage of information in the semantic repository represent 78.83% of the total time.
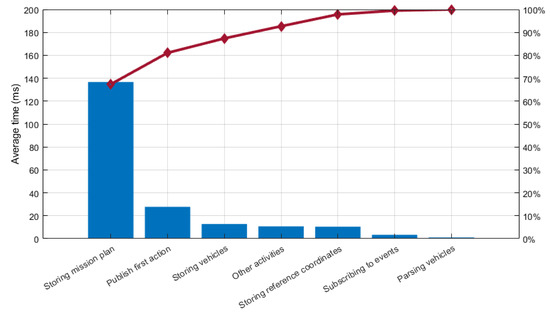
Figure 30.
Pareto chart for the average distribution of time for each activity performed by the MTRR when starting a mission without consideration for the logging of the actions in the mission plan.
Of course, we should consider that the length of the plan and the number of assigned vehicles have an impact on the performance of the parts that handle the mission plan and the list of assigned vehicles. From the MTRR perspective these actions are undertaken as one, and thus, we can only make an estimation of the time distribution. To do so, we take the time of each action and divide it by the length of the mission plan or number of assigned vehicles as appropriate. Figure 31 illustrates the contributions for each part considering the aforementioned estimation. The storage and the logging of the mission plan have been averaged taking into account the total number of actions in the mission plan, which are provided in Table 3. The storage of the assigned vehicles, the subscription to events and the assignment of the first action for each vehicle have been averaged taking into account the number of vehicles for each mission also provided in Table 3.
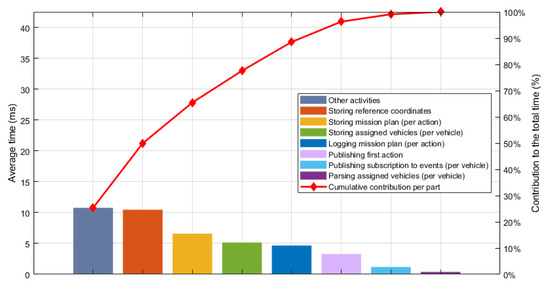
Figure 31.
Pareto chart for the average distribution of time for each activity performed by the MTRR when starting a mission, averaged to the number of actions in the mission plan and the number of vehicles as appropriate.
6.2. Processing Task Status Reports
Table 5 contains the collected information about the total times spent for processing the task status report, sorted by mission. Each row includes how many task status reports are received in the mission (), how many times a next action assignment was performed (), the total time required for retrieving the vehicle information from the database (), the total time used in the mission for storing the task status reports in the database (), to send the status report to the MMT (), to send the next action assignment, if any () and for other activities not relevant for the processing of the status report (). There were no records regarding the processing of the task status reports during mission 27.
Table 5.
Values for processing the task status reports, and if required send the next action to the corresponding vehicle. Time is given in milliseconds.
In order to better understand which part of the processing of the report contributes the most to the total time, the average time is calculated for each mission and shown in Figure 32. The average time for retrieving the vehicle information from the database, storing the task status in the database, sending the task status to the MMT and the rest of the activities not relevant for the processing of the report is calculated using the total number of reports registered for each mission. The average time for the next action assignment is calculated using the number of next action assignments that occurred during each mission.
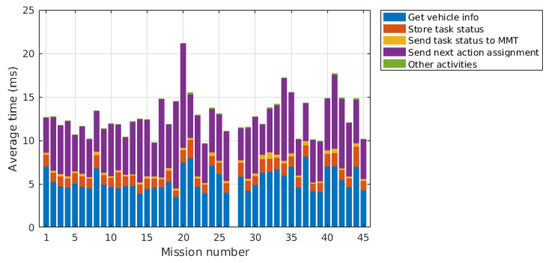
Figure 32.
Average time distribution for processing the task status reports.
Finally, in order to understand which part of the report processing contributes the most to the full processing time, Figure 33 shows the Pareto chart for the averages for each part and all the missions. The part contributing most is the next action assignment, with 48.69% of the total time, followed by the retrieval of the vehicle information, with 39.39% of the total time. The other activities done and the notification of the status report to the MMT are the parts contributing less with 0.70% and a 2.13%, respectively. The figures for the average time are collected in Table 6.
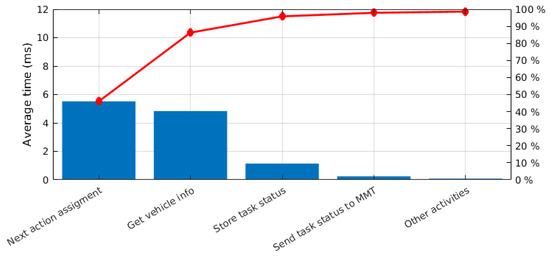
Figure 33.
Pareto chart for the processing times of the task status reports.
Table 6.
Average times for processing the task status reports.
6.3. Processing Environmental Reports
The vehicles are set to send periodically environmental reports, known as state vectors, which always have the same size. Table 7 collects the total time used for processing the state vectors for each mission. Each row includes the mission number, the total number of reports received during the mission (), the total number of reports that included salinity information (), the total time spent for storing the state vector in the relation database () and in the ontology (), the total time for storing the salinity information in the ontology ( and the total time used for other activities not relevant to the processing of the report (). There were no records regarding the processing of environmental reports during mission 27.
Table 7.
Values for processing the state vector report. Time is given in milliseconds.
The distribution of the time required for processing the state vectors is also shown in Figure 34. It is clearly seen that for every mission the most contributing part was the storage of the state vector in the ontology, followed by the storage of the salinity information also in the ontology whenever this information was available. The averages for the storage of the state vector in the relational database and in the ontology, as well as for the other activities not relevant to the processing of the report, are calculated using the total number of reports registered for each mission. The averages for storing the salinity information in the ontology are calculated using the number of reports that included salinity information.
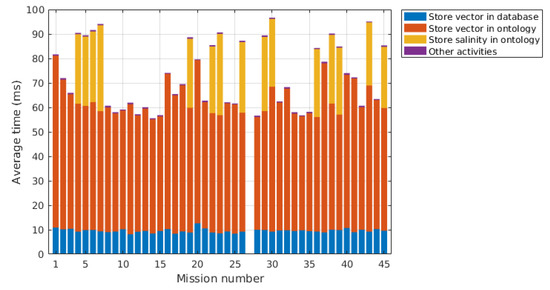
Figure 34.
Distribution of times required for processing the state vectors.
The Pareto chart shown in Figure 35 illustrates how each part done for processing the state vector contributes to the total time required. As was clearly seen in the distribution of time from Figure 34, the part of the processing time that contributes the most is the storage of the state vector in the ontology, followed by the time required for storing the salinity information in the ontology whenever this information was available. Other activities performed for processing the state vector made negligible contributions to the total.
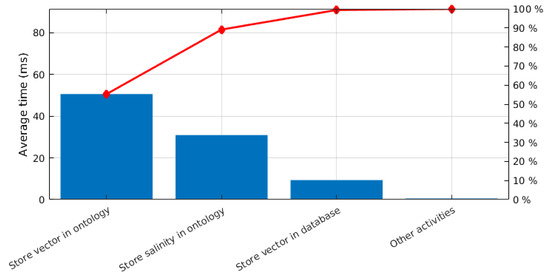
Figure 35.
Pareto chart for the average total time required for each part in processing the state vector.
As mentioned before, the part contributing most was the storage of the state vector in the ontology, requiring an average of 55.34% of the average total time. The storage of the salinity information in the ontology follows with 33.85%. The time spent for the other activities not relevant for the processing of the environmental report are negligible, with a contribution of an average of 0.57%. The figures for the average time are provided in Table 8.
Table 8.
Average time per activity for processing the state vector reports.
From the point of view of the MTRR, the storage of the state vector and the salinity information are undertaken as one unique, indivisible action provided by the Data Access Manager component in the SWARMs architecture. Thus, from the MTRR perspective we can only assert that storing the information in the ontology took longer. Considering that the state vector always has the same size, the average time for storing it in the semantic repository was 12,339 ms with a standard deviation of 13,435 ms. As for the relational database, average time for storing the state vector was 2283 ms with a standard deviation of 2564 ms. Figure 36 illustrates the distribution of both series of time.
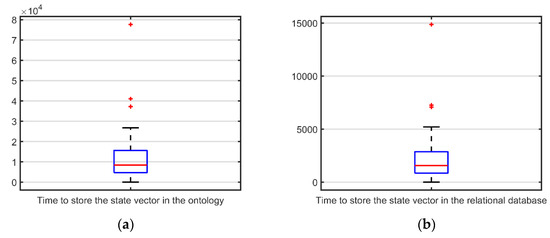
Figure 36.
(a) Boxplot for times required to store the state vector in the SWARMs ontology; (b) boxplot for the times required to store the state vector in the historical database.
In terms of efficiency we can affirm that storing the information in the relational database represents only an average of 18.50% of the time required to store the same information into the semantic repository.
6.4. Summary of Validation Results
In this section we have analyzed the results from the validation tests carried out for the MTRR during the SWARMs project final demonstration scenario. In terms of effectiveness, we can affirm that the procedures of the MTRR have produced the expected results, fulfilling the SWARMs objectives of interoperability, cooperation and coordination.
In Section 6.1 we have obtained the processing time used by the MTRR to start a mission, allowing us to characterize this activity. We have also identified that the access to the databases, and specifically the semantic repository, are possible bottlenecks during the operation, and that there is a strong correlation between the mission plan length and the time required to start a mission.
In Section 6.2 we have characterized the processing time used by the MTRR to process a task status report and dispatch to the sender vehicle the next task in its part of the mission plan, if any. The time obtained here suggested that obtaining the next task for a vehicle is the most time-consuming part.
Finally, in Section 6.3 we have characterized the processing time used by the MTRR to process an environmental report. In these cases, as the state vector containing the environmental information always has the same size, we have been able to compare the efficiency of storing the same information in the semantic and the relational databases used for the SWARMs repositories.
7. Conclusions and Future Works
In this paper we have identified that typical mission manager architectures for cooperative underwater robotic operations do not follow any decentralized control pattern for self-adaptive systems that enables a distributed adaptation to react to exogenous and unforeseen situations. We have also identified that these architectures typically focus on just one type of vehicle, providing a tightly coupled integration that prevents the use of legacy vehicles with reduced capabilities. Finally, we have also identified that for underwater operations the common transfer method of the mission plan to the vehicles is by preloading the plan, preventing possible updates of it during the mission.
As a response, we have introduced the MTRR, a mission manager integrated in the SWARMs middleware architecture that provides capabilities for managing cooperative AUV missions at the mission level. Compared with typical mission managers, the novelty of the MTRR is that it is a mission manager part of a decentralized control pattern for self-adaptive systems, using a virtualization of the mission planning capabilities of the vehicles, and implementing an online dispatching method for the mission plan instead of the conventional preloading of the full mission. Indeed, the MTRR is part of a decentralized hierarchical control pattern where it enables management at the global mission level, while the AUVs retain the management at the vehicle level. It also uses a basic new virtualization approach to abstract the mission management from the planning capabilities of the AUVs, enabling the possibility of using legacy systems without onboard planners. Finally, it uses a novel online mission plan dispatch mechanism that enables the possibility of updating a vehicle plan from the mission level.
The MTRR was implemented using Java as an integrated component of the SWARMs middleware. Validation and performance tests for the MTRR were successfully carried out during the SWARMs final demonstration in Trondheim. In the tests, the MTRR dispatched the tasks from the mission plan to the assigned AUVs using their internal virtual representation. Both the dispatching of the tasks and the reception and processing of the reports from the AUVs were performed successfully.
The tests also provided us with some values of interest. In summary, we found a strong correlation between the length of the mission plan and the time required for the start mission activity (). We also have found that access to the repositories is a possible bottleneck. In particular, when processing the environmental reports sent by the AUVs, the storage of the same state vector in the relational database took only an average of 18.50% of the time required for storing it in the semantic repository.
In future works we intend to explore a more detailed use of the decentralized hierarchical control pattern and extend the use of the virtualization of autonomous vehicles. Specifically, as the proposed mission manager is easily decoupled from the application domain, we are currently working on its improvement and integration in the AFarCloud project for its use with autonomous and semi-autonomous vehicles for precision agriculture. In addition, due to the results obtained in the validation, we also intend to explore how to reduce the impact of the access to the repositories, handled from the point of view of the mission manager.
Author Contributions
Conceptualization, N.L.M.; methodology, N.L.M.; software, N.L.M. and J.R.-M.; validation, N.L.M., J.R.-M. and Z.Z.; formal analysis, N.L.M.; investigation, N.L.M. and J.R.-M.; resources, N.L.M. and Z.Z.; data curation, N.L.M.; writing—original draft preparation, N.L.M. and J.R.-M.; writing—review and editing, N.L.M., J.R.-M. and Z.Z.; visualization, N.L.M.; supervision, J.-F.M.-O.; project administration, J.-F.M.-O.; funding acquisition, J.-F.M.-O. All authors have read and agreed to the published version of the manuscript.
Funding
The research leading to the presented results has been partially undertaken within the SWAMRs European project (Smart and Networking Underwater Robots in Cooperation Meshes), under Grant Agreement n. 662107-SWARMs-ECSEL-2014-1, partially supported by the ECSEL JU and the Spanish Ministry of Economy and Competitiveness (Ref: PCIN-2014-022-C02-02).
Conflicts of Interest
The authors declare no conflict of interest. The funders had no role in the design of the study; in the collection, analyses, or interpretation of data; in the writing of the manuscript, or in the decision to publish the results.
References
- Patrón, P.; Petillot, Y.R. The underwater environment: A challenge for planning. In Proceedings of the 27th Workshop of the UK PLANNING AND SCHEDULING Special Interest Group, PlanSIG, Edinburgh, UK, 11–12 December 2008. [Google Scholar]
- Bellingham, J.G. Platforms: Autonomous Underwater Vehicles. In Encyclopedia of Ocean Sciences; Elsevier: Amsterdam, The Netherlands, 2009; pp. 473–484. [Google Scholar]
- Thompson, F.; Guihen, D. Review of mission planning for autonomous marine vehicle fleets. J. Field Robot. 2019, 36, 333–354. [Google Scholar] [CrossRef]
- Kothari, M.; Pinto, J.; Prabhu, V.S.; Ribeiro, P.; de Sousa, J.B.; Sujit, P.B. Robust Mission Planning for Underwater Applications: Issues and Challenges. IFAC Proc. Vol. 2012, 45, 223–229. [Google Scholar] [CrossRef]
- Fernández Perdomo, E.; Cabrera Gámez, J.; Domínguez Brito, A.C.; Hernández Sosa, D. Mission specification in underwater robotics. J. Phys. Agents 2010, 4, 25–33. [Google Scholar]
- DNV GL. RULES FOR CLASSIFICATION: Underwater Technology; Part 5 Types of UWT systems, Chapter 8 Autonomous underwater vehicles; DNL GL: Oslo, Norway, 2015. [Google Scholar]
- Alterman, R. Adaptive planning. Cogn. Sci. 1988, 12, 393–421. [Google Scholar] [CrossRef]
- Woodrow, I.; Purry, C.; Mawby, A.; Goodwin, J. Autonomous AUV Mission Planning and Replanning–Towards True Autonomy. In Proceedings of the 14th International Symposium on Unmanned Untethered Submersible Technology, Durham, UK, 21–24 August 2005; pp. 1–10. [Google Scholar]
- Van Der Krogt, R.; De Weerdt, M. Plan Repair as an Extension of Planning. In Proceedings of the International Conference on Automated Planning and Scheduling (ICAPS), Monterey, CA, USA, 5–10 June 2005; Biundo, S., Myers, K., Rajan, K., Eds.; The AAAI Press: Monterey, CA, USA, 2005; pp. 161–170. [Google Scholar]
- Fox, M.; Gerevini, A.; Long, D.; Serina, I. Plan stability: Replanning versus plan repair. In Proceedings of the International Conference on AI Planning and Scheduling (ICAPS), Cumbria, UK, 6–10 June 2006; Long, D., Smith, S.F., Borrajo, D., McCluskey, L., Eds.; The AAAI Press: Cumbria, UK, 2006; pp. 212–221. [Google Scholar]
- Van Der Krogt, R. Plan Repair in Single-Agent and Multi-Agent Systems; Technical University of Delft: Delft, The Netherlands, 2005. [Google Scholar]
- Brito, M.P.; Bose, N.; Lewis, R.; Alexander, P.; Griffiths, G.; Ferguson, J. The Role of adaptive mission planning and control in persistent autonomous underwater vehicles presence. In Proceedings of the IEEE/OES Autonomous Underwater Vehicles (AUV), Southampton, UK, 24–27 September 2012; IEEE: Piscataway, NJ, USA, 2012; pp. 1–9. [Google Scholar]
- Patrón, P.; Lane, D.M. Adaptive mission planning: The embedded OODA loop. In Proceedings of the 3rd SEAS DTC Technical Conference, Edinburgh, UK, 24–25 June 2008. [Google Scholar]
- Insaurralde, C.C.; Cartwright, J.J.; Petillot, Y.R. Cognitive Control Architecture for autonomous marine vehicles. In Proceedings of the IEEE International Systems Conference SysCon 2012, Vancouver, BC, Canada, 19–22 March 2012; IEEE: Piscataway, NJ, USA, 2012; pp. 1–8. [Google Scholar]
- Endsley, M.R. Designing for Situation Awareness, 2nd ed.; CRC Press: Boca Raton, FL, USA, 2016; ISBN 9780429146732. [Google Scholar]
- MBARI—Autonomy—TREX. Available online: https://web.archive.org/web/20140903170721/https://www.mbari.org/autonomy/TREX/index.htm (accessed on 27 November 2019).
- McGann, C.; Py, F.; Rajan, K.; Thomas, H.; Henthorn, R.; McEwen, R. A deliberative architecture for AUV control. In Proceedings of the IEEE International Conference on Robotics and Automation, Pasadena, CA, USA, 19–23 May 2008; IEEE: Piscataway, NJ, USA, 2008; pp. 1049–1054. [Google Scholar]
- Huebscher, M.C.; McCann, J.A. A survey of autonomic computing—Degrees, models, and applications. ACM Comput. Surv. 2008, 40, 1–28. [Google Scholar] [CrossRef]
- IBM. An architectural blueprint for autonomic computing. IBM 2005, 31, 1–6. Available online: https://www-03.ibm.com/autonomic/pdfs/AC%20Blueprint%20White%20Paper%20V7.pdf (accessed on 20 January 2020).
- Poole, D.L.; Mackworth, A.K. Artificial Intelligence: Foundations of Computational Agents, 2nd ed.; Cambridge University Press: Cambridge, UK, 2017; ISBN 9781107195394. [Google Scholar]
- Rodríguez-Molina, J.; Bilbao, S.; Martínez, B.; Frasheri, M.; Cürüklü, B. An Optimized, Data Distribution Service-Based Solution for Reliable Data Exchange Among Autonomous Underwater Vehicles. Sensors 2017, 17, 1802. [Google Scholar] [CrossRef] [PubMed]
- SWARMS. Available online: http://swarms.eu/overview.html (accessed on 16 December 2019).
- Weyns, D.; Schmerl, B.; Grassi, V.; Malek, S.; Mirandola, R.; Prehofer, C.; Wuttke, J.; Andersson, J.; Giese, H.; Göschka, K.M. On Patterns for Decentralized Control in Self-Adaptive Systems. In Software Engineering for Self-Adaptive Systems II; Springer: Berlin, Germany, 2013; pp. 76–107. [Google Scholar]
- Rødseth, Ø.J. Object-oriented software system for AUV control. Eng. Appl. Artif. Intell. 1991, 4, 269–277. [Google Scholar] [CrossRef]
- Teck, T.Y.; Chitre, M.A.; Vadakkepat, P.; Shahabudeen, S. Design and Development of Command and Control System for Autonomous Underwater Vehicles. 2008. Available online: http://arl.nus.edu.sg/twiki6/pub/ARL/BibEntries/Tan2009a.pdf (accessed on 20 January 2020).
- Teck, T.Y. Design and Development of Command and Control System for Autonomous Underwater Vehicles. Master’s Thesis, National University of Singapore, Singapore, October 2008. [Google Scholar]
- Madsen, H.Ø. Mission Management System for an Autonomous Underwater Vehicle. IFAC Proc. Vol. 1997, 30, 59–63. [Google Scholar] [CrossRef]
- Madsen, H.Ø.; Bjerrum, A.; Krogh, B.; Aps, M. MARTIN—An AUV for Offshore Surveys. In Proceedings of the Oceanology International 96, Brighton, UK, 1 March 1996; pp. 5–8. [Google Scholar]
- McGann, C.; Py, F.; Rajan, K.; Ryan, J.; Henthorn, R. Adaptive control for autonomous underwater vehicles. Proc. Natl. Conf. Artif. Intell. 2008, 3, 1319–1324. [Google Scholar]
- Executive T-Rex for ROS. Available online: http://wiki.ros.org/executive_trex (accessed on 27 November 2019).
- Ropero, F.; Muñoz, P.; R.-Moreno, M.D. A Versatile Executive Based on T-REX for Any Robotic Domain. In Proceedings of the International Conference on Innovative Techniques and Applications of Artificial Intelligence, Cambridge, UK, 11–13 December 2018; pp. 79–91. [Google Scholar]
- RAUVI: Reconfigurable AUV for Intervention. Available online: http://www.irs.uji.es/rauvi/news.html (accessed on 27 November 2019).
- Palomeras, N.; Garcia, J.C.; Prats, M.; Fernandez, J.J.; Sanz, P.J.; Ridao, P. A distributed architecture for enabling autonomous underwater Intervention Missions. In Proceedings of the IEEE International Systems Conference, San Diego, CA, USA, 5–8 April 2010; IEEE: Piscataway, NJ, USA, 2010; pp. 159–164. [Google Scholar]
- García, J.C.; Javier Fernández, J.; Sanz, R.M.P.J.; Prats, M. Towards specification, planning and sensor-based control of autonomous underwater intervention. IFAC Proc. Vol. 2011, 44, 10361–10366. [Google Scholar] [CrossRef]
- Palomeras, N.; Ridao, P.; Carreras, M.; Silvestre, C. Using petri nets to specify and execute missions for autonomous underwater vehicles. In Proceedings of the IEEE/RSJ International Conference on Intelligent Robots and Systems, St. Louis, MO, USA, 11–15 October 2009; IEEE: Piscataway, NJ, USA, 2009; pp. 4439–4444. [Google Scholar]
- Trident FP7 European Project. Available online: http://www.irs.uji.es/trident/aboutproject.html (accessed on 28 November 2019).
- Atyabi, A.; MahmoudZadeh, S.; Nefti-Meziani, S. Current advancements on autonomous mission planning and management systems: An AUV and UAV perspective. Annu. Rev. Control 2018, 46, 196–215. [Google Scholar] [CrossRef]
- MahmoudZadeh, S.; Powers, D.M.W.; Bairam Zadeh, R. State-of-the-Art in UVs’ Autonomous Mission Planning and Task Managing Approach. In Autonomy and Unmanned Vehicles; Springer: Singapore, 2019; pp. 17–30. [Google Scholar]
- Pacini, F.; Paoli, G.; Kebkal, O.; Kebkal, V.; Kebkal, K.; Bastot, J.; Monteiro, C.; Sucasas, V.; Schipperijn, B. Integrated comunication network for underwater applications: The SWARMs approach. In Proceedings of the Fourth Underwater Communications and Networking Conference (UComms), Lerici, Italy, 28–30 August 2018; IEEE: Piscataway, NJ, USA, 2018; pp. 1–5. [Google Scholar]
- Pacini, F.; Paoli, G.; Cayón, I.; Rivera, T.; Sarmiento, B.; Kebkal, K.; Kebkal, O.; Kebkal, V.; Geelhoed, J.; Schipperijn, B.; et al. The SWARMs Approach to Integration of Underwater and Overwater Communication Sub-Networks and Integration of Heterogeneous Underwater Communication Systems. In Proceedings of the ASME 2018 37th International Conference on Ocean, Offshore and Arctic Engineering, Madrid, Spain, 17–22 June 2018; American Society of Mechanical Engineers: New York, NY, USA, 2018; Volume 7. [Google Scholar]
- About the Data Distribution Service Specification Version 1.4. Available online: https://www.omg.org/spec/DDS/ (accessed on 16 December 2019).
- Li, X.; Bilbao, S.; Martín-Wanton, T.; Bastos, J.; Rodriguez, J. SWARMs Ontology: A Common Information Model for the Cooperation of Underwater Robots. Sensors 2017, 17, 569. [Google Scholar] [CrossRef] [PubMed]
- Li, X.; Martínez, J.; Rubio, G.; Gómez, D. Context Reasoning in Underwater Robots Using MEBN. In Proceedings of the Third International Conference on Cloud and Robotics ICCR 2016, Saint Quentin, France, 22–23 November 2016; pp. 22–23. [Google Scholar]
- Li, X.; Martínez, J.-F.; Rubio, G. Towards a Hybrid Approach to Context Reasoning for Underwater Robots. Appl. Sci. 2017, 7, 183. [Google Scholar] [CrossRef]
- Zhai, Z.; Martínez Ortega, J.-F.; Lucas Martínez, N.; Castillejo, P. A Rule-Based Reasoner for Underwater Robots Using OWL and SWRL. Sensors 2018, 18, 3481. [Google Scholar] [CrossRef] [PubMed]
- Miloradovic, B.; Curuklu, B.; Ekstrom, M. A genetic planner for mission planning of cooperative agents in an underwater environment. In Proceedings of the IEEE Symposium Series on Computational Intelligence (SSCI), Athens, Greece, 6–9 December 2016; IEEE: Piscataway, NJ, USA, 2016; pp. 1–8. [Google Scholar]
- Miloradović, B.; Çürüklü, B.; Ekström, M. A Genetic Mission Planner for Solving Temporal Multi-agent Problems with Concurrent Tasks. In Proceedings of the International Conference on Swarm Intelligence, Fukuoka, Japan, 27 July–1 August 2017; pp. 481–493. [Google Scholar]
- Landa-Torres, I.; Manjarres, D.; Bilbao, S.; Del Ser, J. Underwater Robot Task Planning Using Multi-Objective Meta-Heuristics. Sensors 2017, 17, 762. [Google Scholar] [CrossRef] [PubMed]
- Apache Thrift—Home. Available online: https://thrift.apache.org/ (accessed on 16 December 2019).
- Slee, M.; Agarwal, A.; Kwiatkowski, M. Thrift: Scalable Cross-Language Services Implementation. Facebook White Paper 2007, 5, 1–8. [Google Scholar]
- Rodríguez-Molina, J.; Martínez, B.; Bilbao, S.; Martín-Wanton, T. Maritime Data Transfer Protocol (MDTP): A Proposal for a Data Transmission Protocol in Resource-Constrained Underwater Environments Involving Cyber-Physical Systems. Sensors 2017, 17, 1330. [Google Scholar] [CrossRef] [PubMed]
- Bauer, M.; Boussard, M.; Bui, N.; Francois, C.; Jardak, C.; De Loof, J.; Magerkurth, C.; Meissner, S.; Nettsträter, A.; Olivereau, A.; et al. Internet of Things—Architecture IoT-A, Deliverable D1.5—Final Architectural Reference Model for the IoT v3.0; Technical Report FP7-257521; IoT-A project; 2013; Available online: https://www.researchgate.net/publication/272814818_Internet_of_Things_-_Architecture_IoT-A_Deliverable_D15_-_Final_architecture_reference_model_for_the_IoT_v30 (accessed on 20 January 2020).
- GitHub—Uuvsimulator/Uuv_Plume_Simulator: ROS Nodes to Generate a Turbulent Plume in an Underwater Environment. Available online: https://github.com/uuvsimulator/uuv_plume_simulator (accessed on 11 December 2019).
- Manhaes, M.M.M.; Scherer, S.A.; Voss, M.; Douat, L.R.; Rauschenbach, T. UUV Simulator: A Gazebo-based package for underwater intervention and multi-robot simulation. In Proceedings of the OCEANS 2016 MTS/IEEE Monterey, Monterey, CA, USA, 19–23 September 2016; IEEE: Piscataway, NJ, USA, 2016; pp. 1–8. [Google Scholar]
- GitHub—Uuvsimulator/Uuv_Simulator: Gazebo/ROS Packages for Underwater Robotics Simulation. Available online: https://github.com/uuvsimulator/uuv_simulator (accessed on 11 December 2019).
© 2020 by the authors. Licensee MDPI, Basel, Switzerland. This article is an open access article distributed under the terms and conditions of the Creative Commons Attribution (CC BY) license (http://creativecommons.org/licenses/by/4.0/).