Article

Application and Evaluation of the Gaofen-3 Satellite on a Terrain Survey with InSAR Technology

State Key Laboratory of Information Engineering in Surveying, Mapping and Remote Sensing, Wuhan University, Wuhan 430079, China
*
Author to whom correspondence should be addressed.
Appl. Sci. 2020, 10(3), 806; https://doi.org/10.3390/app10030806
Submission received: 7 December 2019 / Revised: 17 January 2020 / Accepted: 21 January 2020 / Published: 23 January 2020
(This article belongs to the Special Issue Remote Sensing and Geoscience Information Systems in Applied Sciences)

Abstract

:
The Gaofen-3 satellite is the first SAR satellite independently developed in China that achieves interferometric imaging and measurement, which improves upon Chinese civil SAR satellite data. To verify the ability of the Gaofen-3 satellite’s InSAR technology, we acquired data from Dengfeng, China, to evaluate the application and accuracy of an InSAR terrain survey. To reduce the effects introduced by data processing of Gaofen-3 data, high-accuracy InSAR image pair co-registration and phase filtering methods were adopted. Six GCPs data and 1:2000-scale DEM data were used to evaluate the elevation accuracy. In addition, for comparison with other satellites, we processed the dataset of the same area acquired by the non-civilian Yaogan-29 satellite with the same methods and evaluated the results. The experimental results indicated that the interferometric data of the Gaofen-3 satellite can achieve an accuracy of higher than 4 m of interferometric height measurement. Therefore, it will have broad prospects in the domestic InSAR application. Our research provides a certain value for the reference of the development of InSAR sensors in China.

1. Introduction

Interferometric SAR (InSAR) technology, an important application technique for SAR satellites for earth observation, can be used for height measurement and surface deformation monitoring [1,2,3,4,5,6]. Currently, there are many international satellites available for the regular use of InSAR technology. However, China is only at the beginning of this stage. Gaofen-3 is a synthetic aperture radar (SAR) satellite developed by the China Academy of Space Technology and was launched with a CZ-4 carrier rocket from Taiyuan Satellite Launch Center on 10 August 2016 [2]. Table 1 shows the basic parameters of InSAR satellites globally and Gaofen-3 in particular [2,7,8,9,10,11,12,13,14,15].
Gaofen-3, as a domestic SAR satellite that achieves interferometric imaging for the first time in China’s civilian field, is of great significance. The satellite platform was equipped with a C-band SAR sensor, which can acquire high-resolution SAR images based on the phased array system. The observation width of Gaofen-3 is 10–650 km and the spatial resolution is 1–500 m. It has 12 imaging modes, including band, scanning, sliding beam, double aperture superfine and wave imaging modes as well as global observation imaging mode for ocean applications. It has a high resolution, large imaging width and multi-imaging modes. Furthermore, it can expand the observation range and improve the fast response capability by left and right position maneuvering. Table 2 lists the imaging modes and parameters of Gaofen-3 [2]. At present, the research on Gaofen-3 is mainly focused on the improvement of its geometric positioning accuracy [16], the application of ocean wind or wave retrieval [17,18] and ship detection [19]. However, there is a lack of research on the interferometric capability of Gaofen-3, especially the interferometric measurement of terrain elevation with its SAR images.
This paper attempts to explore and evaluate the interferometric capability of Gaofen-3. It is necessary to examine whether the satellite can perform interferometry and to evaluate its interferometric measurement accuracy as well. In the study, an interferometric data set from the Dengfeng area, China, was used to obtain elevation maps. The data set was processed through a series of processing, including high-accuracy InSAR image co-registration, interferometry processing, and interferogram flattening, phase filtering, phase unwrapping and so on. Then two kinds of digital elevation model (DEM) data were used to compare and evaluate the accuracy of the interferometric measurement of Gaofen-3 satellite data, respectively. One is GCPs data from six corner reflectors in the study area. The other is 1:2000-scale digital elevation model (DEM) data, which was obtained from an aerial survey. Finally, for comparison with other SAR sensors and further analysis of the interferometric measurement capability of Chinese SAR satellites, we processed the dataset of the same area acquired by the Chinese non-civilian Yaogan-29 satellite with the same methods.

2. Experimental Dataset

The coverage of the images used for the terrain measurement experiment in this study was located in Dengfeng City, Henan Province. The temporal baseline for the images was a repeat cycle, which is 29 days, and the spatial vertical baseline was approximately 589 m. Since there were different degrees of surface deformation within the coverage of the whole image during the period between two observations, we demarcated an area that did not contain surface deformation as the experimental area. The geographical coverage of the area is shown in Figure 1a, and the basic information is shown in Table 3. Figure 1b shows the single look complex (SLC) intensity of the Gaofen-3 data. The elevation of the experimental area was between 300 and 1000 m, and the topography is shown in Figure 1c.

3. Interferometric Data Processing

This section describes the major processing steps in obtaining a DEM with InSAR technology, using the interferometric data from Gaofen-3 in the Dengfeng area, and provides the basis for evaluating the interferometric imaging and measurement capabilities of Gaofen-3 satellite data. Regarding the application, in order to reduce the errors in data processing as much as possible, this study focused on the interferometric image co-registration with a 0.01-pixel (equal to 3 cm) accuracy level and high-accuracy phase filtering methods to obtain higher accuracy for elevation measurements.

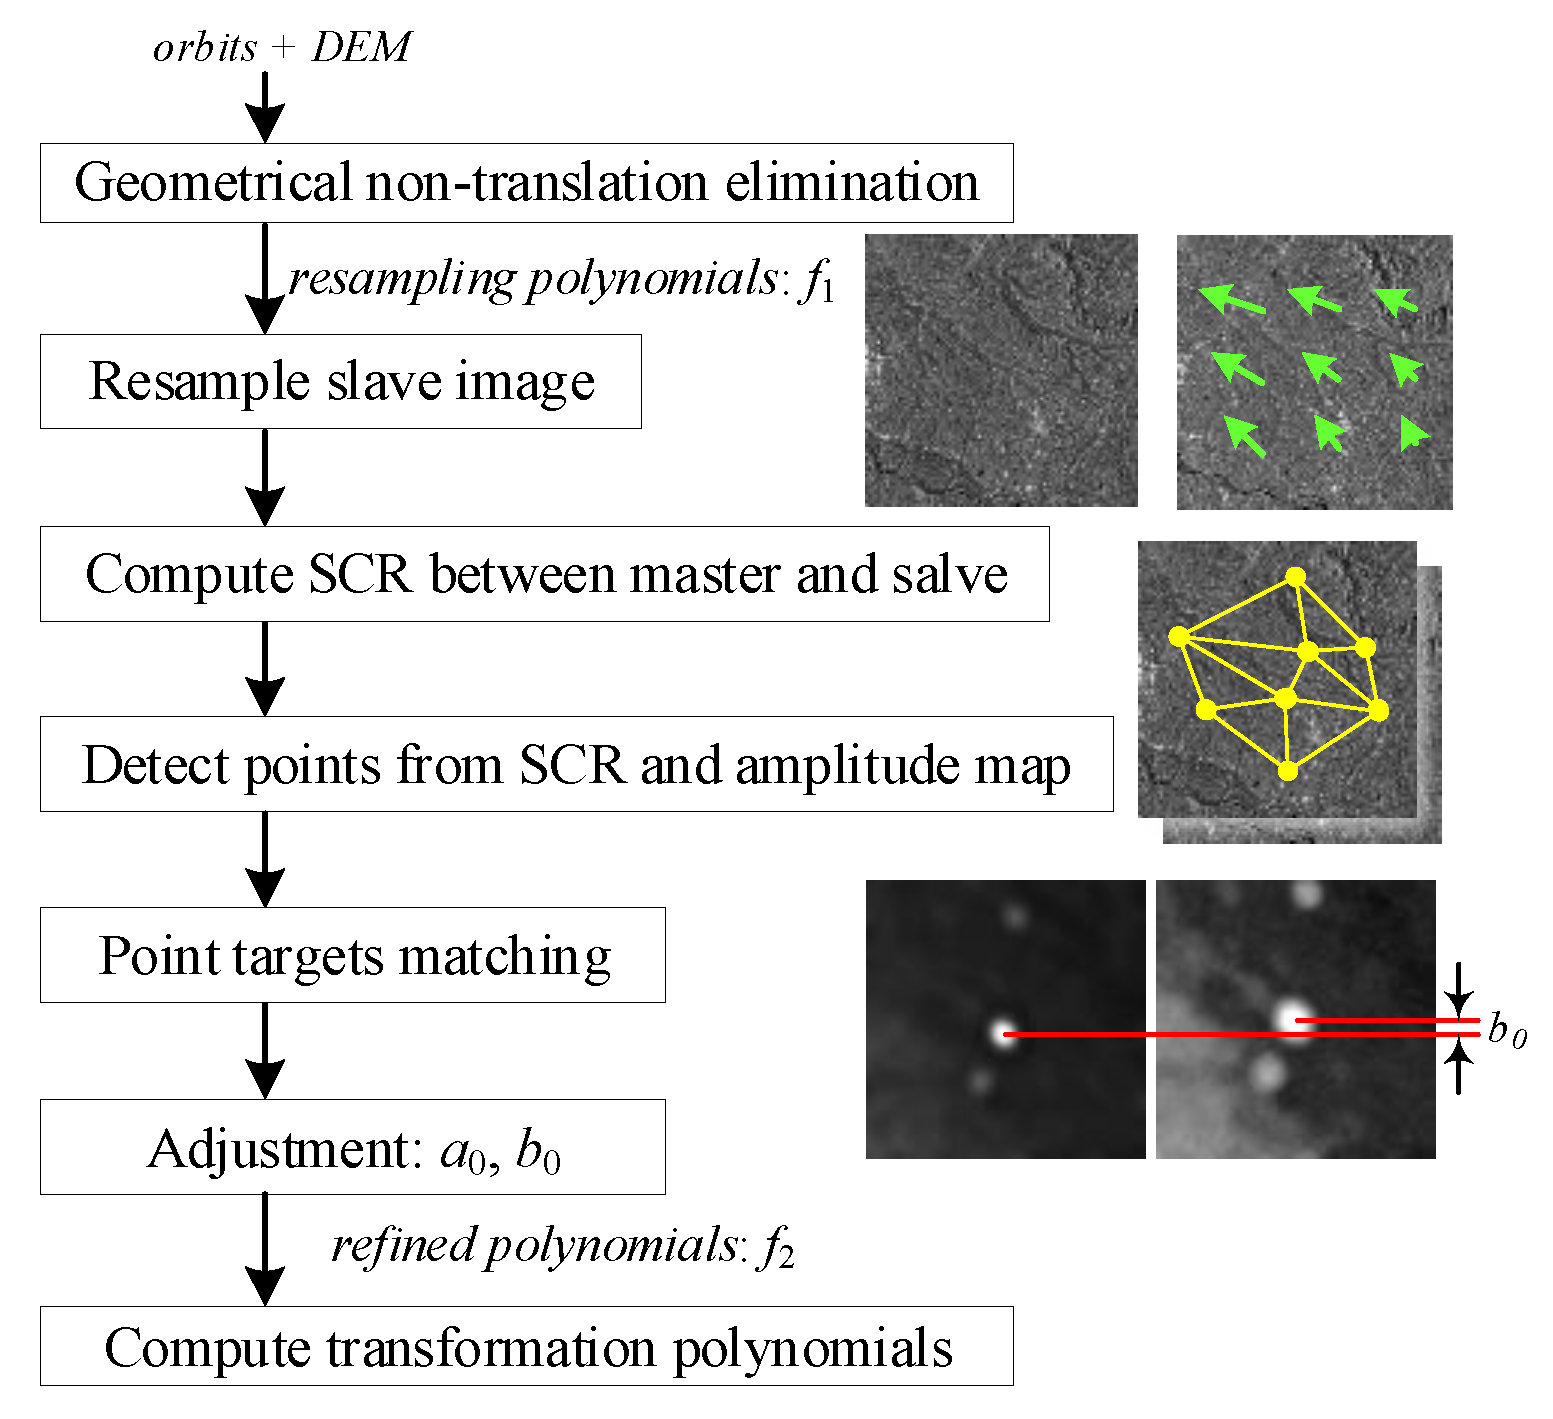
3.1. High-Accuracy InSAR Image Co-Registration

Interferometric coherence can be guaranteed when the co-registration accuracy of the InSAR image pair is higher than 0.1 pixel [1]. However, to improve the accuracy of the interferometric phase as well as the elevation accuracy of the final reconstructed DEM as much as possible, the co-registration accuracy of the image pair in the experimental area is required to reach a level of 0.01 pixel. Although an average level of 0.1 pixel of the global registration accuracy of the image can be obtained using the classical InSAR image co-registration method [9], the accuracy is difficult to guarantee for local areas on the image, especially those with large topographic reliefs [20].
The classical method is not recommended for implementing the co-registration of the experimental dataset. To achieve the 0.01 level of co-registration accuracy in both the range and azimuth, this study adopted the following co-registration method. Firstly, the Shuttle Radar Topography Mission (SRTM) DEM with a resolution of 1″ and the satellite observation geometric parameters were used to eliminate the non-translation relationships between images due to terrain reliefs and inconsistent observation states. Subsequently, the first co-registration was performed and the slave image was resampled. Afterwards, the image pair had simple geometric transformation relations and mainly constant offsets, which could be fitted by global co-registration rational expression with a certain number of offsets with high accuracy and reasonable distributions. In order to obtain a series of high-accuracy offsets, the high-quality co-registration points were screened out with the signal-to-clutter-ratio (SCR) and intensity information between the master and resampled slave images. The details are provided by Chen [20], and the workflow is shown in Figure 2. The method was applied to conduct the co-registration of the Gaofen-3 experimental dataset in the Dengfeng area. The co-registration accuracy in range was 0.0121 pixel and that in azimuth was 0.0093 pixel, which satisfied the expected requirements.

3.2. Interferometry Processing and Interferogram Flattening

After fine registration and spectral offset filtering were conducted, an interferogram was generated Figure 3a,c.
There are two ways to generate a DEM using Gaofen-3 interferometric data. One is to use InSAR technology to calculate the terrain directly through the interferometric phase. The other is based on open-source data such as SRTM data and using the differential InSAR technique to process the elevation. In general, the latter can reduce the fringe density and is conducive to phase filtering and unwrapping. However, the resolution of the Gaofen-3 SAR data, in this case, was different from that of an open-source DEM, such as SRTM. For areas with large terrain reliefs, the difference in interferometric phases contained dense fringes caused by different degrees of response of the two kinds of data to the surface details. In addition, to verify the ability of Gaofen-3 satellite interferometric data to obtain the ground elevation more objectively, a DEM was produced directly through InSAR in this study, rather than using an external DEM for differential interferometry.
We subsequently performed interferogram flattening, and the results are shown in Figure 3b,d. The coherence of the flattened interferogram was calculated using a 5 × 5 pixel window, and the obtained coherence map is shown in Figure 4a; Figure 4b is the corresponding coherence probability histogram.
Based on the coherence analysis, the coherence of the Gaofen-3 interferometric data of the Dengfeng area was 0.413, and the standard deviation of the distribution was 0.186. Partial regions had geometric decorrelation due to terrain reliefs. The 29 days of time interval also resulted in certain degrees of time decorrelation.
Interferograms of Sentinel-1 of the same area with six days and thirty-six temporal baseline were derived to make comparisons with Gaofen-3. Figure 5a,c shows the interferogram and coherence map with the temporal baseline of six days, and the average coherence coefficient is 0.67. Figure 5b,d shows the interferogram and coherence map with the temporal baseline of thirty-six days, and the average coherence coefficient is 0.23.
It can be seen from the Sentinel-1 data, the interferograms after six days appear to be less noisy than the interferograms derived from Gaofen-3. However, the phase decoherence is more serious for the interferograms after thirty-six days. Long temporal baseline could be the main source of phase noise due to the change of the ground features.

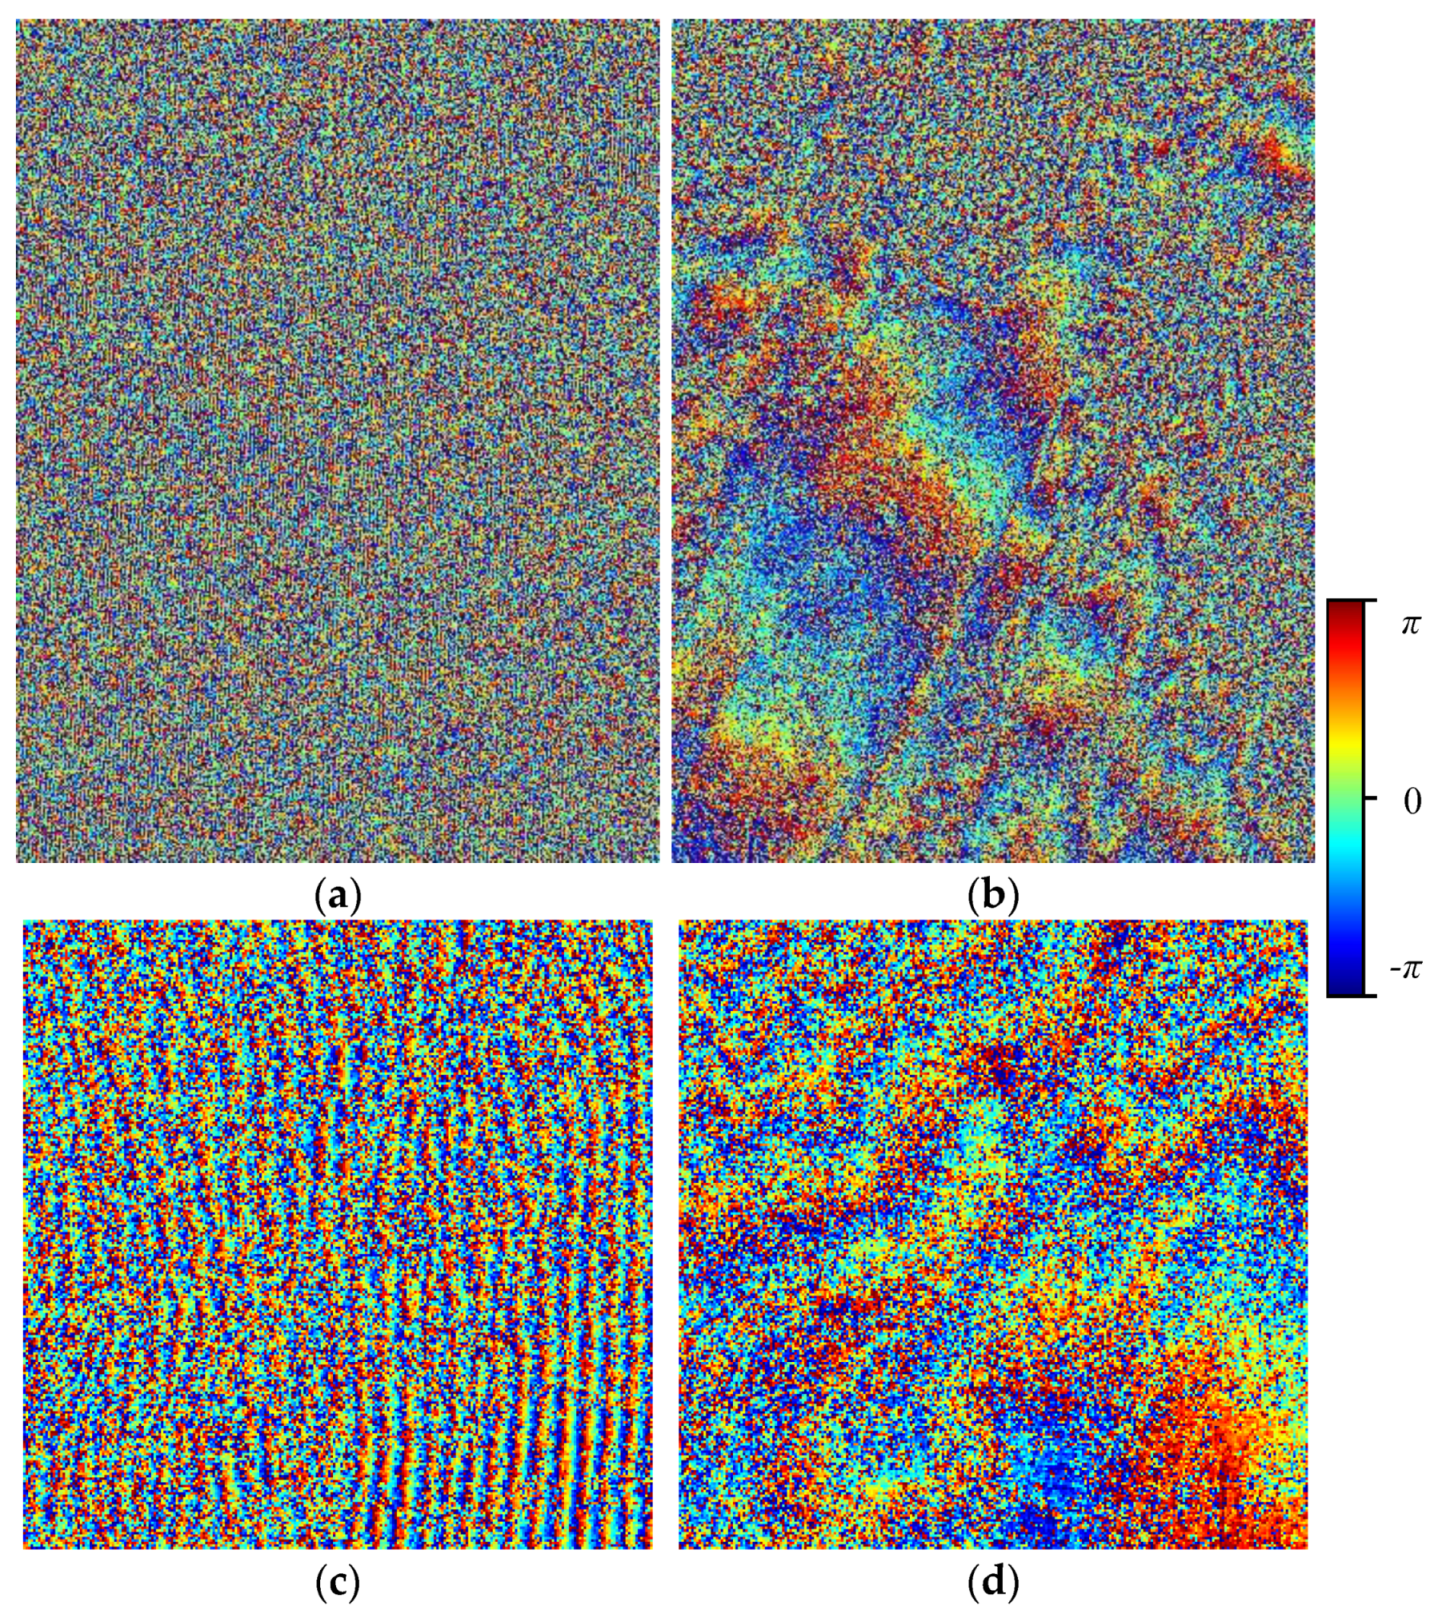
3.3. Phase Filtering

In this study, the multi-scale phase-filtering method in the wavelet domain was used to conduct phase filtering on the flattened interferogram. This method was compared with the classical Lee and the improved Goldstein filter methods [21,22] to validate the ability of phase noise removal and preserve the phase details and edges. It has been proved to have better filtering precision and can reduce the influence of data processing errors on the evaluation experiment.
The multi-scale phase filtering method based on the wavelet domain is shown in Figure 6. The filtering algorithm was based on the analysis of the wavelet residual band using discrete digital transformations, which consisted of six steps described briefly below. The details are described by López and Fàbregas [23].
Step 1: three-level wavelet transform on the complex interferometric phase. In the third decomposition level, the wavelet filter was applied to all bands using a discrete wavelet package transform (DWPT).
Step 2: mask generation. The pixel of the mask was determined by the signal quality.
Step 3: Real and imaginary parts. The real and imaginary parts of the coefficient detected as the signal were multiplied by 2, and the noise coefficient remained unchanged.
Step 4: inverse discrete wavelet transformation. Only one wavelet scale was reduced.
Step 5: mask-locating signal coefficients. To obtain mask-locating signal coefficients for previous scales (higher-frequency scales), a new mask was derived from that generated in step 2.)
We iterated steps 3–5 (dashed lines in Figure 6) three times to obtain the complex signal in the original domain.
Step 6: Phase calculation.
Meanwhile, the classical Lee method [22] and the improved Goldstein method [21] were used to carry out phase filtering and compared to the wavelet-based multi-scale method. Figure 7 is a partial region of the phase image. The original interferometric phase image was annihilated by speckle noise. After processing with the three filtering methods, the SNR of the phase image was improved to different degrees. From the visual effects, the filtering results of the Lee method kept a certain proportion of phase noise, whereas the Goldstein method and our method had almost the same effect on noise removal. It was visually judged that both the Goldstein and our method outperformed the Lee method with regards to phase de-noising ability. Therefore, the Goldstein method was mainly used as a comparison to our method; the Goldstein method retained a small amount of noise signal, and some effective signal components were lost to a certain extent. However, for the phase image obtained by our filtering method, the noise level was slightly lower than that of the Goldstein method, and more details and edges were preserved. Figure 8 shows the local details of Figure 7. It can be observed that the Lee method had some ability for maintaining phase details and stripe edges, but the higher noise level still affected the extraction of true phases. On the other hand, the Goldstein method achieved good results in general, but for some regions, the details were blurred because of the filtering, and even the edges of the phase jump were filtered with poor preservation, which will have a negative impact on the subsequent unwrapping and the inversion of terrain or deformation. Our method not only filtered out the phase noise, but also preserved the original phase details and fringe edges more completely.
The multi-scale phase-filtering method in the wavelet domain was applied to the flattened interferogram (Figure 3b) of Gaofen-3. As shown in Figure 9, the average coherence value of the filtered interferogram is increased to 0.834.

3.4. Phase Unwrapping

Based on the results of the high-accuracy phase filtering, the minimum cost flow method was used to unwrap the phase with a coherence higher than 0.3. The unwrapping result is shown in Figure 10.

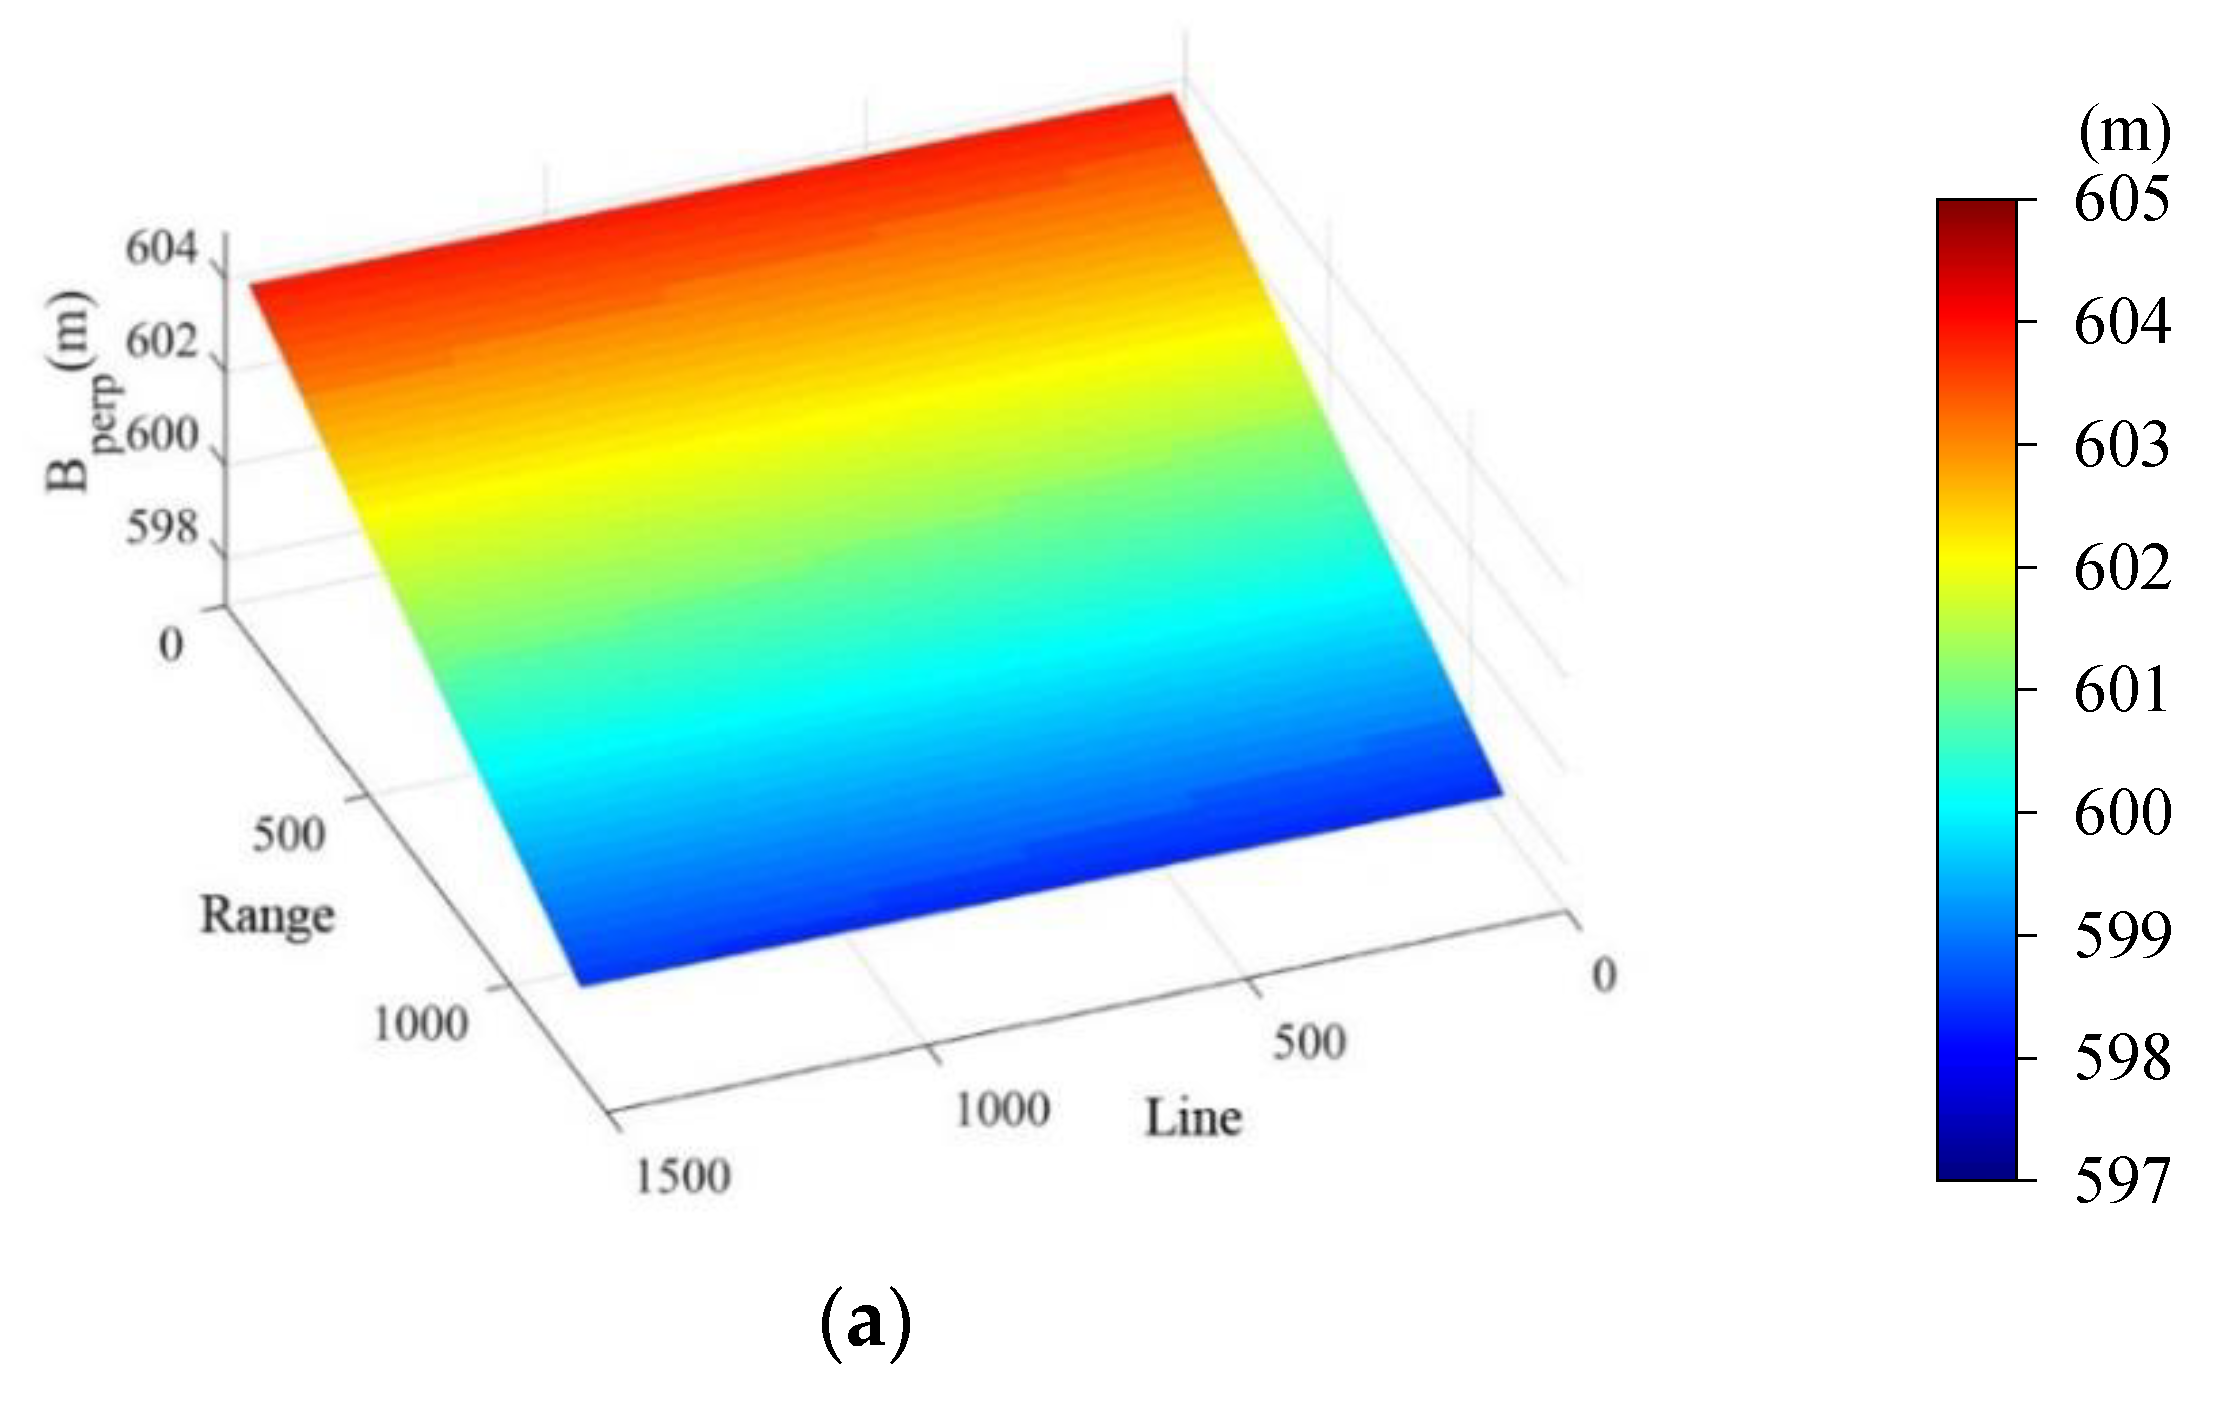
3.5. Baseline Measurement and Elevation Maps

In our study, the vertical baseline of the interferometric pair was 598 m, the slant range was 990 km, the viewing angle was 43.36°, and the radar operating wavelength of Gaofen-3 was 5.55 cm. Therefore, the elevation ambiguity was as follows:
Δ h 2 π = λ R 1 sin θ 2 B 32.0 m .
The elevation was obtained in two ways. The first involved estimating the baseline using orbital parameters, and using the residual fringe frequency of the flattened interferogram to estimate the trend system error of the baseline parameters and refining the baseline. The second was to obtain high-accuracy baseline parameters through the ground control points and phase unwrapping and then solving the elevation. These two methods were consequently employed to measure the evaluation accuracy of InSAR technology for Gaofen-3 data with or without ground control points. Figure 11a,b shows the obtained vertical baselines with or without ground control points, respectively.
As can be seen from Figure 11a, the time variation of the vertical baseline was small due to the high degree of parallelism of the orbits. Limited by the orbital accuracy, the vertical baselines calculated by the orbital parameters could not reflect the small number of changes in azimuth. Therefore, the flat-earth phase calculated by this baseline will bring about systematic errors, and the residual regular fringes will be shown in the flattened interferogram. After estimating the phase residuals by the means of least squares adjustment and refining the baseline, the obtained vertical baseline was compared to that calculated by the ground control points, as shown in Figure 11b. There existed a nearly linear difference in the baseline parameters obtained by the orbital parameters combined with the means of least squares adjustment and ground control points, ranging from 0 to 4 cm, mainly varying in azimuth, with small changes in range. The system difference was due to the limited accuracy of the estimation of the baseline parameters using residual phase frequency, which will finally be reflected by the accuracy differences in evaluation calculated with and without ground control points. The DEM calculated and inverted with control points is shown in Figure 12a, and the DEM with baselines through the orbital parameters, refined and inverted, is shown in Figure 12b.

4. Discussion

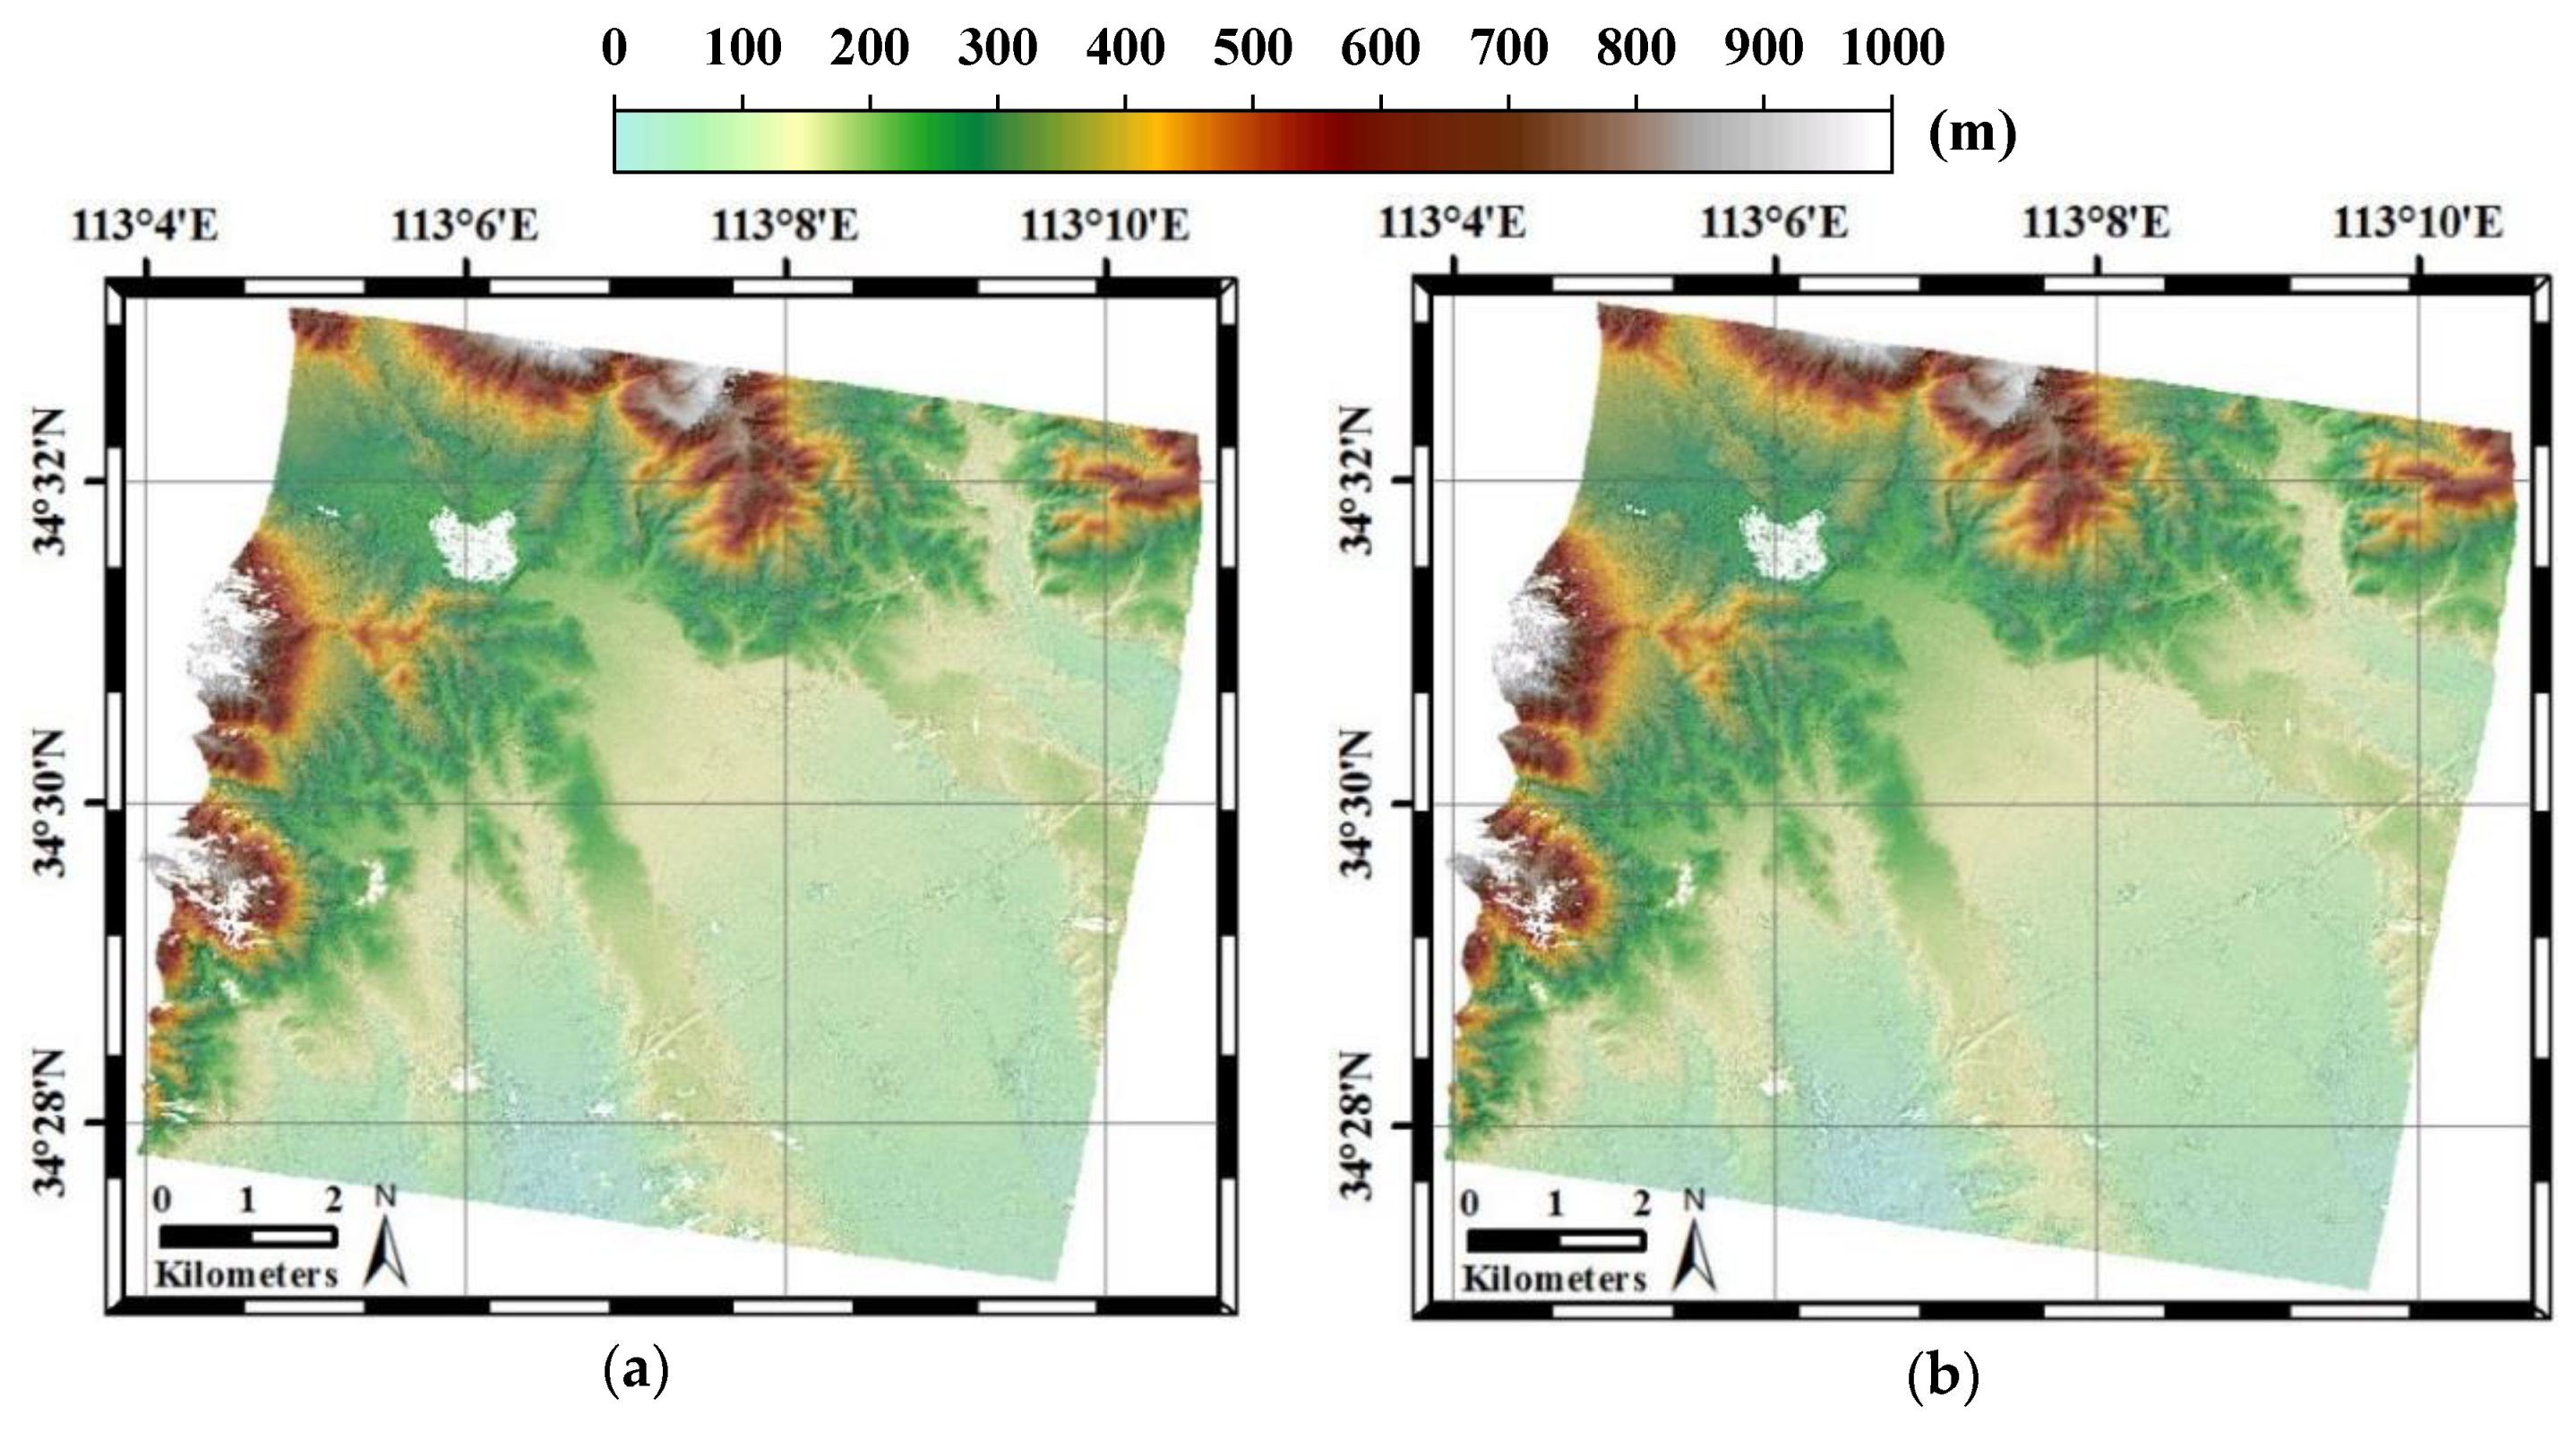
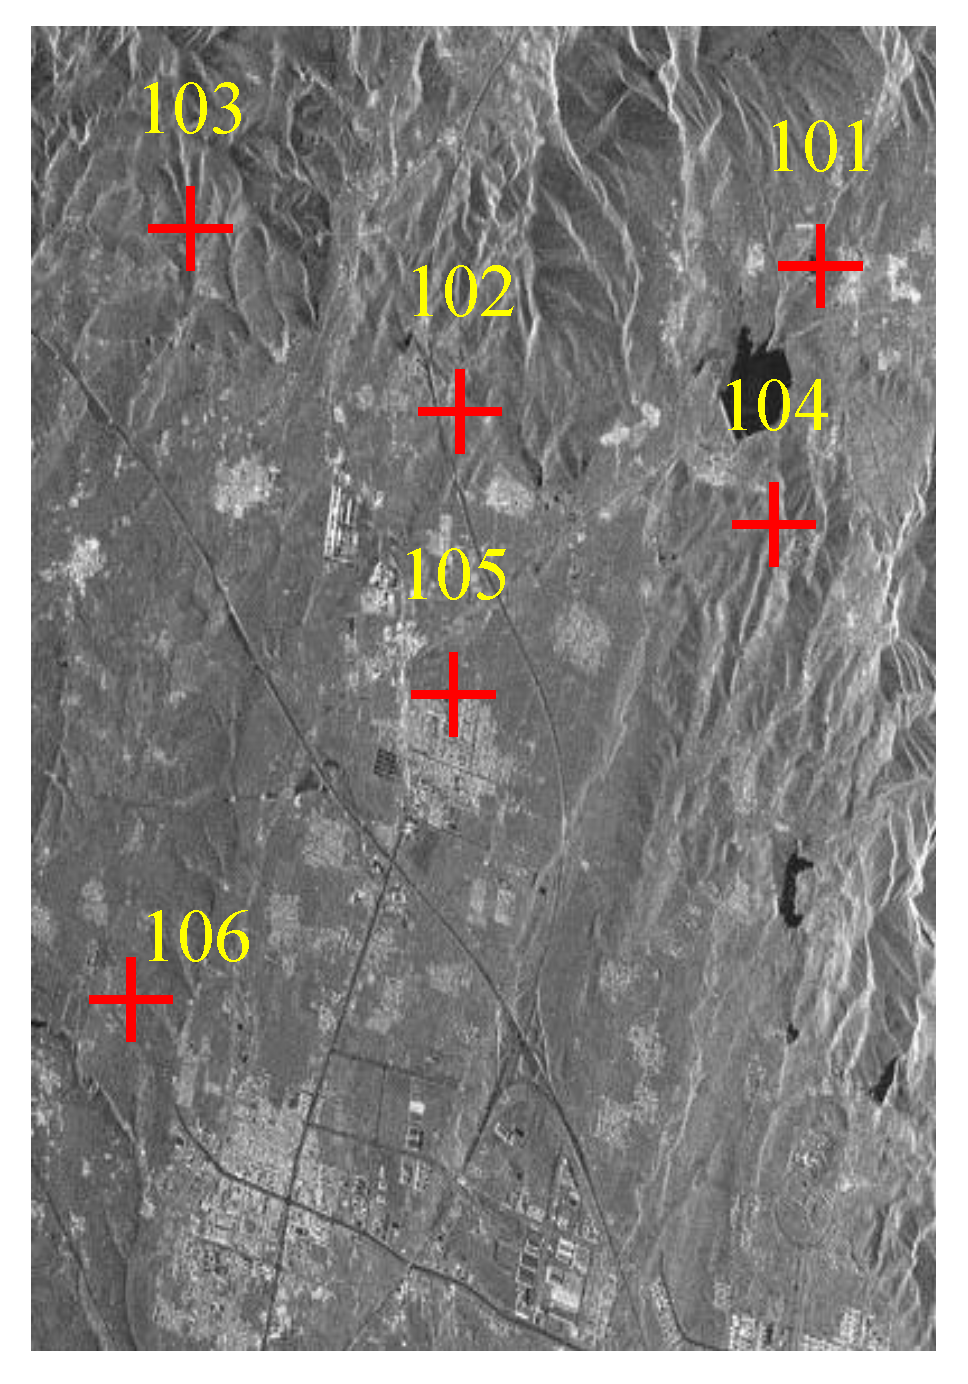
4.1. Elevation Accuracy Evaluation with GCPs and 1:2000-Scale DEM Data

Six GCPs (Ground Control Points) in the Dengfeng area were adopted to evaluate the height accuracy derived from the Gaofen-3 SAR images. Those GCPs were obtained from six corner reflectors, which were placed in the study area in advance. Figure 13 shows the distribution of six corner reflector control points on Gaofen-3 SAR image.
The elevation value obtained by Gaofen-3 was compared with six GCPs, as shown in Table 4. The difference is from −1.694 to 6.494 m and the root mean square error is about 3.3 m.
In order to carry out more accurate verification work, 1:2000-scale DEM data obtained from an aerial survey. The visual difference between the two DEMs in Figure 12 is not significant, and the difference between the obtained DEM and the 1:2000-scale DEM was therefore calculated to measure the elevation accuracy (Figure 14a,b). According to the statistics of elevation residuals, the height measurement accuracy of InSAR technology for the Gaofen-3 satellite data in the Dengfeng area was better than 4 m under control conditions, whereas the height measurement accuracy of InSAR under non-control conditions was better than 7 m.

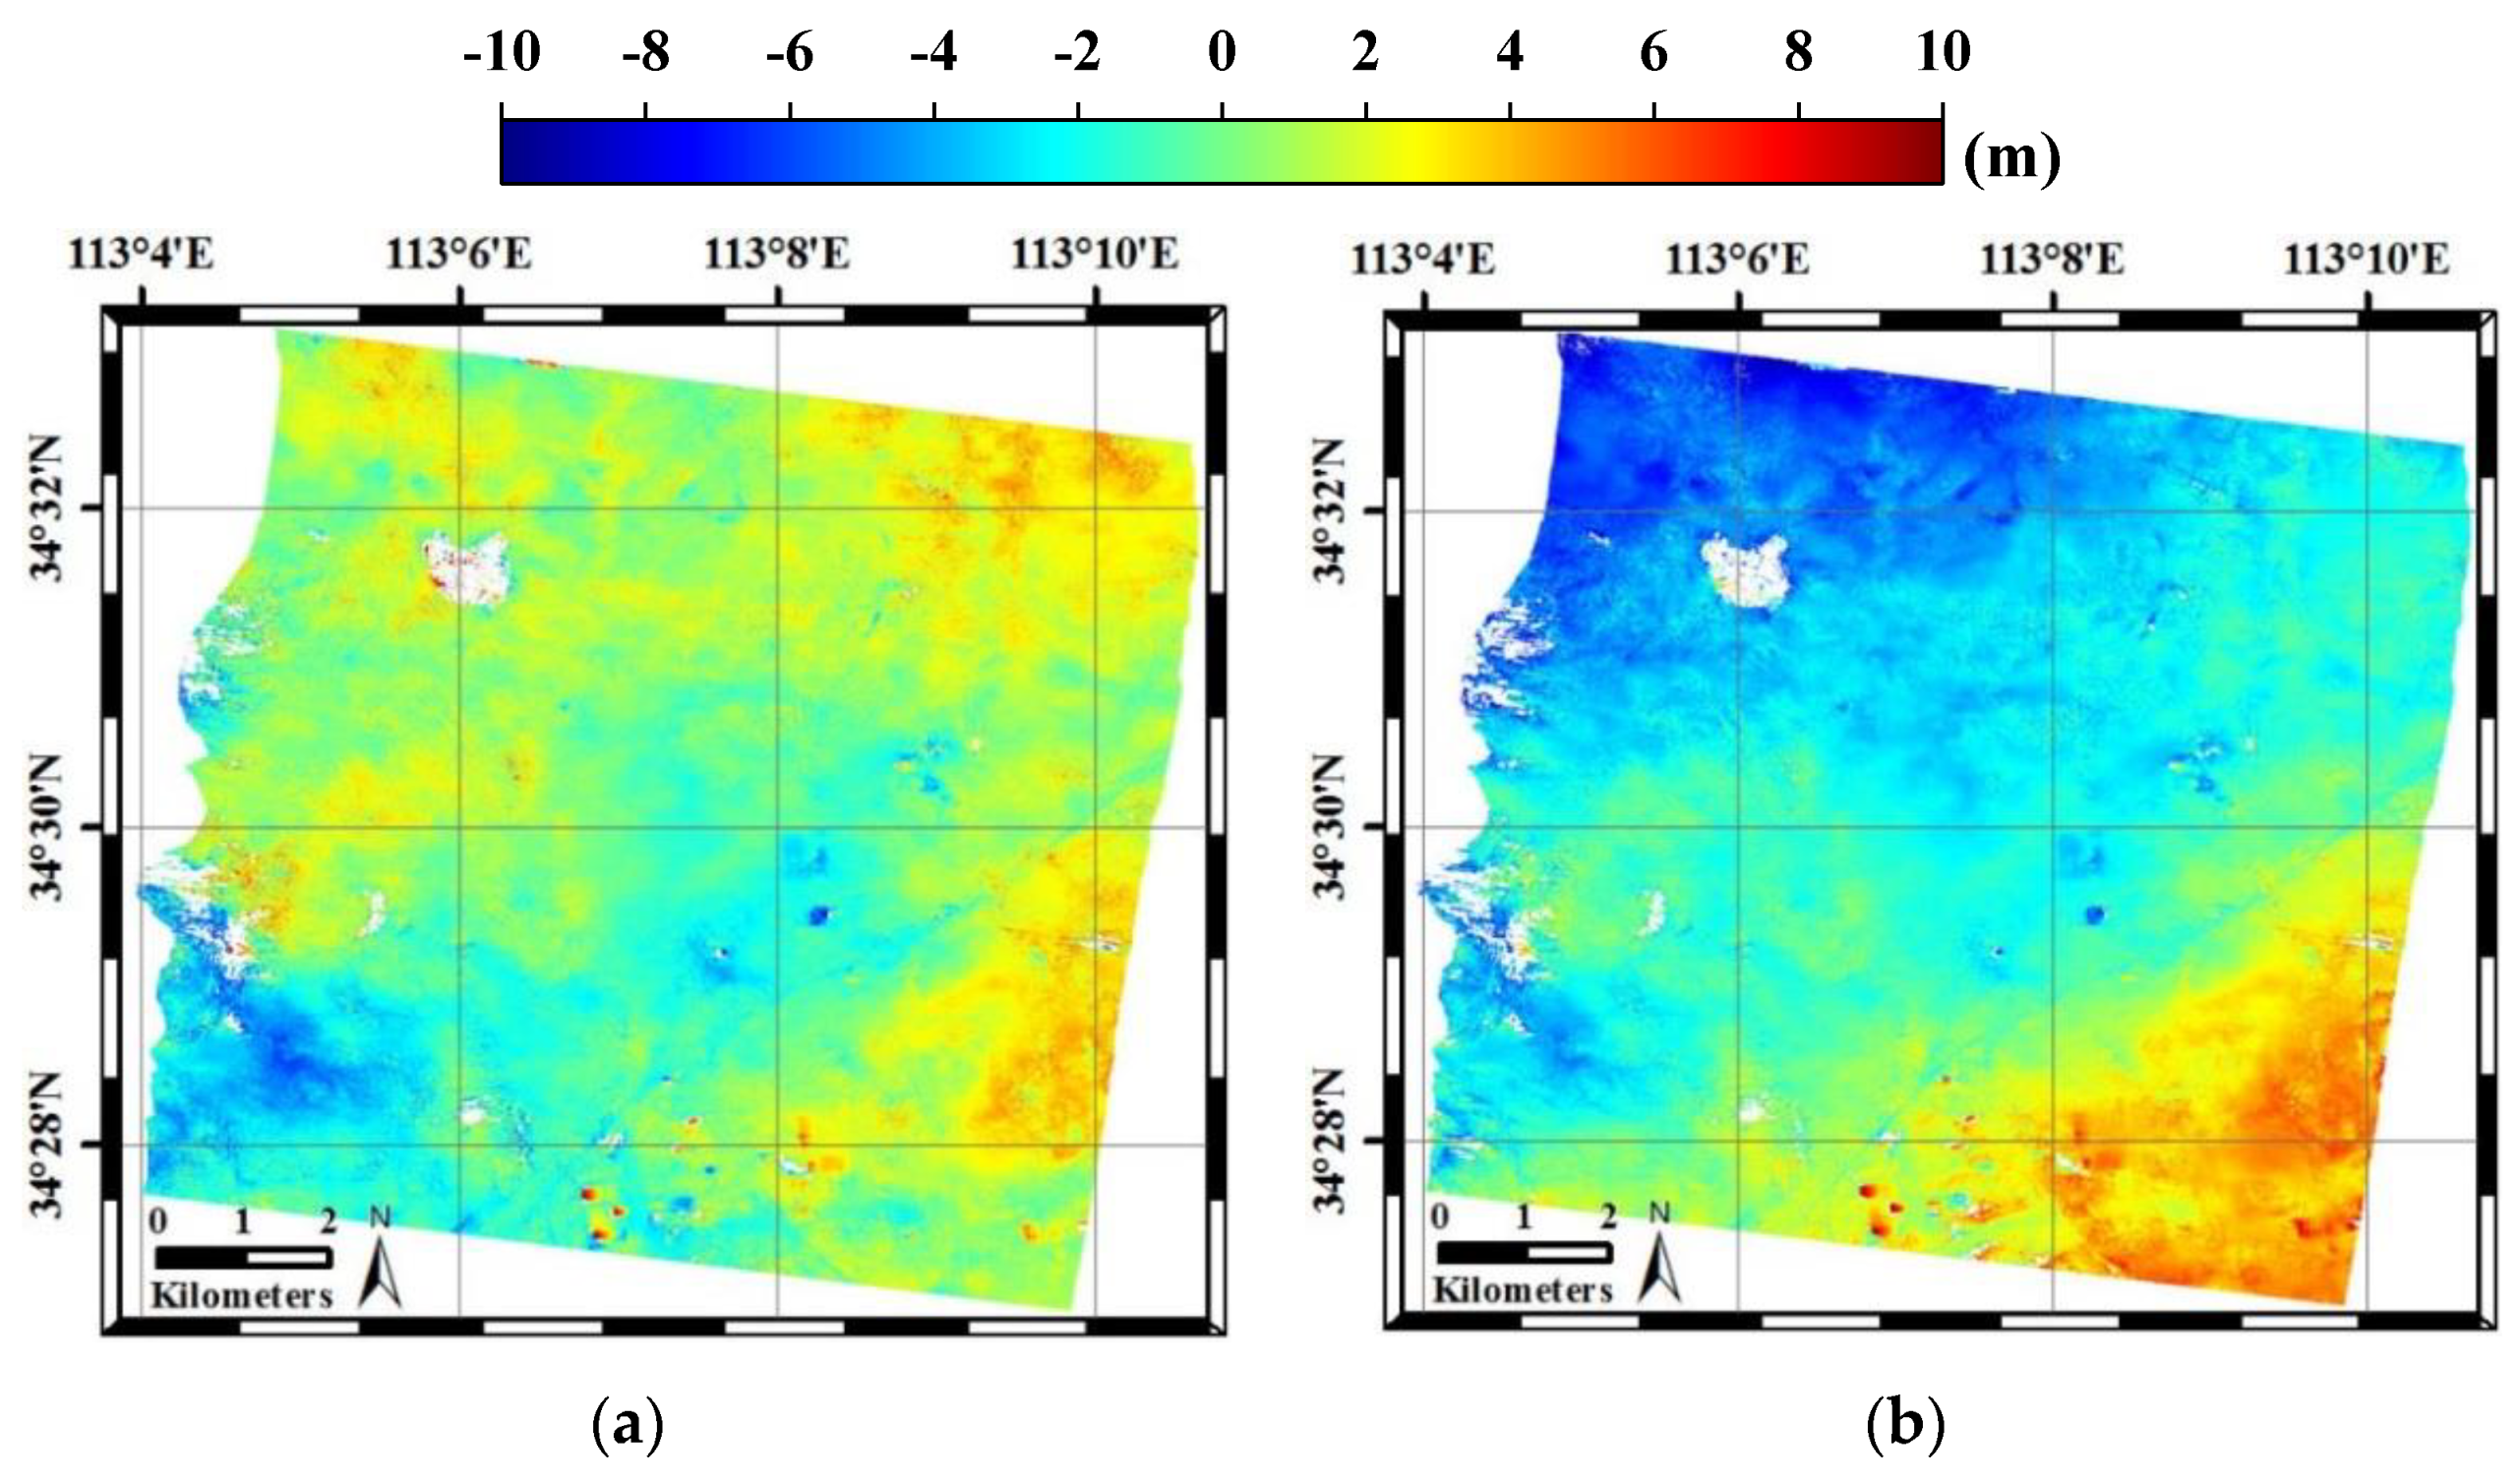
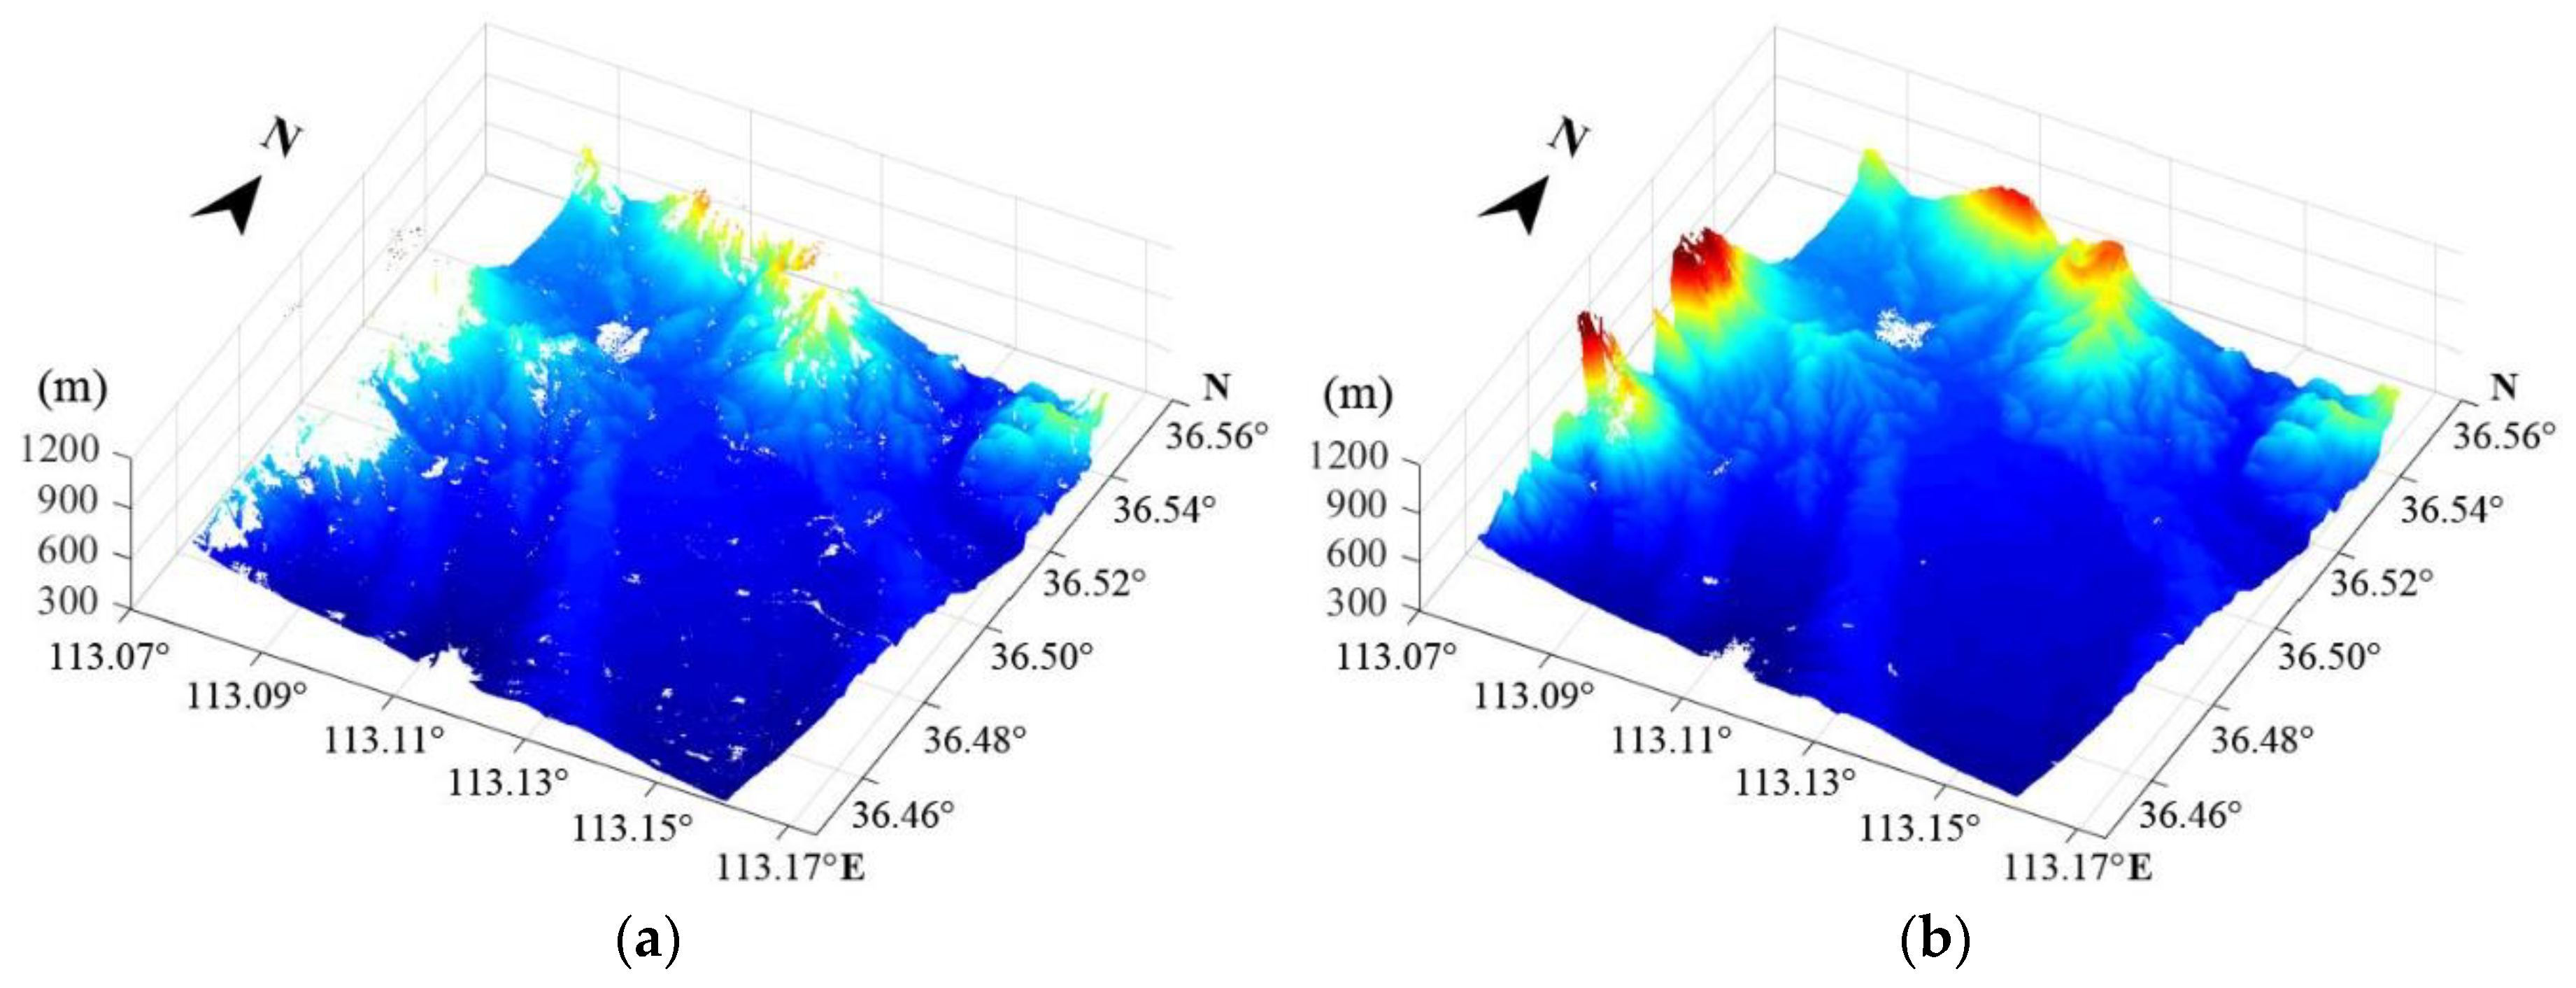
4.2. Comparison with Yaogan-29 Satellite

For comparison with other SAR sensors and further analysis of the interferometric measurement capability of Chinese SAR satellites, we processed the dataset of the same area acquired by the Chinese non-civilian Yaogan-29 satellite with the same methods. The basic information of the SAR pair acquired by Yaogan-29 sensors is shown in Table 5.
In this case, the vertical baseline of the interferometric pair was 1935.54 m, the slant range was 755 km, the viewing angle was 34.91°, and the radar operating wavelength was 3.1 cm. The long vertical baseline means a very small ambiguity as follows:
Δ h 2 π = λ R 1 sin θ 2 B 3.48 m .
The DEM calculated with control points is shown in Figure 15a. We further calculated the difference between the obtained DEM and 1:2000-scale DEM to measure the elevation accuracy (Figure 15b).
When ignoring the absence of local elevation, the elevation accuracy of the DEM in Dengfeng acquired through Yaogan-29 reached an accuracy of better than 2 m on level ground and better than 5 m in mountainous areas. In this case, benefiting from the large vertical baseline, the elevation accuracy of Yaogan-29 was better than that of Gaofen-3. However, the geometrical decorrelation of the former is more severe than that of the latter. Figure 16 shows the comparison of the effective elevation distributions obtained by these two sensors.

5. Conclusions

The Gaofen-3 satellite is China’s first SAR satellite to have interferometric abilities. In this study, interferometric data processing and height measurement experiments were carried out. Data from the Dengfeng area was used to evaluate the interferometric imaging and measurement capabilities of the domestic SAR satellite. In order to reduce the errors introduced by the processing as much as possible, a high-accuracy InSAR image co-registration strategy was adopted. The co-registration accuracy reached the 0.01-pixel level. Moreover, a multi-scale phase filtering method in the wavelet domain was employed to improve the SNR of the interferometric phase. The interferometry baselines were subsequently calculated with and without ground control point schemes, respectively. The elevation inversion was performed to evaluate the accuracy of the interferometric height measurement under these conditions. Initially, our experimental results showed that the height measurement accuracy of Gaofen-3 repeated-orbit interferometry under control conditions was higher than 4 m and higher than 7 m under non-control conditions.
Our experiments proved that China’s SAR satellite Gaofen-3 has a certain degree of interferometric imaging and measurement capabilities. It has a high coherence and SNR in the presence of certain time and geometrical decorrelation, which indicates its mapping abilities and constitutes a major breakthrough in the field of Chinese SAR technology.
Since Gaofen-3 is a single-antenna SAR satellite, with a repetitive orbit interferometry mode, it would be more useful when applied to the field of surface deformation monitoring. However, the capability of specific deformation monitoring needs further verification. In this study, the interferometry verification and evaluation of Gaofen-3 satellite data with a fine strip I model was carried out. Other imaging modes, including all-polarization and bunching modes, should be verified, and the applications and evaluations related to surface deformation monitoring should be studied in the near future.

Author Contributions

Data curation, Z.C.; formal analysis, Y.Z.; investigation, Y.Z.; methodology, Y.Z. and Z.C.; project administration, G.Z.; supervision, G.Z.; validation, Y.Z.; visualization, Z.C.; writing—original draft, Z.C. All authors have read and agreed to the published version of the manuscript.

Funding

This research was funded by Wuhan university (Wuhan, China) through National Key R&D Program of China (2018YFC0825803), Natural Science Foundation of China projects (NSFC) (No: 41801397).

Acknowledgments

The authors would like to thank the editors and the anonymous reviewers for their constructive suggestions.

Conflicts of Interest

The authors declare no conflict of interest.

References

  1. Madsen, S.; Zebker, H.; Martin, J. Topographic mapping using radar interferometry: Processing techniques. IEEE Trans. Geosci. Remote Sens. 1993, 31, 246–256. [Google Scholar] [CrossRef]
  2. Zhang, Q. System Design and Key Technologies of the GF-3 Satellite. Acta Geod. Cartogr. Sin. 2017, 46, 269–277. [Google Scholar]
  3. Zebker, H.; Werner, C.; Rosen, P. Accuracy of topographic maps derived from ERS-1 interferometric radar. IEEE Trans. Geosci. Remote Sens. 1994, 32, 823–836. [Google Scholar] [CrossRef] [Green Version]
  4. Thompson, D.; Robertson, A.; Arnold, D. Multi-baseline interferometric SAR for iterative height estimation. In Proceedings of the IEEE International Geoscience and Remote Sensing Symposium, Hamburg, Germany, 28 June–2 July 1999; pp. 251–253. [Google Scholar]
  5. Ferretti, A.; Prati, C.; Rocca, F. Multibaseline InSAR DEM reconstruction: The wavelet approach. IEEE Trans. Geosci. Remote Sens. 2002, 37, 705–715. [Google Scholar] [CrossRef]
  6. Guarnieri, A. SAR interferometry and statistical topography. IEEE Trans. Geosci. Remote Sens. 2002, 40, 2567–2581. [Google Scholar] [CrossRef]
  7. Werninghaus, R.; Buckreuss, S. The TerraSAR-X Mission and System Design. IEEE Trans. Geosci. Remote Sens. 2010, 48, 606–614. [Google Scholar] [CrossRef] [Green Version]
  8. Krieger, G.; Fiedler, H.; Zink, M. The TanDEM-X mission: A satellite formation for high-resolution SAR interferometry. In Proceedings of the 4th European Radar Conference, Munich, Germany, 10–12 October 2007; pp. 83–86. [Google Scholar]
  9. Bamler, R.; Just, D. phase statistics and decorrelation in SAR interferograms. In Proceedings of the IEEE International Geoscience and Remote Sensing Symposium, Tokyo, Japan, 18–21 August 1993; pp. 980–984. [Google Scholar]
  10. Covello, F.; Battazza, F.; Coletta, A. COSMO-SkyMed mission status: Three out of four satellites in orbit. In Proceedings of the IEEE Geoscience and Remote Sensing Symposium, Cape Town, South Africa, 12–17 July 2009; pp. 773–776. [Google Scholar]
  11. Thompson, A.; Luscombe, A.; James, K. RADARSAT-2 Mission Status: Capabilities Demonstrated and Image Quality Achieved. In Proceedings of the European Conference on Synthetic Aperture Radar, Friedrichshafen, Germany, 2–5 June 2008; pp. 1–4. [Google Scholar]
  12. Igarashi, T. Alos mission requirement and sensor specifications. Adv. Spacd Res. 2001, 28, 127–131. [Google Scholar] [CrossRef]
  13. Kankaku, Y.; Osawa, Y.; Hatooka, Y. The overview of the L-band SAR onboard ALOS-2. Tech. Rep. IEICE Sane. 2009, 110, 117–120. [Google Scholar]
  14. Miranda, N.; Rosich, B.; Meadows, P. The EnviSAT ASAR Mission: A Look Back at 10 Years of Operation; ESA Living Planet Symposium: Edinburgh, UK, 2013; p. 41. [Google Scholar]
  15. Torres, R.; Snoeij, P.; Geudtner, D. GMES Sentinel-1 mission. Remote Sens Environ. 2012, 120, 9–24. [Google Scholar] [CrossRef]
  16. Deng, M.J.; Zhang, G.; Zhao, R. Improvement of Gaofen-3 Absolute Positioning Accuracy Based on Cross-Calibration. Sensors 2017, 17, 2903. [Google Scholar] [CrossRef] [PubMed] [Green Version]
  17. Shao, W.; Sheng, Y.; Sun, J. Preliminary Assessment of Wind and Wave Retrieval from Chinese Gaofen-3 SAR Imagery. Sensors 2017, 17, 1705. [Google Scholar] [CrossRef] [PubMed] [Green Version]
  18. Wang, H.; Wang, J.; Yang, J. Empirical Algorithm for Significant Wave Height Retrieval from Wave Mode Data Provided by the Chinese Satellite Gaofen-3. Remote Sensing 2018, 10, 363. [Google Scholar] [CrossRef] [Green Version]
  19. An, Q.; Pan, Z.; You, H. Ship Detection in Gaofen-3 SAR Images Based on Sea Clutter Distribution Analysis and Deep Convolutional Neural Network. Sensors 2018, 18, 334. [Google Scholar] [CrossRef] [PubMed] [Green Version]
  20. Chen, Z.; Zhang, L.; Zhang, G. An Improved InSAR Image Co-Registration Method for Pairs with Relatively Big Distortions or Large Incoherent Areas. Sensors 2016, 16, 1519. [Google Scholar] [CrossRef] [PubMed] [Green Version]
  21. Goldstein, R.; Werner, C. Radar interferogram filtering for geophysical applications. Geophys. Res. Lett. 1998, 25, 4035–4038. [Google Scholar] [CrossRef] [Green Version]
  22. Lee, J.; Papathanassiou, K.; Ainsworth, T.; Grunes, M.; Reigber, A. A new technique for noise filtering of SAR interferometric phase images. IEEE Trans. Geosci. Remote Sens. 1998, 36, 1456–1465. [Google Scholar]
  23. López, C.; Fàbregas, X. Modeling and Reduction of SAR Interferometric Phase Noise in the Wavelet Domain. IEEE Trans. Geosci. Remote Sens. 2002, 40, 2553–2566. [Google Scholar] [CrossRef] [Green Version]
Figure 1. Geographical coverage (Dengfeng area, China) of experimental dataset of the Gaofen-3 (GF3) satellite (a), single look complex intensity image from the GF-3 satellite in the Dengfeng area (b), and the corresponding distribution of elevation acquired by the Shuttle Radar Topography Mission (c).
Applsci 10 00806 g001
Figure 2. Improved high-accuracy interferometric synthetic-aperture radar co-registration method used in this study. DEM: digital elevation model; SCR: signal-to-clutter-ratio.
Applsci 10 00806 g002
Figure 3. Interferograms of the experimental Gaofen-3 satellite data in the Dengfeng area, China: (a) interferogram, (b) flattened interferogram, (c) local part of the interferogram, (d) local part of the flattened interferogram.
Applsci 10 00806 g003
Figure 4. Coherence analysis of the flattened interferogram with (a) coherence map and (b) coherence probability histogram.
Applsci 10 00806 g004
Figure 5. Interferograms of the Sentinel-1 satellite data in the Dengfeng area, China: (a) interferogram with temporal baseline of six days, (b) interferogram with temporal baseline of thirty-six days, (c) coherence map of the interferogram with temporal baseline of six days, (d) coherence map of the interferogram with temporal baseline of thirty-six days.
Applsci 10 00806 g005aApplsci 10 00806 g005b
Figure 6. Multi-scale phase filtering process in the wavelet domain via six steps. DWPT: discrete wavelet package transform; DWT: discrete wavelet transform; Imag part: imaginary part; ϕx: original phase; i: iteration times.
Applsci 10 00806 g006
Figure 7. Comparison of the results of three phase filtering methods: (a) original interferogram, (b) Lee method, (c) Goldstein method, and (d) our method.
Applsci 10 00806 g007
Figure 8. Comparison of the details of three-phase filtering methods showing local details: (a,e) original interferogram, (b,f) Lee method, (c,g) Goldstein method, and (d,h) our method.
Applsci 10 00806 g008aApplsci 10 00806 g008b
Figure 9. Interferogram after phase filtering with the multi-scale phase-filtering method in the wavelet domain.
Applsci 10 00806 g009
Figure 10. Phase unwrapping results with the minimum cost flow method.
Applsci 10 00806 g010
Figure 11. Distribution of vertical baselines (B) obtained by ground control points (a) and the difference distribution of vertical baselines (ΔB) obtained through ground control points, orbits, and least-squares adjustment method (b).
Applsci 10 00806 g011aApplsci 10 00806 g011b
Figure 12. The digital elevation models acquired with ground control points (GCPs) (a) and without GCPs (b).
Applsci 10 00806 g012
Figure 13. Distribution of corner reflector control points on Gaofen-3 SAR image.
Applsci 10 00806 g013
Figure 14. Distribution maps of evaluation difference between the 1:2000-scale DEM and the obtained DEM with GCPs (a) and without GCPs (b).
Applsci 10 00806 g014
Figure 15. DEM acquired by Yaogan-29 sensor with GCPs (a) and the distribution map of the evaluation difference between the 1:2000-scale DEM and the obtained DEM (b).
Applsci 10 00806 g015
Figure 16. The effective elevation distributions obtained by Yaogan-29 (a) and Gaofen-3 (b).
Applsci 10 00806 g016
Table 1. Basic parameters of interferometric synthetic-aperture radar satellites globally and the Gaofen-3 satellite in particular.
SatelliteResolution (m)Launch TimeCountry/AreaOrbit Altitude (km)BandRevisit Time (day)
ERS-1/230 × 30July 1991/April 1995Europe785/824C35
JERS-118 × 18February 1992Japan568L44
Radarsat-19–100November 1995Canada798C24
Envisat-110–1000March 2002Europe768C35
ALOS-110–100January 2006Japana692L46
TerraSAR-X1–18.5June 2007Germany514X11
COSMO-SkyMed1–100June 2007
December 2007
October 2008
November 2010
Italy619X16
Radarsat-23–100December 2007Canada798C24
TanDEM-X1–16June 2010Germany514X11
ALOS-2(1–60) × (3–100)May 2014Japan628L14
Sentinel-1A/1B(5–20) × (5–40)April 2014/April 2016Europe693C6
Gaofen-31–500August 2016China755C29
Table 2. Imaging modes and parameters of the Gaofen-3 satellite.
Imaging ModeIncidence Angle (°)Resolution (m)Observation Width (km)
RangeAzimuth
Spotlight20~501.0–1.50.9–2.510 × 10
Ultrafine strip20~5032.5–530
Fine strip I19~5054–650
Fine strip II19~50108–1295–110
Standard strip17~502515–3095–150
Narrow scanning17~5050~6030–60300
Wide scanning17~5010050–110500
Global observation17~53500350–700650
Full polarization strip I20~4186–920–35
Full polarization strip II20~382515~3035–50
Wave20~41108~125 × 5
Table 3. Gaofen-3 satellite data of experimental area (Dengfeng area, China).
Master ImageSlave Image
Date29 November 201628 December 2016
ModeFine strip I
Resolution3 m
Wave length5.56 cm (C band)
Path directionDescending
Table 4. Elevation accuracy evaluated by six GCPs.
No.Elevation Value
from GCPs (m)
Elevation Value from Gaofen-3 SAR Images (m)Difference (m)
101470.257468.563−1.694
102425.266423.952−1.314
103406.783413.2676.484
104482.970485.0122.042
105364.747368.4493.702
106372.336378.836.494
RMSE3.305
Table 5. Yaogan-29 satellite data of the experimental area (Dengfeng area, China).
Master ImageSlave Image
Date20 December 201518 November 2016
ModeStrip
Resolution1 m
Wave length3.1 cm (X band)
Path directionDescending

