Article

Complete Evaluation of Cell Mixing and Hydrodynamic Performance of Thin-Layer Cascade Reactor

1
School of Mechanical Engineering, Kyungpook National University, 80 Daehakro, Bukgu, Daegu 41566, Korea
2
Department of Chemical Engineering, Norwegian University of Science and Technology, NO-7491 Trondheim, Norway
*
Author to whom correspondence should be addressed.
Appl. Sci. 2020, 10(3), 746; https://doi.org/10.3390/app10030746
Submission received: 10 December 2019 / Revised: 10 January 2020 / Accepted: 16 January 2020 / Published: 21 January 2020
(This article belongs to the Special Issue New Trends on Algal Biotechnology for a Circular Economy)

Abstract

:
Microalgae are a great source of food and supplements as well as a potential source for the production of biofuels. However, the operational cost must be reduced to allow viable productions of bulk chemicals such as biofuels from microalgae. One approach to minimize the cost is to increase the efficiency of the photobioreactor. Photobioreactor efficiency is correlated to hydrodynamic mixing, which promotes single cell exposure to sunlight, keeps algae cells in suspension, and homogenizes the distribution of nutrients. Thus, a possible route to enhance the efficiency of the photobioreactor can be identified through an improved understanding of the mixing phenomenon. Therefore, for the current thin-layer cascade reactor, two aspects of its performance—namely, cell mixing and hydrodynamic characteristics—are evaluated under varying mass flow rates, slope angles, water depths, and aspect ratios of the channel by using computational fluid dynamics. The resulting model is validated with experimental data. Results reveal that limited cell mixing is achieved in the thin-layer cascade reactor with increased water depth and large aspect ratios. However, cell mixing is significantly increased at high mass flow rates. The increase in the mass flow rate and slope angle results in increased flow velocity and power consumption.

1. Introduction

Microalgae are small organisms that convert sunlight into energy in the presence of CO2 and nutrients. Microalgae have been studied intensively in the past because of their application in food, medicines, and compounds for biofuels [1,2]. Different mass culture systems have been used for the production of microalgae. Mainly, they are divided into open and closed photobioreactors. Closed photobioreactors are used for high-quality biomass production, but they require greater power consumption, thus making it economically expensive [3]. Open raceway ponds are being widely used for the large-scale culturing of microalgae in the world. The advantages of raceways are their relatively low cost and simple design. However, because of the high culture thickness in raceways (15–30 cm), the photo inhabitation can affect the photosynthesis phenomenon and consequently the algal productivity. They operate at low fluid velocity, and thereby, a paddle wheel is required to keep algal cells in suspension [4,5]. An alternate approach for the mass production of microalgae is a thin-layer cascade reactor first introduced by Dr. Ivan Setlík in the 1960s [6]. A thin-layer cascade reactor is an open system for the commercial-scale cultivation of microalgae [7,8]. A thin-layer cascade (TLC) reactor consists of shallow channels with a thin layer (thickness ≤ 10 mm) of algal culture medium. The thin layer of algal suspension improves light utilization and results in high biomass density (25–35 g/L) [8,9].
Photoinhibition is a major challenge in TLC reactors because it considerably affects the photosynthetic efficiency of algal cells and consequently reduces biomass production [9,10,11]. Light attenuation occurs as the liquid layer becomes thicker in a TLC reactor, which decreases the local light penetration. A steep gradient in light attenuation is expected along the culture depth. Thus, effective culture mixing is necessary to prevent photoinhibition in TLC reactors. Culture mixing also prevents cell sedimentation in the TLC reactor. The increase in layer thickness escalates the chances of cell sedimentation by increasing the residence time of algal cells in a TLC reactor. Precisely, an increase in layer thickness results in a twofold increase in the residence time of algae cells/decrease in algae cell mixing [12,13].
Culture mixing significantly depends on various design parameters of TLC reactors, such as channel dimensions and slope angles and flow rates. At high cultural thickness, algae cell mixing can be improved by increasing flow velocity [7]. However, the power required for mixing the suspension increases with the increase in cultural thickness and inclination of the slope [14]. Therefore, TLC reactors with small culture thicknesses are favorable for high biomass densities of microalgae. The small suspension layer limits the night biomass loss by respiration and promotes faster warming of the culture at the start of cultivation, thereby preventing the strong photoinhibition of algal growth [15,16,17].
The algal productivity is strongly influenced by the inclination angle of the reactor and water depth. Under optimal climate conditions, the increase in channel length and slope angle causes a substantial increase in algal biomass productivity because of the increase in photosynthetic efficiency. However, the night biomass loss sufficiently increases with the increase in culture thickness [14].
The algal productivity in TLC is considerably affected by the surface-to-volume ratio. A TLC reactor unit with a large surface-to-volume ratio is a more efficient system for biomass density (about 30%) as compared to the unit with a small surface-to-volume ratio [8]. However, at low volumes of suspension, the utilization of light energy and algal growth can be increased by vigorous culture mixing [18]. The photon energy received by each cell is also considerably affected by the length of the optical path (thickness of culture layer), the design of the cultivation unit, and the rate of mixing. The highest growth rate and productivity is achieved in cultivation systems with lower microalgae layer thickness. Small culture depth, high flow velocity, and higher slope angles create intensive turbulence, which optimizes the change of light and dark periods of individual cells and results in a higher efficiency of light utilization [19,20].
Cultural thickness also plays an important role in the carbonation efficiency of TLC. High culture thickness also limits algal growth due to the incomplete absorption of CO2 because of the short retention time of the gas bubbles [21]. Optimizing culture mixing by selecting the suitable values of these design parameters is necessary to prevent photoinhibition in TLC reactors and consequently enhance biomass production. However, studies investigating the culture mixing in TLC reactors are lacking.
The advancement in numerical techniques and the availability of high-quality computers have allowed us to predict complex flow characteristics inside photobioreactors, especially for the cases where the use of an experimental setup is restricted by technical constraints [22]. Recently, Severin et al. [10] performed a numerical simulation to evaluate the effect of volume flow and slope angle on cultural mixing for the main cultivation channel of TLC (i.e., the upper channel). Their results confirmed that mixing could be improved at high volume flows and slope angles. However, their studies do not include a detailed evaluation of hydrodynamic and cell mixing in each compartment of the TLC reactor.
Despite its high potential for efficient biomass production, TLC in numerical studies has remained neglected. Moreover, the hydrodynamic is different in each compartment of the TLC; the residence time of the algae cell, mixing efficiency, energy consumption, and flow field will be different in each compartment. Therefore, this study investigates the hydrodynamic performance and algae cell mixing in each compartment of the reactor separately by employing computational fluid dynamics (CFD).
The numerical calculations have been performed by considering different geometrical aspects (channel width, water depth, and inclination of the surface) of the reactor. The results in terms of mixing efficiency and the residence time of algae cells have been discussed to evaluate the mixing phenomenon. For the hydrodynamic characteristics of the TLC reactor, the velocity magnitude and the hydraulic power consumption have been evaluated.

2. TLC Description and Mathematical Modeling

A three-dimensional TLC reactor as described by [11] was used in this study. The reactor had a channel length (L) of 4 m and a channel width (W) of 1 m (Figure 1). The reactor consists of an upper channel inclined in the horizontal direction connected by a flow reversal module to the lower channel in the opposite direction. The first module in the reactor is the inlet module, which distributes the water over the width of the upper channel. The angle of the inlet module to the upper plate was 55°. At the end of the upper channel, a drip edge (length: 5 cm, angle to the vertical: 10°) was designed for smooth flow into the reversal module. The bottom of the flow reversal module was sloped in the direction of the flow to assure gravity-driven flow to the lower channel. The flow of the water was according to the described order of the modules of the reactor. The length of the upper and lower channel was kept constant, and the inclination angle, water depth, and width of the reactor were varied (Table 1).

2.1. Hydrodynamic Modeling

The open channel flow behavior is evaluated based on the Reynolds number and hydraulic diameter ( D h ) , which are given below:
D h = 4 d W 2 d + W
R e = ρ D h U μ
where W represents the channel width (m), d is the channel or water depth (m), and U denotes the average water velocity (m/s). Water was taken as the working fluid with a density ( ρ ) 1000 (kg/m3) and viscosity (μ) of 0.001 (Pa. s). The flow behavior in the TLC reactor was turbulent with a Reynolds number, ranging from 6300 to 14,200 [23,24,25]. The geometrical effects were studied by using a dimensionless number, depth ratio, and aspect ratio (AR), as given below:
A R = C h a n n e l   w i d t h   C h a n n e l   d e p t h .
The hydraulic power required for mixing is the product of the flow rate Q (m3/s), cultural density ρ (kg/m3), gravity constant g (m/s2), and head loss. For the case of the cascade reactor with an inclined surface of length L (m), the hydraulic power E D (W/m2) is given by:
E D = ρ g L Q I
where I represent the inclination angle of the surface. Q is the product of liquid velocity U (m/s), thickness of algal suspension d (m) and width of the reactor W (m). Thus, the hydraulic power per unit area (W/m2) is given by [14,26].
E D / W L = ρ g U d I
The k-ω turbulence model was adopted to model the turbulence in an open channel. The simulation of turbulent flow with a k-ω model requires an initial velocity U o , initial turbulent intensity I T and turbulent length scale L T as a boundary condition.
U O = A U
I T = 0.16 ( R e ) 1 8
L T = 0.07 D h
where U O represent the initial velocity (m/s), A is the cross-sectional area (m2), and U denotes the average velocity (m/s). The continuity equation for k-ω turbulence model is given as follows:
ρ . ( u ) = 0 .
The momentum equation derived from the Bernoulli equation is given as follows:
ρ d u d t + ρ ( u . ) u = . [ ρ l + ( u + μ T ) ( u + ( u T ) ) ] + F
where F represents the body force (N/m3), u is the velocity vector (m/s), and I represents the identity matrix. The k-ω approach uses two equations to represent the turbulence properties of the flow. The first equation begins with the turbulent kinetic energy k, which determines the energy in the turbulence, and the second equation begins with turbulent dissipation rate ω, which determines the scale of turbulence. The governing equations of the turbulent kinetic energy and turbulent dissipation rate for k-ω turbulence model are as follows:
ρ k t + ρ ( u . ) k = . [ ( μ + μ t σ k * ) k ] + P k β 0 * ρ ω k
ρ ω t + ρ ( u . ) ω = . [ ( μ + μ t σ ω ) ] + α ω k P k ρ β 0 ω 2
where σ ω and σ k represent the Prandtl numbers for the dissipation rate and kinetic energy, respectively. The typical values of the model constant used in the present study are given as α = 0.55 , σ k * = 0.5 , σ ω = 0.5 , and β * = 0.09 .
The turbulent viscosity defined by the k-ω turbulence model is given by:
μ T = ρ k ω
where μ T is the turbulent viscosity (Pa. s), ω denotes the dissipation rate (1/s), k represents the turbulent kinetic energy (m2/s2), and ρ is the density of water (kg/m3). The production term is given as follows:
P k = μ T [ u : ( u + ( u T ) ) ] .

2.2. Algae Cell Modeling

The productivity of microalgae is strongly affected by hydrodynamic mixing, which ensures single cell exposure to light, even the distribution of nutrients, the prevention of sedimentation, and an enhanced utilization of CO2. The mixing phenomenon is well explained by the cell distribution inside the reactor. The criterion that determines whether the algae cells follow the fluid stream is called the Stokes number, which is defined as follows:
S t = U D h
τ p = ρ p d p 2 18 μ
where τ p denotes the relaxation time of algae cells (s), d p represents the algae cell diameter (m), and ρ p is the density of algae cells (kg/m3). A single-cell spherical shaped Chlorella specie, with an algae cell diameter d p = 7 μm and density ρ = 864 (kg/m3) was used in this study [27]. The calculated Stokes number is less than 1, which means that chlorella cells may follow the fluid stream without affecting the fluid flow in the mixing process [28]. The motion of the algae particles in the reactor can be traced by Newton’s second law of motion. The fluid exerts drag force on the particles, and this drag force can be calculated by using Stokes’ law, provided that the cell Reynolds number is less than 1(Re << 1). The governing equations for the algae cell tracing are as follows:
d ( u p ) d t = F d ( U u p )
d x p d t = u p
R e p = ( U u p ) d p ρ p μ
F d = 18 μ d p 2 ρ p
where u p denotes the chlorella cell velocity (m/s), x p is the position vector of algae cells (m), and F d represents the drag force (N). The density of the released particles is normalized to the magnitude of the fluid velocity at the inlet. This means that more particles are released where the inlet velocity is highest, and fewer particles are released where the velocity field is low. A user-defined auxiliary dependent variable R with a set value of 1 was defined to evaluate the mixing and residence time of particles. This variable solves first-order differential equations by using the Euler method with defined initial values to calculate the mixing and residence time of algae particles. The following are the governing equations for residence time and mixing length:
R t ( t ) = t 1 t 2 R d t
M l ( s ) = s 1 s 2 R d s
where R t represents the residence time (s), M l is the mixing length (m), t 1 and t 2 show the time steps of algae particles at the inlet and outlet of the reactor, and s 1 and s 2 represent the direction of algae particle motion at the inlet and outlet, respectively.

3. Numerical Details

Numerical computations were performed using the commercial software COMSOL-Multiphysics (V 5.3a). The complete reactor was discretized into a physics-based free tetrahedral mesh. Mesh independence analysis was performed to choose a mesh that ensures a high accuracy of results at a low computational cost by considering three different levels of mesh refinement: fine mesh (523,359 domain elements and 352,730 boundary elements), normal mesh (134,183 domain elements and 91,130 boundary elements), and coarse mesh (60,175 domain elements and 3456 boundary elements). The average velocity on the entire reactor volume is computed for all three cases (Table 2). The variation in the CFD predictions is marginal. Consequently, the normal mesh with 134,183 domain elements and 91,130 boundary elements was adopted for all further simulations.
In COMSOL-Multiphysics (V 5.3a), the k-ω model with a time-dependent solver was used to simulate the flow. At the inlet, the mass flow rate was varied, and the atmospheric boundary condition (1.0 atm) was assigned at the outlet. No slip boundary condition was applied to the sidewalls and the bottom of the reactor. The slip boundary condition was adapted to the open surfaces of the reactor. Particle tracing for the fluid flow was chosen to investigate the algae cell mixing. A total of 0.2 million particles based on cell density were introduced at the inlet of the reactor. Flow field parameters obtained from the reactor analysis were used to analyze the flow mixing and residence time of algae particles. All simulations were run for 100 s with a step size of 1 s. All numerical calculations were carried out at an Intel Core i7-3370 3.90 GHz processor with a 16 GB RAM operating system. The solver takes approximately 13 and 24 h to achieve complete convergence of the solution for the flow field and 0.2 million algae particles, respectively.

4. Results and Discussion

In order to confirm the accuracy of the applied model, the results of this study were compared with the experimental results of [11]. The results of this study were in reasonable agreement with the experimental results, thereby verifying the present numerical methodology. A close agreement exists between the present numerical calculations of velocity with the experimental results at lower mass flow rates, where the maximum percentage error was limited to 4.6% and 5.4% at a mass flow rate of 1.6 kg/s and 2 kg/s. However, at a high mass flow rate, the predicted values of velocity deviate from the experimental values considerably, where the maximum percentage error was 18.59% and 18.89% at a flow rate of 2.4 and 2.8 kg/s, respectively (Figure 2).
The hydrodynamic performance and algae cell mixing features of a thin-layer cascade reactor have been evaluated by using computational fluid dynamics. The hydrodynamic performance based on the proposed numerical methodology was evaluated by computing the hydrodynamic properties, namely, the power consumption and velocity magnitude. In addition to the variation in mass flow rate, geometric parameters such as the channel depth, channel width, and slope angle were the main criteria for the calculation of these properties. Moreover, the algae cell mixing characteristics of the TLC reactor were also evaluated based on the residence time and mixing efficiency of the reactor with the variation in the above-mentioned geometric properties of the reactor.

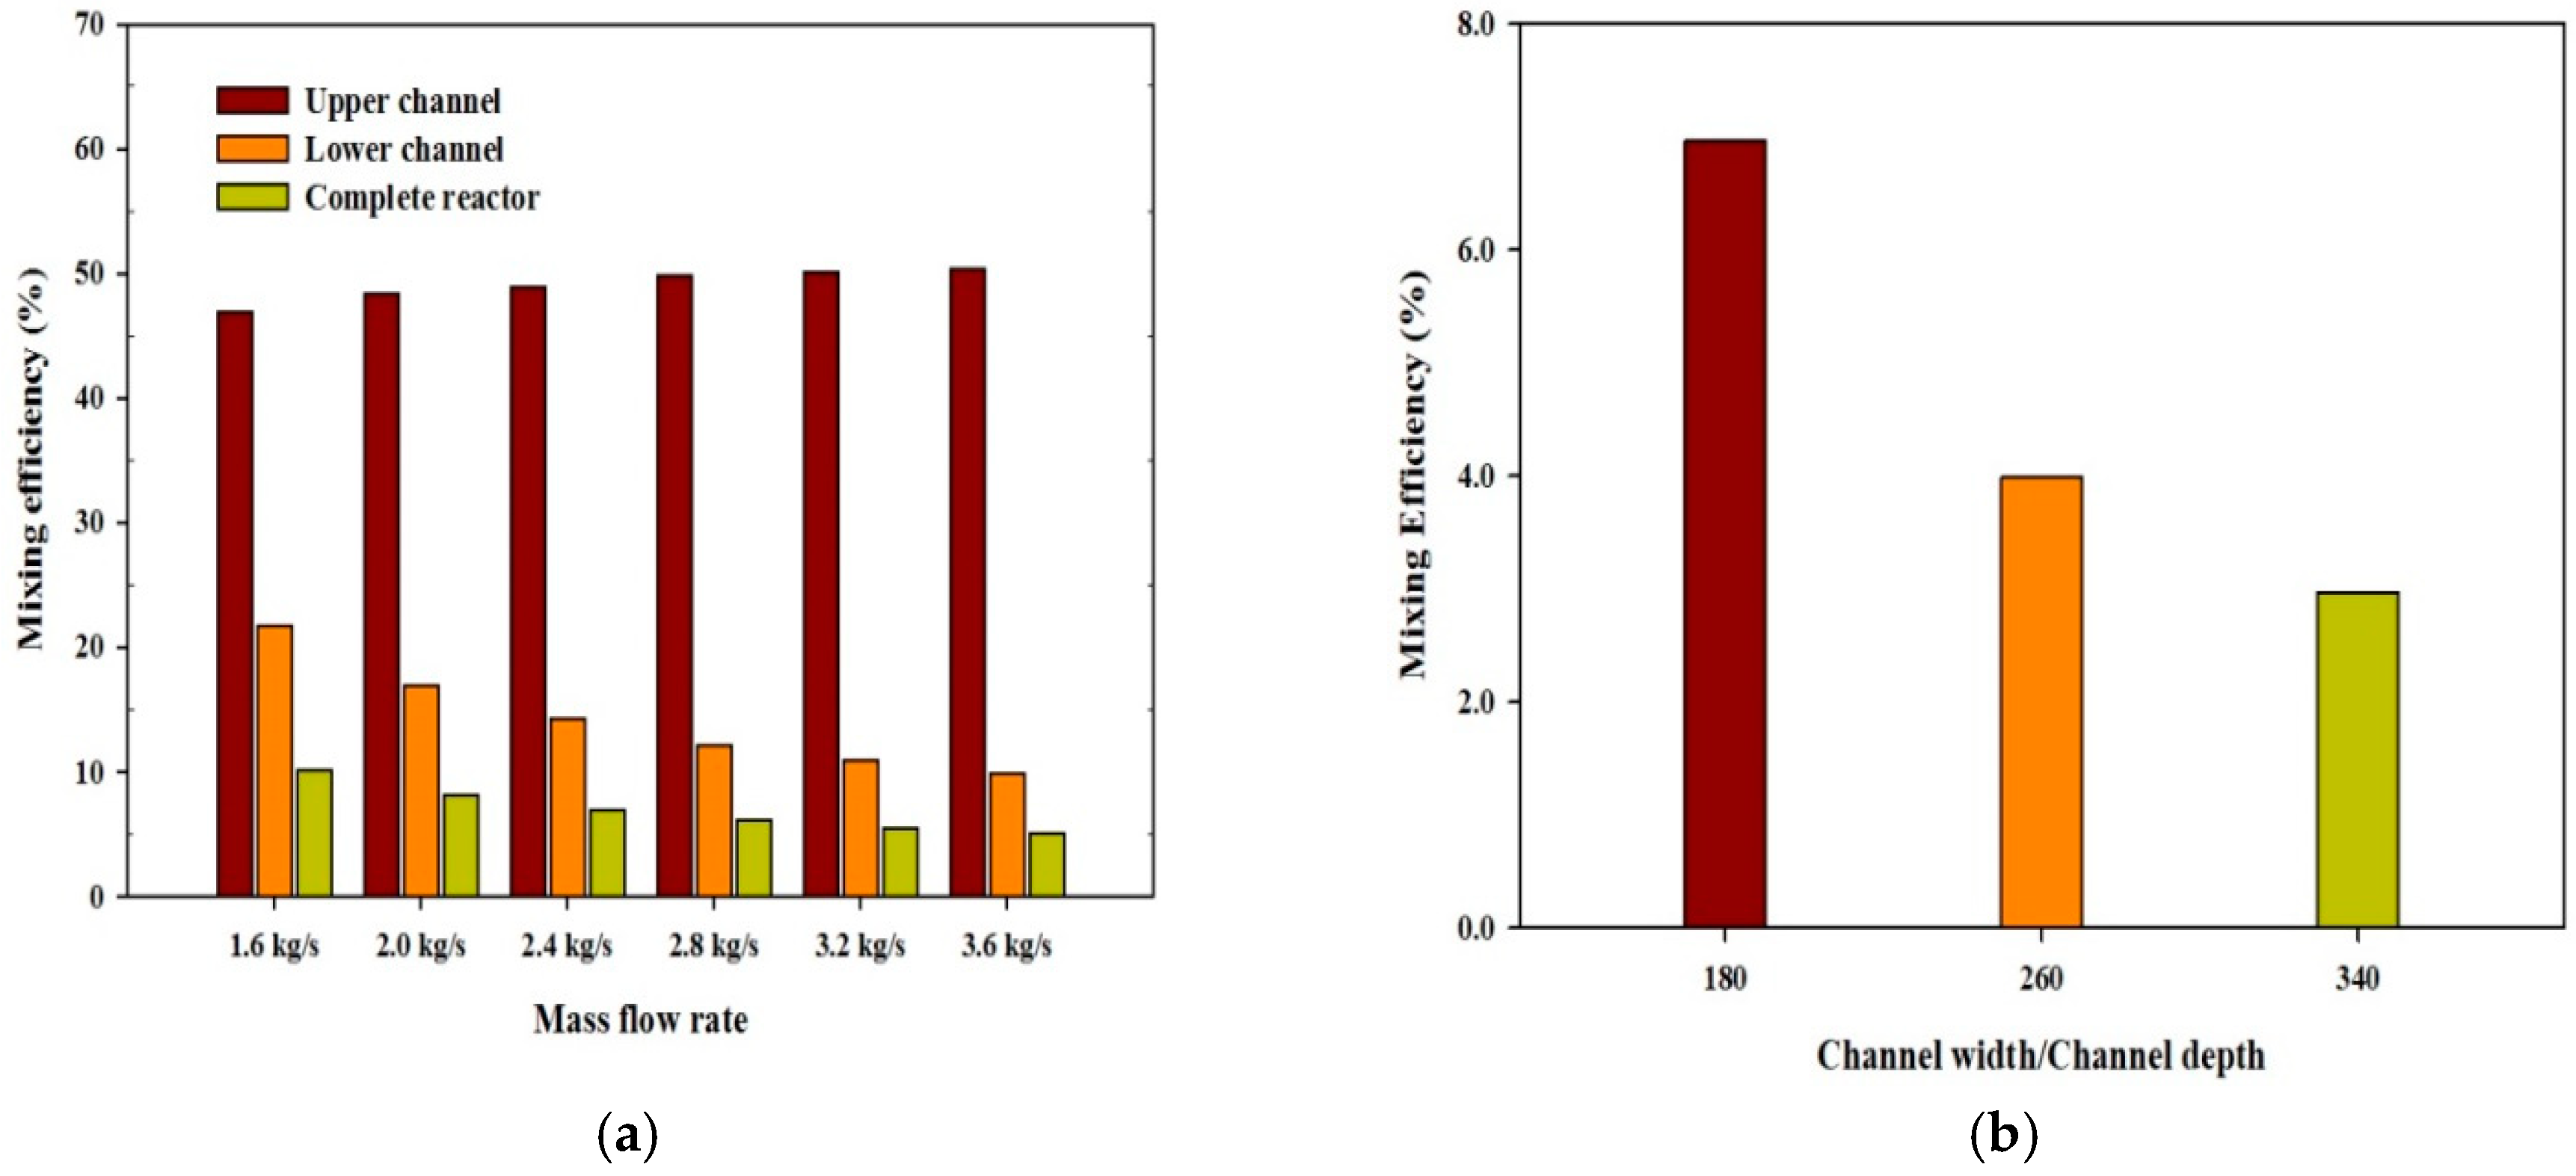
4.1. Mixing Performance of TLC Reactor

Mixing in outdoor cultures of microalgae is essential to prevent cells from settling and sticking to the bottom, to break down the diffusional gradients of essential nutrients, and to ensure uniform exposure to sunlight. The mixing length of the algae particles which account for the combined streamwise and transversal movement of the algal cell at any given instant can be calculated using Equation (21) [27]. The mixing length is the approximate distance covered by the algae particles while moving from the inlet to outlet of the reactor at any given instant. To account for the combined streamwise and transversal mixing of algae particles, the mixing efficiency in terms of algae cells received at the outlet boundary of the reactor after going through the mixing process at the last time step were calculated.
A high value of mass flow rate increases the degree of mixing, coupled with an increase in the number of algae cells reaching the outlet (Figure 3a). These findings are consistent with the results of Severin et al. [10]. The increase in mass flow rate promotes a larger number of particles to undergo the mixing process due to the beneficial effect of turbulence. This situation shows that, to some degree, the mixing can be managed simply by adjusting the fluid velocities in the reactor [7]. However, high mass flow rates consequently can require high power consumption. Moreover, the concentration of algal cells at the outlet of the upper channel is greater in comparison to the lower channel (Figure 3a). The most possible reason for the acquired results can be attributed to the geometric height to which the suspension is delivered onto the upper channel of the reactor, leading to increased cell concentrations and improved mixing [4].
A twofold decrease in mixing is observed with the increase in the AR from 180 to 340 (Figure 3b). An increase in channel width decreases the concentration of algae particles at the outlet of the reactor because of the increased reactor volume, thereby indicating that particles find more space to move and mix in the reactor. It can be stated that a variation in geometry cause variations in the hydrodynamic properties of the reactor, which affect the mixing phenomenon of the cells [29]. A TLC reactor with a small AR and faster flow rates are suitable for microalgae cultivation because of the significant increase in the cell mixing, provided that the mechanical structure of the algae cells is not damaged [28,30].

Residence Time

The residence time of algae cells has a vital importance in the design of the photobioreactor. The residence time or retention time of the algae cells is the total time traveled by the particles from the inlet to the outlet of the reactor. The effect of mass flow rate, water depth, and AR on residence time is plotted separately for each compartment of the reactor (Figure 4a–c). The algae particles need more time to move from the inlet to the outlet boundary of the reactor when lower mass flow rates are adopted (Figure 4a). However, faster flow rates reduced the residence time by increasing the flow velocity. The higher flow velocity in the lower channel resulted in a larger residence time of algae particles in the lower channel in comparison with the upper channel.
The residence time is strongly influenced by the geometrical aspects of TLC, as evidenced by the longer time spent by the algae cells in the reactor with the increased water depth and AR due to the increase in reactor volume (Figure 4b,c). The particle tracing methodology in this study does not include particle fluid interaction because the computed Stokes number of the algae particles was small. Therefore, the algae cells follow the fluid stream. The lack of this interaction resists a proportional increase in cell residence time with the number of particles introduced at the inlet [25,31]. The residence time of algae greatly affects the mixing process; a large residence time slows down the mixing process. Thus, a reactor with a small AR, water depth, and faster flow rates is a suitable option for microalgae cultivation because of the shorter residence time involved and the good distribution of nutrients, sunlight, and CO2 [32].

4.2. Hydrodynamic Performance of TLC Reactor

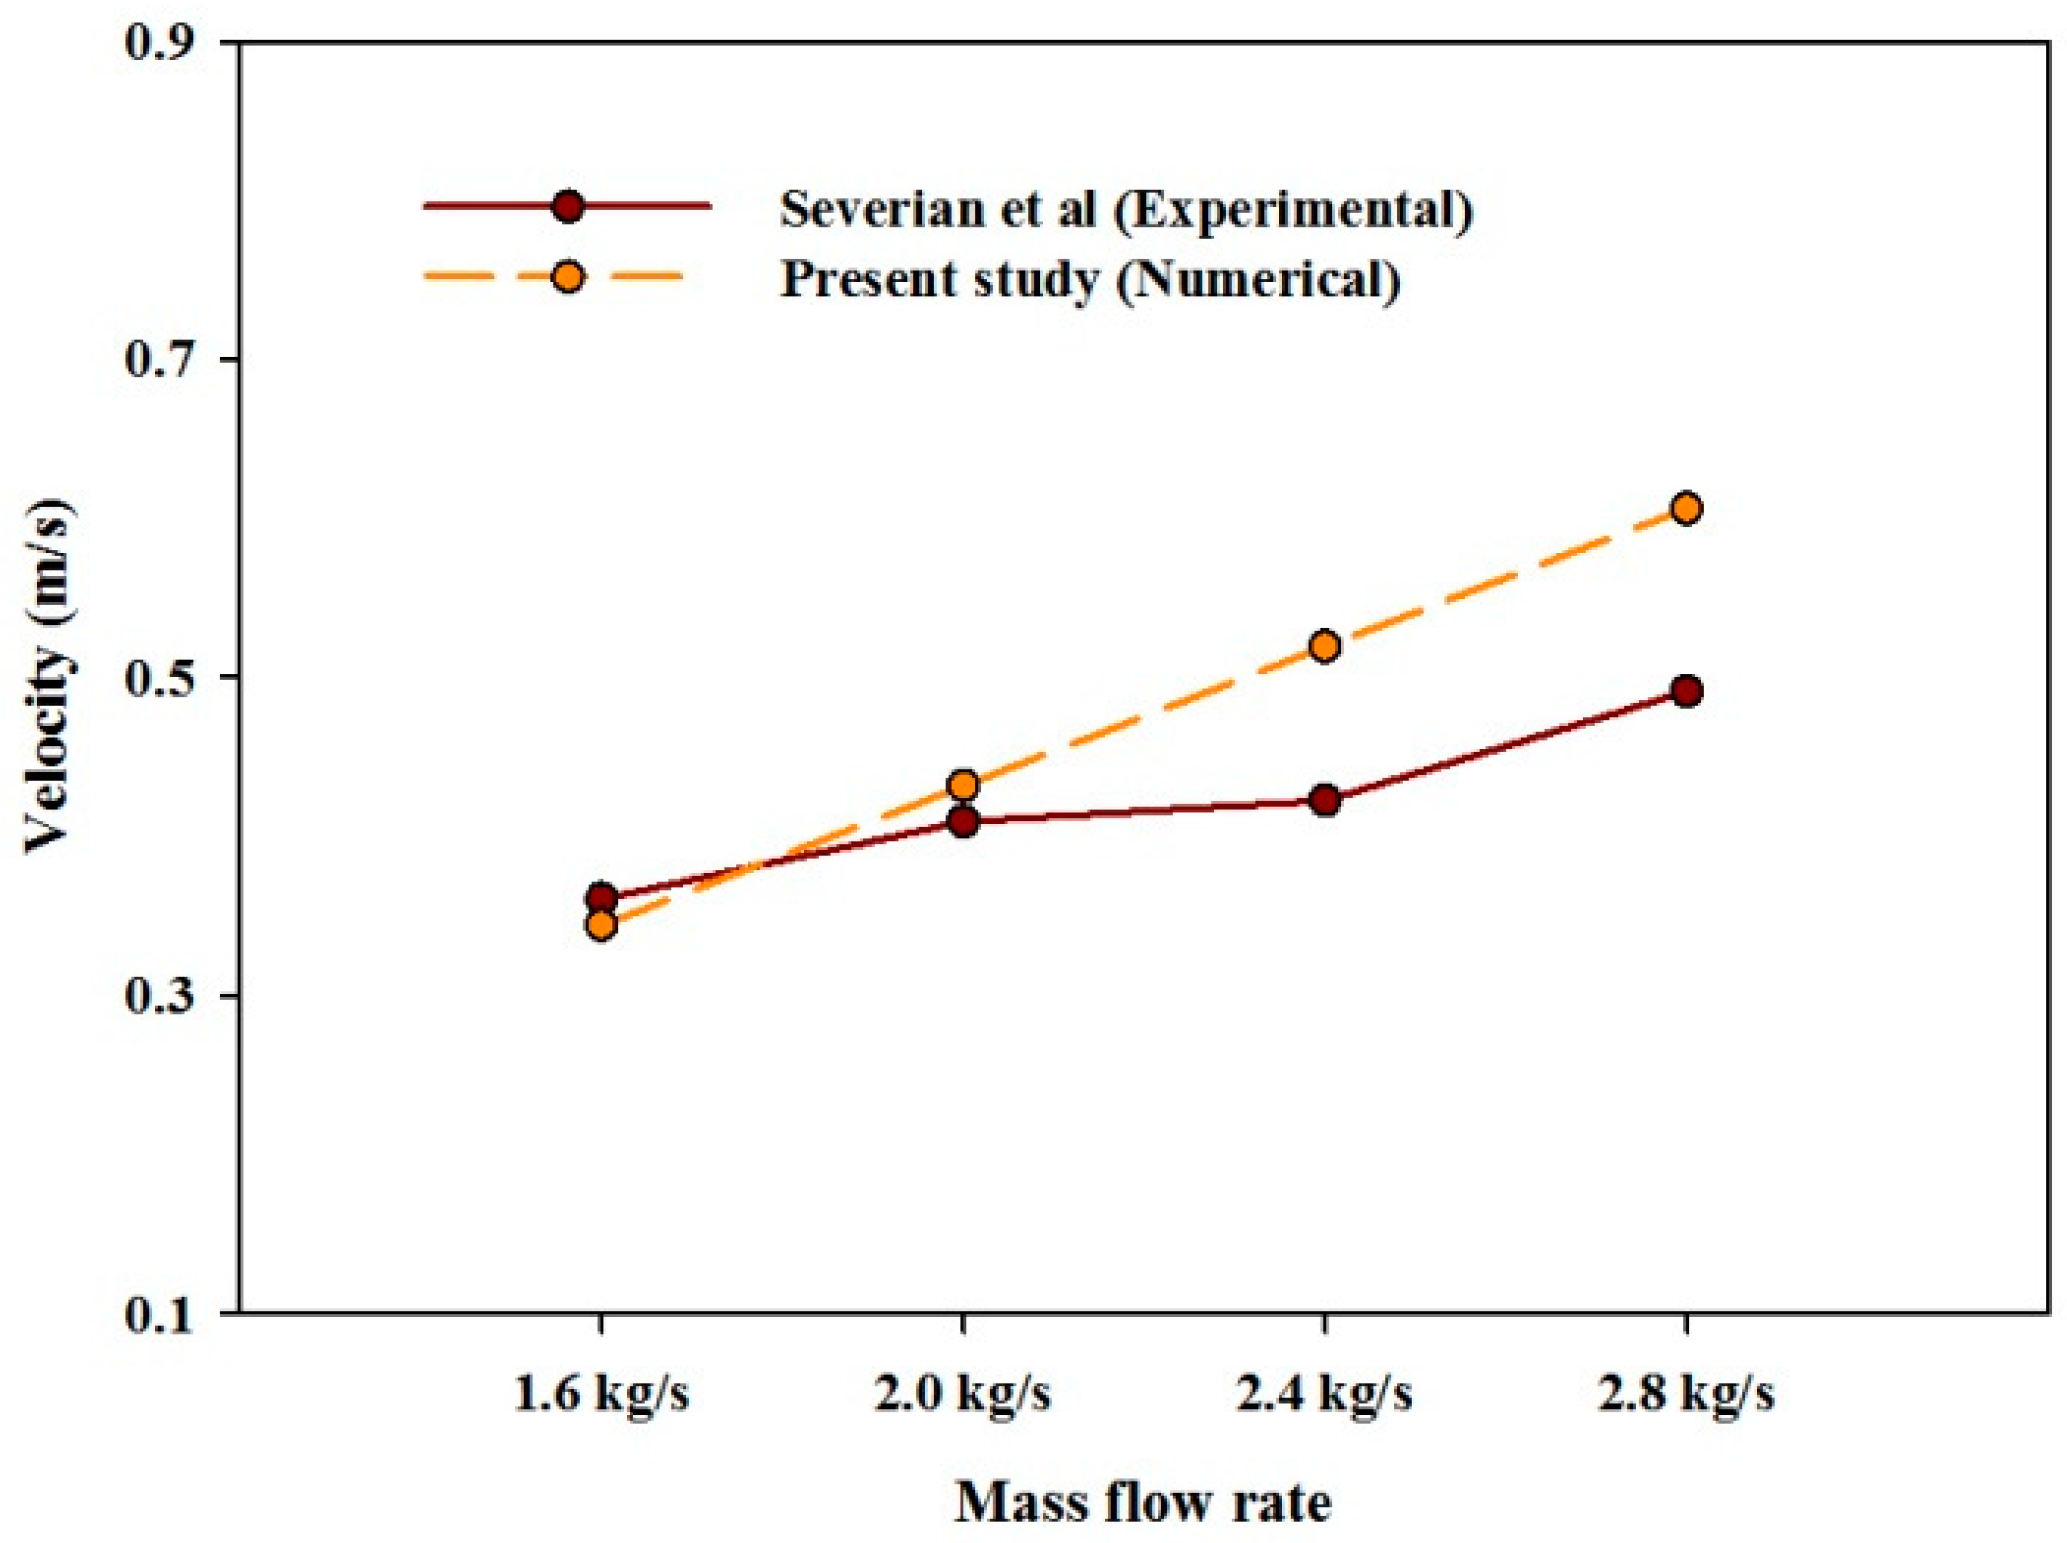
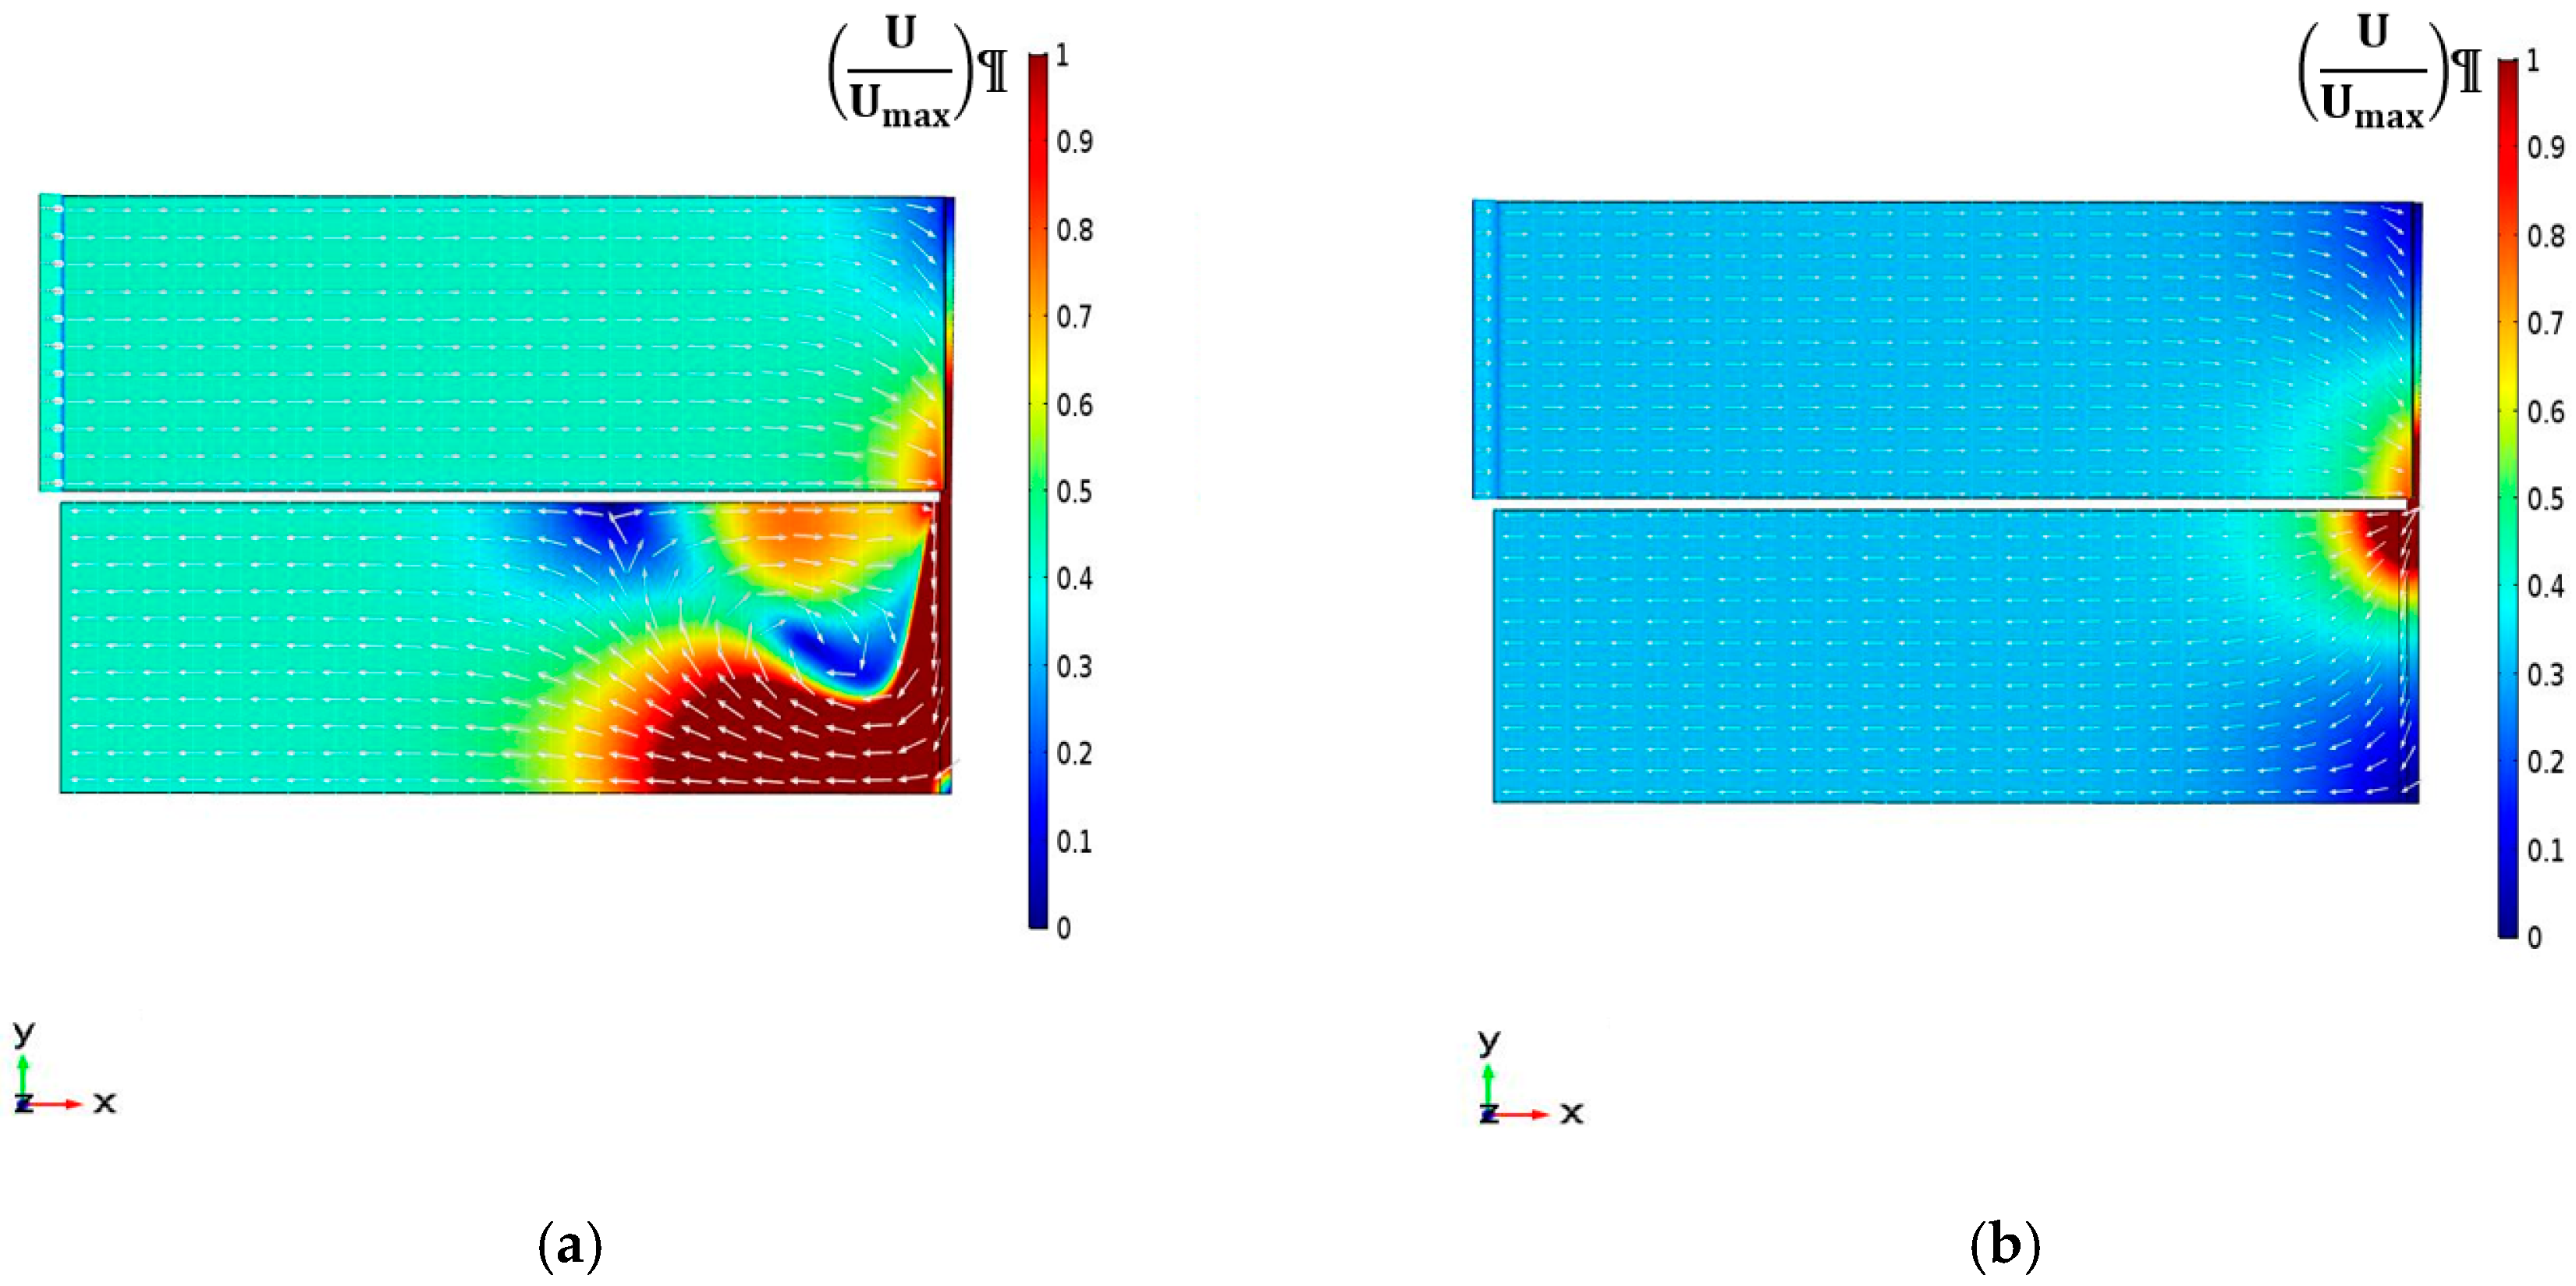
4.2.1. Velocity Magnitude

Microalgae cultivation is velocity sensitive. Thus, an estimation of proper velocity is essential neither to provide the settlement of algae cells at the bottom of the reactor nor to be sheared. Liquid velocity is the measure of liquid flow and the extent of turbulence in the reactor. Some degree of turbulence is required in the reactor to ensure that all cells are frequently exposed to light for effective photosynthesis [33].
With the increase in mass flow rate and slope angle, an increase in velocity is observed (Figure 5a,d). The increase in liquid volume with the increase in water depth and AR causes a substantial reduction in the flow velocity (Figure 5b,c). The increase in velocity is more significant at a higher mass flow rate and particularly at a high slope angle where a sharp increase in velocity is observed. This trend is confirmed in Figure 5d. Theses finding indicate that with increased flow velocity (either due to slope or mass flow rate), better mixing can be achieved [11,34]. Therefore, to achieve high velocities for the good mixing of algae cells, TLC reactors with a small AR and water depth and inclined at a higher slope angle are a good choice.
Water depths, channel width, and the velocity of the suspension (i.e., Reynolds number) are the very important parameters for analyzing the fluid pattern in the thin-layer cascade reactor. Velocity contours at constant mass flow rate with the variation in water depth and channel width are presented in Figure 6 and Figure 7. For better visualization, normalized velocity (U/Umax) has been plotted. U (m/s) represents the fluid velocity, and Umax (m/s) is the maximum fluid velocity in the reactor.
With the increase in water depth and AR, a gradual decrement in velocity magnitude is evident. The increase in liquid volume with the increase in channel width and water depth causes a substantial reduction in the velocity magnitude. The TLC reactor with the smallest water depth and channel width represents the highest velocity magnitude for all the cases considered in this study.
The cascade is represented by a uniform velocity profile [8]. However, at the inlet section of the lower channel, an abrupt increase in velocity is observed. This increase in velocity magnitude is attributed to the geometrical shape of the flow reversal module, which increases the velocity of fluid. The fast-moving fluid failed to follow the geometrical shapes; a recirculation zone is created on the lower channel. The velocity magnitude reaches its maximum value in this zone, as represented by the arrow plots.
From the algae cell productivity point of view, the TLC reactor is the better choice in comparison to the conventional raceway ponds because of the smooth streamlined pattern, thus eliminating the need for flow deflectors to make the flow streamline. Moreover, the higher velocity magnitude or turbulent flow in a thin-layer cascade reactor promotes the vigorous mixing of the cells in comparison to raceway ponds, where low liquid velocities results in high dead zone volume, thereby directly affecting the algae cell productivity.

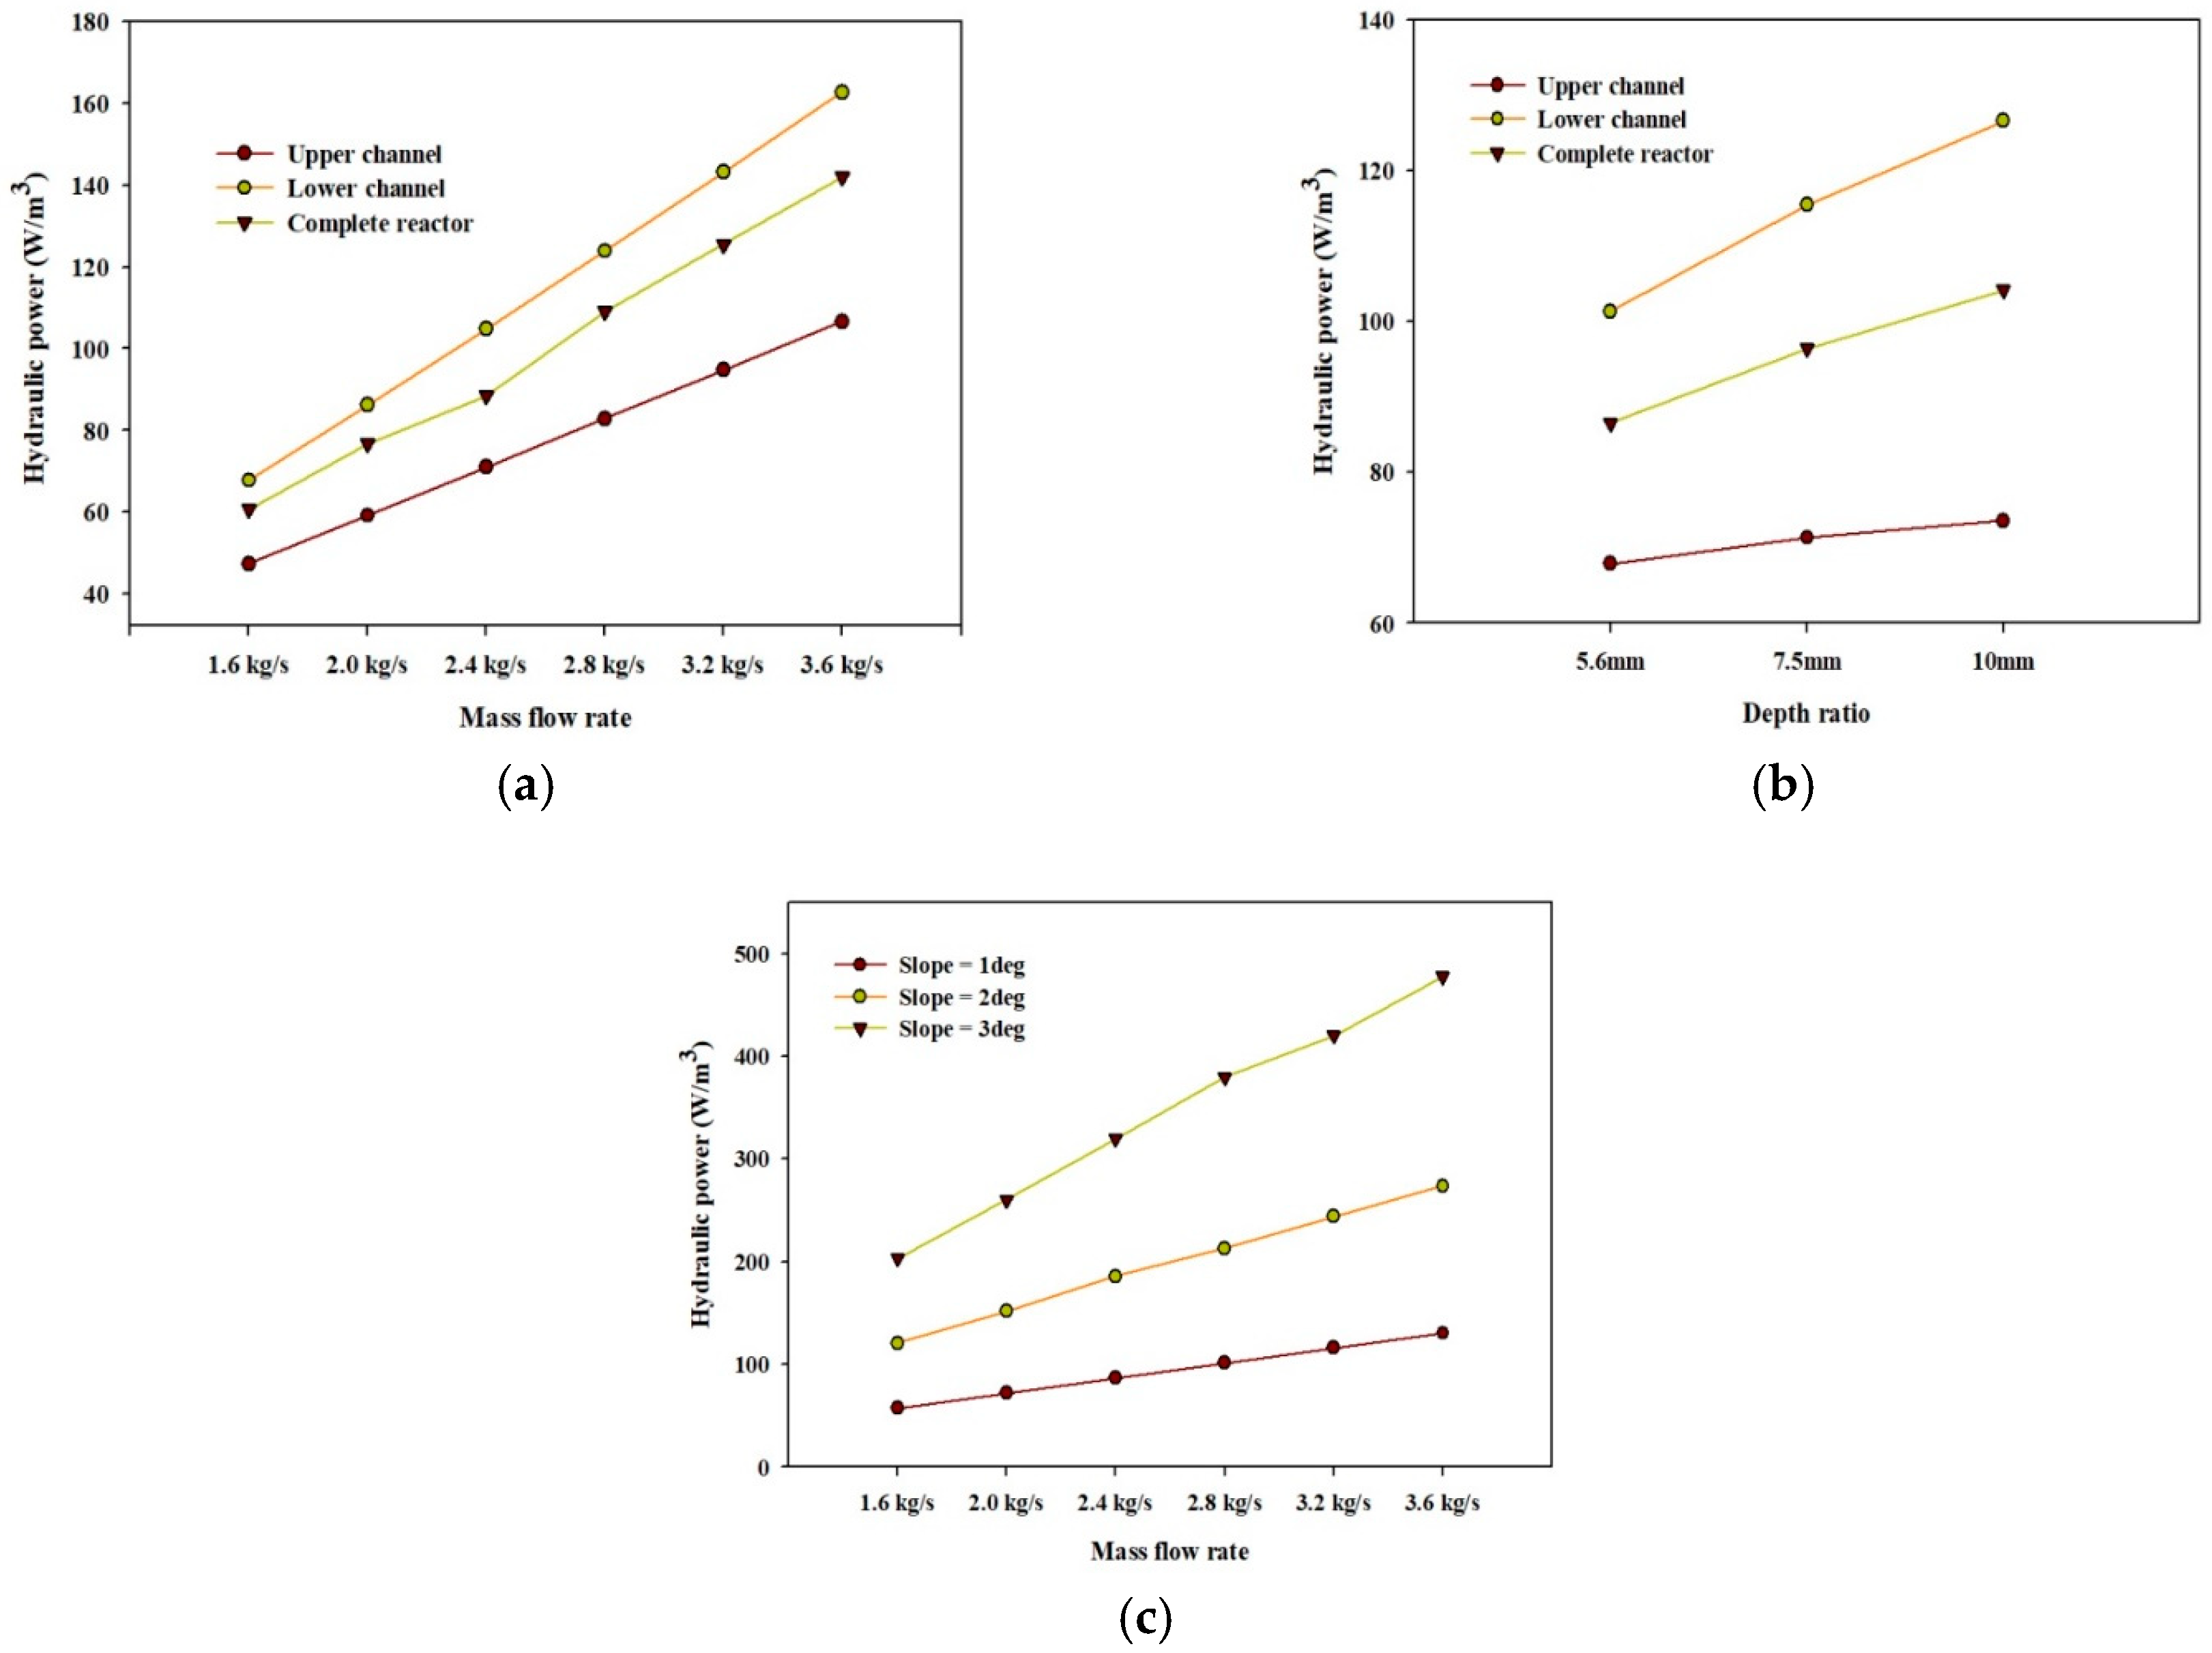
4.2.2. Power Consumption

The hydraulic mixing power consumed by the TLC reactors is the product of flow velocity, surface inclination, and water depth. With the increase in mass flow rate and slope angle, flow velocity increases such that the reactor consumes more power to move the liquid along the reactor (Figure 8a,c). The hydraulic power consumption increases by more than twofold for the slope angle of 3° in comparison with the reactor inclined at 1°. Higher velocities require considerably more energy. High cell densities can be achieved by faster flow rates, but the energy cost to achieve this is very high [14].
Moreover, an increase in water depth resulted in the slow movement of fluid, which indicates that the reactor with increased water depth requires more power to move the liquid along the reactor (Figure 8b). In other words, greater reactor dimensions require greater power. The hydraulic power required by each compartment of the reactor is presented in Figure 8a. The power required by the lower channel of the reactor is greater than that required by the upper channel because of the flow reversal module. The flow reversal module directs the fluid at the lower channel by increasing the flow velocity in the lower channel. The high velocity results in increased power consumption in the lower channel.

5. Conclusions

A three-dimensional CFD model was developed to evaluate the algae cell mixing features and hydrodynamic performance of a TLC reactor. Numerical simulations were performed considering the different geometrical variations (water depth, slope angle, and channel width) of the reactor. A comparison in terms of the average velocity was made with the reference experimental data of Apel et al. [11]. The reactor dimensions significantly affected the algae cell mixing and hydrodynamic performance of the TLC reactor. The subsequent conclusion can be derived from the numerical calculation of present study.
  • The mixing process is more effective when the reactor has narrow geometry and operates at high mass flow rates.
  • The residence time of algae cells increases with the increase in water depth and aspect ratio.
  • The increases in liquid volume with the increase in channel width and water depth causes a substantial reduction in the velocity magnitude.
  • The hydraulic power consumption required to move the liquid along the channel increases with the increase in mass flow rate, slope angle, and water depth.
In order to achieve high mass densities of microalgae in the TLC reactor, an optimal inclination of the surface must be adopted to reduce the power consumption without decreasing the productivity of algae due to a low liquid velocity, causing lower turbulence. Therefore, a detailed design optimization study of the TLC reactor is recommended to overcome this compromised situation.

Author Contributions

All the authors were involved in the conception and design of the study. All the simulations, analysis, and interpretation of data have been done by S.A. and supported by H.A. and C.W.P. The manuscript was written by S.A. and H.A. The work was supervised and supported for improvement with critical questions by C.W.P. The paper review and edit was done by C.W.P. All authors have read and agreed to the published version of the manuscript.

Acknowledgments

This study was supported by a grant from the National Research Foundation of Korea grant funded by the Korea government (No. 2017R1A2B2005515).

Conflicts of Interest

The authors declare no conflict of interest.

Nomenclature

A cross sectional area, m2 I inclination of surface (-)
D h hydraulic diameter, m AR aspect ratio, (-)
R e Reynolds number, (-) Q volumetric flow rate, m3/s
u velocity vector, m/s St Stokes number (-)
I identity matrix E D hydraulic power, W/m2
U time-averaged velocity, m/sGreek symbols
L length, m ρ water density, kg/m3
m ˙ mass flow rate, kg/s μ water viscosity, Pa. s
W channel width, m μ t turbulent viscosity, Pa·s
M l mixing length, m ρ p algae cell density, kg/m3
R t residence time, s ω turbulent dissipation rate, 1/s
F d drag force, N u p chlorella cell velocity, m/s
d p algae cell diameter, m τ p relaxation time, s
d channel depth, m σ ω Prandtl number for dissipation rate
k turbulent kinetic energy, m2/s2 σ k Prandtl number for kinetic energy

References

  1. Mata, T.M.; Martins, A.A.; Caetano, N.S. Microalgae for Biodiesel Production and Other Applications: A Review. Renew. Sustain. Energy Rev. 2010, 14, 217–232. [Google Scholar] [CrossRef] [Green Version]
  2. Khan, S.A.; Hussain, M.Z.; Prasad, S.; Banerjee, U.C. Prospects of Biodiesel Production from Microalgae in India. Renew. Sustain. Energy Rev. 2009, 13, 2361–2372. [Google Scholar] [CrossRef]
  3. Suh, I.S.; Lee, C.G. Photobioreactor Engineering: Design and Performance. Biotechnol. Bioprocess Eng. 2003, 8, 313–321. [Google Scholar] [CrossRef]
  4. Pulz, O. Photobioreactors: Production Systems for Phototrophic Microorganisms. Appl. Microbiol. Biotechnol. 2001, 57, 287–293. [Google Scholar] [CrossRef] [PubMed]
  5. Fon Sing, S.; Isdepsky, A.; Borowitzka, M.A.; Moheimani, N.R. Production of Biofuels from Microalgae. Mitig. Adapt. Strateg. Glob. Chang. 2013, 18, 47–72. [Google Scholar] [CrossRef]
  6. Šetlík, I.; Šust, V.; Málek, I. Dual Purpose Open Circulation Units for Large Scale Culture of Algae in Temperate Zones. I. Basic Design Considerations and Scheme of a Pilot Plant. Algol. Stud. Hydrobiol. Suppl. Vol. 1970, 1, 111–164. [Google Scholar]
  7. Doucha, J.; Lívanský, K. Novel Outdoor Thin-Iayer High Density Microalgal Culture System: Productivity and Operational Parameters. Arch. Hydrobiol. Suppl. Algol. Stud. 1995, 76, 129–147. [Google Scholar]
  8. Masojídek, J.; Kopecký, J.; Giannelli, L.; Torzillo, G. Productivity Correlated to Photobiochemical Performance of Chlorella Mass Cultures Grown Outdoors in Thin-Layer Cascades. J. Ind. Microbiol. Biotechnol. 2011, 38, 307–317. [Google Scholar] [CrossRef]
  9. Grobbelaar, J.U. Factors Governing Algal Growth in Photobioreactors: The “Open” versus “Closed” Debate. J. Appl. Phycol. 2009, 21, 489–492. [Google Scholar] [CrossRef]
  10. Severin, T.S.; Apel, A.C.; Brück, T.; Weuster-Botz, D. Investigation of Vertical Mixing in Thin-Layer Cascade Reactors Using Computational Fluid Dynamics. Chem. Eng. Res. Des. 2018, 132, 436–444. [Google Scholar] [CrossRef]
  11. Apel, A.C.; Pfaffinger, C.E.; Basedahl, N.; Mittwollen, N.; Göbel, J.; Sauter, J.; Brück, T.; Weuster-Botz, D. Open Thin-Layer Cascade Reactors for Saline Microalgae Production Evaluated in a Physically Simulated Mediterranean Summer Climate. Algal Res. 2017, 25, 381–390. [Google Scholar] [CrossRef]
  12. Jerez, C.G.; Navarro, E.; Malpartida, I.; Rico, R.M.; Masojídek, J.; Abdala, R.; Figueroa, F.L. Hydrodynamics and Photosynthesis Performance of Chlorella Fusca (Chlorophyta) Grown in a Thin-Layer Cascade (TLC) System. Aquat. Biol. 2014, 22, 111–122. [Google Scholar] [CrossRef] [Green Version]
  13. De Marchin, T.; Erpicum, M.; Franck, F. Photosynthesis of Scenedesmus Obliquus in Outdoor Open Thin-Layer Cascade System in High and Low CO2 in Belgium. J. Biotechnol. 2015, 215, 2–12. [Google Scholar] [CrossRef] [PubMed]
  14. Doucha, J.; Lívanský, K. Productivity, CO2/O2 exchange and Hydraulics in Outdoor Open High Density Microalgal (Chlorella Sp.) Photobioreactors Operated in a Middle and Southern European Climate. J. Appl. Phycol. 2006, 18, 811–826. [Google Scholar] [CrossRef]
  15. Kristiansen, T.; Pedersen, I.L. Sociolingvistik. Nydanske Sprogstudier (NyS) 2006, 2, 217–267. [Google Scholar] [CrossRef]
  16. Doucha, J.; Lívanský, K. Outdoor Open Thin-Layer Microalgal Photobioreactor: Potential Productivity. J. Appl. Phycol. 2009, 21, 111–117. [Google Scholar] [CrossRef]
  17. Silva Benavides, A.M.; Ranglová, K.; Malapascua, J.R.; Masojídek, J.; Torzillo, G. Diurnal Changes of Photosynthesis and Growth of Arthrospira Platensis Cultured in a Thin-Layer Cascade and an Open Pond. Algal Res. 2017, 28, 48–56. [Google Scholar] [CrossRef]
  18. Doucha, J.; Lívanský, K. High Density Outdoor Microalgal Culture. In Algal Biorefineries: Volume 1: Cultivation of Cells and Products; Bajpai, R., Prokop, A., Zappi, M., Eds.; Springer: Dordrecht, The Netherlands, 2014; pp. 147–173. [Google Scholar] [CrossRef]
  19. Masojídek, J.; Sergejevová, M.; Malapascua, J.R.; Kopecký, J. Thin-Layer Systems for Mass Cultivation of Microalgae: Flat Panels and Sloping Cascades. In Algal Biorefineries: Volume 2: Products and Refinery Design; Prokop, A., Bajpai, R.K., Zappi, M.E., Eds.; Springer International Publishing: Cham, Switzerland, 2015; pp. 237–261. [Google Scholar] [CrossRef]
  20. Republiky, C.; Examiner, P.; Beisner, W.H.; Michalos, P.C. United States Patent (19) 11 Patent Number: 11. U.S. Patent 1999. No. 19. [Google Scholar]
  21. Doucha, J. Additional CO2 Saturation of Thin-Layer Outdoor Microalgal Cultures: CO2 Mass Transfer and Absorption Efficiency. Arch. Hydrobiol. Suppl. 1997, 122, 145–154. [Google Scholar]
  22. Bitog, J.P.; Lee, I.-B.; Lee, C.-G.; Kim, K.-S.; Hwang, H.-S.; Hong, S.-W.; Seo, I.-H.; Kwon, K.-S.; Mostafa, E. Application of Computational Fluid Dynamics for Modeling and Designing Photobioreactors for Microalgae Production: A Review. Comput. Electron. Agric. 2011, 76, 131–147. [Google Scholar] [CrossRef]
  23. Savat, J. The Hydraulics of Sheet Flow on a Smooth Surface and the Effect of Simulated Rainfall. Earth Surf. Process. 1977, 2, 125–140. [Google Scholar] [CrossRef]
  24. Chow, V.T. Open-Channel Hydraulics. In Open-channel hydraulics; McGraw-Hill: New Yourk, NY, USA, 1959. [Google Scholar]
  25. Buhr, H.O.; Miller, S.B. A Dynamic Model of the High-Rate Algal-Bacterial Wastewater Treatment Pond. Water Res. 1983, 17, 29–37. [Google Scholar] [CrossRef]
  26. Weissman, J.C.; Goebel, R.P.; Benemann, J.R. Photobioreactor Design: Mixing, Carbon Utilization, and Oxygen Accumulation. Biotechnol. Bioeng. 1988, 31, 336–344. [Google Scholar] [CrossRef] [PubMed]
  27. Ali, H.; Cheema, T.A.; Yoon, H.S.; Do, Y.; Park, C.W. Numerical Prediction of Algae Cell Mixing Feature in Raceway Ponds Using Particle Tracing Methods. Biotechnol. Bioeng. 2015, 112, 297–307. [Google Scholar] [CrossRef]
  28. Brennen, C.E. Fundamentals of Multiphase Flow; Cambridge University Press: Cambridge, UK, 2013; Volume 9780521848. [Google Scholar] [CrossRef] [Green Version]
  29. Tropea, C.; Yarin, A.L. Springer Handbook of Experimental Fluid Mechanics; Springer Science & Business Media: Berlin, Germany, 2007; Volume 1. [Google Scholar]
  30. Thomas, W.H.; Gibson, C.H. Effects of Small-Scale Turbulence on Microalgae. J. Appl. Phycol. 1990, 2, 71–77. [Google Scholar] [CrossRef]
  31. Wilcox, D.C. Summary for Policymakers. Clim. Chang. 2013 Phys. Sci. Basis 1995, 289, 1–30. [Google Scholar] [CrossRef]
  32. Valigore, J.M.; Gostomski, P.A.; Wareham, D.G.; O’Sullivan, A.D. Effects of Hydraulic and Solids Retention Times on Productivity and Settleability of Microbial (Microalgal-Bacterial) Biomass Grown on Primary Treated Wastewater as a Biofuel Feedstock. Water Res. 2012, 46, 2957–2964. [Google Scholar] [CrossRef] [PubMed]
  33. Ugwu, C.U.; Aoyagi, H.; Uchiyama, H. Photobioreactors for Mass Cultivation of Algae. Bioresour. Technol. 2008, 99, 4021–4028. [Google Scholar] [CrossRef]
  34. Pruvost, J.; Pottier, L.; Legrand, J. Numerical Investigation of Hydrodynamic and Mixing Conditions in a Torus Photobioreactor. Chem. Eng. Sci. 2006, 61, 4476–4489. [Google Scholar] [CrossRef]
Figure 1. Computational model of thin-layer cascade (TLC) used in this study (a) xy-view and (b) xyz-view.
Applsci 10 00746 g001
Figure 2. Comparison of the present study with the experimental results of Apel et al. [11].
Applsci 10 00746 g002
Figure 3. (a) Effect of mass flow rate on mixing efficiency at a water depth of 5.6 mm and slope angle of 1°. (b) Effect of channel width/channel depth on mixing efficiency of the complete reactor at a mass flow rate of 2.4 kg/s, water depth of 5.6 mm, and slope angle of 1°.
Applsci 10 00746 g003
Figure 4. (a) Effect of mass flow rate on residence time at a water depth of 5.6 mm and slope angle of 1°. (b) Residence time for various water depths at a mass flow rate of 2.4 kg/s and slope angle of 1°. (c) Residence time for different channel width/channel depth ratios at a mass flow rate of 2.4 kg/s, water depth of 5.6 mm, and slope angle of 1°.
Applsci 10 00746 g004aApplsci 10 00746 g004b
Figure 5. Velocity magnitude (a) for different mass flow rates at a water depth of 5.6 mm and slope angle of 2°, (b) for various channel width/channel depth ratios at a mass flow rate of 2.4 kg/s and slope angle of 1°, (c) for various water depths at a mass flow rate of 2.4 kg/s and slope angle of 1°, and (d) for different mass flow rates at a water depth of 5.6 mm and slope angles of 1°, 2°, and 3°.
Applsci 10 00746 g005
Figure 6. Velocity vector plots at a constant mass flow rate of 2.4 kg/s, slope angle of 1°, and various water depths: (a) 5.6 mm, (b) 7.5 mm, and (c) 10 mm.
Applsci 10 00746 g006aApplsci 10 00746 g006b
Figure 7. Velocity vector plots at a constant mass flow rate of 2.4 kg/s, slope angle of 1°, and various channel width/channel depth ratios: (a) channel width/channel depth = 180, (b) channel width/channel depth = 260, and (c) channel width/channel depth = 340.
Applsci 10 00746 g007
Figure 8. Hydraulic power consumption (a) for different mass flow rates at a water depth of 5.6 mm and slope angle of 1°, (b) for various water depths at a mass flow rate of 2.4 kg/s and slope angle of 1°, and (c) for the complete reactor with the variation in mass flow rate and slope angle.
Applsci 10 00746 g008
Table 1. Summary of important parameters of the thin-layer cascade reactor used in this study.
ParametersValue
Slope angle1°; 2°; 3°
Depth ratio5.6 mm; 7.5 mm; 10 mm
Aspect ratio180; 260; 340
Mass flow rate1.6–3.6 kg/s
Table 2. Mesh independence test ( m ˙ 2.4 kg/s, d = 5.6 mm, slope = 1°) for velocity averaged on the entire reactor volume.
No of Mesh ElementsU (m/s)
(523,359)0.5165
(134,191)0.5128
(60,175)0.5110

