Article

Carbon Mass Balance in Arthrospira platensis Culture with Medium Recycle and High CO2 Supply

1
Faculty of Science and Engineering, Soka University, 1-236 Tangi-cho, Hachioji, Tokyo 192-8577, Japan
2
Graduate School of Agricultural and Life Sciences, The University of Tokyo 1-1-1, Yayoi, Bunkyo, Tokyo 113-8657, Japan
*
Author to whom correspondence should be addressed.
Appl. Sci. 2020, 10(1), 228; https://doi.org/10.3390/app10010228
Submission received: 29 November 2019 / Revised: 19 December 2019 / Accepted: 24 December 2019 / Published: 27 December 2019
(This article belongs to the Special Issue New Trends on Algal Biotechnology for a Circular Economy)

Abstract

:

Featured Application

Carbon capture and utilization (CCU); Pigment production; Nutraceuticals production.

Abstract

Medium recycling combined with CO2 recovery helps sustainable use of the alkaline medium in Arthrospira culture. However, high CO2 supply may cause inorganic carbon accumulation and pH reduction, which could result in low CO2 recovery and reduced algal growth. This study aimed to elucidate the effect of medium recycling and high CO2 supply through carbon mass balance analysis in Arthrospira culture. In all CO2 supply conditions, carbon supply was higher than Arthrospira carbon assimilation, which accounted for 30–58% of supply. However, CO2 recovery of nearly 100% and 63% for lower (0.20 and 0.39 gC L−1 d−1) and higher (0.59 gC L−1 d−1) CO2 supply rates were achieved, respectively, because of the high concentration of the alkaline agent. The excess carbon accumulated in the medium and ultimately escaped from the system in a form of dissolved inorganic carbon (DIC). Dissolved organic carbon (DOC) contributed to 16–24% of the total photosynthetically assimilated carbon, and the final concentration reached 260–367 mgC L−1, but there was no significant growth reduction caused by DIC and DOC accumulation. This study demonstrated the stability of the medium-recycling process even at high CO2 supply rates although a balanced supply is recommended for longer operations.

Graphical Abstract

1. Introduction

Alkaliphilic microalgae and cyanobacteria (inclusively referred to as algae here) have been of great interest in a commercial application. Their selective growth conditions (i.e., high pH and alkalinity) prevent overgrowth of other organisms even in outdoor open-pond cultivations and allows relatively easy quality control. Among alkaliphilic algae, Arthrospira (also known as Spirulina) is the most commercially produced genus because of its high nutritional value (protein up to 77%dwt, minerals, and vitamins) [1] and application for blue natural color pigment production [2]. The global production of Arthrospira has been estimated to be approximately 10,000 metric tons in a report in 2013 [2] and is still expanding. Its emerging bio-active compounds have also been well studied [3,4,5,6].
The challenge in mass-cultivation of alkaliphilic microalgae, however, is the large requirement of alkaline agents. For example, the conventional Zarrouk medium requires 16.8 kg of sodium bicarbonate (NaHCO3) for every cubic meter of the medium [7]. Thus, medium recycles after biomass harvest is a preferred operation [8,9]. In a used medium, photosynthetic utilization of bicarbonate (HCO3) and carbonate (CO32−) results in increased pH (OH production), but CO2 supply regenerates HCO3 and CO32− back from OH [10]. As such, medium recycling allows sustainable use of alkaline agent if combined with appropriate CO2 supply.
Due to the CO2 requirement, algae mass-cultivation is considered as a key technology for CO2 bio-capture from CO2 containing gas sources such as flue gas, steel mills, and biogas [11,12], meriting both mass-culture cost reduction and environmental impact. With the recent demands for a reduction in CO2 emission to prevent global climate change, algae are considered as one of the key organisms for CO2 capture and utilization (CCU) processes [13,14]. In these processes, captured CO2 is utilized for algal photosynthesis to produce bioproducts such as biofuel, bioplastics, and other materials [13]. Although the carbon footprint differs depending on the use of algal biomass [14], carbon utilization for microalgal biodiesel production is one of the best options compared to chemical production. Even as protein sources, algal protein production has approximately 20 times lower carbon footprint compared to beef [15]. To capture CO2 in the gas, chemical/physical absorption, membrane separation, and chemical looping techniques have been attempted [16]. The alkaline medium of Arthrospira is suitable for CO2 recovery through chemical absorption [17]. The biggest advantage is the high alkalinity that could trap CO2. For example, dissolved inorganic carbon (DIC) optimum concentration is in the range of 0.01–0.1 mol L−1 in freshwater species like Chlorella [18,19,20], while it is 0.1–0.4 mol L−1 for Arthrospira platensis [17]. With this high alkalinity, the alkaliphilic algal medium can absorb much more CO2 into the same amount of liquid without pH change due to the buffer function of DIC.
In the practical CO2 recovery process, CO2 supply and/or algal productivity may fluctuate depending on the seasons or operational variations. In such cases, CO2 carbon supply may exceed the photosynthetic carbon demand, which may interfere with CO2 recovery rate and algal growth owing to DIC accumulation and pH reduction. Although the alkaline media of Arthrospira has a high buffer capacity and carbon absorptivity, continued high CO2 supply may have effects. Feasibility needs to be tested through carbon absorption modeling and carbon mass balance analysis. In previous studies, optimization of culture condition [21], modeling based on separate experiments of CO2 recovery and biomass production [22], and economic and energy analysis based on calculation [23] have been reported, little information has been obtained regarding the combined process of Arthrospira medium-recycled culture with CO2 recovery. While a very recent paper described CO2 recovery with Arthrospira [24], information on carbon mass balance in such conditions is scarce, and the effects of high CO2 supply and medium recycle have not been clearly revealed. The knowledge of the destiny of CO2 in media-recycling Arthrospira culture shall support environmentally and economically improved systems. Therefore, this study aimed to elucidate the carbon mass flux in the Arthrospira platensis culture coupled with medium recycling and high CO2 supply.

2. Materials and Methods

2.1. Algal Strain, Growth Medium, and Inoculum Preparation

Arthrospira platensis NIES-39 was used in this experiment. The algal strain was cultured with modified SOT medium [25] containing (mg L−1): NaHCO3, 22,680; K2HPO4, 500; NaNO3, 2,500; Na2SO4, 815; NaCl, 1,000; MgSO4∙7H2O, 200; CaCl2, 30; FeSO4∙7H2O, 10; Na2EDTA, 72; H3BO3, 2.86; MnSO4∙7H2O, 2.5; ZnSO4∙7H2O, 0.222; CuSO4∙5H2O, 0.079; Na2MoO4∙2H2O, 0.021. The DIC concentration in the modified medium was 0.27 mol L−1. The medium pH was adjusted to 10.5 by addition of 0.215 mol L−1 NaOH.
For the preparation of inoculum, A. platensis was grown in an Erlenmeyer flask filled with autoclaved SOT medium. To avoid precipitation during autoclave sterilization, the medium was separated into two batches; the first consists of NaHCO3 and K2HPO4 and the second of the others. Both batches were autoclaved at 121 °C for 20 min and mixed after cooling down to room temperature. The medium was stirred with a magnetic stirrer continuously at 350 rpm to avoid flocculation of cell colonies. Cool-white fluorescent light at 150 µmol photons m−2 s−1 was continuously irradiated. Algal cells at a late log-growth phase were used as inoculum for the experiment. In the medium-recycling during Arthrospira semi-continuous culture, the medium was filter-sterilized with a 0.22-μm membrane filter (Millipore, USA) instead of autoclaving.

2.2. Experimental Design and Culture Conditions

A semi-continuous experiment was conducted using a set of two reactors: an absorption column and a photobioreactor (PBR) (Figure 1). Three different CO2 supply rates, 0.20, 0.39, and 0.59 gC L-PBR−1 d−1 (Runs 1–3; Table 1), were tested based on a previous A. platensis CO2 fixation rate of 0.39 gC L−1 d−1 into account [17]. CO2 was injected by the headspace replacement instead of bubbling for controlling CO2 supply rates and prolongation of gas-liquid equilibration time.
The absorption column was a 1-L glass medium bottle with an active volume of 0.4 L and a gas-liquid interfacial area of approximately 73 cm2. For the start-up of the experiment, the autoclaved column was filled with a 0.4-L filter-sterilized medium. The headspace of the absorption column was replaced with different concentrations of CO2/N2 mixture for each CO2 supply rates (Table 1). Nitrogen gas of the volume same as that of headspace was injected to all the gasbags so that the headspace pressure remained at the atmospheric pressure (1.013 × 10⁵ Pa) even after all CO2 was absorbed. The absorption columns were placed in an incubator at 25 °C under dark, and the absorbent was stirred continuously with magnetic stirrers approximately at 200 rpm.
The PBR was a glass column reactor with an active volume of 1 L and an inner diameter of 106 mm. The PBR was semi-open with 0.2-μm air-filter (Aervent-50, Millipore, USA) attached on top to aseptically alleviate pressure build-up due to oxygen production. The PBR was incubated at 35 °C with 24-hour continuous light with the surface photosynthetic photon flux density (PPFD) of 300 μmol photons m−2 s−1.

2.3. Experimental Procedures

Twenty-four hours after CO2 injection into the absorption column and inoculation of PBR, algal harvest and medium recycle was operated (Figure 1). Firstly, 0.2 L of the algal suspension was withdrawn from the PBR, out of which, 0.05 L was discharged as analytical sample and 0.15 L was filtered through multiple screen meshes and a glass fiber filter with pore size of 0.7 μm (GF/F, Whatman, USA) to obtain filtrate for later transfer into the absorption column. Secondly, 0.2 L of the solution in the absorption column was transferred to the PBR aseptically. Finally, 0.15 L of the filtrate was mixed with 0.05-L new modified SOT medium, filtered through a sterile 0.22-μm membrane filter (Millipore Express® PLUS, Millipore, San Diego, CA, USA), and aseptically transferred to the absorption column to complete the liquid recycle.
The headspace of the absorption column was then replaced by blowing the respective concentrations of CO2 gas at 1 L min−1 for 3 min, and a refilled gas bag was attached. The same procedure was repeated every 24 hours. Samples were taken from the algal suspension and the CO2 absorbent both before and after the media recycle. The hydraulic retention times (HRT) of the absorption column, the PBR, and the entire system were 1.8, 4.75, and 18 days, respectively. The experiment was continued for 18 days.

2.4. Analytical Procedures

The algal suspension was used to measure algal dry weight (DW) and algal cell carbon and nitrogen content. The filtrate of algal suspension was used to measure pH, electrical conductivity, nutrients (nitrate, nitrite, and phosphorus), dissolved inorganic carbon (DIC), and dissolved organic carbon (DOC). The gas sample was used to measure headspace CO2, N2, and O2 concentration. The amount of CO2 absorbed into the medium was calculated from the difference of DIC concentration before and after the 24-h absorption period.
Algal DW was measured every day using glass fiber filters. Firstly, algal suspensions were filtered through pre-weighed glass fiber filters with a pore size of 0.7 μm (GF/F, Whatman, USA) and washed with distilled water three times. Then, filters were dried in an oven at 60 °C for over 24 hours and subsequently cooled to room temperature in a desiccator before weighing. Filters were weighed with an ultra-micro balance (XP6U Ultra Micro Comparator, Mettler Toledo, Columbus, OH, USA). Algal cell carbon and nitrogen contents were measured by measuring particulate organic carbon and nitrogen (POC and PON) of filters samples using an elemental analyzer (Flash 2000 CHN, Thermo, Waltham, MA, USA). To measure DIC and DOC, TOC analyzer (TOC-VCSH, Shimadzu, Kyoto, Japan) was used. Nutrients (nitrate, nitrite, and phosphate) were analyzed with an automated nutrient analyzer (SWAAN, BL-TEC, Tokyo, Japan).
Gas composition (CO2, N2, and O2) was measured using a gas chromatograph (Shimadzu, GC-2014, Japan) equipped with a packed column (Shincarbon ST, 6.0 m long, 3 mm I.D., Shimadzu, Japan) and a thermal conductivity detector. The temperature of the injector and the detector were maintained at 120 °C and 260 °C, respectively. The column temperature was gradually increased from 40 °C to 250 °C. Helium was used as the carrier gas with a flow rate of 40 mL min−1.

2.5. Calculations and Statistical Analysis

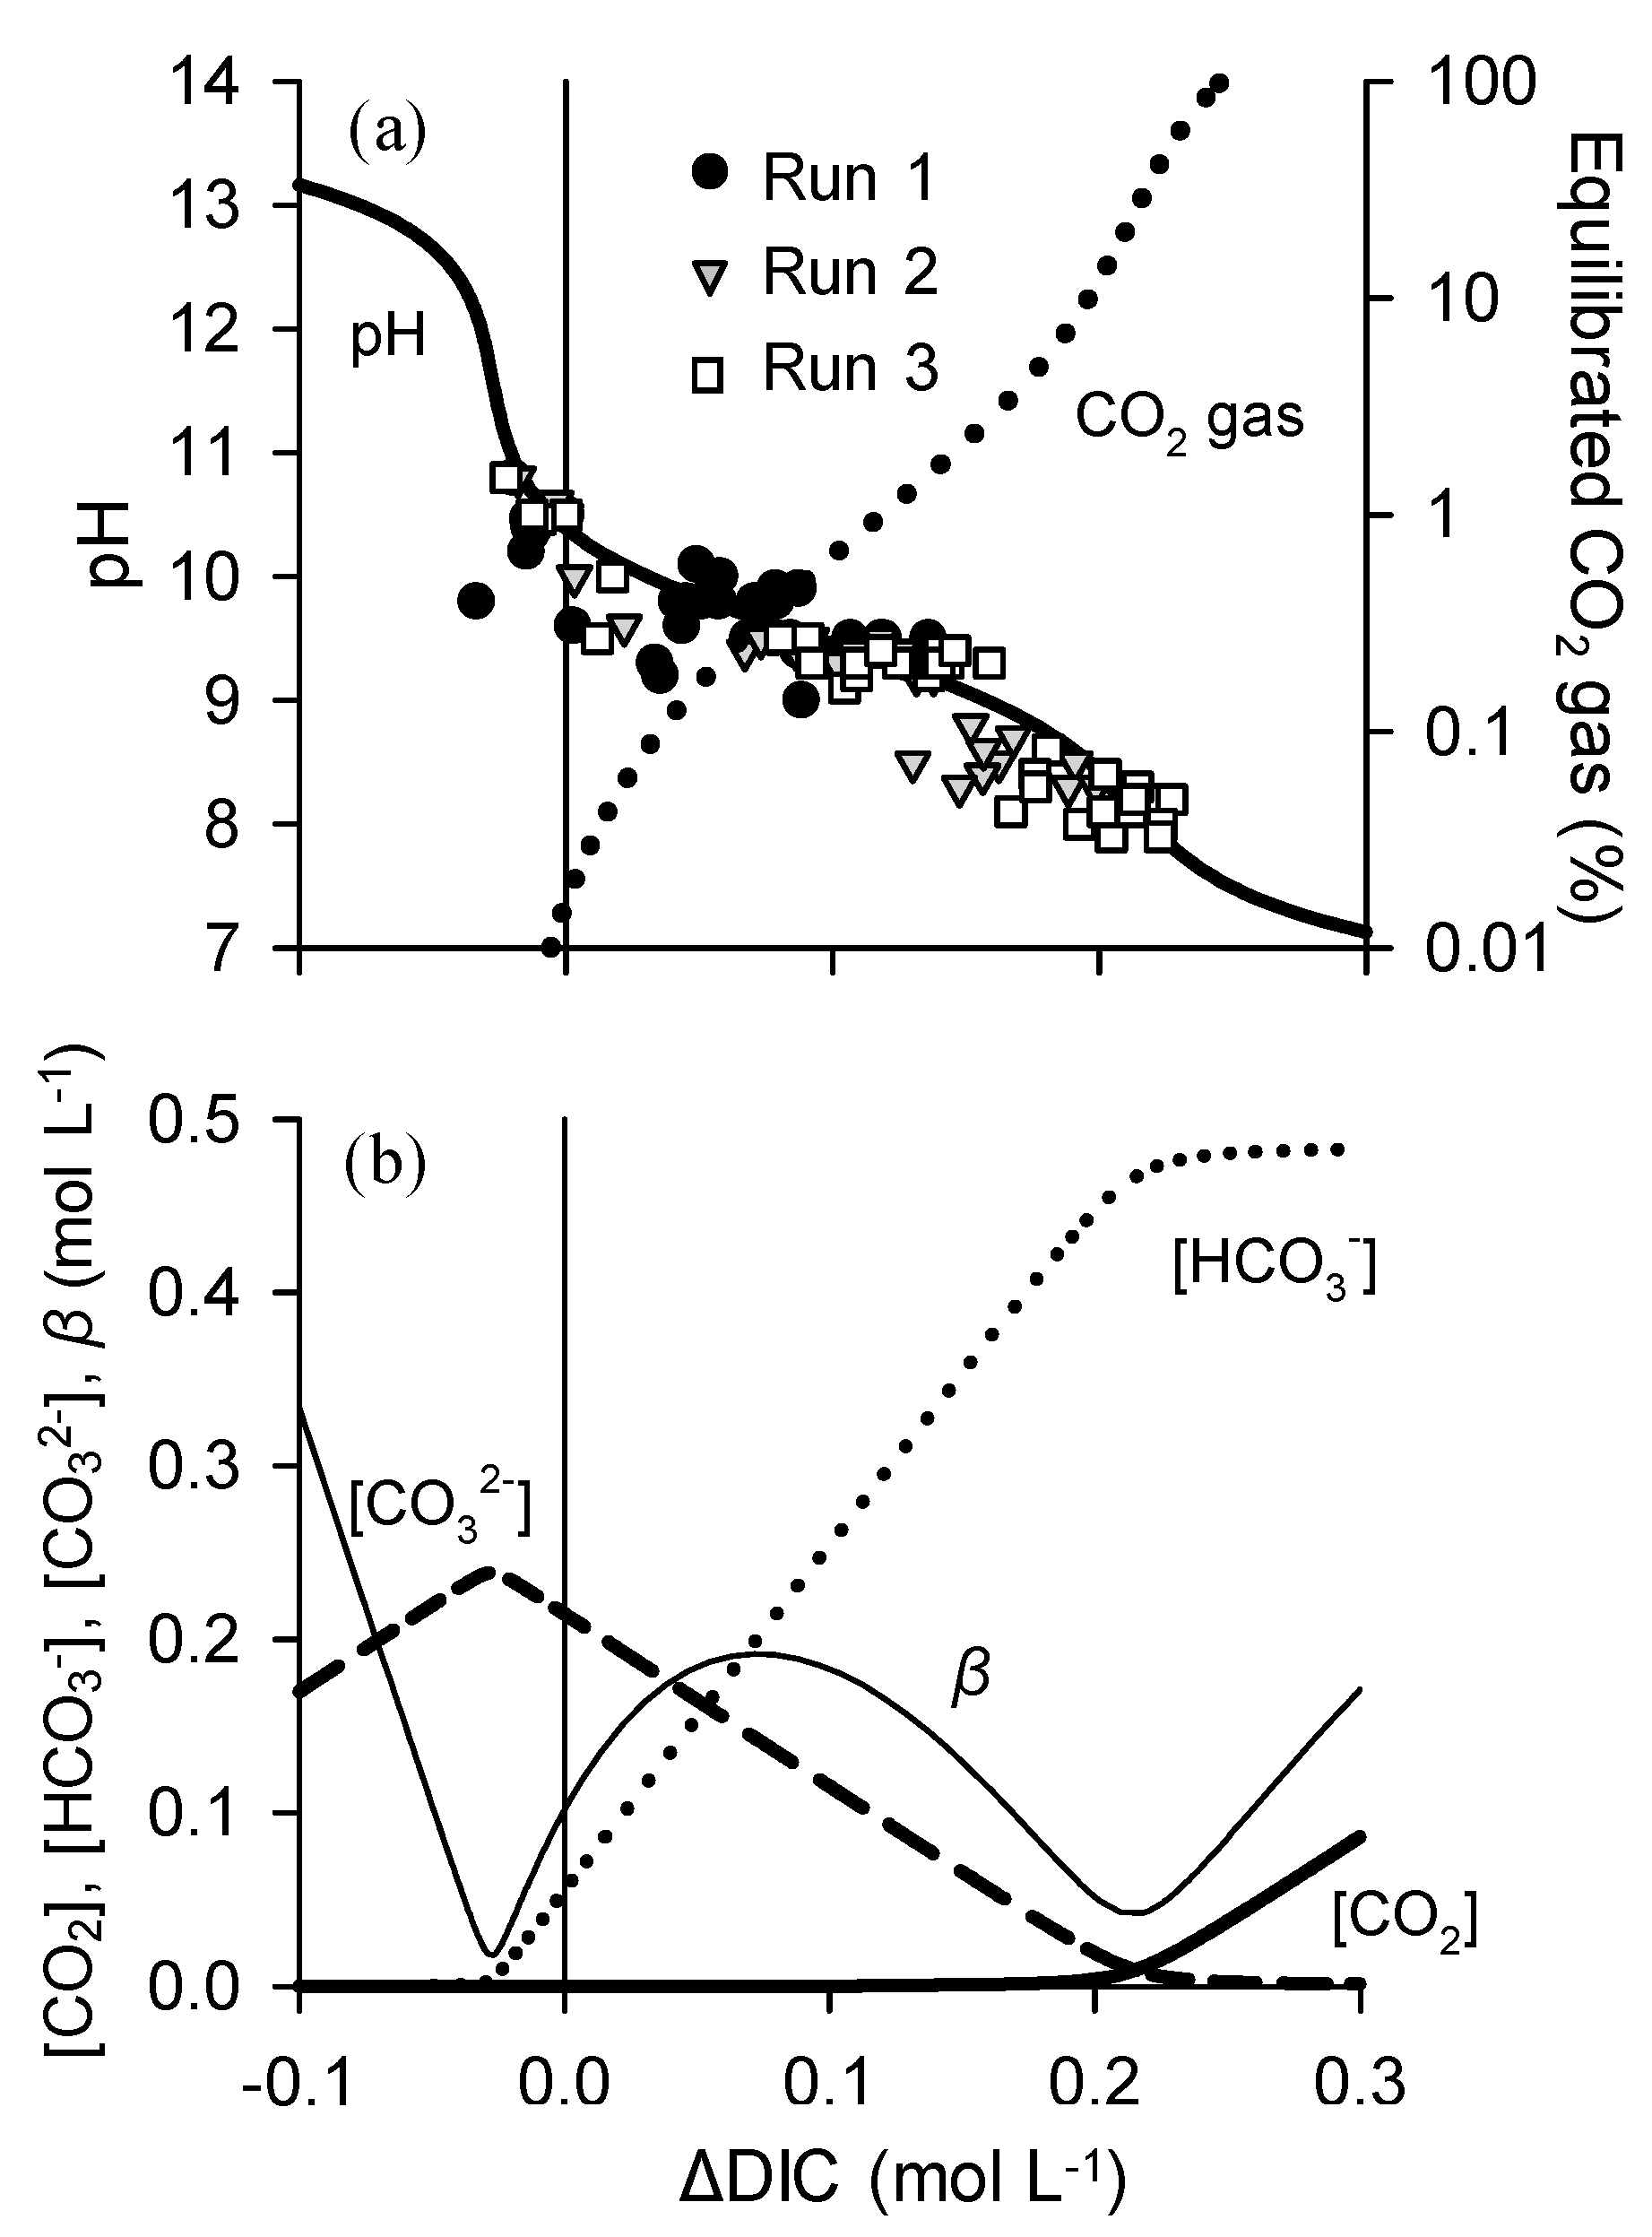
2.5.1. Modeling pH Variation with DIC Change

The composition of DIC was calculated based on the following equations [26]:
[ CO 2 ] = D I C 1 + K 1 [ H + ] + K 1 K 2 [ H + ] 2
[ HCO 3 ] = D I C 1 + [ H + ] K 1 + K 2 [ H + ]
[ CO 3 2 ] = D I C 1 + [ H + ] K 2 + [ H + ] 2 K 1 K 2
where K1 and K2 are stoichiometric constants for bicarbonate and carbonate, respectively. In this study, pK1 = 6.38 [27] and pK2 = 9.8 were assumed. The pK2 value was derived from NaOH titration (cf. Supplementary material Section S1).
Based on the above equations, pH variation with CO2 absorption/desorption was modeled. The buffering function of phosphate and borate was assumed to be negligible because their concentrations were about 100 times lower than the DIC concentration. In the current experiment, DIC concentration can be expressed as:
D I C = [ CO 2 ] + [ HCO 3 ] + [ CO 3 2 ] = c 0 + Δ D I C
where c 0 is the initial DIC concentration by the addition of NaHCO3 (0.27 mol L−1), and Δ D I C is the change in DIC concentration due to CO2 absorption or photosynthetic assimilation (mol L−1). Charge balance in the medium can be expressed as:
[ H + ] + [ Na + ] = [ H + ] + c 0 + c b = [ OH ] + [ HCO 3 ] + 2 [ CO 3 2 ]
where c b is the final concentration of NaOH in the modified SOT medium that raised pH to 10.5 (0.215 mol L−1). Using the ion product constant of water ( K w = [ H + ] [ OH ] = 1.0 × 10 14   mol 2   L 2 ) , Equation (12) can be expressed as:
[ H + ] + c 0 + c b = K w [ H + ] + [ HCO 3 ] + 2 [ CO 3 2 ]
Finally, Equations (6), (10), (11) and (13) can be formulated into a quartic equation:
[ H + ] 4 + ( K 1 + c 0 + c b ) [ H + ] 3 + ( K 1 K 2 + K 1 c b K w K 1 Δ D I C ) [ H + ] 2 + K 1 ( K 2 c b K w K 2 c 0 2 K 2 Δ D I C ) [ H + ] K 1 K 2 K w = 0
In the current experiment, all variables in Equation (7) except for Δ D I C and [ H + ] remained constant. Therefore, pH variation with CO2 absorption/desorption can be estimated based on changes in DIC concentration ( Δ D I C ) with this model. The quartic equation was solved with Mathematica 8.0 (Wolfram Research, Champaign, IL, USA).
Buffer intensity, β, was calculated based on the following approximation for diprotic acids [28]:
β = d C A d pH 2.3 ( [ H + ] + [ OH ] + [ CO 2 ] [ HCO 3 ] [ CO 2 ] + [ HCO 3 ] + [ HCO 3 ] [ CO 3 2 ] [ HCO 3 ] + [ CO 3 2 ] )
where d C A is the infinitesimal amount of acids required to decrease d pH . The equilibrated CO2 gas concentration was calculated according to Henry’s law:
p CO 2 = [ CO 2 ] × 1 H c p
where p CO 2 is the partial pressure of CO2 under equilibrium condition (Pa), [CO2] is the aqueous concentration of CO2 (mol L−1), and Hcp is Henry’s law solubility constant (3.30 × 10⁻⁷ mol L−1 Pa−1) (Sander 2015).

2.5.2. Biomass Production, Carbon Fixation, and Carbon Mass Balance

Algal volumetric production rate (Px; gDW L−1 d−1) was calculated with the following equation:
P x = x 2 x 1 t 2 t 1
where xi is biomass concentration (gDW L−1) at time ti (d). The growth steady-state was defined as a period with less than 10% variation in the 3-day moving averages of DW, which was Day 10–18 for all Runs in this study.
The carbon mass balance was calculated using the following equations:
C i n = i = 1 18 C O 2 i n i
C o u t = ( D I C + D O C ) A B S f ( D I C + D O C ) A B S 0 + ( P O C + D I C + D O C ) P B R f ( P O C + D I C + D O C ) P B R 0 + i = 1 18 ( D I C + D O C ) A B S s i + i = 1 18 ( P O C + D I C + D O C ) P B R s i i = 1 18 ( D I C + D O C ) N i
where Cin and Cout represent the total incoming and outgoing carbon (gC) after 18 days of the experiment, respectively. CO2in refers to the carbon dioxide supplied to the process. ABS0 and PBR0 refer to the carbon mass in the initial medium of the CO2 absorption column and PBR, respectively. ABSf and PBRf indicate the final carbon mass of each reactor. ABSs and PBRs represent the carbon mass in each sample taken every day. N represents carbon mass in the new SOT medium.

2.5.3. Statistical Analysis

Results are expressed as means ± standard deviations, where available. The correlation coefficient was obtained using simple regression analysis (Excel software). Results from different conditions were analyzed using the Tukey-Kramer method. Differences with p < 0.05 were considered significant.

3. Results

3.1. Change in pH and DIC Concentration with CO2 Absorption

The pH in both absorption columns and PBRs repeated reduction and elevation every 24 hours upon the medium circulation and CO2 gas replenishment (Figure 2), but the range was smaller in PBRs than in absorption columns. Most of the supplied CO2 was absorbed in Runs 1 and 2, while the removal efficiency in Run 3 was 63% (Table 2).
To elucidate the pH buffer characteristics of the modified SOT medium, the relationship between CO2 absorption and medium pH was modeled using Equation (4). The modeled curve showed a close similarity to the experimental data (Figure 3a). The accuracy was confirmed with regression, in which R2 was 0.8593 and residual mean square error (RSME) was 0.307 with an average pH 9.29, indicating nearly 97% accuracy.
Increase in ΔDIC (CO2 absorption) lowered the pH of the solution, but a buffer region existed where ΔDIC was 0–0.17 mol L−1 (pH range: 8.9–10.4; Figure 3a), at which buffer intensity β was over half the maximum (>0.10 mol L−1; Figure 3b). In Runs 2 and 3 after Day 3, the CO2 absorbent received so large amount of CO2 gas that ΔDIC exceeded the buffer region, causing drastic drops of pH down to approximately 8.5 (Figure 2). Although the DIC in the PBR increased with a longer experimental duration in all conditions, the maximum value was 0.43 mol L−1DIC = 0.16 mol L−1) in Run 3, which was within the buffer region (0–0.17 mol L−1). As a result, the pH in PBR remained over 9 even in Runs 2 and 3 (Figure 2). Equilibrated CO2 gas concentration was also drawn in Figure 3a based on Equation (6). With a slight increase in ΔDIC less than 0.02 mol L−1, equilibrated CO2 gas exceeded atmospheric concentration (c.a. 0.04%).

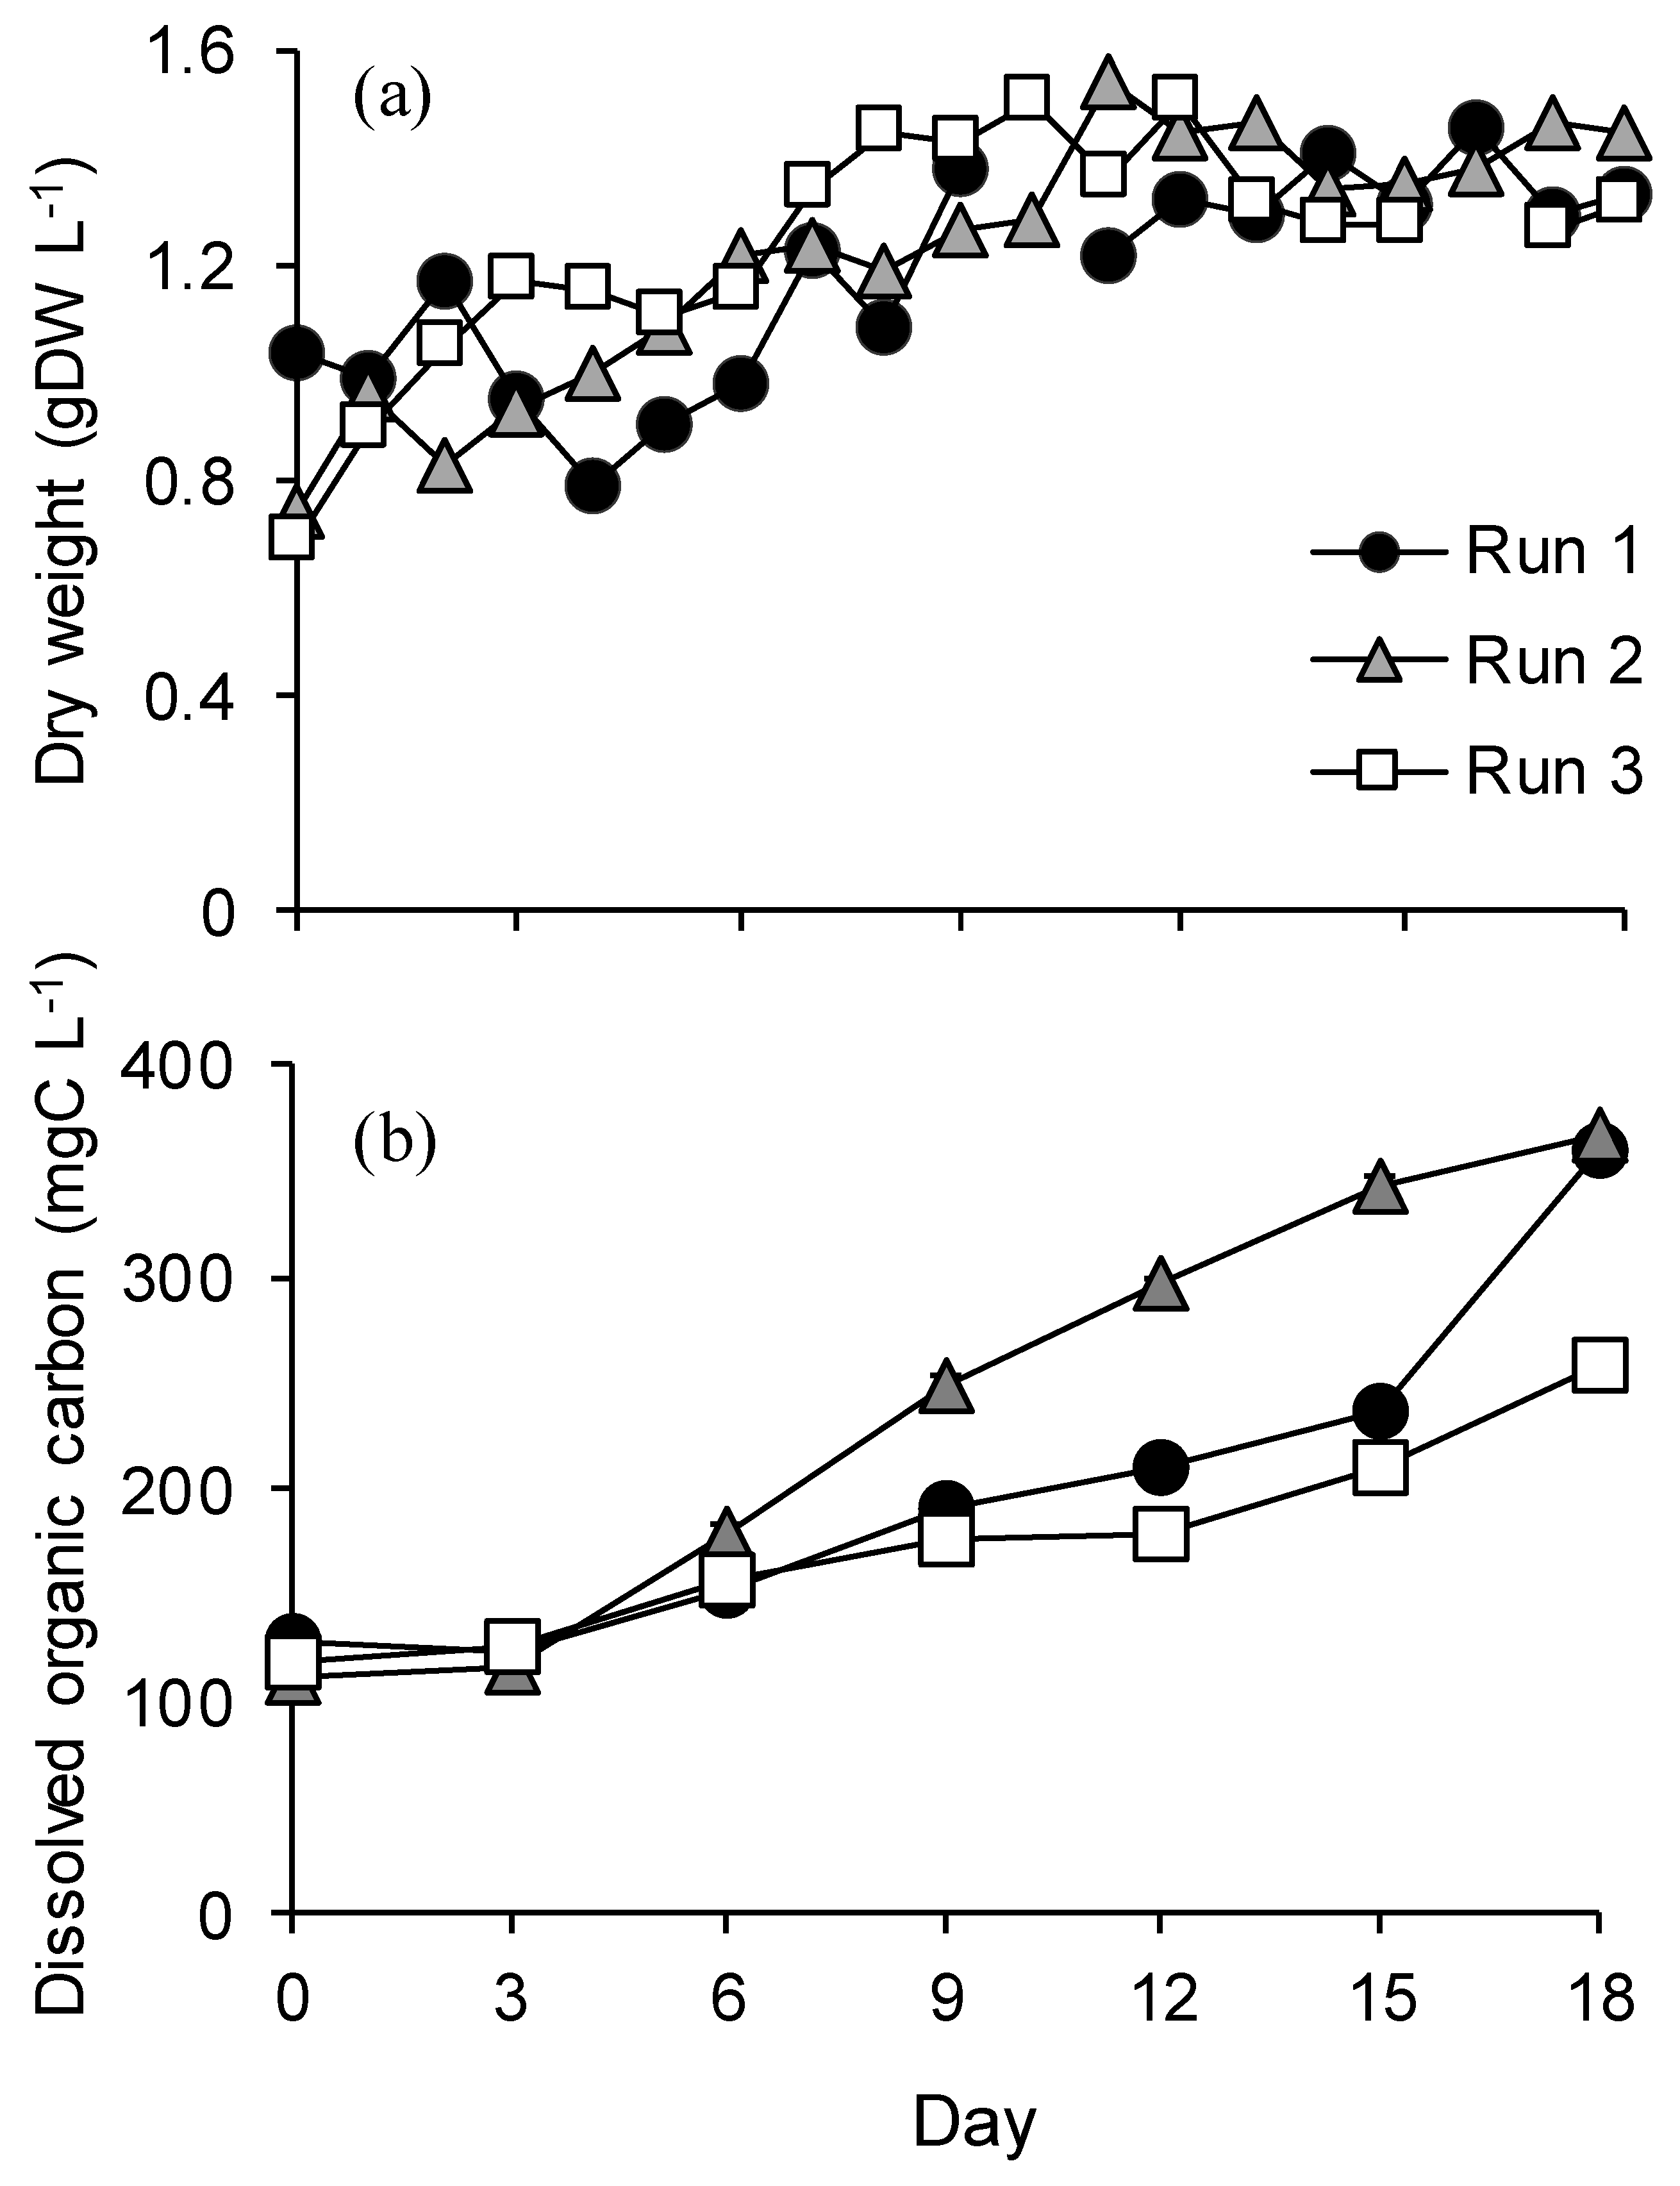
3.2. Algal Growth and DOC Excretion

The biomass concentrations of A. platensis in PBRs showed similar trends among three Runs; it increased until Day 8–11 and became steady-state (Figure 4a). The average steady-state biomass concentrations were 1.33 ± 0.07, 1.42 ± 0.08, and 1.34 ± 0.10 gDW L−1 for Runs 1, 2, and 3, respectively, and there was no statistical difference (p > 0.05). There was also no statistical difference in the average biomass production rates, Px, among Runs during the steady-state (0.27 ± 0.10, 0.31 ± 0.10, and 0.27 ± 0.09 gDW L−1 d−1 for Runs 1, 2, and 3, respectively). Nitrate and phosphate concentrations gradually decreased during the 18 days of culture, but more than 60 and 70% of the original medium remained at the end, respectively. Dissolved organic carbon concentration kept increasing in PBRs (Figure 4b). The final concentration ranged from 260 to 367 mgC L−1, while all Runs had similar initial values (110–128 mgC L−1).

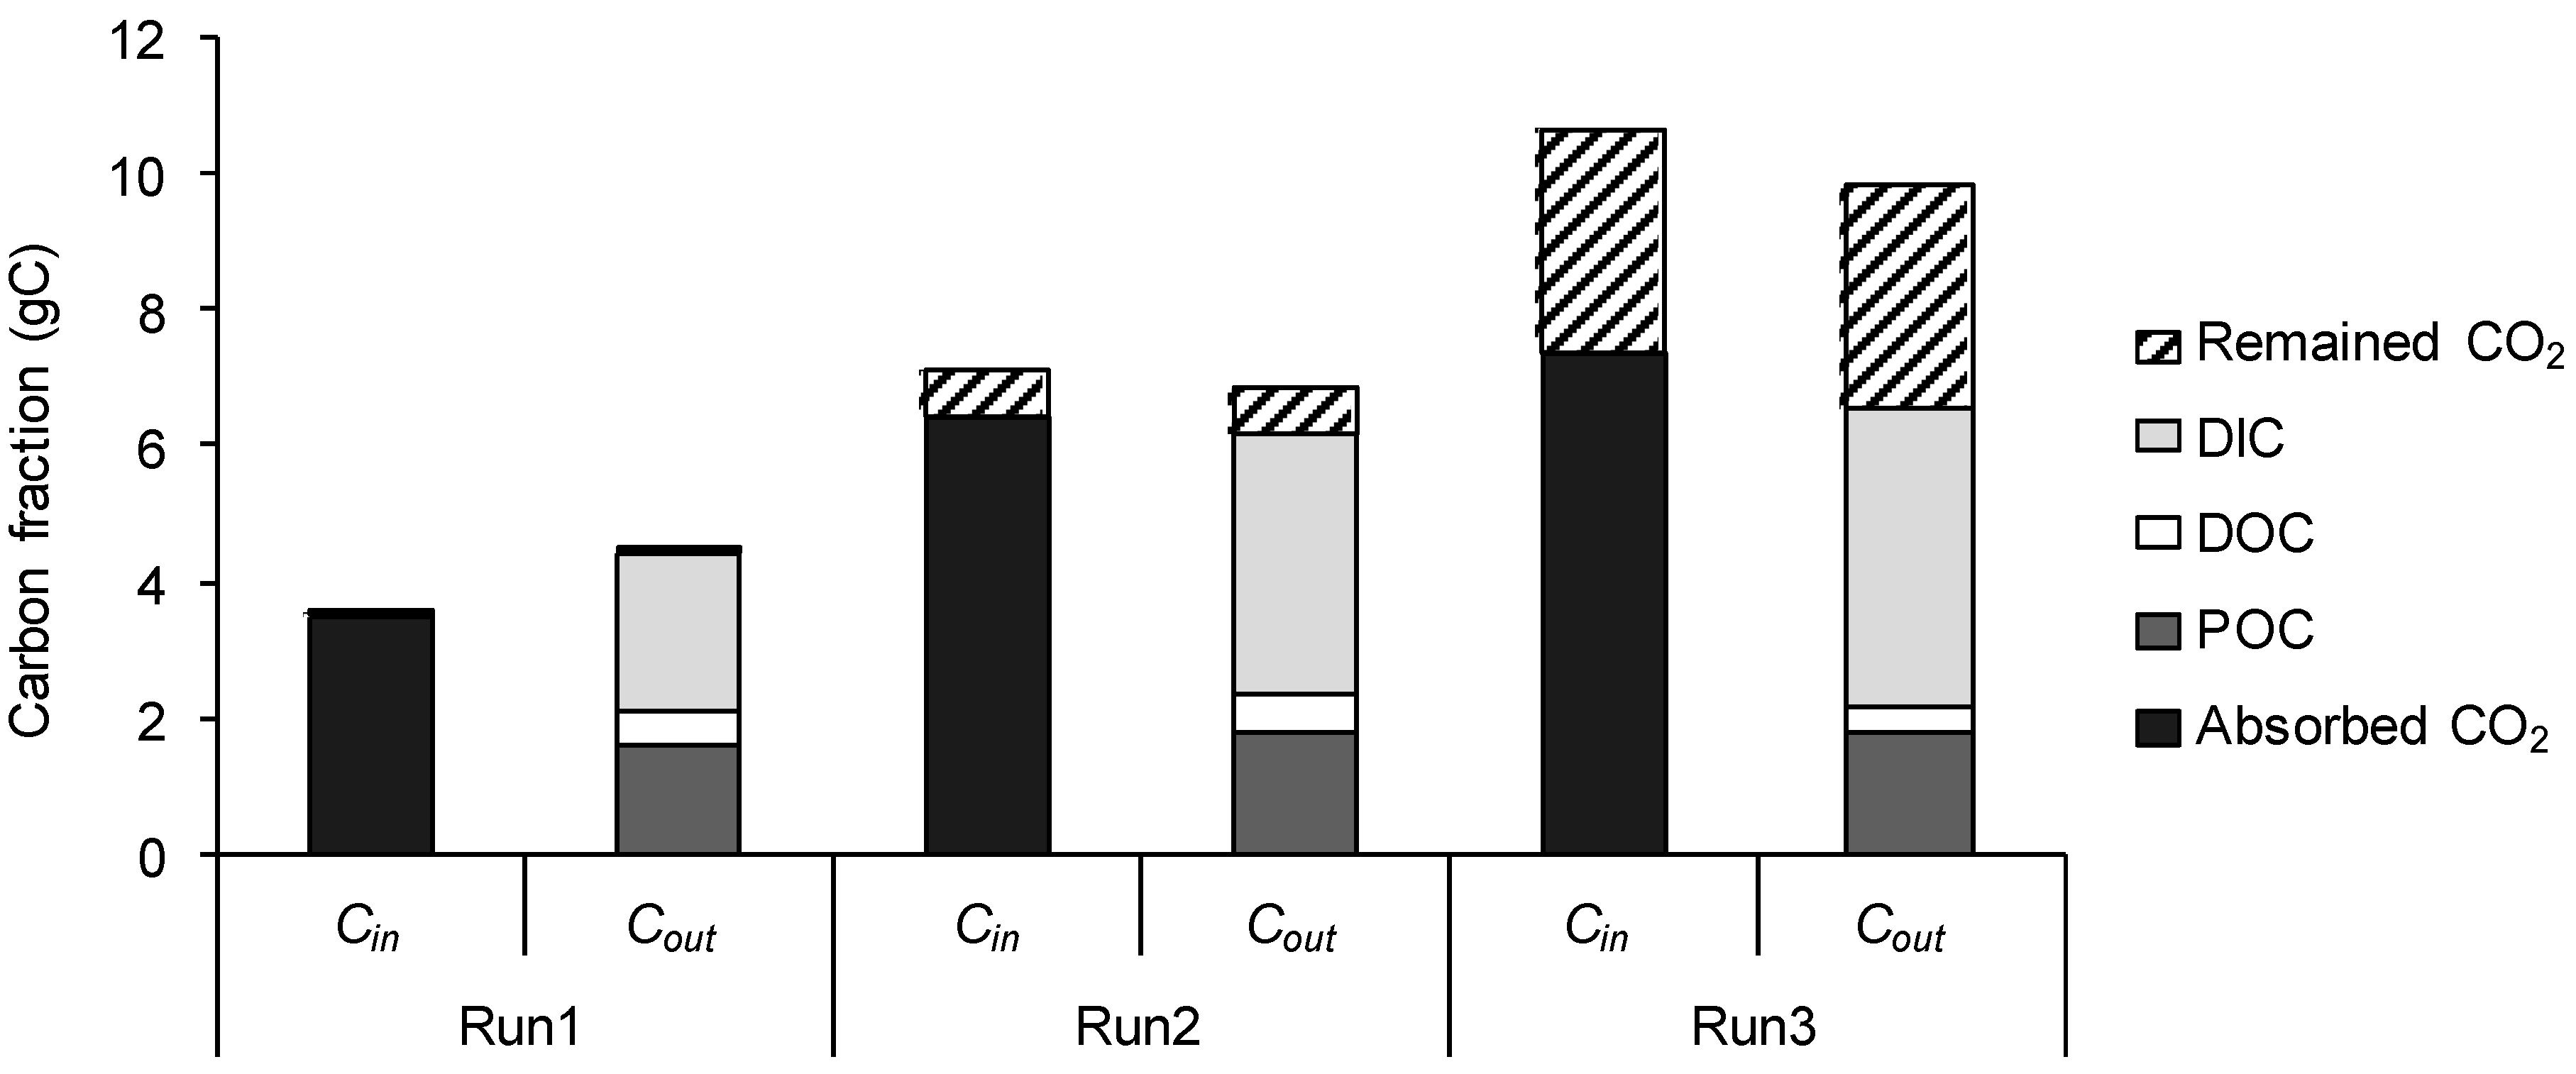
3.3. Carbon Mass Balance

The carbon content of the dry cell of A. platensis during this experiment was found to be 32 ± 4% from the elemental analysis, and it did not change significantly throughout the experiment. The overall balance between the total incoming carbon mass (Cin; absorbed + remained CO2) and outgoing carbon mass (Cout; differences between initial and final concentrations of DIC, DOC, and POC) was evaluated (Figure 5). Near closure of the balance was observed with the difference of less than 3–23% between Cin and Cout. The absorbed CO2 was converted into DIC, DOC, and POC. Average biological carbon fixation (DOC + POC) rates were 0.114, 0.131, and 0.103 gC L−1 d−1 for Runs 1, 2, and 3, respectively, and the conversion efficiencies from absorbed CO2 to DOC + POC were 58, 38, and 30%, respectively. The difference between CO2 supply and biological carbon fixation was relatively large in Runs 2 and 3, causing DIC accumulation (Figures S3 and S4) and pH decrease in the absorption column (Figure 2). The carbon mass flux analysis also revealed that out of all photosynthetically fixed carbon (increased and discharged POC + DOC), 16–24% was converted into DOC (Figure 5). The accumulated DIC ultimately escaped from the system in the medium discharge (cf. supplementary data Figure S5 for carbon flux).

4. Discussion

4.1. Effect of High CO2 Supply

According to the carbon mass balance analysis, the CO2 supply was found to be higher than carbon assimilation by Arthrospira in all conditions (Figure 5). Nonetheless, the strong pH buffer contained in alkaliphilic algal media allowed stable pH even with high CO2 supply, and nearly 100% CO2 recoveries were achieved for Runs 1 and 2 (Table 2). These results indicate the stability of the CO2 recovery process using alkaliphilic algae culture. The highest CO2 supply (Run 3) resulted in lower CO2 recovery (63%) due to increased [CO2]. Absorption of CO2 led to a reduction of pH and an increase in DIC, both resulting in increased [CO2]. When [CO2] reached a high level that equilibrated with gas CO2 concentration, the CO2 absorption terminated. Similar results were obtained in previous studies that tested CO2 absorption with high-DIC medium [21,22]. Gonzalez-Lopez et al. [22] tested various concentrations of NaHCO3 and Na2CO3 for CO2 recovery. Without the addition of alkaline agents, pH reduced from 10 to less than 7 in the first 2 min. On the other hand, >0.3 mol L−1 of NaHCO3 and Na2CO3 sustained pH > 9.5 for more than 30 min, resulting in total carbon absorption of up to 2.0 g L−1. Total absorptivity increased with increasing initial DIC. As such, estimation of the maximal CO2 absorptivity of the target medium should be necessary for designing an efficient CO2 recovery system. See Supplementary Material Sections S2 and S3 for the estimation of maximal CO2 absorptivity of the current experiment.
The effect of high CO2 supply rates on Arthrospira growth was minimized because of the separation of the CO2 absorption column and the PBR, as suggested in previous studies [10,21,22]. While pH was reduced to less than 8.5 in the CO2 absorption column of Runs 2 and 3, it was maintained at around 9.5 in PBRs (Figure 3). Since CO2 absorption reached oversaturation in the absorption column of Run 3, further CO2 absorption was prevented, which worked as a protection to avoid excess carbon supply for Arthrospira growth. Since the optimum pH of Arthrospira is 9.8, and its 20% growth reduction is estimated at pH < 9.2 [17], such protection worked effectively to prevent growth reduction.
Carbon mass balance suggested a negligible escape of DIC from PBRs to the atmosphere as gaseous CO2, although [CO2] was higher than air-equilibrium level (Figure 3a; cf. Section 3.1). This contradictory result could be explained by the prevention of air exchange between PBR headspace and atmosphere owing to the air-vent filters attached to the PBRs. In practical operations, Arthrospira cultures are majorly conducted in an outdoor pond or in an aerated PBR. To prevent DIC escapes in such conditions, CO2 supply should be adjusted to maintain ΔDIC close to the air-equilibrium (in the current condition, ΔDIC < 0.02 mol L−1). Such ΔDIC level is also preferential for Arthrospira culture, since pH < 9.5 reportedly would increase the risk of contamination [2].

4.2. Effect of Medium Recycling

In the current process, 75% of the harvested medium was recycled (Figure 1). According to Cui et al. [24], the cost of alkaline agent reaches 91% of the total medium cost. The current medium recycling process saved 68% of the medium cost, under the assumption that other nutrients are supplemented at every recycling. The medium cost can be further reduced if the medium recycling rate and nutrient supplementation are optimized.
With high CO2 supply and medium recycling, accumulation of DIC and DOC were observed in all Runs (Figure 2 and Figure 3). Previous studies reported reduced growth rate with high DIC (>0.3 mol L−1; [17]) and DOC (>60–100 mg L−1; [8,29]). However, in this study, no significant reduction in biomass production rate or in growth rate was observed. The DIC accumulation seemingly did not have much effect at the current level (up to 0.4 mol L−1). On the other hand, DOC concentration was 2–3 times higher than the reported inhibition level. The reason this DOC did not show clear inhibition could be the difference in DOC characteristics. A previous study with a green alga Scenedesmus acuminatus reported differential inhibitive levels of DOC depending on growth stages, where DOC from the declining phase had severer inhibition than that from exponential and stationary phases [30]. Differential DOC inhibition levels were also observed between the indoor and outdoor culture of Arthrospira, where DOC in indoor culture inhibited the growth at as low DOC as 65 mg L−1, while that in outdoor culture did not significantly inhibit the growth even at 900 mg L−1 [24]. Since the current semi-continuous culture maintained continuous growth, cells may not have excreted inhibitive DOC. Further study is needed to elucidate the effect of high CO2 supply on the characteristics of DOC.
Nevertheless, further DOC accumulation may cause contamination of heterotrophic microorganisms and growth inhibition, and therefore should be avoided. The previous study reports differential amounts of DOC excretion depending on culture conditions. In a culture of A. platensis, DOC release was the most substantial during stationary-phase (> 30% primary production), but it was below 5% during the exponential phase [31]. Excretion of DOC could be decreased through raising the culture-specific growth rate, by maintaining actively growing cells. Since the specific growth rate can be controlled by adjusting the dilution rate [32], a high dilution rate of the PBR may help to keep cells active for minimized DOC production. The excretion of DOC also changes with nutrient availability [33,34], mechanical mixing, and so on. Further study is necessary to elucidate the effect of those conditions on the production and inhibitive characteristics of DOC.

4.3. Evaluation of CO2 Recovery with Media-Recycled Arthrospira Culture

The large CO2 absorption capacity of the high-DIC medium is an advantage of the current CO2 recovery process. The large capacity enables pH stability. For example, the pH of the absorbent only decreased from 10.5 to 7.9 with continued CO2 supply (total absorption of 2.6 gC L−1), while it would decrease from 10.5 to 5.2 with merely 0.06 gC L−1 of CO2 without buffer. The pH reduction limits not only CO2 absorption but also the growth of algae. Most algae have narrow ranges of suitable pHs, such as 9–10.5 for Arthrospira platensis [17], 7–8 for Dunaliella salina [35], and 6–8 for Chlorella sorokiniana [36], and an abrupt pH change may severely hinder the growth. The pH buffer is especially important with an outdoor algae culture, since algal CO2 fixation fluctuates depending on the weather and seasons. When algal CO2 fixation is low, CO2 supply may lead to a drastic drop in pH without buffer functions. Therefore, CO2 recovery using Arthrospira culture may be incorporated into the outdoor culture, which would decrease the cost and energy input in CO2 recovery and algae production.
A similar CO2 recovery with media-recycled Arthrospira culture was attempted by Cui et al. [24]. They achieved a CO2 fixation rate of 0.31 gCO2 L−1 d−1, which was similar to 0.32–0.36 gCO2 L−1 d−1 of this study. They revealed a correlation of growth deterioration and DOC accumulation after repeated medium recycle, which was not observed in the current experiment probably owing to the difference in the culture mode (batch or semi-continuous) and/or duration (26 days or 18 days). Another study was performed by Gonzalez-Lopez et al. [22] on CO2 recovery with an alkaliphilic cyanobacterium Anabaena sp. They achieved nearly 100% CO2 recovery and productivity of up to 0.4 g L−1 d−1, which were similar to the current study. They were successful in predicting kinetic reactions of CO2 recovery using a model. However, neither study reported the carbon mass balance and the fate of carbon incorporated into the system. The fate of carbon may change the interpretation of recovery efficiency. For example, Gonzalez-Lopez et al. [22] reported 95% efficiency of carbon utilization as to explain only about 4% escaped as CO2 gas, but this efficiency does not take into account the remaining DIC and excreted DOC as unused or unnecessary carbon output. The current study revealed that 24% of assimilated carbon was released as CO2 (Figure 5). If this DOC requires further treatment, such as aerobic activated sludge, the carbon footprint would be higher than previously reported algal CCU process. Thus, this study indicated the importance of carbon mass balance analysis in the practical evaluation of CO2 recovery processes.

5. Conclusions

This study conducted semi-continuous cultures of A. platensis with medium recycling and CO2 supply. Medium recycling enabled 68% of total medium cost reduction and did not affect the algal growth although DIC and DOC accumulated in the medium. Carbon dioxide recovery rates of 63–100% and steady algal growth of 0.31 gDW L−1 d−1 were achieved even with the excessive carbon supply compared with the A. platensis carbon assimilation. Carbon mass balance analysis revealed that up to 24% of the assimilated carbon escapes into the medium in a form of DOC, and thus care needs to be taken in evaluating the process. This study demonstrated the effectiveness and stability of the medium-recycling process even at high CO2 supply rates. Further study is needed to elucidate the mechanisms of DOC excretion and its effects on the growth and biomass characteristics.

Supplementary Materials

The following are available online at https://www.mdpi.com/2076-3417/10/1/228/s1: explanations on Figure S1. Modified SOT medium titration with KOH (2) CO2 partial pressure in the absorption columns, Figure S2. Calculated and experimental amount of the absorbed CO2 over 24 h (CO2abs) at different initial dissolved inorganic carbon (DIC). Plots: experimental values; solid lines: calculated values; and dashed lines: theoretical 100% absorption of supplied CO2 Figure S3. Dissolved inorganic carbon concentrations in CO2 absorption columns; (a,c,e) after CO2 supply, and (b,d,f) after medium recycle from the photobioreactors. Low pH after CO2 supply induced decrease of CO32− fraction and increase of HCO3 and CO2 fractions, Figure S4. Dissolved inorganic carbon concentration in photobioreactors; (a,c,e) after 1-day incubation, and (b,d,f) after medium input from CO2 absorption columns. Slight reduction in total DIC after incubation was observed. Figure S5. Carbon mass flux during 18-day operation. CO2 supply rate of (a) Run 1, (b) Run 2, and (c) Run 3. Each box represents total cumulative mass (in milligram) of carbon fraction introduced or discharged over 18 days in the forms of CO2, dissolved inorganic carbon (DIC), dissolved organic carbon (DOC) or algal biomass (particulate organic carbon; POC). The mass inside the CO2 absorption column and photobioreactor represent differences from the initial state.

Author Contributions

Conceptualization, M.K. and T.T.; methodology, M.K., Y.Y., and T.K.; software, T.M.; formal analysis, M.K. and T.M.; investigation, M.K. and Y.Y.; writing—Original draft preparation, M.K.; writing—Review and editing, T.K., T.M., and T.T; supervision, T.T.; funding acquisition, T.T. All authors have read and agreed to the published version of the manuscript.

Funding

This study was partially supported by Japan Science and Technology Agency (JST)/Japan International Cooperation Agency (JICA), Science and Technology Research Partnership for Sustainable Development (SATREPS) and PLANE3T Project funded by the Private University Research Branding Project supported by Japanese Ministry of Education, Culture, Sports, Science and Technology (MEXT).

Conflicts of Interest

The authors declare no conflict of interest.

References

  1. Furmaniak, M.A.; Misztak, A.E.; Franczuk, M.D.; Wilmotte, A.; Waleron, M.; Waleron, K.F. Edible cyanobacterial genus Arthrospira: Actual state of the art in cultivation methods, genetics, and application in medicine. Front. Microbiol. 2017, 8, 1–21. [Google Scholar] [CrossRef] [PubMed]
  2. Belay, A. Biology and industrial production of Arthrospira (Spirulina). In Handbook of Microalgal Culture: Applied Phycology and Biotechnology; Richmond, A., Hu, Q., Eds.; John Wiley & Sons, Ltd.: Oxford, UK, 2013; pp. 339–358. ISBN 9780470673898. [Google Scholar]
  3. Kurd, F.; Samavati, V. Water soluble polysaccharides from Spirulina platensis: Extraction and in vitro anti-cancer activity. Int. J. Biol. Macromol. 2015, 74, 498–506. [Google Scholar] [CrossRef] [PubMed]
  4. Agustini, T.W.; Suzery, M.; Sutrisnanto, D.; Ma’ruf, W.F. Hadiyanto Comparative study of bioactive substances extracted from fresh and dried Spirulina sp. Procedia Environ. Sci. 2015, 23, 282–289. [Google Scholar] [CrossRef] [Green Version]
  5. Choi, W.Y.; Sim, J.-H.; Lee, J.-Y.; Kang, D.H.; Lee, H.Y. Increased anti-inflammatory effects on LPS-induced microglia cells by Spirulina maxima extract from ultrasonic process. Appl. Sci. 2019, 9, 2144. [Google Scholar] [CrossRef] [Green Version]
  6. Choi, W.; Kang, D.; Heo, S.-J.; Lee, H. Enhancement of the neuroprotective effect of fermented Spirulina maxima associated with antioxidant activities by ultrasonic extraction. Appl. Sci. 2018, 8, 2469. [Google Scholar] [CrossRef] [Green Version]
  7. Zarrouk, C. Contribution à L’étude D’une Cyanophycée: Influence de Divers Facteurs Physiques et Chimiques sur la Croissance et la Photosynthèse de Spirulina maxima (Setch et Gardner) Geitler. Ph.D. Thesis, University of Paris, Paris, France, 1966. [Google Scholar]
  8. Depraetere, O.; Pierre, G.; Noppe, W.; Vandamme, D.; Foubert, I.; Michaud, P.; Muylaert, K. Influence of culture medium recycling on the performance of Arthrospira platensis cultures. Algal Res. 2015, 10, 48–54. [Google Scholar] [CrossRef]
  9. Mejia-da-Silva, L.d.C.; Matsudo, M.C.; Morocho-Jacome, A.L.; de Carvalho, J.C.M. Application of physicochemical treatment allows reutilization of Arthrospira platensis exhausted medium: An investigation of reusing medium in Arthrospira platensis cultivation. Appl. Biochem. Biotechnol. 2018, 186, 40–53. [Google Scholar] [CrossRef]
  10. Chi, Z.; O’Fallon, J.V.; Chen, S. Bicarbonate produced from carbon capture for algae culture. Trends Biotechnol. 2011, 29, 537–541. [Google Scholar] [CrossRef]
  11. Arroyo, C.A.; Contreras, J.L.; Zeifert, B.; Ramírez, C. CO2 capture of the gas emission, using a catalytic converter and airlift bioreactors with the microalga Scenedesmus dimorphus. Appl. Sci. 2019, 9, 3212. [Google Scholar] [CrossRef] [Green Version]
  12. Kumar, K.; Dasgupta, C.N.; Nayak, B.; Lindblad, P.; Das, D. Development of suitable photobioreactors for CO2 sequestration addressing global warming using green algae and cyanobacteria. Bioresour. Technol. 2011, 102, 4945–4953. [Google Scholar] [CrossRef]
  13. Singh, J.; Dhar, D.W. Overview of carbon capture technology: Microalgal biorefinery concept and state-of-the-art. Front. Mar. Sci. 2019, 6, 1–9. [Google Scholar] [CrossRef] [Green Version]
  14. Cuéllar-Franca, R.M.; Azapagic, A. Carbon capture, storage and utilisation technologies: A critical analysis and comparison of their life cycle environmental impacts. J. CO2 Util. 2015, 9, 82–102. [Google Scholar] [CrossRef]
  15. Klamczynska, B.; Mooney, W.D. Heterotrophic Microalgae. In Sustainable Protein Sources; Elsevier: Amsterdam, The Netherlands, 2017; pp. 327–339. ISBN 9780128027769. [Google Scholar]
  16. Al-Mamoori, A.; Krishnamurthy, A.; Rownaghi, A.A.; Rezaei, F. Carbon Capture and Utilization Update. Energy Technol. 2017, 5, 834–849. [Google Scholar] [CrossRef] [Green Version]
  17. Kishi, M.; Toda, T. Carbon fixation properties of three alkalihalophilic microalgal strains under high alkalinity. J. Appl. Phycol. 2017, 30, 1–10. [Google Scholar] [CrossRef]
  18. Pancha, I.; Chokshi, K.; Ghosh, T.; Paliwal, C.; Maurya, R.; Mishra, S. Bicarbonate supplementation enhanced biofuel production potential as well as nutritional stress mitigation in the microalgae Scenedesmus sp. CCNM 1077. Bioresour. Technol. 2015, 193, 315–323. [Google Scholar] [CrossRef]
  19. Kang, C.D.; Lee, J.S.; Park, T.H.; Sim, S.J. Comparison of heterotrophic and photoautotrophic induction on astaxanthin production by Haematococcus pluvialis. Appl. Microbiol. Biotechnol. 2005, 68, 237–241. [Google Scholar] [CrossRef]
  20. Tripathi, R.; Singh, J.; Thakur, I.S. Characterization of microalga Scenedesmus sp. ISTGA1 for potential CO2 sequestration and biodiesel production. Renew. Energy 2015, 74, 774–781. [Google Scholar] [CrossRef]
  21. Chi, Z.; Xie, Y.; Elloy, F.; Zheng, Y.; Hu, Y.; Chen, S. Bicarbonate-based Integrated Carbon Capture and Algae Production System with alkalihalophilic cyanobacterium. Bioresour. Technol. 2013, 133, 513–521. [Google Scholar] [CrossRef]
  22. González-López, C.V.; Acién Fernández, F.G.; Fernández-Sevilla, J.M.; Sánchez Fernández, J.F.; Molina Grima, E. Development of a process for efficient use of CO2 from flue gases in the production of photosynthetic microorganisms. Biotechnol. Bioeng. 2012, 109, 1637–1650. [Google Scholar] [CrossRef]
  23. Canon-Rubio, K.A.; Sharp, C.E.; Bergerson, J.; Strous, M.; De la Hoz Siegler, H. Use of highly alkaline conditions to improve cost-effectiveness of algal biotechnology. Appl. Microbiol. Biotechnol. 2016, 100, 1611–1622. [Google Scholar] [CrossRef]
  24. Cui, H.; Yang, Z.; Lu, Z.; Wang, Q.; Liu, J.; Song, L. Combination of utilization of CO2 from flue gas of biomass power plant and medium recycling to enhance cost-effective Spirulina production. J. Appl. Phycol. 2019, 31, 2175–2185. [Google Scholar] [CrossRef]
  25. Ogawa, T.; Terui, G. Studies on the growth of Spirulina platensis: (I) On the pure culture of Spirulina platensis. J. Ferment. Technol. 1970, 48, 361–367. [Google Scholar]
  26. Zeebe, R.; Wolf-Gladrow, D. CO2 in Seawater-Equilibrium, Kinetics, Isotopes, 1st ed.; Halpern, D., Ed.; Elsevier: Amsterdam, The Netherlands, 2001; ISBN 978-0-444-50946-8. [Google Scholar]
  27. Camacho Rubio, F.; Acién Fernández, F.G.; Sánchez Pérez, J.A.; García Camacho, F.; Molina Grima, E. Prediction of dissolved oxygen and carbon dioxide concentration profiles in tubular photobioreactors for microalgal culture. Biotechnol. Bioeng. 1999, 62, 71–86. [Google Scholar] [CrossRef]
  28. Stumm, W.; Morgan, J.J. Aquatic Chemistry: Chemical Equilibria and Rates in Natural Waters, 3rd ed.; Wiley-Interscience: New York, NY, USA, 1993; Volume 3, ISBN 0471511854. [Google Scholar]
  29. Zengling, M.; Kunshan, G.; Teruo, W. Effects of dissolved organic matter on the growth and pigments synthesis of Spirulina platensis (Arthospira). Prog. Nat. Sci. 2006, 16, 50–54. [Google Scholar] [CrossRef]
  30. Sha, J.; Lu, Z.; Ye, J.; Wang, G.; Hu, Q.; Chen, Y.; Zhang, X. The inhibition effect of recycled Scenedesmus acuminatus culture media: Influence of growth phase, inhibitor identification and removal. Algal Res. 2019, 42, 101612. [Google Scholar] [CrossRef]
  31. Gordillo, F.J.L.; Jiménez, C.; Figueroa, F.L.; Niell, F.X. Effects of increased atmospheric CO2 and N supply on photosynthesis, growth and cell composition of the cyanobacterium Spirulina platensis (Arthrospira). J. Appl. Phycol. 1998, 10, 461–469. [Google Scholar] [CrossRef]
  32. Lee, Y.-K.; Chen, W.; Shen, H.; Han, D.; Li, Y.; Jones, H.D.T.; Timlin, J.A.; Hu, Q. Basic culturing and analytical measurement techniques. In Handbook of Microalgal Culture: Applied Phycology and Biotechnology; Richmond, A., Hu, Q., Eds.; John Wiley & Sons, Ltd.: Oxford, UK, 2013; pp. 37–68. ISBN 9781118567166. [Google Scholar]
  33. Wang, M.; Kuo-Dahab, W.C.; Dolan, S.; Park, C. Kinetics of nutrient removal and expression of extracellular polymeric substances of the microalgae, Chlorella sp. and Micractinium sp., in wastewater treatment. Bioresour. Technol. 2014, 154, 131–137. [Google Scholar] [CrossRef]
  34. Zhao, L.; Lu, L.; Li, M.; Xu, Z.; Zhu, W. Effects of Ca and Mg levels on colony formation and EPS content of cultured M. aeruginosa. Procedia Environ. Sci. 2011, 10, 1452–1458. [Google Scholar] [CrossRef] [Green Version]
  35. Subba Rao, D. Cultivation, growth media, division rates and applications of Dunaliella species. In The Alga Dunaliella; Ben-Amotz, A., Polle, J.E.W., Subba Rao, D.V., Eds.; Science Publishers: Enfield, NH, USA, 2009; pp. 45–89. ISBN 9781578085453. [Google Scholar]
  36. Zheng, Y.; Li, T.; Yu, X.; Bates, P.D.; Dong, T.; Chen, S. High-density fed-batch culture of a thermotolerant microalga Chlorella sorokiniana for biofuel production. Appl. Energy 2013, 108, 281–287. [Google Scholar] [CrossRef]
Figure 1. Experimental set-up of the semi-continuous two-phase CO2 recovery process. After 23.5 hours of CO2 absorption and algal incubation period, the medium was partially recirculated between the two reactors. After recirculation, the headspace of the absorption column was replaced with CO2 containing gas (Table 1) and a newly filled gas bag was attached.
Applsci 10 00228 g001
Figure 2. Time course of pH of each reactor (photobioreactors: PBR; and CO2 absorption columns). There are two points in a day, representing pH change due to the circulation of medium between PBR and absorption column.
Applsci 10 00228 g002
Figure 3. Estimation of (a) pH, (b) inorganic carbon species, and buffer capacity β, from change in dissolved inorganic carbon (ΔDIC). All data points were from absorption columns. ΔDIC was calculated by subtracting the initial dissolved inorganic carbon (DIC) (ca. 0.27 mol L−1) from respective DIC on each day.
Applsci 10 00228 g003
Figure 4. Photosynthesis-based products in the photobioreactors: (a) algal growth and (b) dissolved organic carbon.
Applsci 10 00228 g004
Figure 5. Carbon mass balance analysis of the experiments with CO2 supply rate of Run 1 (16 mmol L-PBR d−1), Run 2 (33 mmol L-PBR d−1), and Run 3 (49 mmol L-PBR d−1). Cin represents a cumulative CO2 supply. Cout mainly consisted of algal biomass (particulate organic carbon; POC), dissolved inorganic carbon (DIC) and dissolved organic carbon (DOC) in the medium. Remained CO2 refers to the unabsorbed gas in the absorption columns.
Applsci 10 00228 g005
Table 1. Gas supply configuration for CO2 absorption column.
RunCO2 Supply RateHeadspaceHeadspace CO2CO2 in GasbagN2 in Gasbag a
(gC L-PBR−1 d−1)(gC L-Abs−1 d−1)(L)(%)(L)(L)
10.200.490.735500.40
20.390.980.721000.070.74
30.591.50.741000.450.75
a Nitrogen was prepared to maintain the headspace at the atmospheric level. PBR: Photobioreactor. Abs: CO2 absorption column.
Table 2. Average CO2 fixing rate and pH before and after CO2 supply in absorption columns a.
RunCO2 Supply RateCO2 Recovery Rate, RCO2CO2 Removal EfficiencypH before CO2 SupplypH after CO2 Supply
(gC L-PBR−1 d−1)(gC L-PBR−1 d−1)(%)
10.200.227 ± 0.052115 b9.85 ± 0.089.43 ± 0.09
20.390.369 ± 0.058949.35 ± 0.118.33 ± 0.17
30.590.369 ± 0.055639.34 ± 0.058.13 ± 0.16
a Values from steady-state (Day 10–18) were averaged. b The value includes CO2 from headspace replacement.

