Article

Average Error Probability of an Optically Pre-Amplified Pulse-Position Modulation Multichannel Receiver under Malaga-ℳ Fading

by
Konstantinos Yiannopoulos
*,
Nikos C. Sagias
and
Anthony C. Boucouvalas
Department of Informatics and Telecommunications, Faculty of Economy and Technology, University of the Peloponnese, Akadimaikou G. K. Vlachou Street, GR-221 31 Tripoli, Greece
*
Author to whom correspondence should be addressed.
Appl. Sci. 2020, 10(3), 1141; https://doi.org/10.3390/app10031141
Submission received: 9 January 2020 / Revised: 31 January 2020 / Accepted: 3 February 2020 / Published: 7 February 2020
(This article belongs to the Special Issue Applications of Semiconductor Optical Amplifiers II)

Abstract

:
We present analytical results on the average probability of error (PER) performance of an optically pre-amplified pulse-position modulation (PPM) receiver under Malaga- M fading. The results are in the form of a finite sum whose number of terms depends on the PPM modulation order and the noise modes of the amplifier, enabling the efficient calculation of the average PER. In addition, we utilized the presented analysis to evaluate the performance of a equal-gain-combining (EGC) diversity receiver that operates in conjunction with optical amplification and PPM. The results show that the utilization of diverse and relatively low PPM orders achieves a drastic reduction in the average PER.

1. Introduction

The transmission of optical beams through the atmosphere has attracted significant attention for the implementation of reliable, low-cost and high bandwidth links in applications where a semi-permanent optical wireless communication (OWCs) system is preferable to the deployment of optical fibers. This comes at the expense, however, of introducing additional transmission losses, such as geometric losses; atmospheric absorption and scattering; and scintillations in the received power, owed to the volatile nature of the atmosphere. These effects severely affect the power budget design of the OWC link, and several methods have been proposed to improve the system performance to acceptable levels, including coding [1,2,3], relaying [4,5,6,7], diversity reception [8,9,10,11,12], optical amplification [13,14] and combinations of the aforementioned methods.
Optical amplification is considered so as to lower the required receiver and partially alleviate the severity of fades [15,16,17,18]. An additional sensitivity improvement can be imparted by using an orthogonal modulation scheme such as pulse-position modulation (PPM) [19,20,21,22], which provides a trade-off between receiver sensitivity and bandwidth utilization. The combined effect of optical amplification and high-order PPM may be sufficient to compensate for the transmission losses and provide the required fade margin in weak fading; however, diversity reception needs to be introduced, as fading becomes more severe with the goal of averaging out the power scintillations. Previous works have addressed combinations of amplification, PPM and diversity in OWCs [13,23]; however, they mainly focus on binary PPM, which has been shown to be less effective than on-off-keying [24]. Higher-order PPM in a pre-amplified system received limited attention in [22,25], where upper limits on the system performance are presented. Moreover, previous works considered the well-known γ γ fading distribution [26], but no work has addressed more general fading distributions that have been proposed recently [27,28].
In this work, we consider for the first time, to our knowledge, the impact of generalized Malaga- M fading on the performance of an optically pre-amplified PPM receiver. To this end, we first express the PPM probability of error (PER) as a finite sum over the modulation order and the amplification noise modes. The sum is computationally efficient and enables the derivation of a similar finite sum for the average PER in Malaga- M fading. The system with a single receiver was studied analytically in weak, moderate and strong fading, and it was shown that the modulation order has a significant impact in the weak fading regime, but additional reception branches are required in moderated and strong fading. Diversity reception is also studied analytically in this work, and we demonstrate that it significantly improves the average PER despite the additional noise that is introduced from using multiple amplifiers.
In comparison with our previous works that focused on numerical integration rather than analytical investigation, the efficiency of the current analytical approach allows for (a) the study of generalized fading and (b) the assessment of receivers with wide optical filters. In both cases, the numerical approach proves time consuming and limits the analysis to relatively simple fading distributions ( γ γ , negative exponential) and narrow-band receivers that are not always desirable [21]. Moreover, the current approach does not require knowledge of the combined signal fading statistics at the equal-gain-combining (EGC) output, which can be challenging to derive and is not currently available for Malaga- M fading. Instead, it provides exact results for the multi-receiver from the fading distribution of a single branch.

2. Optically Pre-Amplified PPM Receiver

We considered a pre-amplified OWC receiver, as shown in Figure 1. The optical signal is collected by an aperture and amplified optically in a semiconductor optical amplifier (SOA) or an Erbium doped fiber amplifier (EDFA). It should be noted that both amplifier types are applicable in OWCs, each with their own merits. EDFAs typically provide a higher gain and add less noise than SOAs, and therefore require a reduced optical power at their input, but SOAs are more compact, compatible with integration, which is important in diversity reception considered later, and one may utilize their regenerative capabilities to partially alleviate fading [15,16,17]. For the rest of our analysis, we do not differentiate between the two amplifier types and we consider them as components that provide a gain equal to G and introduce a noise signal with a spectral density of N 0 = n s p h f ( G 1 ) , where h f is the photon energy and n s p is the spontaneous emission factor of the amplifier.
The amplified PPM signal is optically filtered to reject out of band noise and is converted to a photo-current using a PIN photodiode. Each PPM symbol is transmitted over Q time-slots and one of the slots contains the total symbol energy E s . In order to identify the slot that contains the optical energy, the photo-current is integrated over the slot duration. The integrator output is then driven to a soft-decision PPM demodulator, where the slot with the highest signal value is identified as the energy-containing slot, and the corresponding symbol is selected as the most probable transmission.

3. PPM Probability of Error

Following previous works [24,25], the electrical signal that arrives at the PPM demodulator follows a central χ 2 distribution with M degrees of freedom
p 0 x ; M = x M 1 ( M 1 ) ! e x ,
during empty slots, and a non-central χ 2 distribution
p 1 x ; M , λ = e x + λ x λ M 1 2 I M 1 2 x λ ,
during the slot that carries the symbol energy. In the last equation I n ( · ) denotes the modified Bessel function of the first kind ([29], Equation (8.445)), λ = E s / N 0 = E b / N 0 log 2 Q and E b is the optical energy per bit at the amplifier output.
A symbol is decoded incorrectly if the signal in one or more empty slots is higher than the signal in the energy slot, and the symbol error probability (SEP) equals ([30], Equation (1.1))
S E P = 1 0 v = 0 x p 0 v ; M d v Q 1 p 1 x ; M , λ d x .
We use the relation ([29], Equation (8.352/6))
v = 0 x p 0 v ; M d v = 1 e x i = 0 M 1 x i i !
and the SEP becomes
S E P = 1 0 1 e x i = 0 M 1 x i i ! Q 1 p 1 x ; M , λ d x = q = 1 Q 1 Q 1 q ( 1 ) q + 1 0 e q x i = 0 M 1 x i i ! q p 1 x ; M , λ d x .
We now expand the inner sum
i = 0 M 1 x i i ! q = n = 0 q ( M 1 ) b n q x n ,
where the b n q coefficients are calculated from the recursive relation
b n q = μ = 0 min { n , M 1 } b n μ q 1 μ ! .
The SEP is then given by
S E P = q = 1 Q 1 Q 1 q ( 1 ) q + 1 n = 0 q ( M 1 ) b n q 0 e q x x n p 1 x ; M , λ d x
and the appearing integral is evaluated from the n-th derivative of the Laplace transform of the non-central χ 2 distribution ([24], Equation (2))
P 1 s ; M , λ = exp ( s λ 1 + s ) ( 1 + s ) M .
Using the generating function for the Laguerre polynomials L a b · ([29], Equation (8.975/1)) and the multiplication theorem ([31], Equation (8)), we find that
d n d s n exp ( s λ 1 + s ) ( 1 + s ) M = ( 1 ) n n ! m = n m n ( 1 ) m n L m M 1 λ s m n = ( 1 ) n n ! exp s λ 1 + s ( 1 + s ) n + M L n M 1 λ 1 + s
and as a result
0 e q x x n p 1 x ; M , λ d x = n ! exp q λ 1 + q ( 1 + q ) n + M L n M 1 λ 1 + q .
A finite sum expression for the SEP is now given by
S E P = q = 1 Q 1 Q 1 q ( 1 ) q + 1 n = 0 q ( M 1 ) b n q n ! exp q λ 1 + q ( 1 + q ) n + M L n M 1 λ 1 + q .
For a more stable numerical calculation we define c n q = n ! b n q , where the new coefficients obey the recursive relation
c n q = n ! μ = 0 min { n , M 1 } c n μ q 1 ( n μ ) ! μ ! = μ = 0 min { n , M 1 } n μ c n μ q 1 .
We also expand the Laguerre polynomials as ([29], Equation (8.970/1))
L n M 1 λ 1 + q = i = 0 n ( n + M 1 ) ! ( i + M 1 ) ! ( n i ) ! i ! λ 1 + q i
to find that the PPM PER is calculated as
P e = Q 2 ( Q 1 ) S E P = Q 2 ( Q 1 ) q = 1 Q 1 Q 1 q ( 1 ) q + 1 exp q λ 1 + q n = 0 q ( M 1 ) c n q ( 1 + q ) n + M × i = 0 n ( n + M 1 ) ! ( i + M 1 ) ! ( n i ) ! i ! λ 1 + q i .
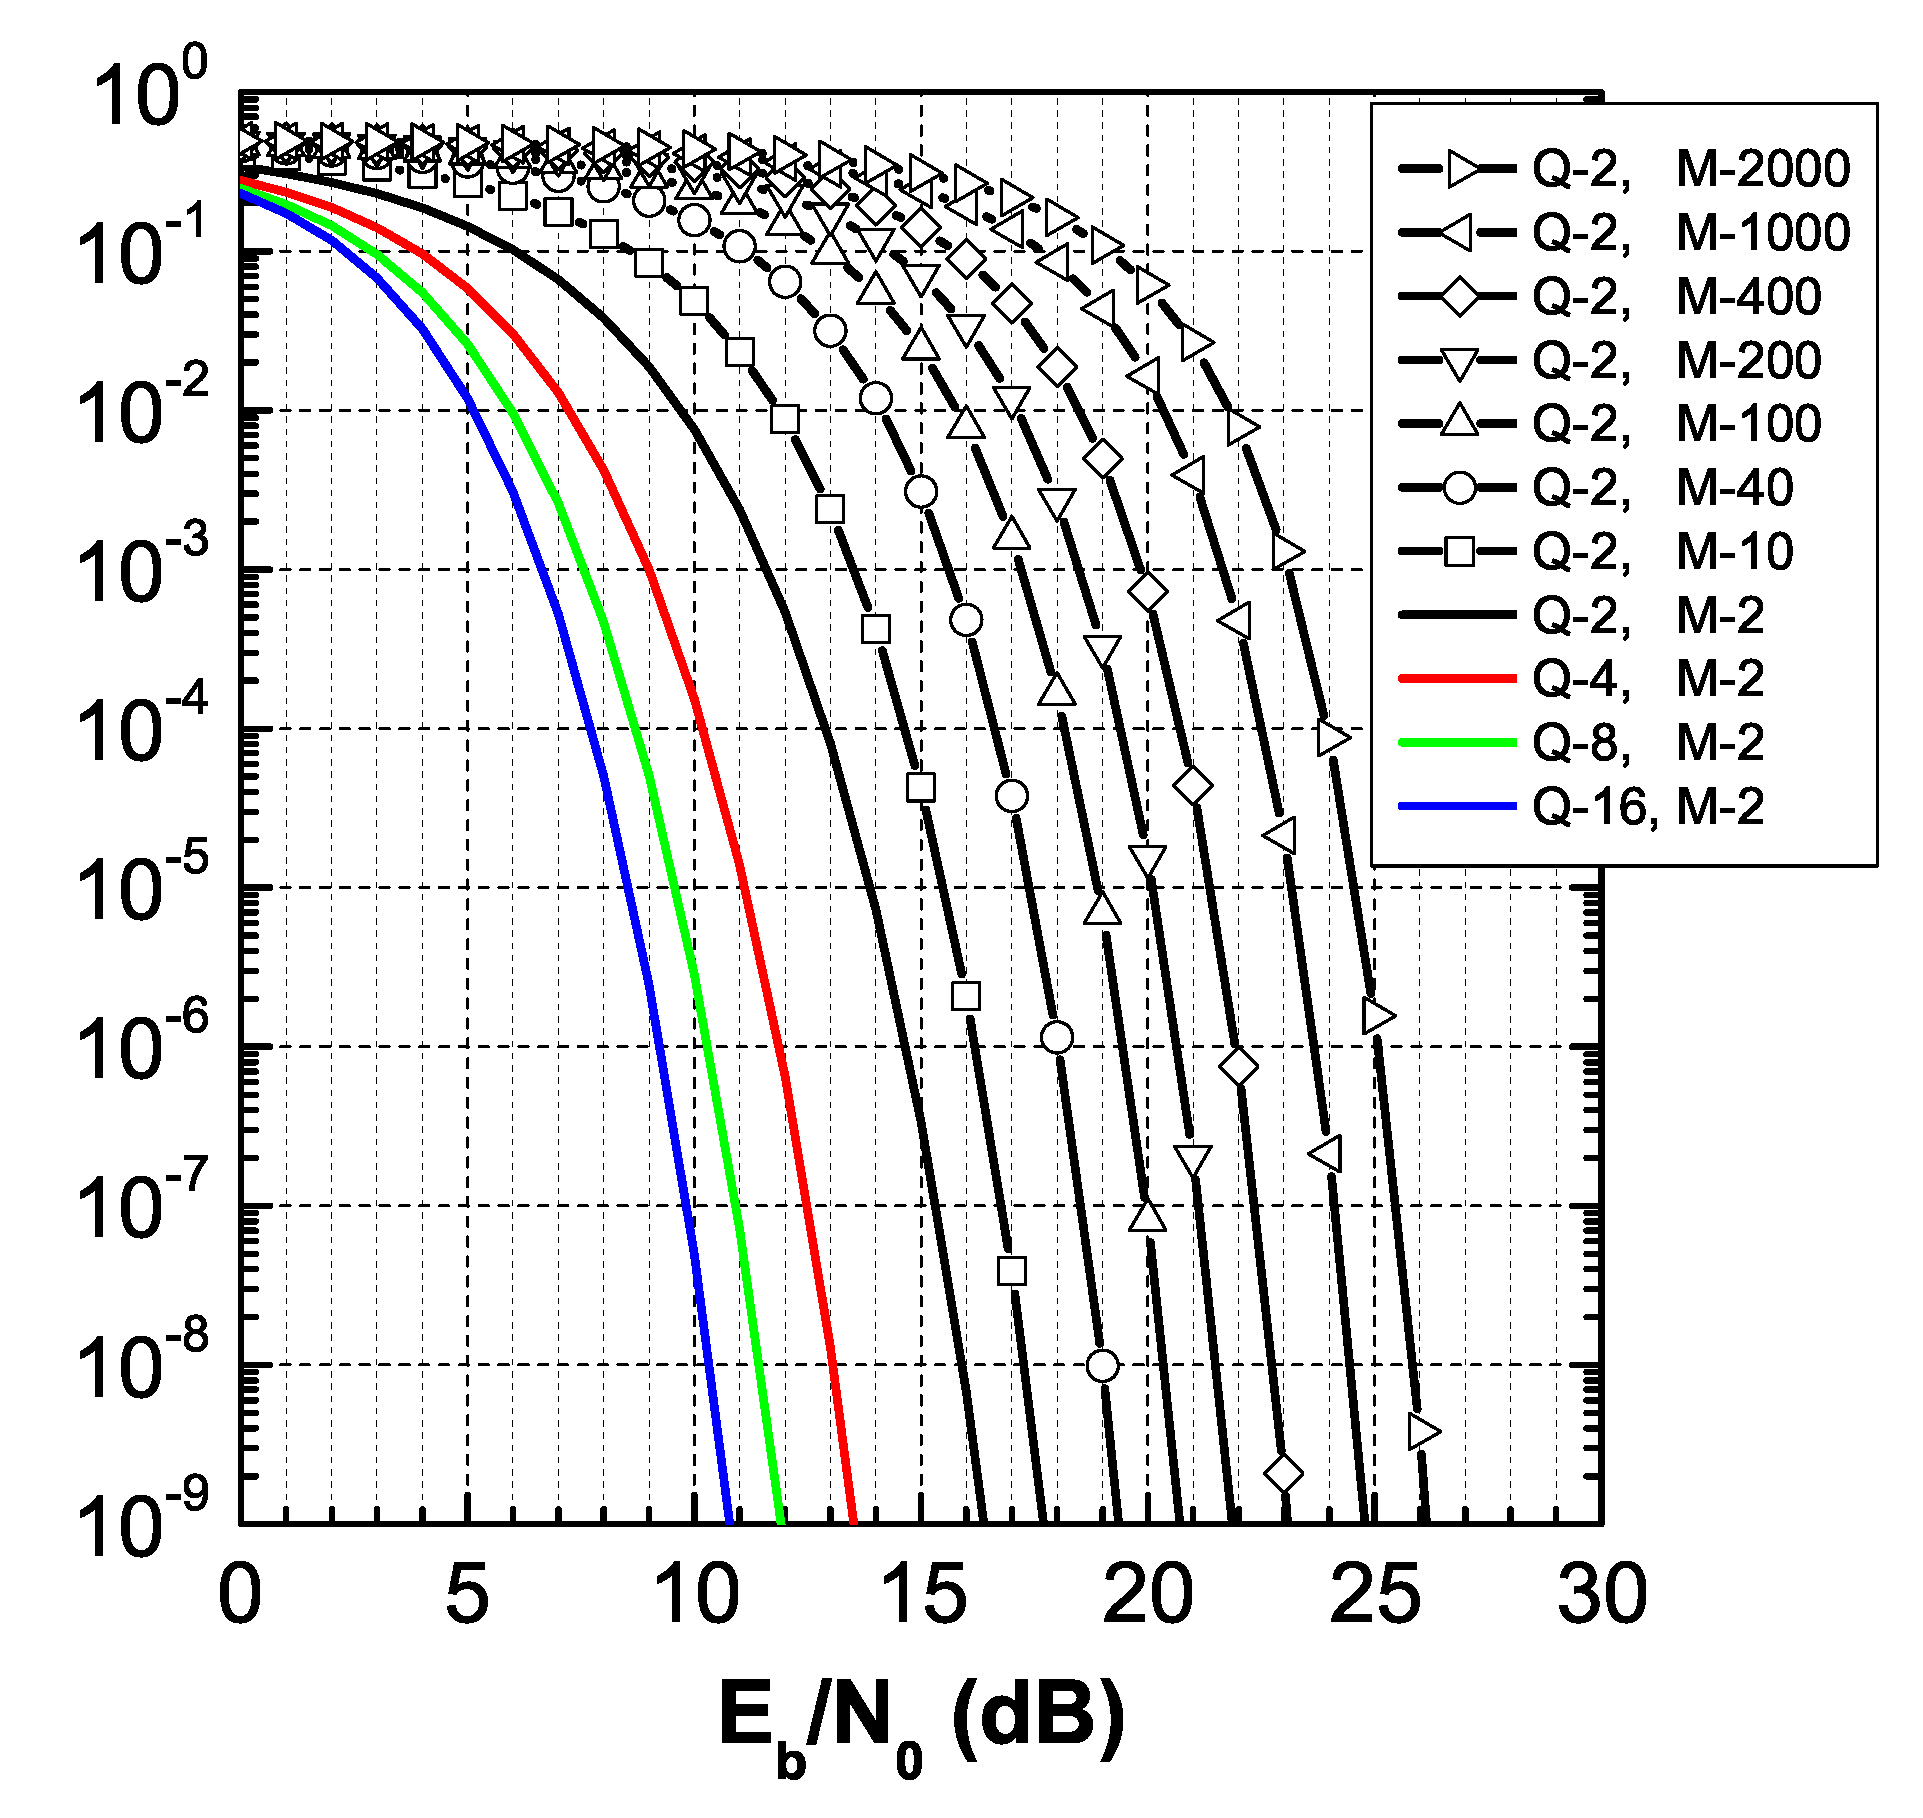
The PPM PER is plotted in Figure 2 for modulation orders Q 2 , 4 , 8 , 16 and up to M 2000 noise modes. As it is expected, the system performance improves with the modulation order and worsens when additional optical noise is introduced at the receiver. For the rest of our results, we limit the discussion to M 2 and M 200 noise modes, although similar results can be obtained for any number of modes. The M 2 case corresponds to a system with a narrow optical filter whose bandwidth matches the PPM slot rate, while the M 200 case corresponds to a system with a broad optical filter similar to the one discussed in [21].

4. Average PER in Malaga- M Fading

We now consider transmission over an OWC link with turbulence. In this environment, the received energy fluctuates as λ h with h denoting the channel state. The average PER is found by integrating Equation (15) over the fading distribution, and we find that
P e ¯ = Q 2 ( Q 1 ) q = 1 Q 1 Q 1 q ( 1 ) q + 1 n = 0 q ( M 1 ) c n q ( 1 + q ) n + M i = 0 n ( n + M 1 ) ! ( i + M 1 ) ! ( n i ) ! i ! × λ 1 + q i 0 h i exp q λ 1 + q h f h ( h ) d h .
The appearing integrals may be evaluated from mathematical tables or the derivatives of the Laplace transform of the fading, distribution at s = q 1 + q λ . In Malaga- M fading h is a normalized random variable (RV) distributed as [27]
f h ( h ) = A j = 1 β a j m α + j 2 h α + j 2 1 K α j 2 α β m γ β + Ω h ,
where K v · stands for the modified Bessel function of the second kind ([29], Equation (8.407)). The model parameters are calculated from the following equations [27]
Ω = Ω + 2 ρ b 0 + 2 2 ρ b 0 Ω cos ϕ A ϕ B , γ = 2 ( 1 ρ ) b 0 , m = γ + Ω , A = 2 α α 2 γ 1 + α 2 Γ ( α ) γ β γ β + Ω β + α 2 , a j = β 1 j 1 1 ( j 1 ) ! Ω γ j 1 α β j 2 γ β + Ω 1 j 2 ,
and α , β , Ω , b 0 , ρ , ϕ A , ϕ B are also described in [27].
The integrals in Equation (16) are evaluated using ([29], Equation (6.631/3)) and ([32], Equation (13.1.33)), and we find that
I = 0 h i + α + j 2 1 exp q λ 1 + q h K α j 2 α β m γ β + Ω h d h = 1 2 b α j m α j 2 z q α + i Γ ( i + α ) Γ ( i + j ) Ψ i + α , 1 j + α ; b 2 m z q .
In the last equation Ψ · , · ; · denotes the Tricomi confluent hypergeometric function ([29], Equation (9.210/2)), and we have introduced b = α β γ β + Ω and z q = q 1 + q λ . The PER now becomes
P e ¯ = Q 2 ( Q 1 ) q = 1 Q 1 Q 1 q ( 1 ) q + 1 n = 0 q ( M 1 ) c n q ( 1 + q ) n + M i = 0 n n + M 1 i + M 1 1 q i × A 2 b m z q α Γ ( i + α ) i ! j = 1 β a j Γ ( i + j ) b j Ψ i + α , 1 j + α ; b 2 m z q .
Re-arranging the order of summation, we find that
P e ¯ = Q 2 ( Q 1 ) q = 1 Q 1 Q 1 q ( 1 ) q + 1 n = 0 q ( M 1 ) i = n q ( M 1 ) i + M 1 n + M 1 c i q ( 1 + q ) i + M 1 q n × A 2 b m z q α Γ ( n + α ) n ! j = 1 β a j Γ ( n + j ) b j Ψ n + α , 1 j + α ; b 2 m z q ,
which is less challenging to evaluate, especially for increasing numbers of noise modes, since the summation over n does not require all appearing terms and one may avoid extensive evaluations of the Tricomi function.
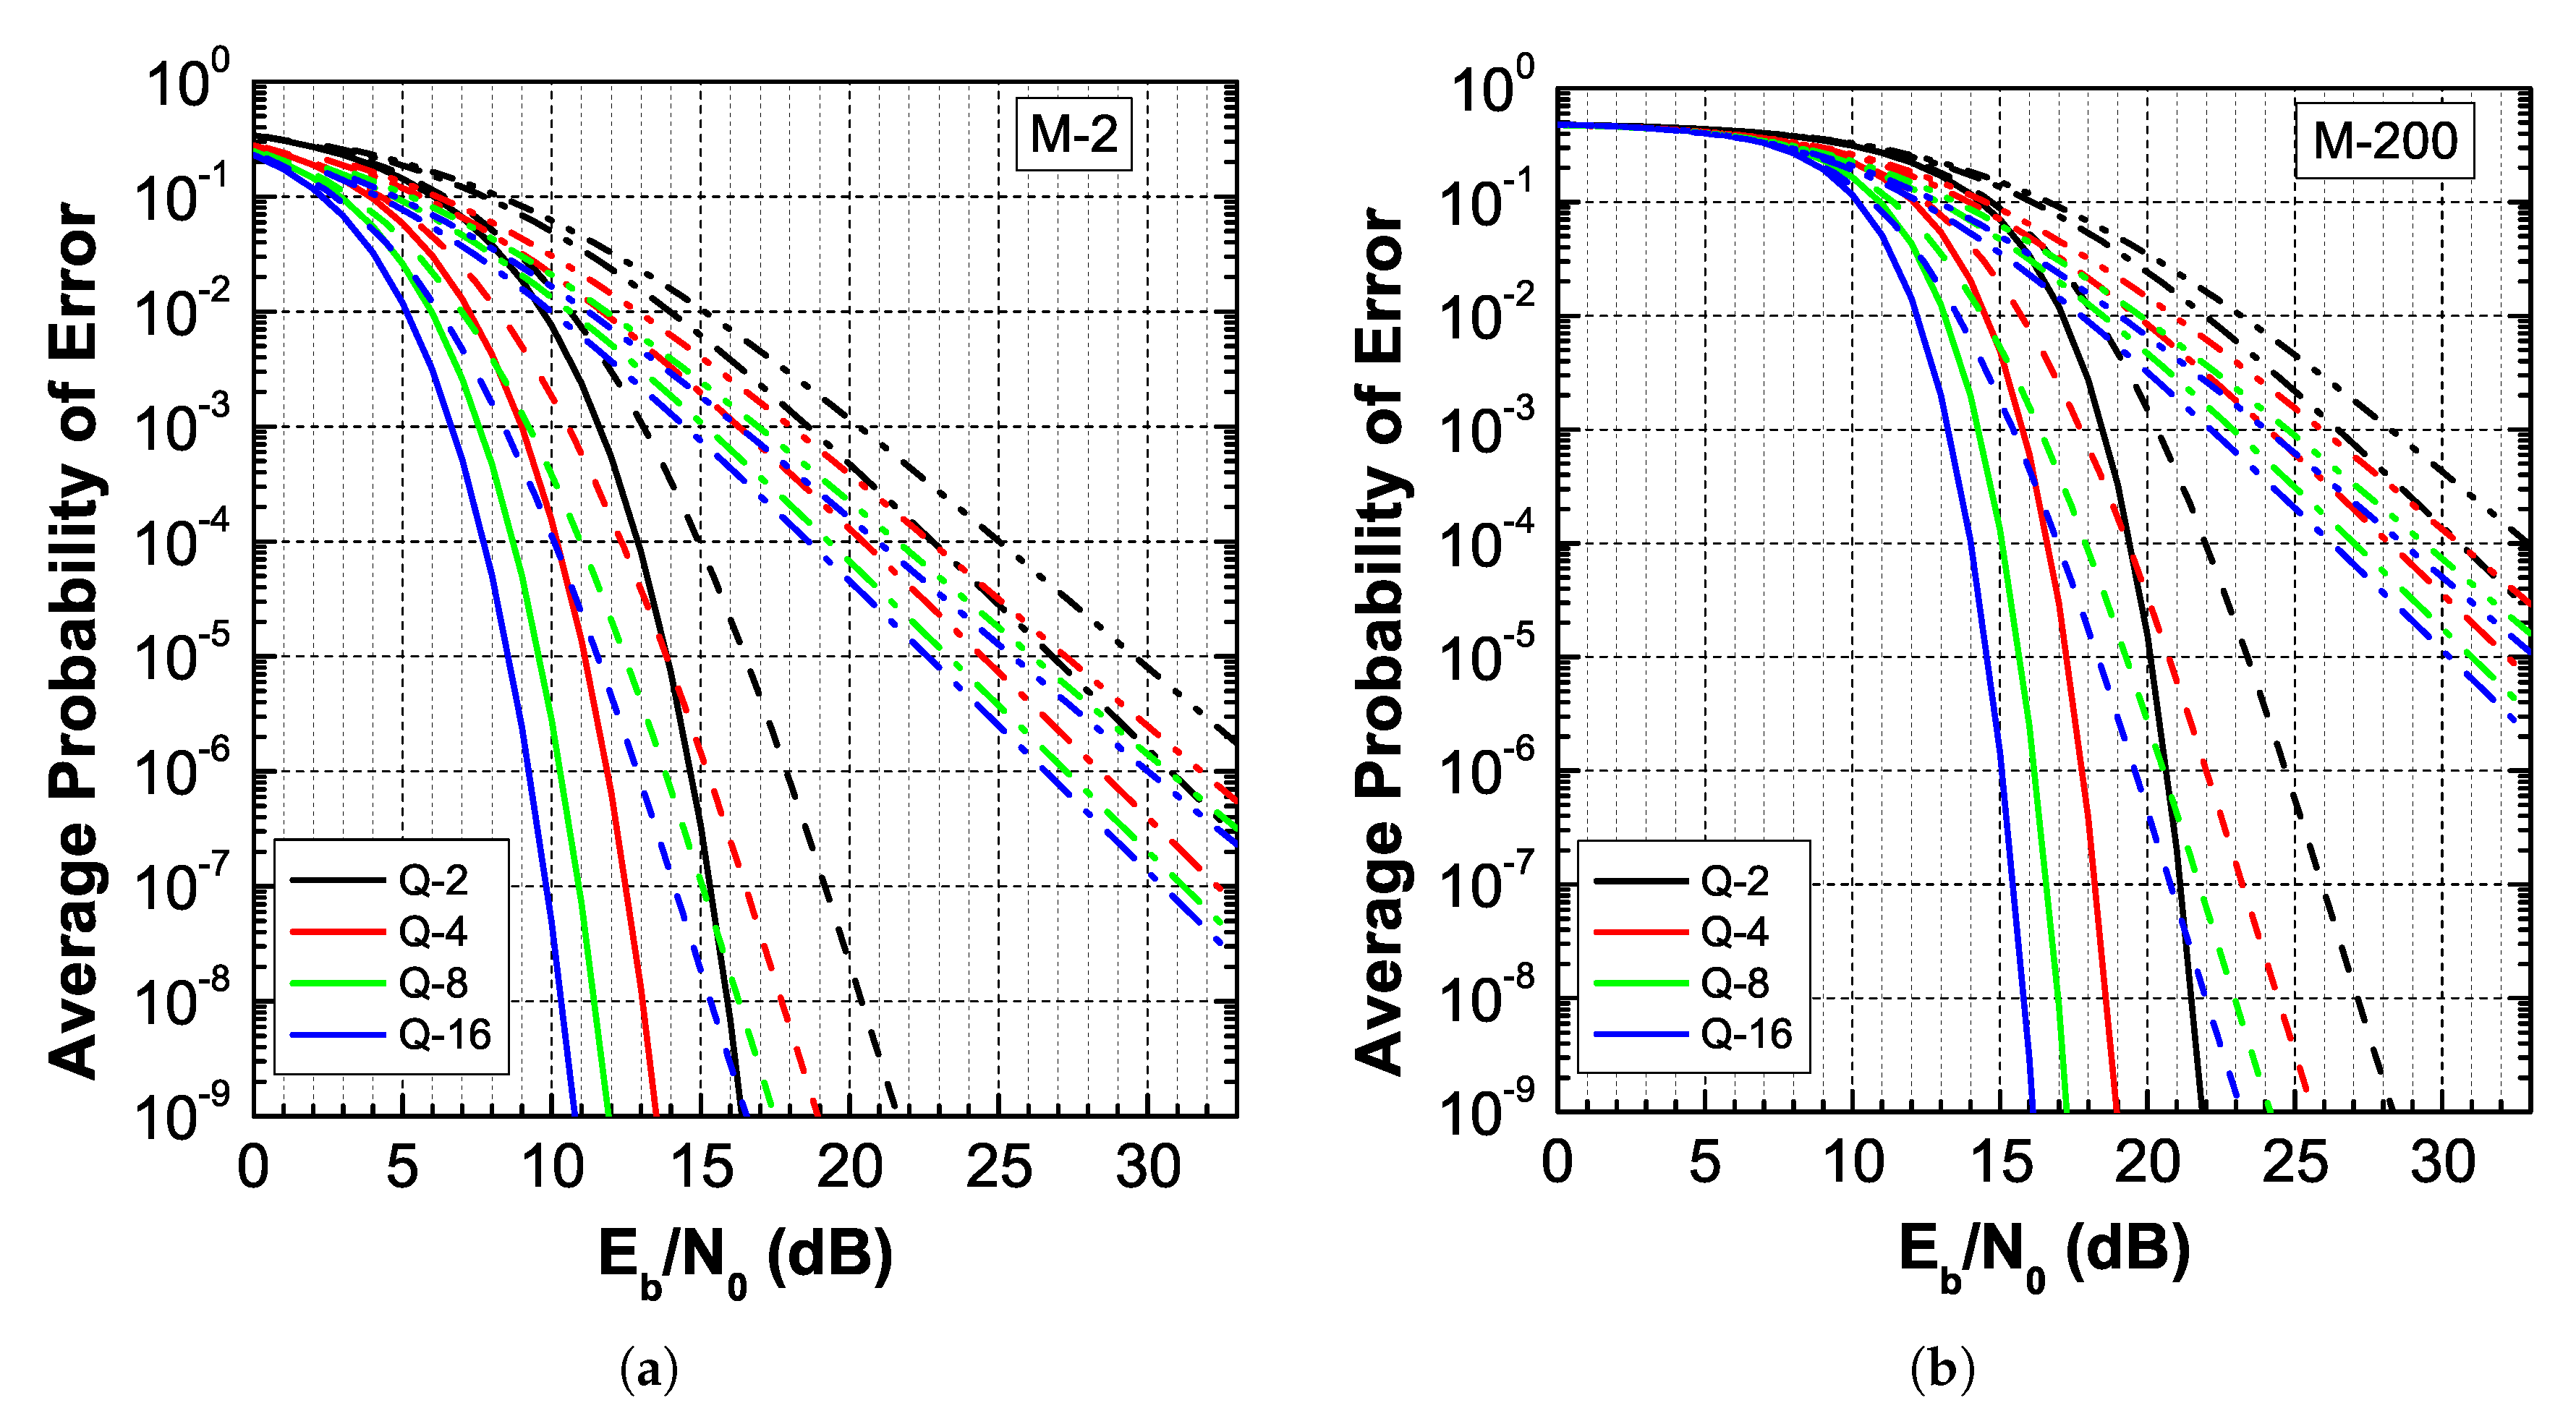
The performance of the pre-amplified system under Malaga- M fading is presented in Figure 3 for weak, medium and strong turbulence. The distribution parameters are taken from [27] and are summarized in Table 1. For comparison purposes, we also include the PER performance in a transmission without fading. The figure shows that an increase in the PPM modulation order significantly improves the average PER in weak fading, but the relative energy gain that is obtained by doubling the order over Q = 16 amounts to less than 1 dB. Moreover, if the fading becomes more intense (moderate or strong), then the average probability is not reduced by a significant amount and very high modulation orders will be required. This may not be an option due to bandwidth and safety constraints, and one may need to explore alternatives like diversity reception so as to smooth out fading.

5. Diversity Reception in Malaga- M Fading

In diversity reception, L pre-amplified receiving branches are utilized and their outputs are added in an EGC to produce the total signal prior to soft-decision decoding. To simplify our analysis, we assume that the amplifiers are identical and that perfect synchronization is achieved among the branches, despite the fact that the spatial separation of apertures introduces delay. In a practical system, the spatial coherence length of the atmospheric channel only measures a few centimetres, and it follows that the apertures only need to be separated by a few centimetres to achieve uncorrelated reception. This results in a relative delay among branches of several picoseconds, which will only impact the system’s performance for comparable PPM slot durations that reach the bandwidth limits of the receiver electronics.
It follows from the previous discussion that the received signals are independent and identically distributed χ 2 RVs, while their instantaneous (within a single PPM symbol) values equal λ L h , with h denoting the channel state for the corresponding receiver. It is also assumed that the transmitted symbol energy is reduced as factor of L so that the total received optical energy at the combiner remains equal to λ (on average) and independent of the diversity order L. Given that the sum of independent and identically distributed χ 2 RVs is also a χ 2 RV with N = L M degrees of freedom and λ e g c = λ L = 1 L h , the instantaneous PER is calculated as
P e = Q 2 ( Q 1 ) q = 1 Q 1 Q 1 q ( 1 ) q + 1 exp q 1 + q λ L = 1 L h n = 0 q ( N 1 ) c n q ( 1 + q ) n + N × i = 0 n ( n + N 1 ) ! ( i + N 1 ) ! ( n i ) ! i ! λ L = 1 L h 1 + q i = Q 2 ( Q 1 ) q = 1 Q 1 Q 1 q ( 1 ) q + 1 n = 0 q ( N 1 ) c n q ( 1 + q ) n + N i = 0 n n + N 1 i + N 1 λ L 1 + q i × i 1 + + i L = i = 1 L h i i ! exp q 1 + q λ L h .
The average probability now equals
P e ¯ = Q 2 ( Q 1 ) q = 1 Q 1 Q 1 q ( 1 ) q + 1 n = 0 q ( N 1 ) c n q ( 1 + q ) n + N i = 0 n n + N 1 i + N 1 λ L 1 + q i × i 1 + + i L = i = 1 L 1 i ! h = 0 h i exp q 1 + q λ L h f h ( h ) d h ,
and using Equation (19) we find that
P e ¯ = Q 2 ( Q 1 ) q = 1 Q 1 Q 1 q ( 1 ) q + 1 n = 0 q ( N 1 ) c n q ( 1 + q ) n + N i = 0 n n + N 1 i + N 1 1 q i × i 1 + + i L = i = 1 L A 2 b m z q α Γ ( i + α ) i ! j = 1 β a j Γ ( i + j ) b j Ψ i + α , 1 j + α ; b 2 m z q ,
where z q = q 1 + q λ L .
Despite the apparent complexity of the last equation, the appearing terms are calculated recursively using the theory of extended binomial coefficients. We define the weighting function
w ( s ) = A 2 b m z q α Γ ( s + α ) s ! j = 1 β a j Γ ( s + j ) b j Ψ s + α , 1 j + α ; b 2 m z q ,
and the average PER becomes
P e ¯ = Q 2 ( Q 1 ) q = 1 Q 1 Q 1 q ( 1 ) q + 1 n = 0 q ( N 1 ) c n q ( 1 + q ) n + N i = 0 n n + N 1 i + N 1 1 q i × i 1 + + i L = i w ( i 1 ) w ( i L ) = Q 2 ( Q 1 ) q = 1 Q 1 Q 1 q ( 1 ) q + 1 n = 0 q ( N 1 ) c n q ( 1 + q ) n + N i = 0 n n + N 1 i + N 1 1 q i L i w = Q 2 ( Q 1 ) q = 1 Q 1 Q 1 q ( 1 ) q + 1 n = 0 q ( N 1 ) i = n q ( N 1 ) i + N 1 n + N 1 c i q ( 1 + q ) i + N 1 q n L n w
where L n w stands for the extended binomial coefficient and is calculated using the recursion formula ([33], Equation (4))
L n w = s = 0 n w ( s ) L 1 n s w , 0 n w = δ n .
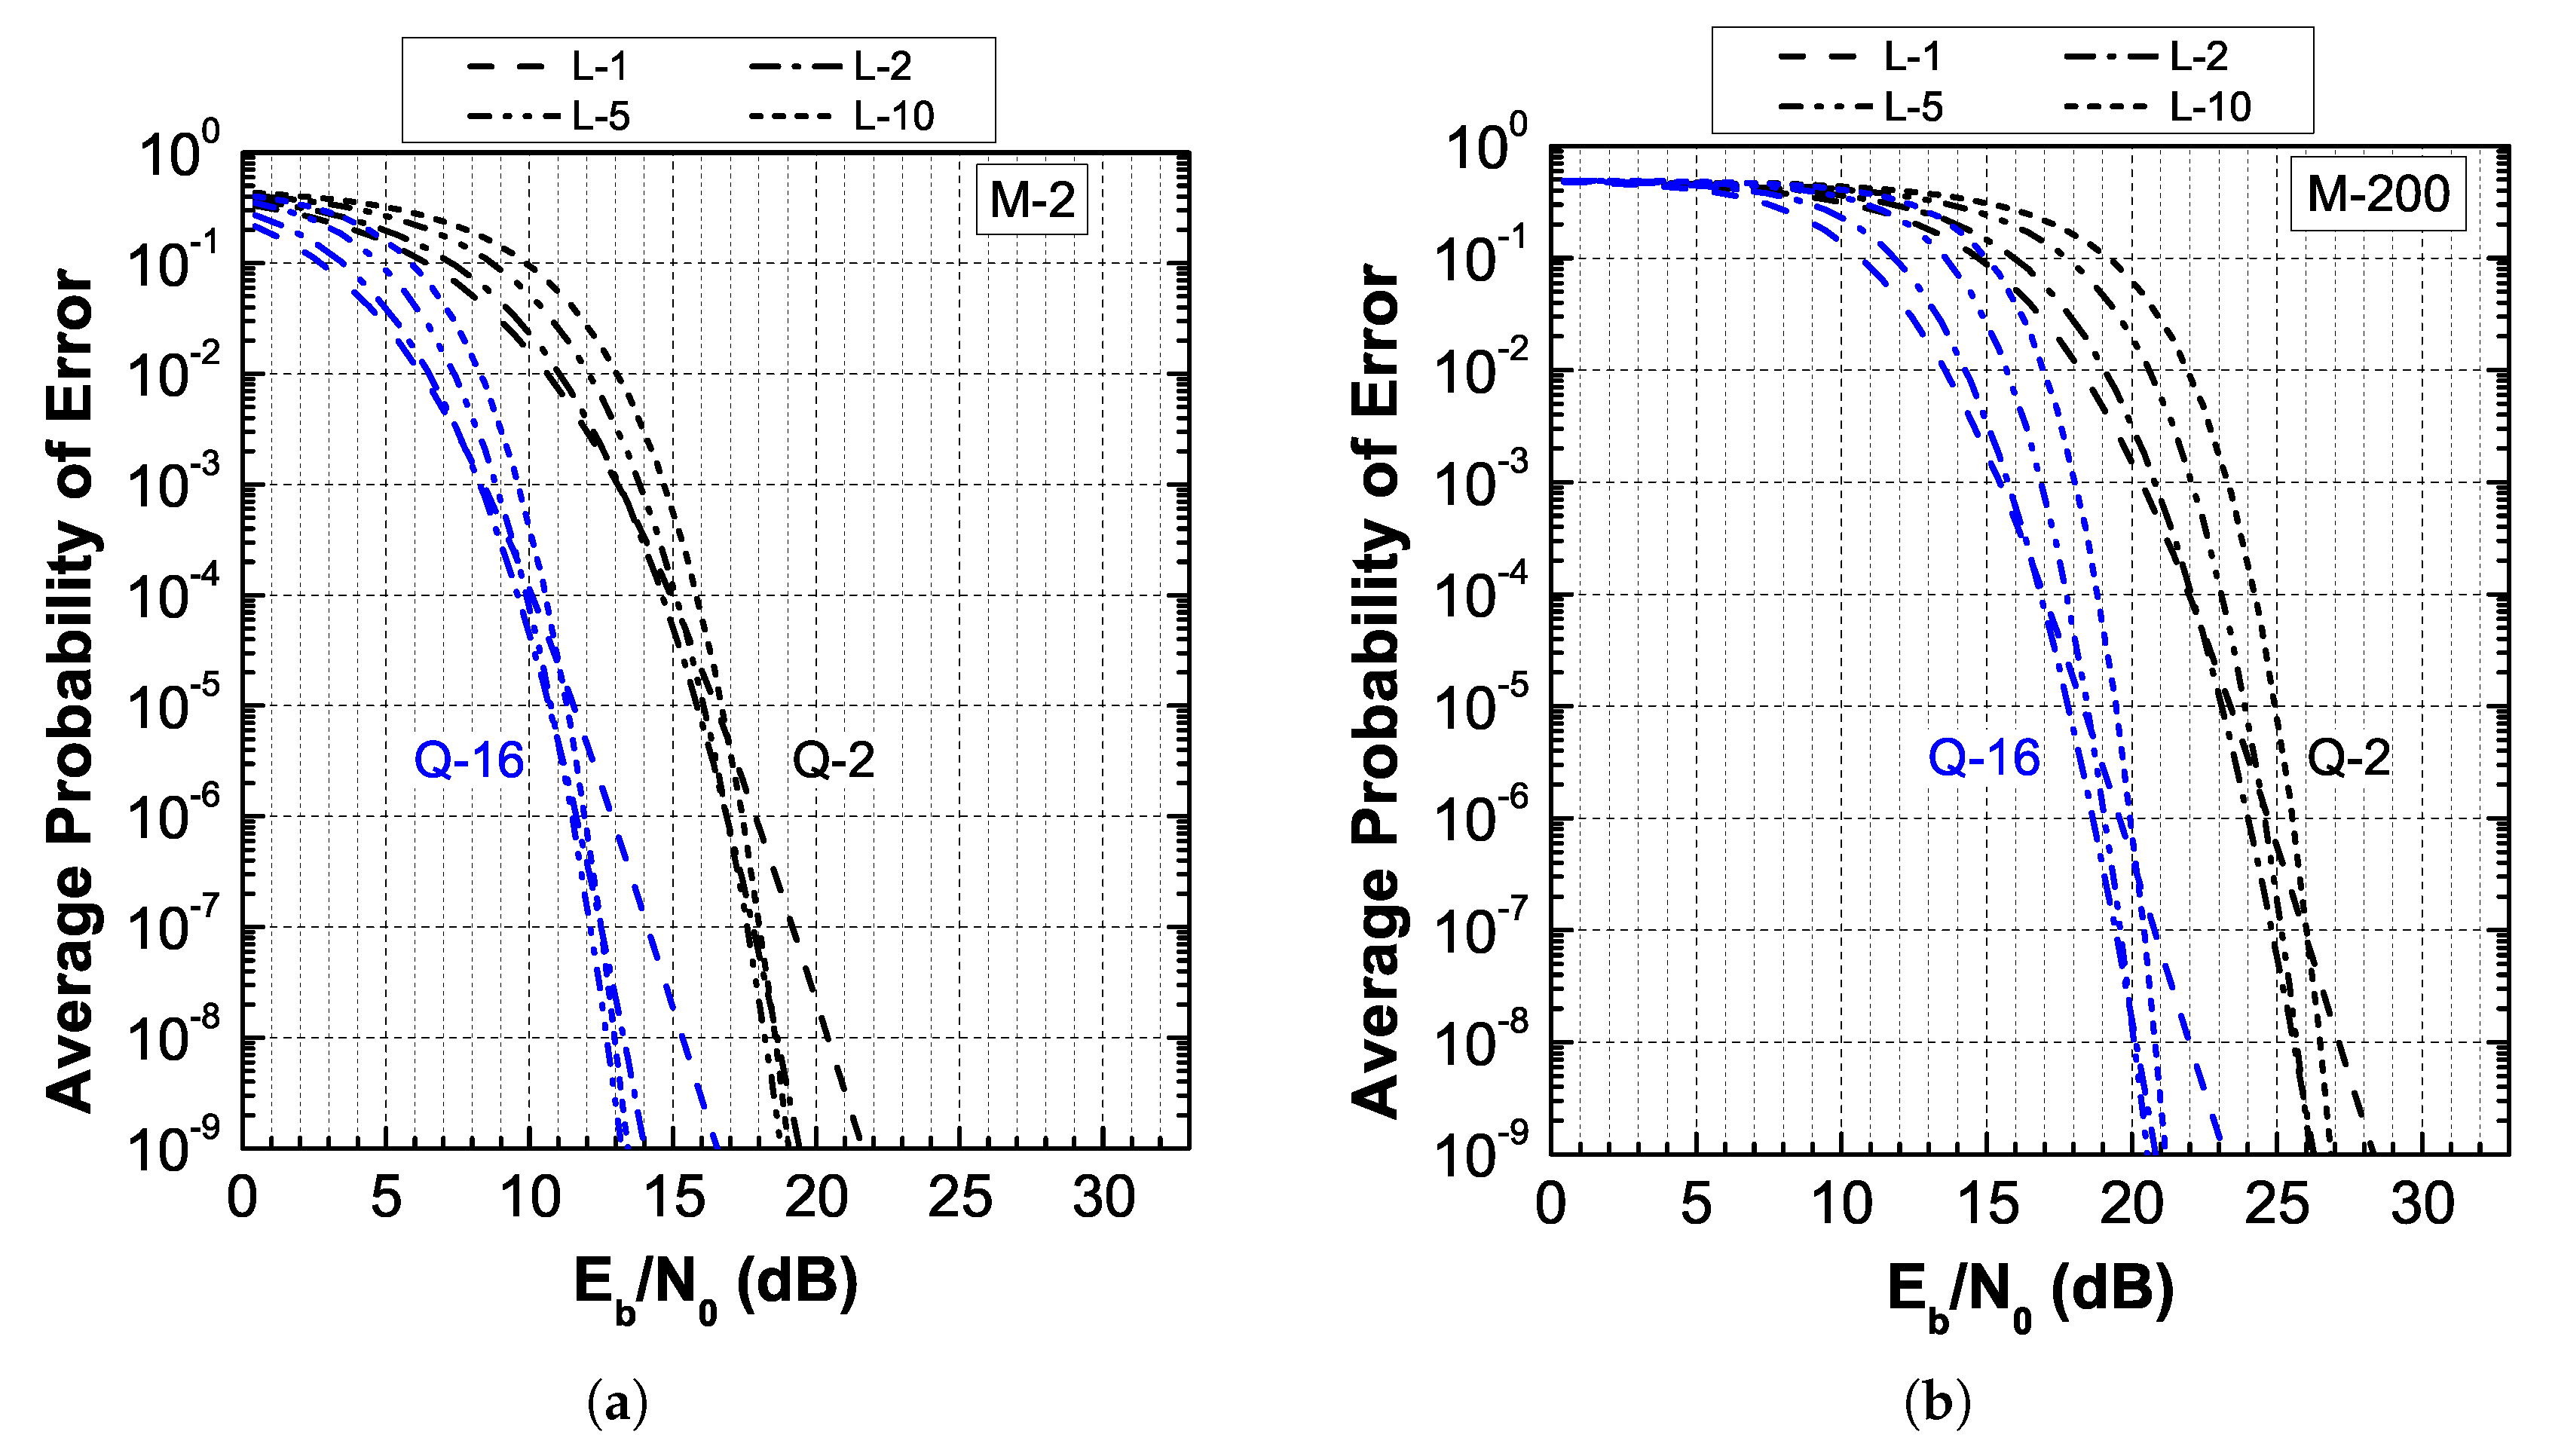
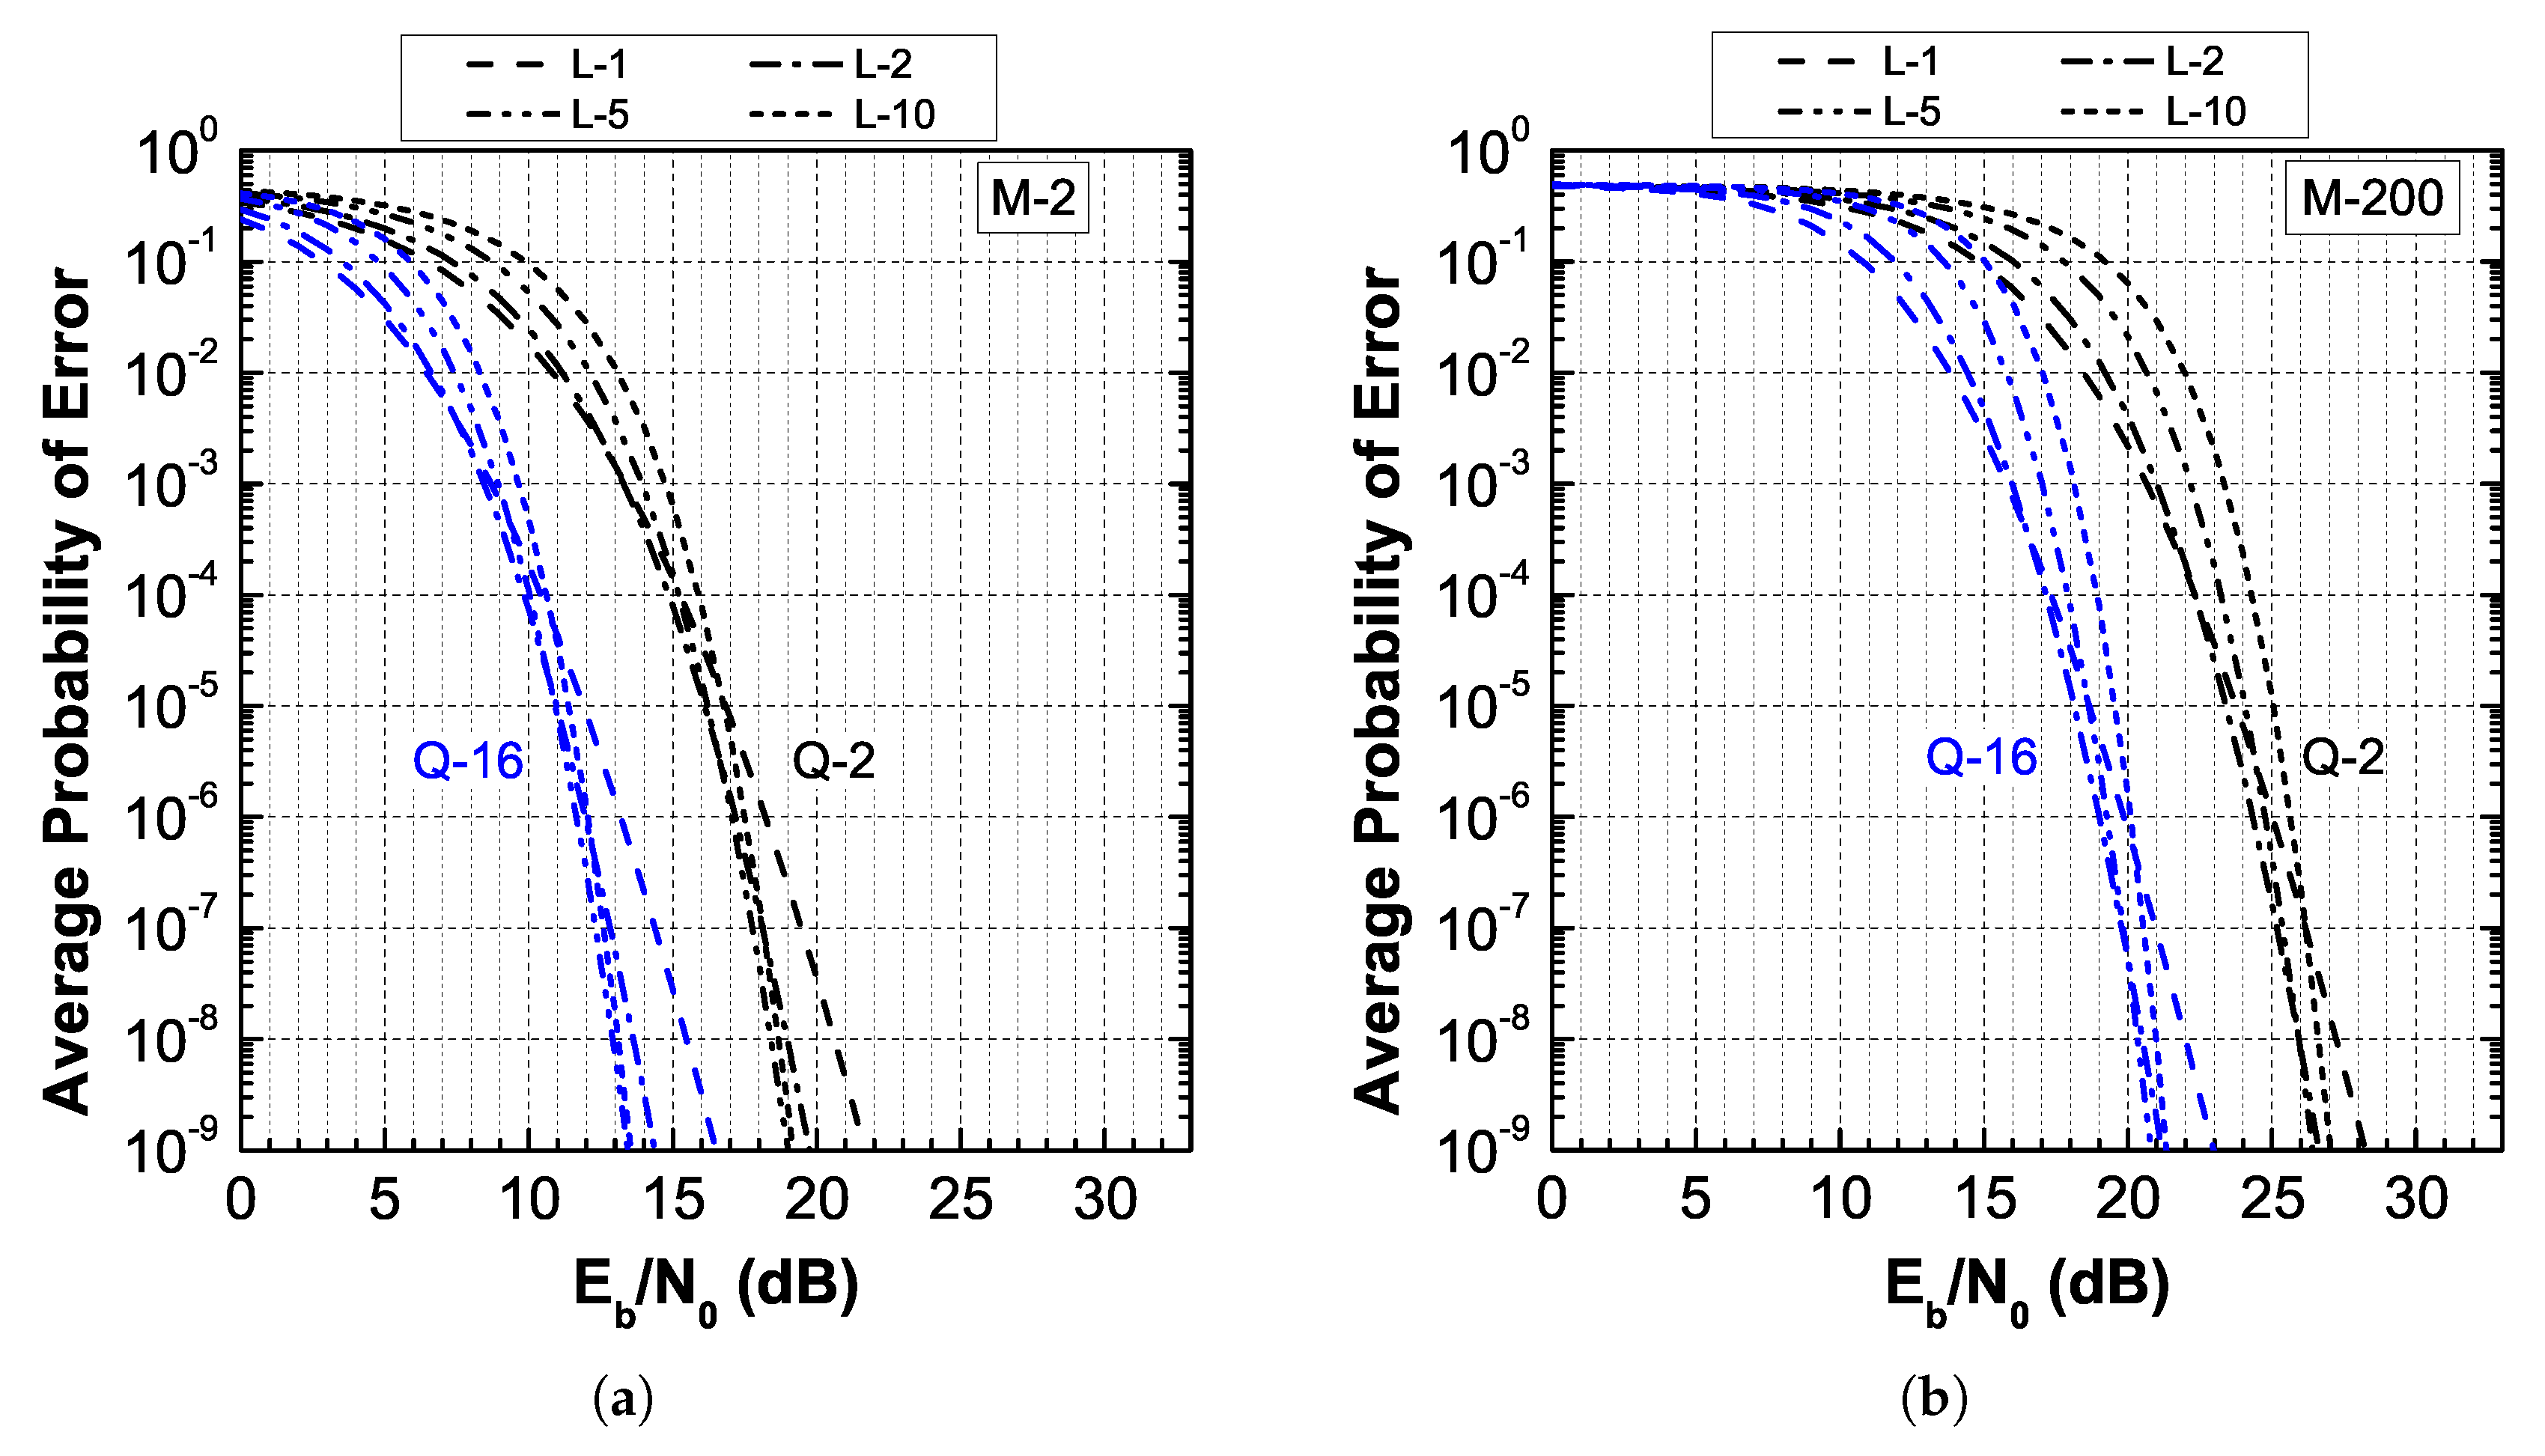
Equation (26) is plotted in Figure 4 for weak fading and an increasing number of diversity branches. The figure shows that diversity may not always improve the average PER in weak fading, and that the most significant improvement is introduced with the second branch. Any further increase in the number of diversity branches may actually have little to no effect, since the fading intensity is already limited and additional noise from the amplifiers is added, especially if a large number of noise modes are allowed in the receiver. The modulation order, on the other hand, has a more pronounced effect, and it can be seen that the 16-PPM system significantly outperforms its binary counterpart in all diversity setups.
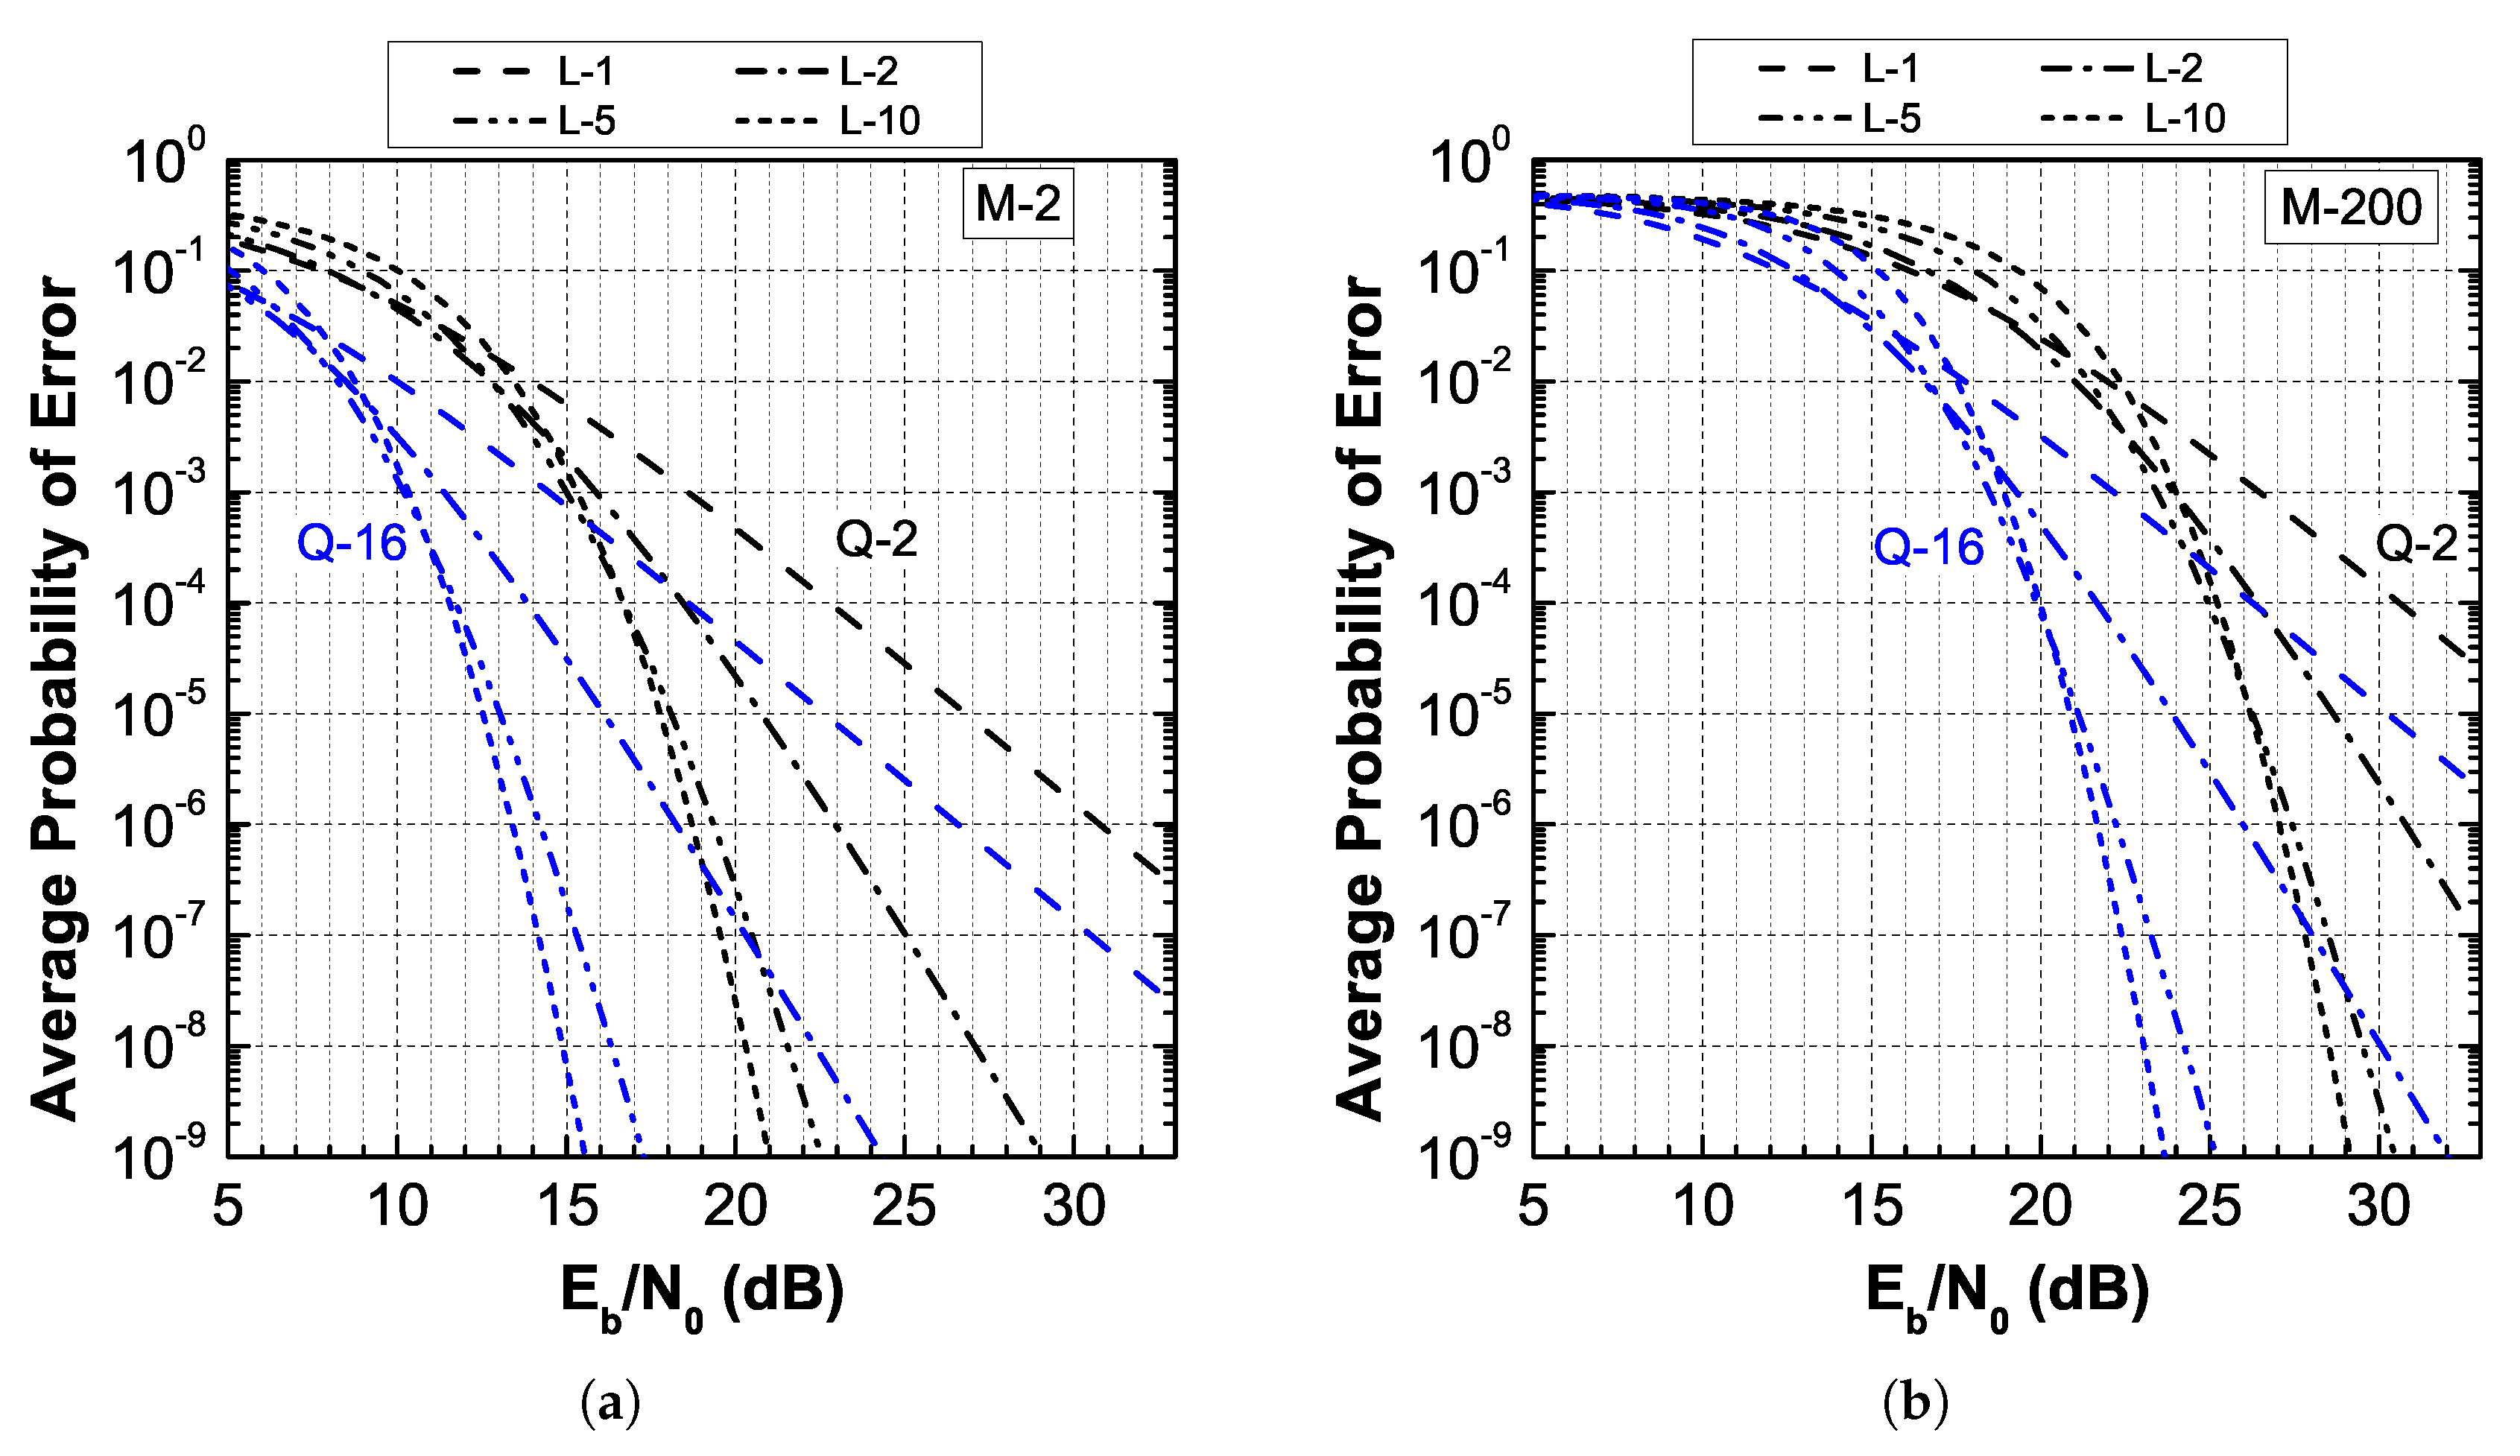
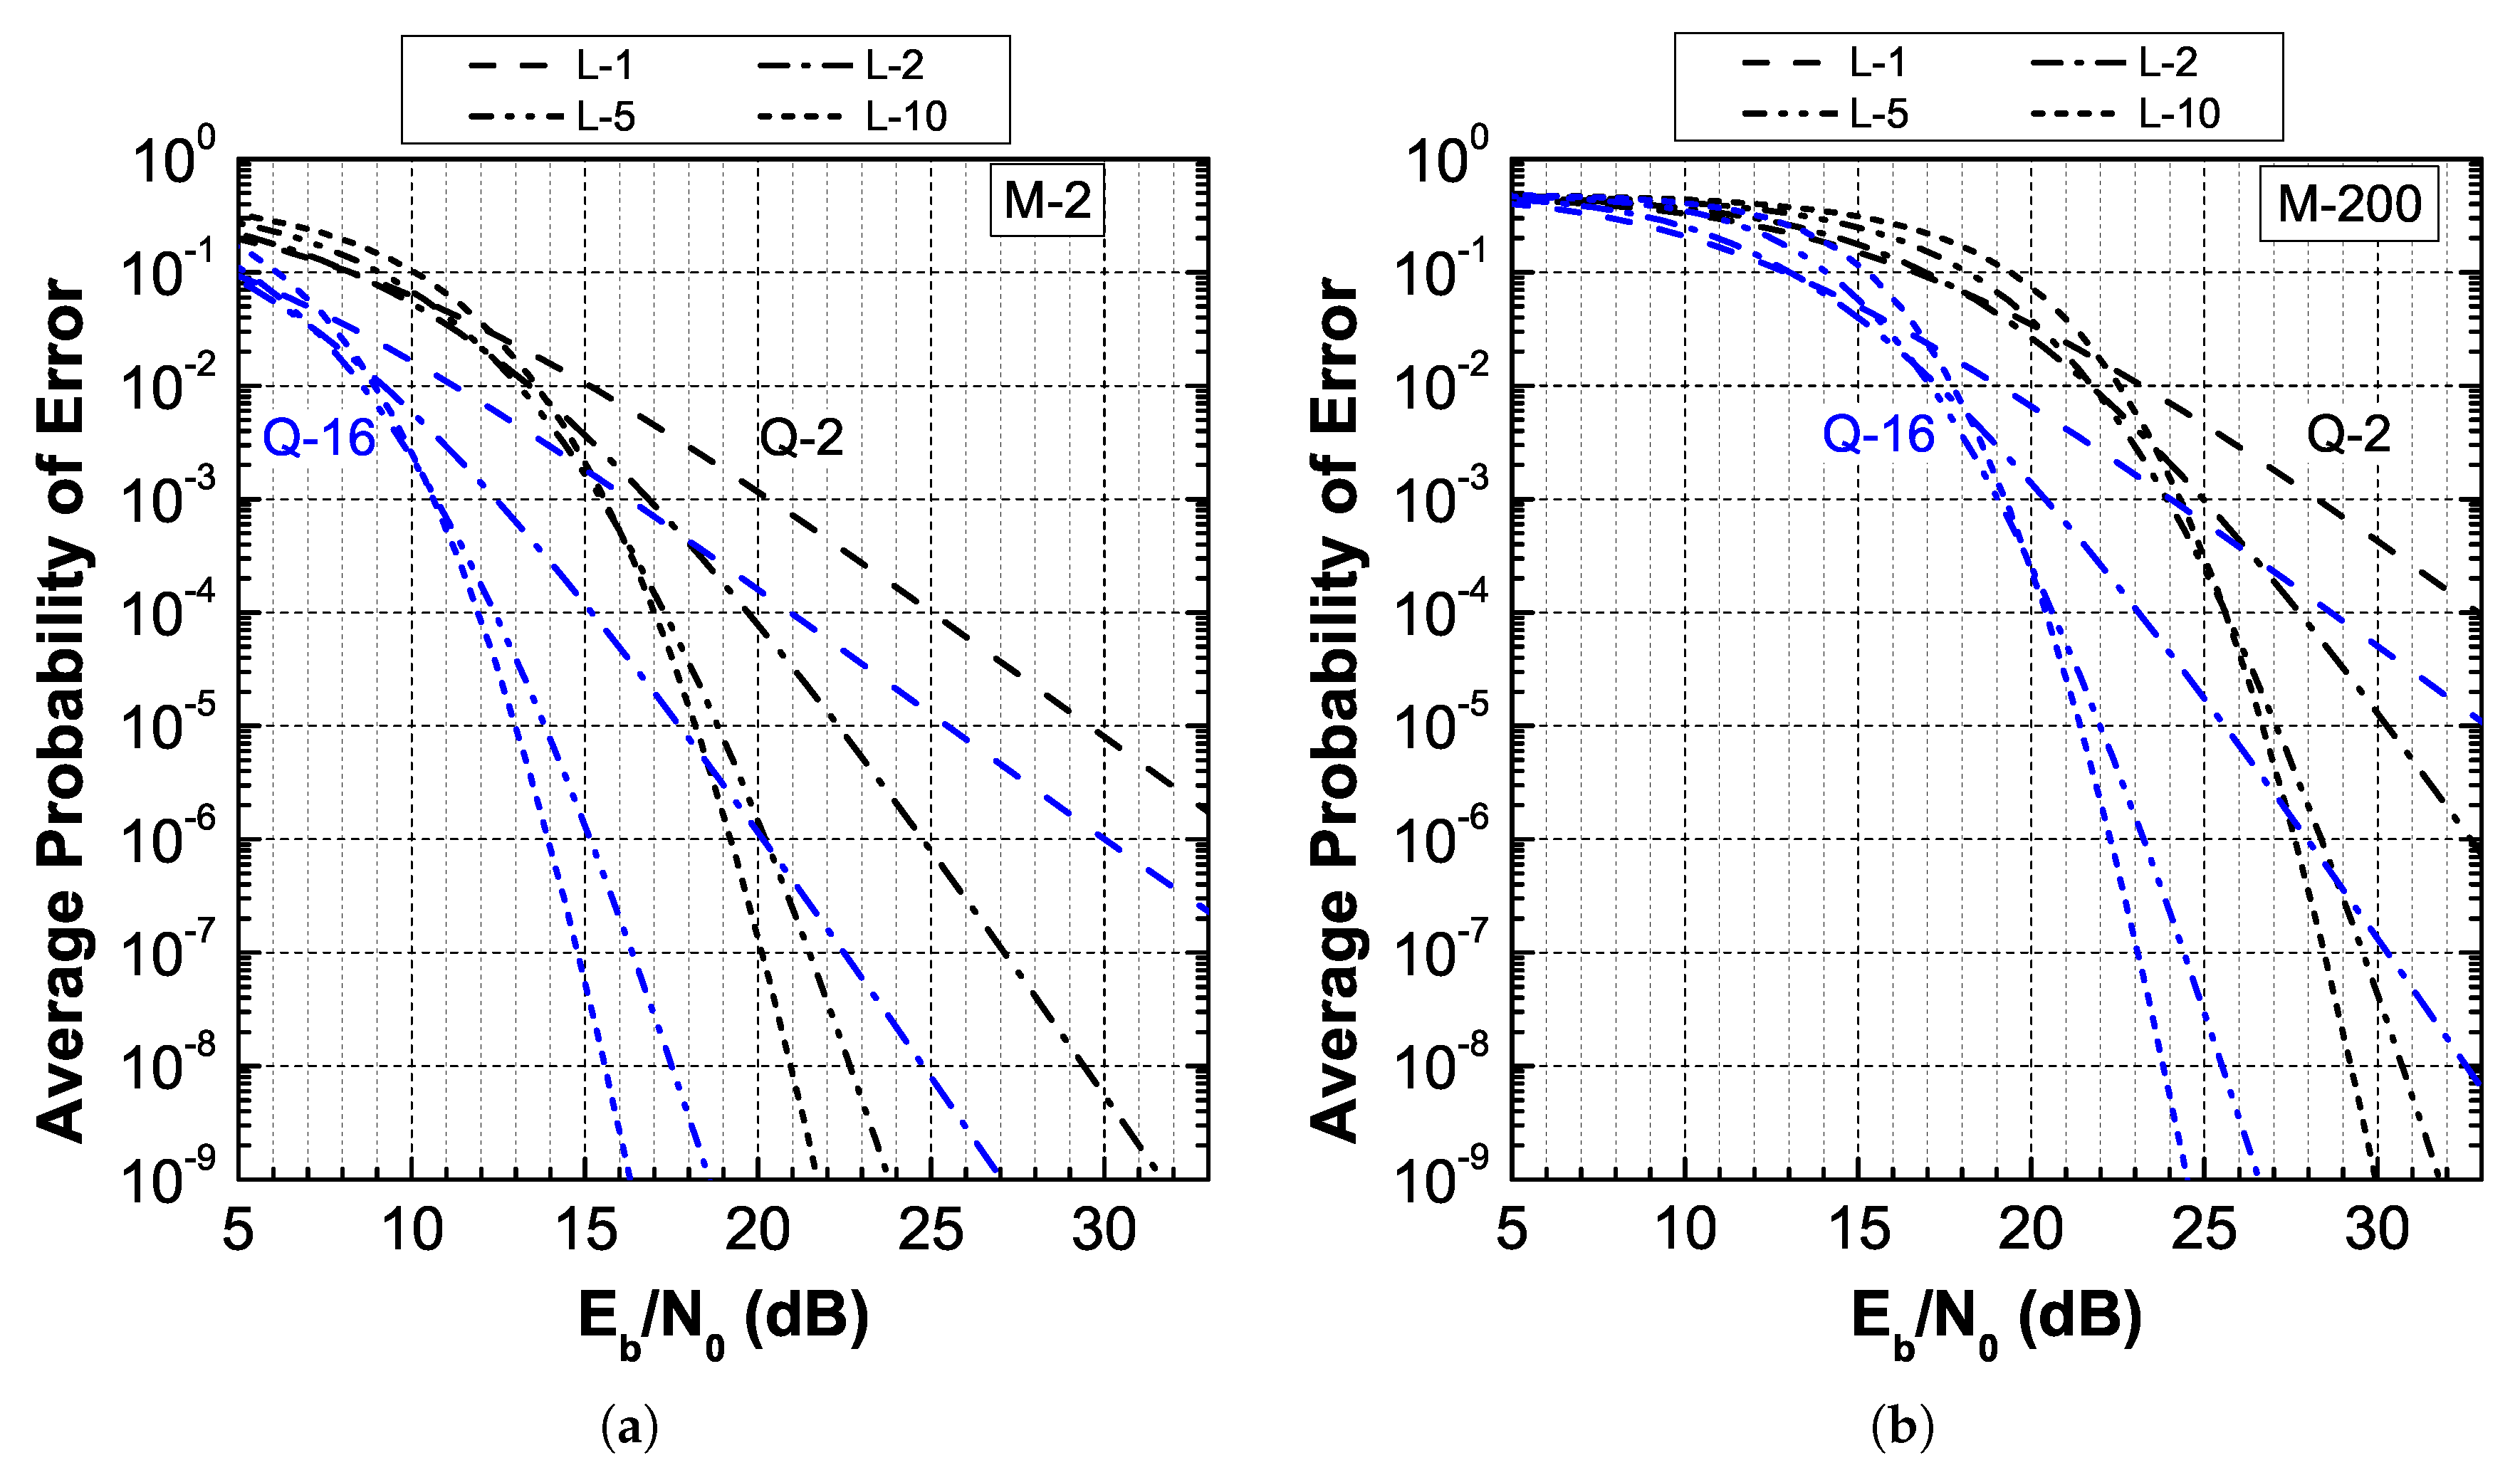
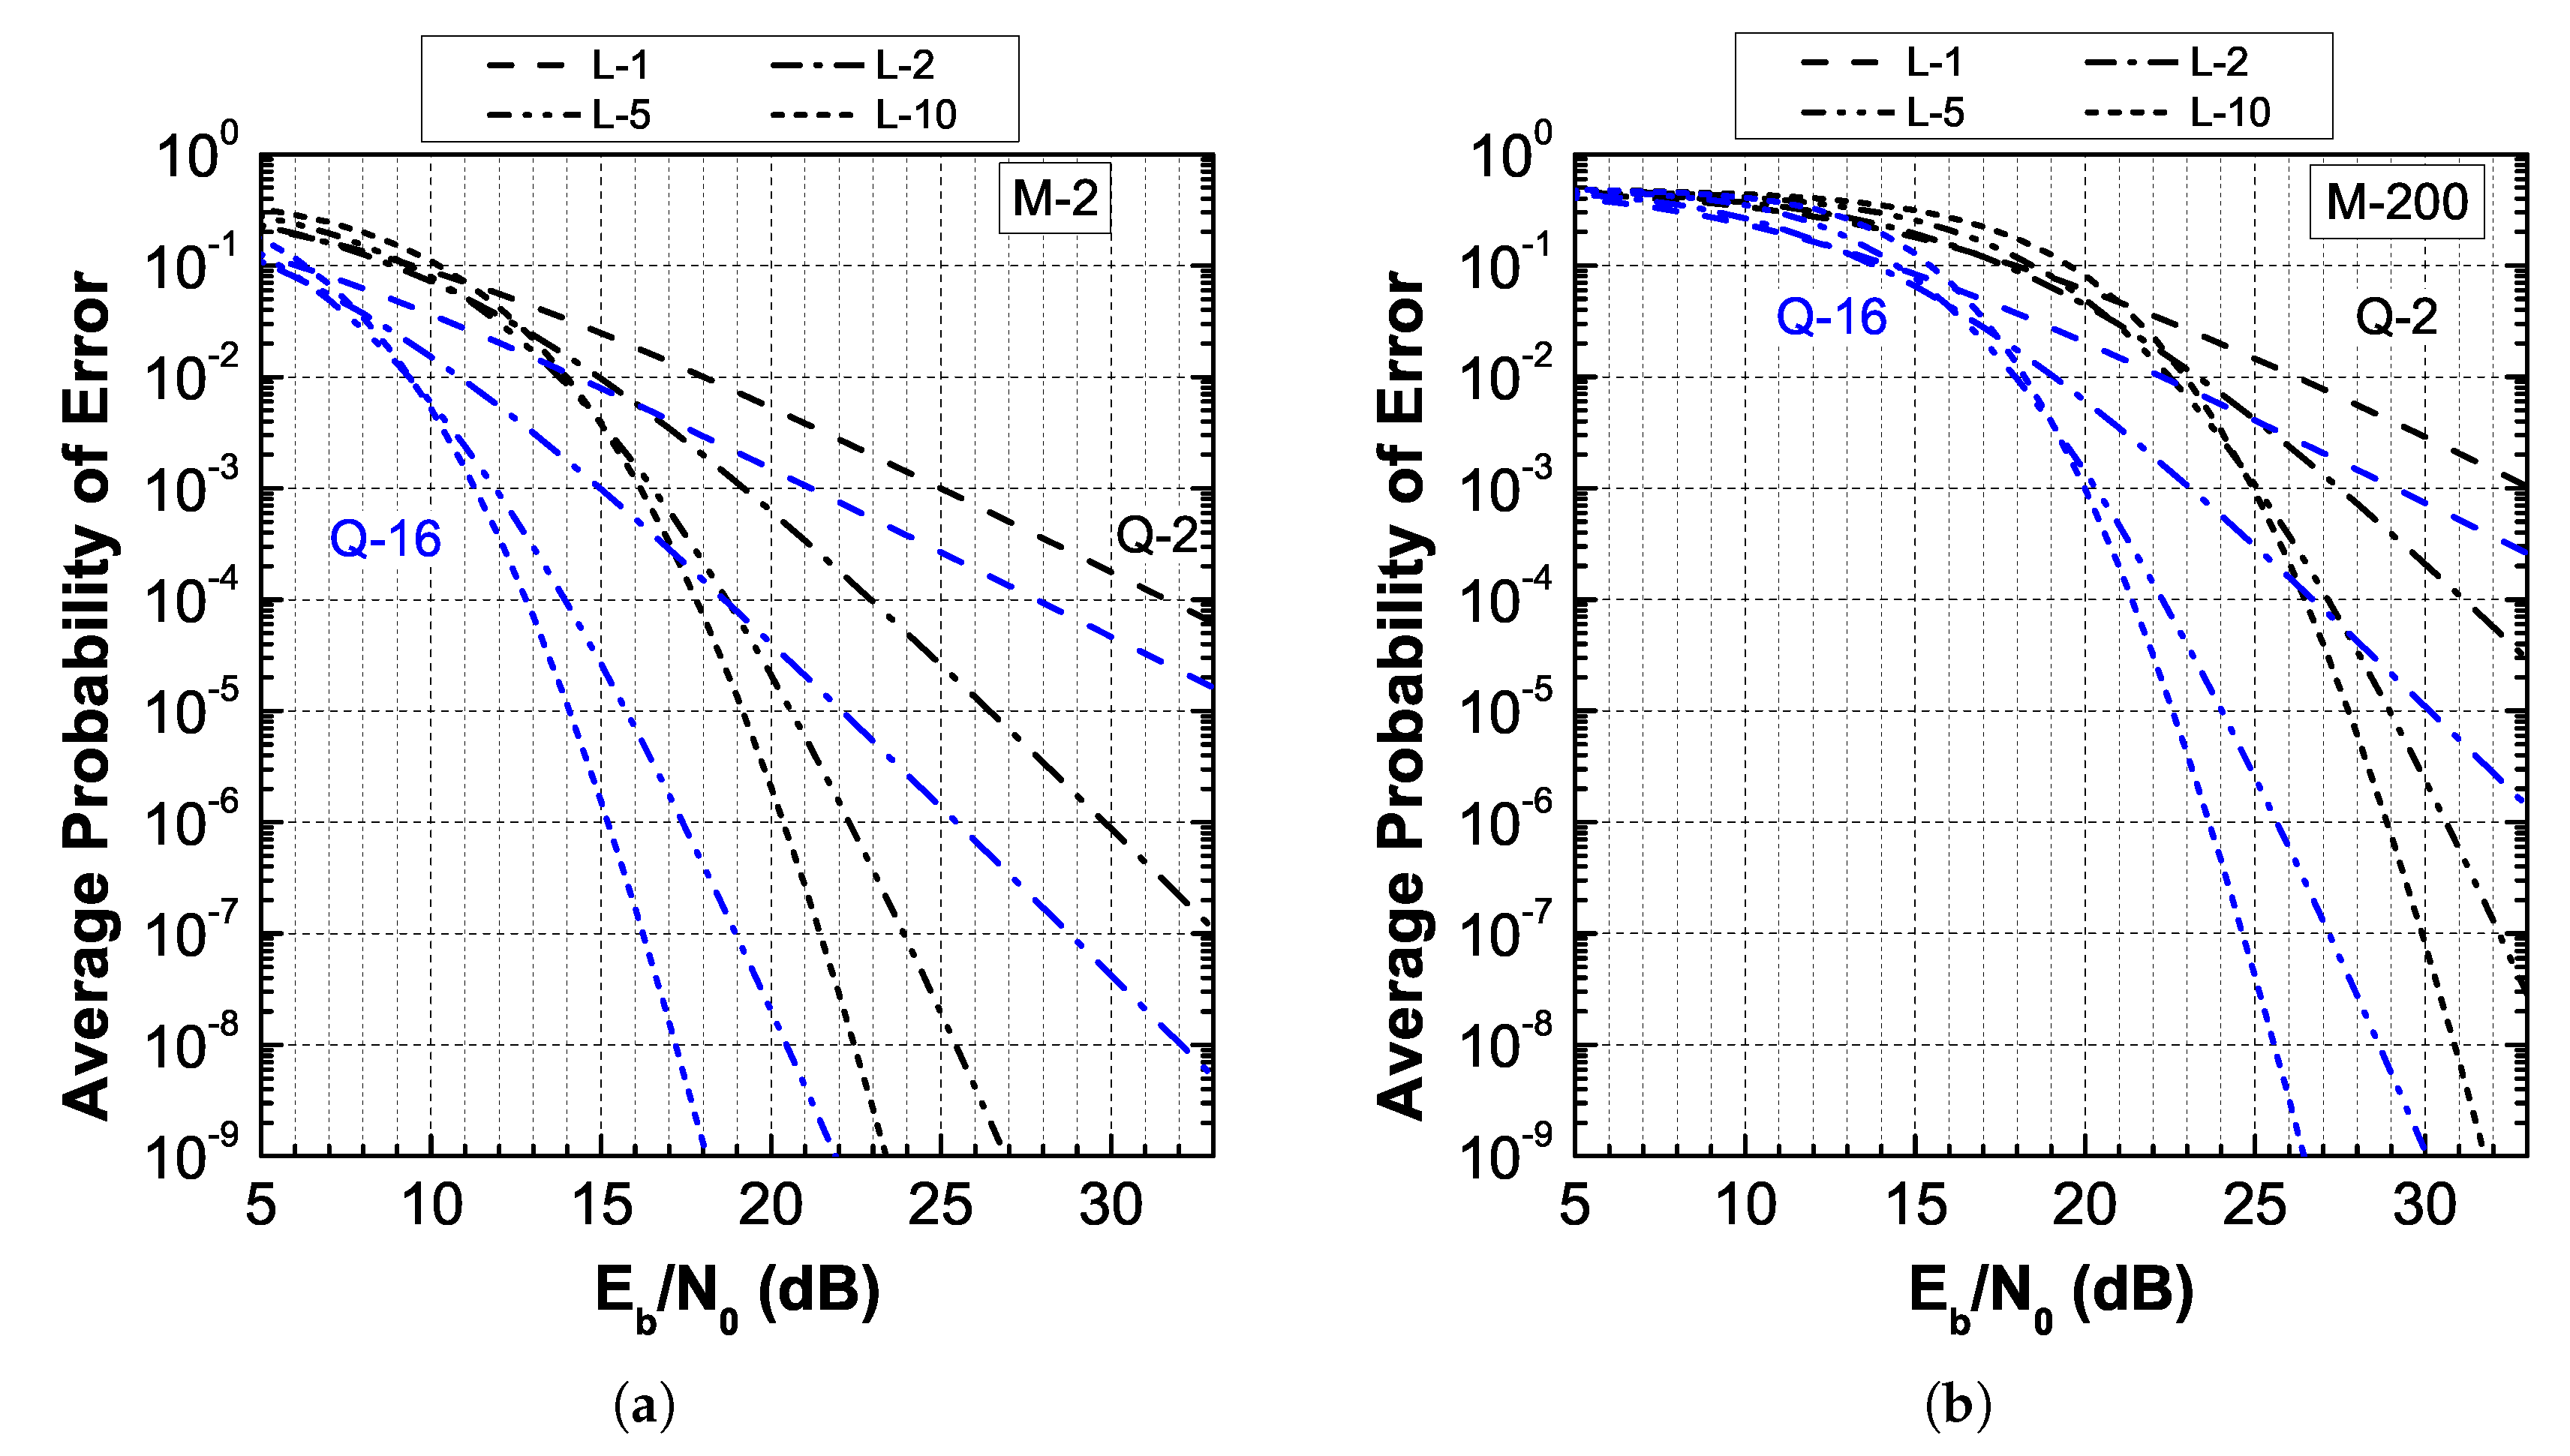
Figure 5 summarizes results on moderate fading. The results show that the modulation order still affects the system performance; however, diversity starts to have a more prominent role for a lower average PER. The introduction of additional branches over two significantly benefits the performance, and the combination of a higher modulation and diversity order provides a gain in the link budget of over 15 dB at a PER of 10 6 . A similar behavior is observed for strong fading in Figure 6, where a somewhat higher link gain is achieved by PPM and diversity at the same PER level.

6. Results on Other Distributions

In the current section we investigate the performance of the pre-amplified PPM receiver under γ γ and negative exponential fading. In the former case, the fading distribution is given by ([26], Equation (9.137))
f h ( h ) = 2 α β α + β 2 Γ ( α ) Γ ( β ) h α + β 2 1 K α β 2 α β h ,
where the distribution parameters α and β are calculated from ([26], Equation (5.15, 9.41, 9.46, 9.138)). Table 2 summarizes the α and β values that have been obtained for 100 m and 500 m links that operate at 1550 nm and for a structure constant equal to C n 2 = 4.58 × 10 13 m 2 / 3 .
Using the analysis of the previous sections, we find that the average PER is given by Equation (26) with the modification of the weighting function to
w ( s ) = z q s s ! 2 α β α + β 2 Γ ( α ) Γ ( β ) 0 h s + α + β 2 1 exp z q h K α β 2 α β h d h = Γ ( s + α ) Γ ( s + β ) Γ ( α ) Γ ( β ) s ! α β z q α Ψ s + α , 1 + α β ; α β z q .
Figure 7 and Figure 8 summarize the average PER results for the 100 m and 500 m γ γ link, respectively. The results show that modulation order plays the most important role on the performance of the shorter link (weaker fading), while diversity provides a more drastic performance improvement for the longer link (stronger fading), similar to the key observations of the Malaga- M fading analysis.
Finally, in negative exponential statistics, the fading distribution is given by ([26], Equation (9.129))
f h ( h ) = exp h
and the weight function becomes
w ( s ) = z q s s ! 0 h s exp z q h exp h d h = z q s ( 1 + z q ) s + 1 .
The corresponding average PER results are shown in Figure 9 and verify the importance of diversity in a saturated fading environment.

7. Conclusions

We have presented new analytical results on the PER performances of optically pre-amplified PPM receivers in OWCs. The results enable the evaluation of the OWC system performance under fading, and we have focused on the general Malaga- M fading distribution. We have considered the impacts of increased modulation orders and diversity reception, and it was shown that high order PPM is better suited for transmission over weak fading, while diversity reception becomes more effective as fading becomes more intense. The presented analysis is extended in a straightforward fashion to evaluate the performance under different fading distributions, which is of interest for the design of OWC links in a variety of atmospheric conditions.

Author Contributions

All authors contributed equally to the work presented in this manuscript. All authors have read and agreed to the published version of the manuscript.

Funding

This research received no external funding.

Conflicts of Interest

The authors declare no conflict of interest.

Abbreviations

The following abbreviations are used in this manuscript:
EDFAErbium doped fiber amplifier
EGCEqual-gain combiner
OWCOptical wireless communication
PERProbability of error
PPMPulse-position modulation
RVRandom variable
SEPSymbol error probability
SOASemiconductor optical amplifier

References

  1. Li, J.; Uysal, M. Optical wireless communications: System model, capacity and coding. In Proceedings of the 2003 IEEE 58th Vehicular Technology Conference, Orlando, FL, USA, 6–9 October 2003; Volume 1, pp. 168–172. [Google Scholar]
  2. Djordjevic, I.B. Adaptive Modulation and Coding for Free-Space Optical Channels. J. Opt. Commun. Netw. 2010, 2, 221–229. [Google Scholar] [CrossRef]
  3. Sandalidis, H.G. Coded Free-Space Optical Links over Strong Turbulence and Misalignment Fading Channels. IEEE Trans. Commun. 2011, 59, 669–674. [Google Scholar] [CrossRef]
  4. Safari, M.; Uysal, M. Relay-assisted free-space optical communication. IEEE Trans. Wirel. Commun. 2008, 7, 5441–5449. [Google Scholar] [CrossRef] [Green Version]
  5. Kazemlou, S.; Hranilovic, S.; Kumar, S. All-Optical Multihop Free-Space Optical Communication Systems. J. Light. Technol. 2011, 29, 2663–2669. [Google Scholar] [CrossRef]
  6. Chatzidiamantis, N.D.; Michalopoulos, D.S.; Kriezis, E.E.; Karagiannidis, G.K.; Schober, R. Relay selection protocols for relay-assisted free-space optical systems. IEEE/OSA J. Opt. Commun. Netw. 2013, 5, 92–103. [Google Scholar] [CrossRef]
  7. Peppas, K.P.; Stassinakis, A.N.; Nistazakis, H.E.; Tombras, G.S. Capacity analysis of dual amplify-and-forward relayed free-space optical communication systems over turbulence channels with pointing errors. IEEE/OSA J. Opt. Commun. Netw. 2013, 5, 1032–1042. [Google Scholar] [CrossRef]
  8. Xu, F.; Khalighi, A.; Caussé, P.; Bourennane, S. Channel coding and time-diversity for optical wireless links. Opt. Express 2009, 17, 872–887. [Google Scholar] [CrossRef]
  9. Tsiftsis, T.A.; Sandalidis, H.G.; Karagiannidis, G.K.; Uysal, M. Optical wireless links with spatial diversity over strong atmospheric turbulence channels. IEEE Trans. Wirel. Commun. 2009, 8, 951–957. [Google Scholar] [CrossRef] [Green Version]
  10. Nistazakis, H.E.; Tombras, G.S. On the use of wavelength and time diversity in optical wireless communication systems over gamma–gamma turbulence channels. Opt. Laser Technol. 2012, 44, 2088–2094. [Google Scholar] [CrossRef]
  11. Yang, L.; Gao, X.; Alouini, M. Performance Analysis of Free-Space Optical Communication Systems With Multiuser Diversity Over Atmospheric Turbulence Channels. IEEE Photonics J. 2014, 6, 1–17. [Google Scholar] [CrossRef] [Green Version]
  12. Yiannopoulos, K.; Sagias, N.C.; Boucouvalas, A.C.; Peppas, K. Optimal Combining for Optical Wireless Systems With Amplification: The χ2 Noise Regime. IEEE Photonics Technol. Lett. 2018, 30, 119–122. [Google Scholar] [CrossRef]
  13. Razavi, M.; Shapiro, J.H. Wireless optical communications via diversity reception and optical preamplification. IEEE Trans. Wirel. Commun. 2005, 4, 975–983. [Google Scholar] [CrossRef]
  14. Bayaki, E.; Michalopoulos, D.S.; Schober, R. EDFA-Based All-Optical Relaying in Free-Space Optical Systems. IEEE Trans. Commun. 2012, 60, 3797–3807. [Google Scholar] [CrossRef]
  15. Abtahi, M.; Lemieux, P.; Mathlouthi, W.; Rusch, L.A. Suppression of Turbulence-Induced Scintillation in Free-Space Optical Communication Systems Using Saturated Optical Amplifiers. J. Light. Technol. 2006, 24, 4966–4973. [Google Scholar] [CrossRef]
  16. Rizou, Z.V.; Zoiros, K.E.; Hatziefremidis, A. Signal amplitude and phase equalization technique for free space optical communications. In Proceedings of the 2013 15th International Conference on Transparent Optical Networks (ICTON), Cartagena, Spain, 23–27 June 2013. [Google Scholar]
  17. Yiannopoulos, K.; Sagias, N.C.; Boucouvalas, A.C. Fade Mitigation Based on Semiconductor Optical Amplifiers. J. Light. Technol. 2013, 31, 3621–3630. [Google Scholar] [CrossRef]
  18. Yiannopoulos, K.; Sagias, N.C.; Boucouvalas, A.C. On the Performance of Semiconductor Optical Amplifier-Assisted Outdoor Optical Wireless Links. IEEE J. Sel. Areas Commun. 2015, 33, 1869–1876. [Google Scholar] [CrossRef]
  19. Wilson, S.G.; Brandt-Pearce, M.; Cao, Q.; Leveque, J.H. Free-space optical MIMO transmission with Q-ary PPM. IEEE Trans. Commun. 2005, 53, 1402–1412. [Google Scholar] [CrossRef]
  20. Caplan, D.O.; Robinson, B.S.; Murphy, R.J.; Stevens, M.L. Demonstration of 2.5-Gslot/s optically-preamplified M-PPM with 4 photons/bit receiver sensitivity. In Proceedings of the Optical Fiber Communication Conference and Exposition and The National Fiber Optic Engineers Conference, Anaheim, CA, USA, 6 March 2005. [Google Scholar]
  21. Stevens, M.L.; Boroson, D.M. A simple delay-line 4-PPM demodulator with near-optimum performance. Opt. Express 2012, 20, 5270–5280. [Google Scholar] [CrossRef]
  22. Aladeloba, A. Performance evaluation of optically preamplified digital pulse position modulation turbulent free-space optical communication systems. IET Optoelectron. 2012, 6, 66–74. [Google Scholar] [CrossRef]
  23. Zhao, W.; Han, Y.; Yi, X. Error performance analysis for FSO systems with diversity reception and optical preamplification over gamma–gamma atmospheric turbulence channels. J. Mod. Opt. 2013, 60, 1060–1068. [Google Scholar] [CrossRef]
  24. Humblet, P.A.; Azizoglu, M. On the bit error rate of lightwave systems with optical amplifiers. J. Light. Technol. 1991, 9, 1576–1582. [Google Scholar] [CrossRef] [Green Version]
  25. Boucouvalas, A.C.; Sagias, N.C.; Yiannopoulos, K. Accurate Evaluation of the Average Probability of Error of Pulse Position Modulation in Amplified Optical Wireless Communications under Turbulence. Appl. Sci. 2019, 9, 749. [Google Scholar] [CrossRef] [Green Version]
  26. Andrews, L.C.; Phillips, R.L. Laser Beam Propagation through Random Media, 2nd ed.; SPIE Press: Bellingham, WA, USA, 2005. [Google Scholar]
  27. Jurado-Navas, A.; Garrido-Balsells, J.M.; Paris, J.F.; Puerta-Notario, A. A Unifying Statistical Model for Atmospheric Optical Scintillation. In Numerical Simulations of Physical and Engineering Processes; Awrejcewicz, J., Ed.; IntechOpen: Rijeka, Croatia, 2011; Chapter 8. [Google Scholar]
  28. Samimi, H. New statistical model for atmospheric optical scintillation and its application. IET Optoelectron. 2013, 7, 31–37. [Google Scholar] [CrossRef]
  29. Gradshteyn, I.S.; Ryzhik, I.M. Table of Integrals, Series, and Products, 7th ed.; Elsevier/Academic Press: Amsterdam, The Netherlands, 2007. [Google Scholar]
  30. Hughes, L.W. A simple upper bound on the error probability for orthogonal signals in white noise. IEEE Trans. Commun. 1992, 40, 670. [Google Scholar] [CrossRef]
  31. Truesdell, C. On the Addition and Multiplication Theorems for Special Functions. Proc. Natl. Acad. Sci. USA 1950, 36, 752–755. [Google Scholar] [CrossRef] [Green Version]
  32. Abramowitz, M.; Stegun, I.A. Handbook of Mathematical Functions with Formulas, Graphs, and Mathematical Tables; Dover: New York, NY, USA, 1964. [Google Scholar]
  33. Eger, S. Some Elementary Congruences for the Number of Weighted Integer Compositions. J. Integer Seq. 2015, 18, 1–18. [Google Scholar]
Figure 1. Optically pre-amplified pulse-position modulation (PPM) receiver. OpAmp: optical amplifier; Fl: optical filter; PD: photodiode; Int: time-slot integrator.
Applsci 10 01141 g001
Figure 2. PPM probabilities of error (PERs) for different modulation orders Q and noise modes M.
Applsci 10 01141 g002
Figure 3. PPM average PER in Malaga- M fading. The plots correspond to no fading (solid), weak fading (dash), moderate fading (dash-dot) and strong fading (dash-dot-dot). The noise modes are equal to M = 2 and M = 200 in (a) and (b), respectively.
Applsci 10 01141 g003
Figure 4. Diversity reception of optically pre-amplified PPM under weak Malaga- M fading. The noise modes are equal to M = 2 and M = 200 in (a) and (b), respectively.
Applsci 10 01141 g004
Figure 5. Diversity reception of optically pre-amplified PPM under moderate Malaga- M fading. The noise modes are equal to M = 2 and M = 200 in (a) and (b), respectively.
Applsci 10 01141 g005
Figure 6. Diversity reception of optically pre-amplified PPM under strong Malaga- M fading. The noise modes are equal to M = 2 and M = 200 in (a) and (b), respectively.
Applsci 10 01141 g006
Figure 7. Diversity reception of optically pre-amplified PPM under γ γ fading (100 m link). The noise modes are equal to M = 2 and M = 200 in (a) and (b), respectively.
Applsci 10 01141 g007
Figure 8. Diversity reception of optically pre-amplified PPM under γ γ fading (500 m link). The noise modes are equal to M = 2 and M = 200 in (a) and (b), respectively.
Applsci 10 01141 g008
Figure 9. Diversity reception of optically pre-amplified PPM under negative exponential fading. The noise modes are equal to M = 2 and M = 200 in (a) and (b), respectively.
Applsci 10 01141 g009
Table 1. Malaga- M distribution parameters.
Irradiance Fluctuations
ParameterWeakModerateStrong
α 502.552.2814
β 142233
Ω 1.06210.46181.33
b 0 0.02160.65250.4231
ρ 0.860.9880.84
ϕ A ϕ B π / 2
Table 2. γ γ distribution parameters.
Parameterl–100 ml–500 m
α 16.534.04
β 14.911.53