Article

Shear Band Characterization of Clayey Soils with Particle Image Velocimetry

1
Seismic Safety Research Center, Korea Institute of Civil Engineering and Building Technology, Goyang 10223, Korea
2
Underground Space Safety Research Center, Korea Institute of Civil Engineering and Building Technology, Goyang 10223, Korea
3
Korea Railroad Research Institute, Uiwang 16105, Korea
4
Department of Civil and Environmental Engineering, Seoul National University, Seoul 08826, Korea
5
Construction Automation Research Center, Korea Institute of Civil Engineering and Building Technology, Goyang 10223, Korea
*
Author to whom correspondence should be addressed.
Appl. Sci. 2020, 10(3), 1139; https://doi.org/10.3390/app10031139
Submission received: 3 December 2019 / Revised: 3 February 2020 / Accepted: 3 February 2020 / Published: 7 February 2020
(This article belongs to the Section Civil Engineering)

Abstract

:
Identifying the spatial distribution of deformation and shear band characteristics is important for accurately modeling soil behavior and ensuring the safety of nearby geotechnical structures. However, most research on the shear behavior of soils has focused on granular soil and clay-rich rocks, with little focus on clayey soil, and the entire shearing process from the initial state to failure has not been observed. This study evaluated the spatial distribution and evolution of deformation in clayey soils from the initial state to the post-failure state and the shear band characteristics. Plane strain tests were performed on normally consolidated and over-consolidated clay specimens, and digital images were captured through a transparent side wall for particle image velocimetry (PIV) analysis. PIV was performed to evaluate the displacement and deformation of soil particles. The results show that the shear-strain behaviors of two clays during the shearing process could be divided into four stages: initial, peak, softening, and steady state. Shear bands were observed to form in the softening stage, and the shear band slopes were compared to values in the literature. These results can be used to characterize shear bands in clay as well as predict failure behavior and guide reinforcement at actual sites with soft ground.

Graphical Abstract

1. Introduction

Generally, soil failure occurs with the formation and development of one or more shear bands [1]. Applying a load to a soil element causes spatially non-uniform deformation that gradually focuses on a specific shear band [2]. When the load exceeds the soil element’s shear strength, progressive failure (i.e., shear failure) occurs along the shear band where the deformation is concentrated. The soil behavior during this shear failure greatly influences the stability of nearby geotechnical structures. Therefore, it is important to identify the spatial distribution of deformation and the shear band characteristics from the initial state to the post-failure state (i.e., throughout the shearing process). This allows geotechnical engineers to accurately model the ground and evaluate the behavior of nearby geotechnical structures.
With conventional shear test methods (e.g., triaxial, direct shear, and plane strain test), many researchers have adopted special experimental techniques, such as X-ray computed tomography (CT), scanning electron microscopy (SEM), and digital image analysis (DIA), to evaluate the spatial deformation and shear band characteristics within test specimens. For the triaxial test, X-ray CT [3,4,5,6] or thin-section analysis with epoxy impregnation [7,8,9] is used to obtain the density variation of specimens, which is used to evaluate the spatial deformation. Haines et al. [10,11], Wojatschke et al. [12], and Orellana et al. [13] carried out biaxial direct shear tests of clay-rich fault rocks and applied SEM and X-ray texture goniometry (XTG) to analyze the microstructures of the sheared samples.
However, these techniques are limited because they require expensive equipment and it is impossible to continuously observe deformation behavior during the entire experimental process from the beginning to the end. To overcome these limitations, the use of DIA techniques has recently become more widespread because they can take continuous direct measurements of spatial deformation [6,14,15,16,17]. DIA techniques are mainly applied to plane strain tests that use flat specimens because the internal state of a plane strain test specimen can be represented by images through a transparent side wall (i.e., the external state of the specimen). The spatial distribution of deformation can be continuously computed by tracing reference markers or grid points painted on a membrane enclosing a specimen. In addition, automated DIA techniques, which can accurately obtain a large amount of displacement data for a two-dimensional surface, have also been utilized in soil mechanics [15,16,17].
Unlike granular soil, there has been very little research on the spatial distribution of deformation and the shear band characteristics of clayey soil during shearing. Studies on assessing the shearing behavior of clayey soil have mainly focused on the overall stress–strain response of specimens during triaxial tests [18,19,20]. Some studies [8,21] have used DIA in triaxial tests to evaluate the spatial distribution of deformation; however, triaxial test specimens, which have axial symmetry, have limited applicability because their surface and internal behaviors do not match [2]. Rhee [22] and Alshibli and Akbas [23] used plane strain tests to evaluate the shear band characteristics (e.g., angle and thickness) of clayey soils during shear failure. However, even though such shear band characteristics change from the initial state to the post-failure state [17], the authors only observed the shear band during the experiment’s final stage and were not able to continuously observe the spatial distribution of deformation and shear band characteristics.
The main objective of this study was to evaluate the spatial distribution and evolution of deformation in clayey soil from the initial to the post-failure state, and to determine the shear band characteristics. Plane strain tests were performed on normally consolidated (NC) clay and over-consolidated (OC) clay, and digital images were captured during the experiments through a transparent side wall. DIA was applied to the digital images to quantify the deformation of clay, so that the displacement and shear strain fields could be computed for the entire clay specimen. Particular attention was given to assessing the shear band characteristics throughout the shearing process.

2. Experimental Program

2.1. Test Apparatus

As shown in Figure 1, a plane strain test apparatus was used that can control the movement of its bottom plate [24]. The bottom plate was divided into two parts, namely upper and lower, with a linear bearing placed between them. The lower part was fixed, and the upper part could be moved or fixed. The specimens used in the experiments had a parallelepiped shape with a length of 64.5 mm, a width of 45 mm, and a height of 128 mm. Two side plates were used to fix the radial displacement to simulate the plane strain condition. One of the two side plates and the test apparatus cell were made from transparent acrylic plates, so that images of the specimens could be captured during the experiments. The test apparatus cell has a parallelepiped shape and a transparent side plate, thus allowing observation of the whole sample deformation during the shearing process.

2.2. Preparation of Soil Specimens

In this study, commercial-grade EPK (Edgar Plastic Kaolin) kaolinite was used for the soil specimens. Table 1 presents the characteristics of the EPK kaolinite. This is a clay with low plasticity and compressibility and is classified as MH (silt of high plasticity, elastic silt) according to the Unified Soil Classification System (USCS).
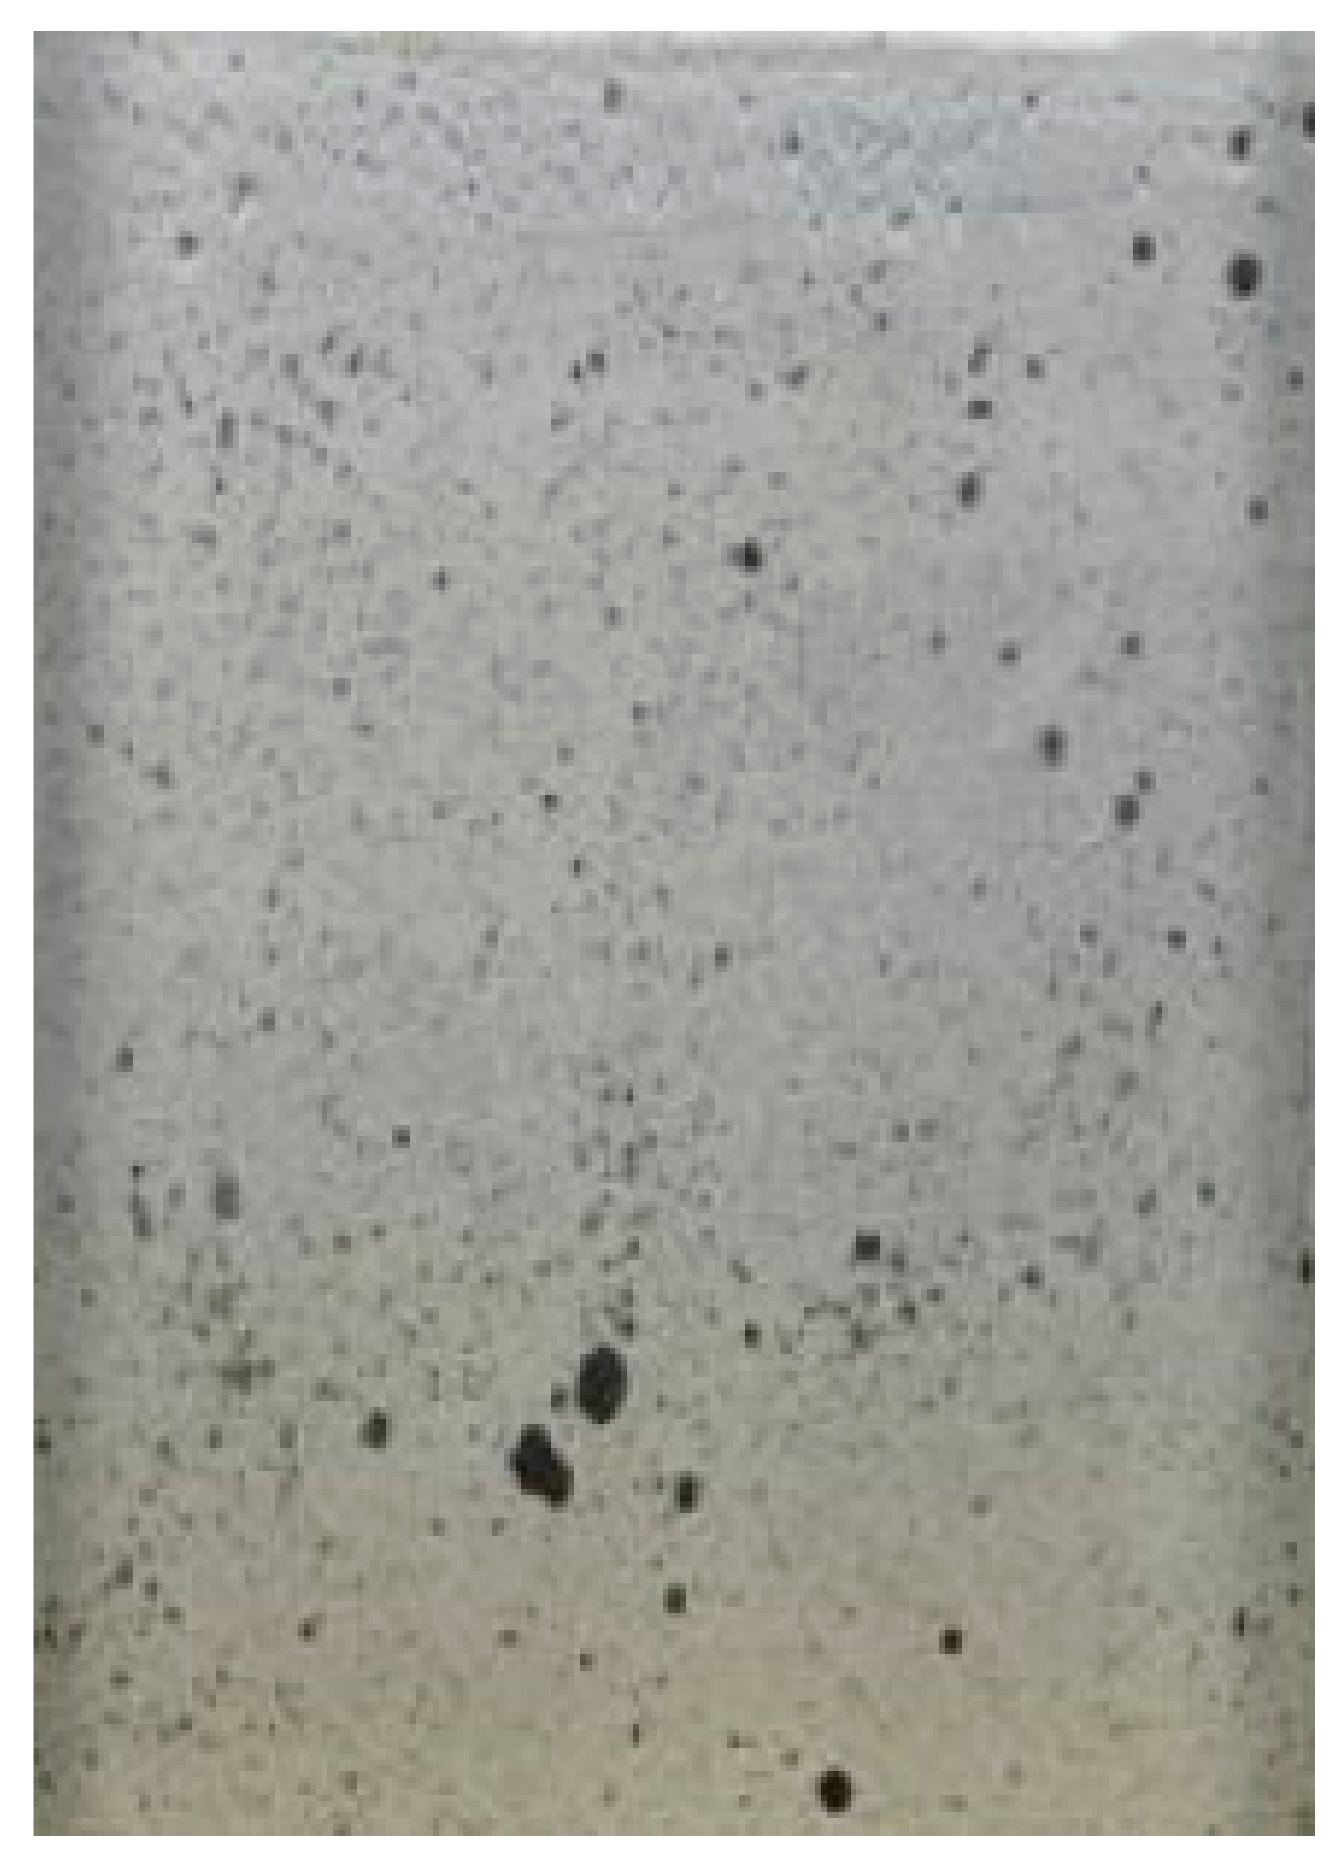
The EPK kaolinite was reconstituted to form fully saturated and homogeneous clay specimens based on the slurry consolidation technique suggested by Sheeran and Krizek [25]. The reconstitution process was as follows: (1) The EPK kaolinite powder was mixed with de-aired water to create a kaolinite slurry with 100% moisture content. (2) The prepared slurry was mixed with a rotating blade under vacuum pressure in a mixing chamber to eliminate the air bubbles within. (3) The de-aired EPK kaolinite slurry was poured into a cylinder-shaped consolidometer with a 300 mm diameter, and a 10 kPa vertical load was gradually applied until the target preconsolidation load of 150 kPa was reached. (4) The specimens were consolidated for two weeks. The reconstituted specimens were trimmed and prepared to generate image patterns for DIA. A fretsaw and auxiliary trimming guide were used to trim the cylinder-shaped specimens into a parallelepiped shape with a length of 64.5 mm, a width of 45 mm, and a height of 128 mm. Image patterns can be generated for DIA by artificially adding textures to the soil surface [26,27] or artificially adding dyed sand or colored particles to the soil [15,28]. In this study, a method similar to those of Zhang et al. [26] and Kim et al. [27] was used, and water-insoluble black paint was added to the soil surface to produce an artificial texture (Figure 2). This method was used because it is believed to have less influence on the shear behavior of the specimen.

2.3. Experimental Procedure and Conditions

Each synthetic kaolinite-rich clay sample was covered with a membrane and mounted on the plane strain test apparatus for the experiments. A thin and transparent membrane was used, so that the image patterns generated for DIA could be observed. To minimize friction between the side plate and specimen, silicon grease was applied between the membrane and side plate.
Similar to normal plane strain and triaxial experiments, the experiments were performed according to a saturation–consolidation–shearing process. The specimens were saturated with 100 kPa of backpressure. When the excess pore water pressure coefficient B reached 0.95 or more, the saturation was considered to be finished, and consolidation was performed, for which the specimen’s bottom plate was kept in a confined state. As indicated in Table 2, the consolidation was performed at an effective vertical stress of 200 kPa and effective horizontal stress of 100 kPa under the assumption that the horizontal earth pressure K0 was 0.5. Then, the OC clay was unloaded at an effective vertical stress and effective horizontal stress of 50 kPa, and OCR = 4 (= 200/50) conditions were simulated. Considering that the capacity of the test apparatus cell used in this study was 300 kPa, the NC and OC clays did not have identical effective consolidation stresses. In the shearing, stage after consolidation was complete, a displacement control method was used to apply the load at a rate of 0.5%/h until failure. The vertical load was applied by raising the test apparatus cell (i.e., the specimen), while the rod attached to the load cell was fixed. To simulate the shear band formation in an actual field, the horizontal movement of the confined bottom plate, which was restrained during consolidation, was allowed to be free [6,14]. To confirm the reproducibility, the experiments for the NC and OC clays were repeated twice, thus four sets of experiments were performed (hereinafter referred to as NC1, NC2, OC1, and OC2, respectively). Figure 3 presents the experimental flowchart.
For DIA, a 12-megapixel (4288 × 2848 pixels) digital camera (Nikon D90) was used to capture images of the specimens through the transparent side plate at vertical strain increments of 0.25% in 5-min intervals. The specimens were observed and photographed through the transparent side plate of the test apparatus, which was kept perpendicular with the fixed camera’s direction. To maintain a fixed light level, constant illumination was applied at an angle from both sides during the shearing process in a space where external light was blocked to obtain suitable digital images for analysis. A load cell, linear variable differential transformer (LVDT), and pressure transducer (for measuring the confining stress and pore pressure) were used to measure the vertical load, displacement, and pore water pressure, respectively. These measurements were used to assess the global stress–strain relationship, which was used to identify the overall shearing characteristics and divide the shearing process.

3. Digital Image Analysis

The particle image velocimetry (PIV) technique was first developed in the field of fluid dynamics by Adrian [29] and uses digital images to measure displacement and deformation in soil specimens in the field of geotechnics [20,23,27,30]. The PIV technique was used to measure the displacement and deformation in a target specimen as follows: (1) Digital images were captured before and after the deformation of the target specimen. (2) Cross-correlation was performed on the pixel subsets in the images before and after deformation, as shown in Figure 4. (3) The correlation coefficients found by the cross-correlation were interpolated to find the points with the correlation. (4) The location of the pixel subset with the highest correlation was used to calculate the relative displacement for each location in the specimen [15]. The commercial software GeoPIV [31] was used for the PIV analysis. The displacement for each of the target specimen’s locations was measured, and the strain was calculated to analyze the deformation behavior within the specimens during the experiments [15].
The accuracy of the PIV technique is primarily influenced by the strain interval and size of the pixel subset. Therefore, these factors need to be considered when determining the optimal conditions. The accuracy of the PIV technique improves as the strain interval decreases [32]. However, if the strain interval is overly small, the analysis time increases, and it becomes difficult to examine the deformation characteristics. Therefore, a suitable strain interval must be found. Kim et al. [27] found that a random pattern must be created by sprinkling black ink because there is no unique texture for each particle in clayey soil, unlike in sandy soil. This method showed a satisfactory accuracy of 0.37% for the strain. In this study, random patterns were created by a black spray as well, and the vertical strain interval was set at 0.25% to ensure the reliability of the study results.
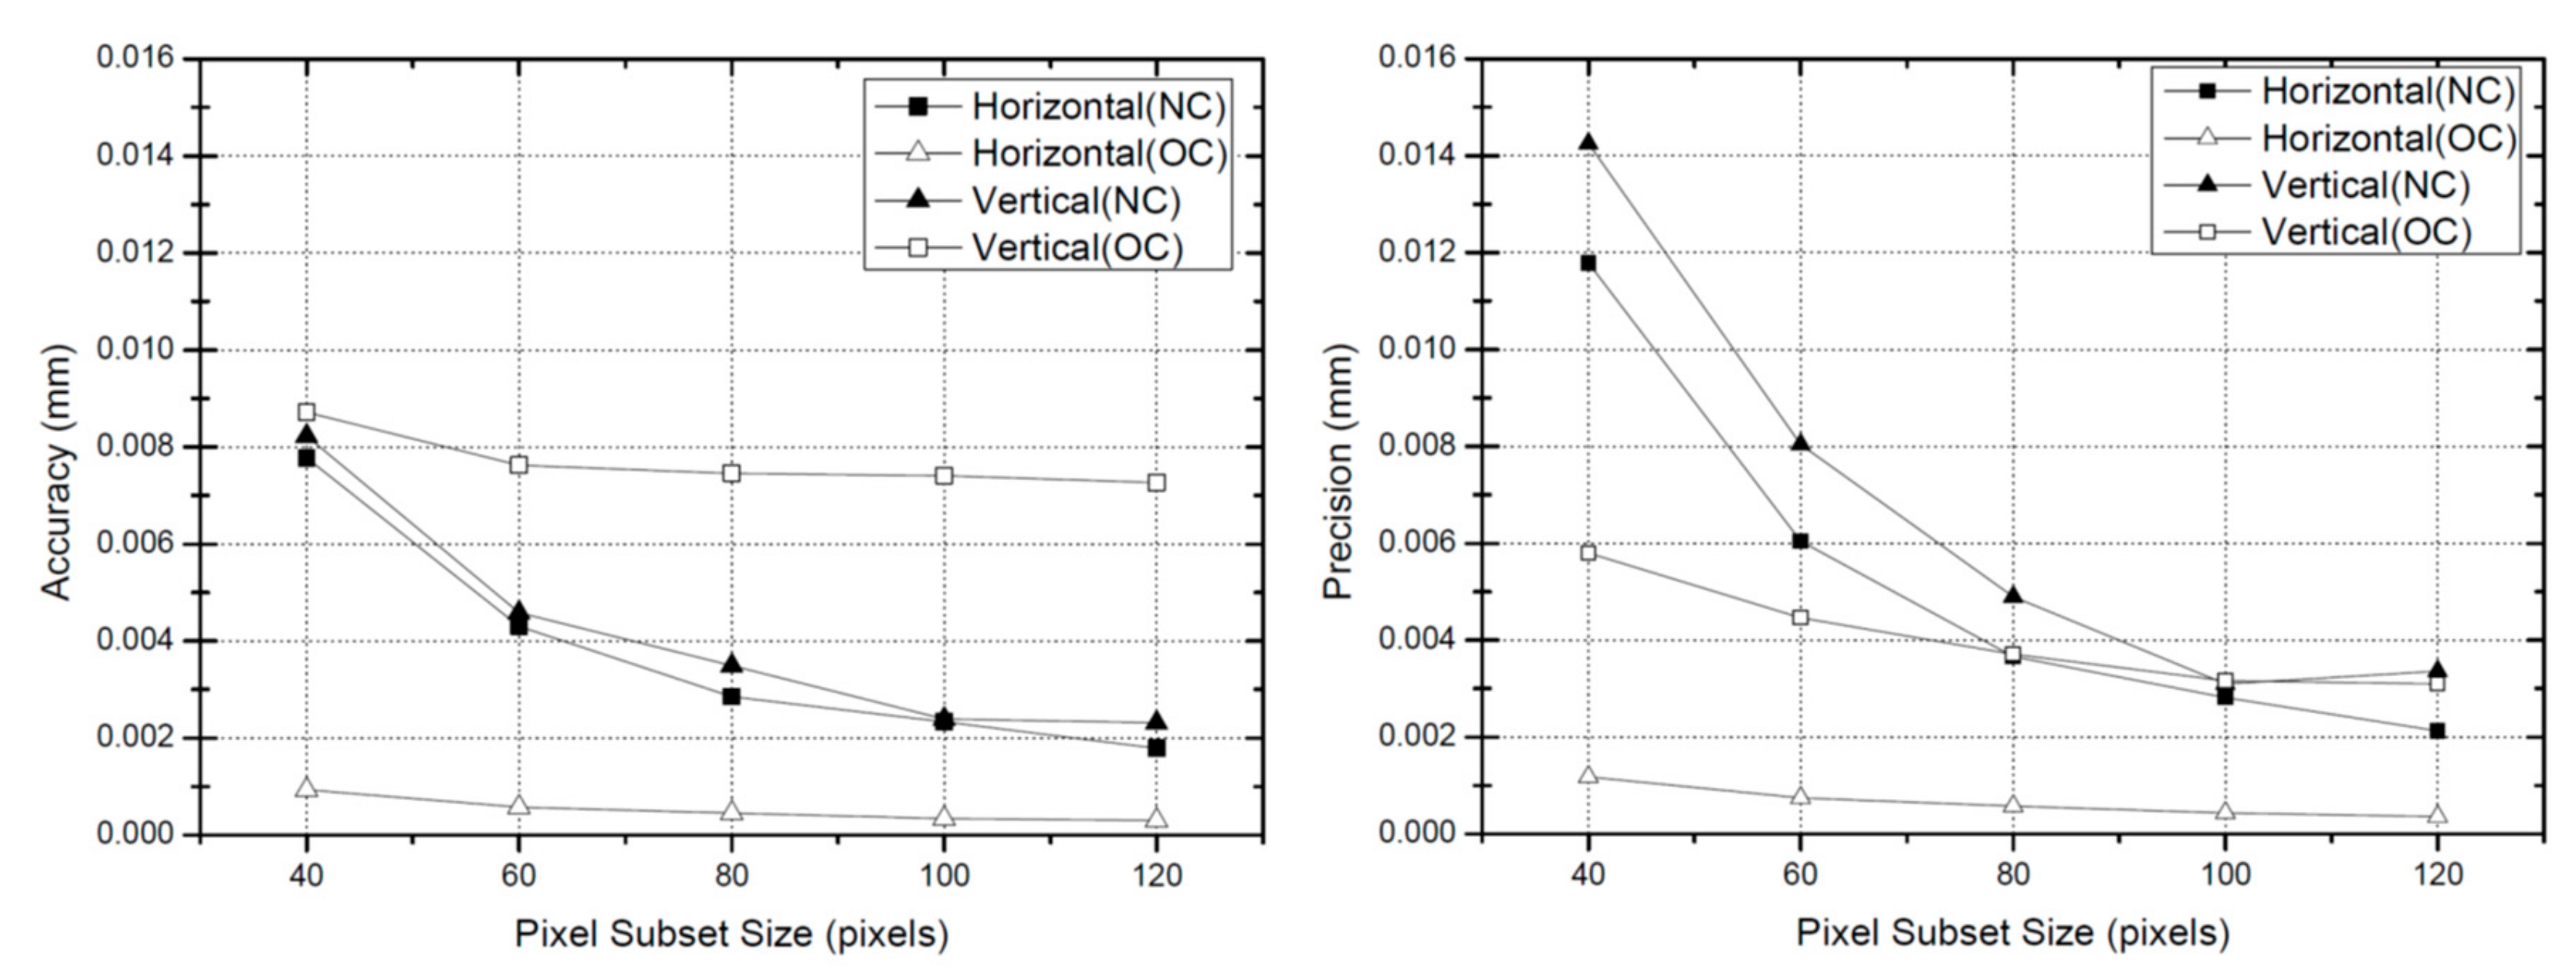
As the size of the pixel subset that is used with the PIV technique increases, the pixel subset’s uniqueness increases, and it commonly becomes possible to obtain highly accurate analysis results [32]. However, to calculate the displacement at various locations, the size of the pixel subset needed to be small. Therefore, calculating an appropriate pixel subset size is also important. In this study, DIA was performed on the specimen’s original image and images in which the rigid body had been moved by 1 pixel at various pixel subset sizes. The results verified the accuracy of the GeoPIV program. As shown in Figure 5, the accuracy and precision increased with the size of the pixel subset. After 80 × 80 pixels, the increment of the improvement in accuracy became smaller. A maximum error of around 1.5% (0.015 mm) was observed at 80 × 80 pixels. This error was determined to be sufficiently small, thus the optimal pixel subset size for DIA was set to 80 × 80 pixels.
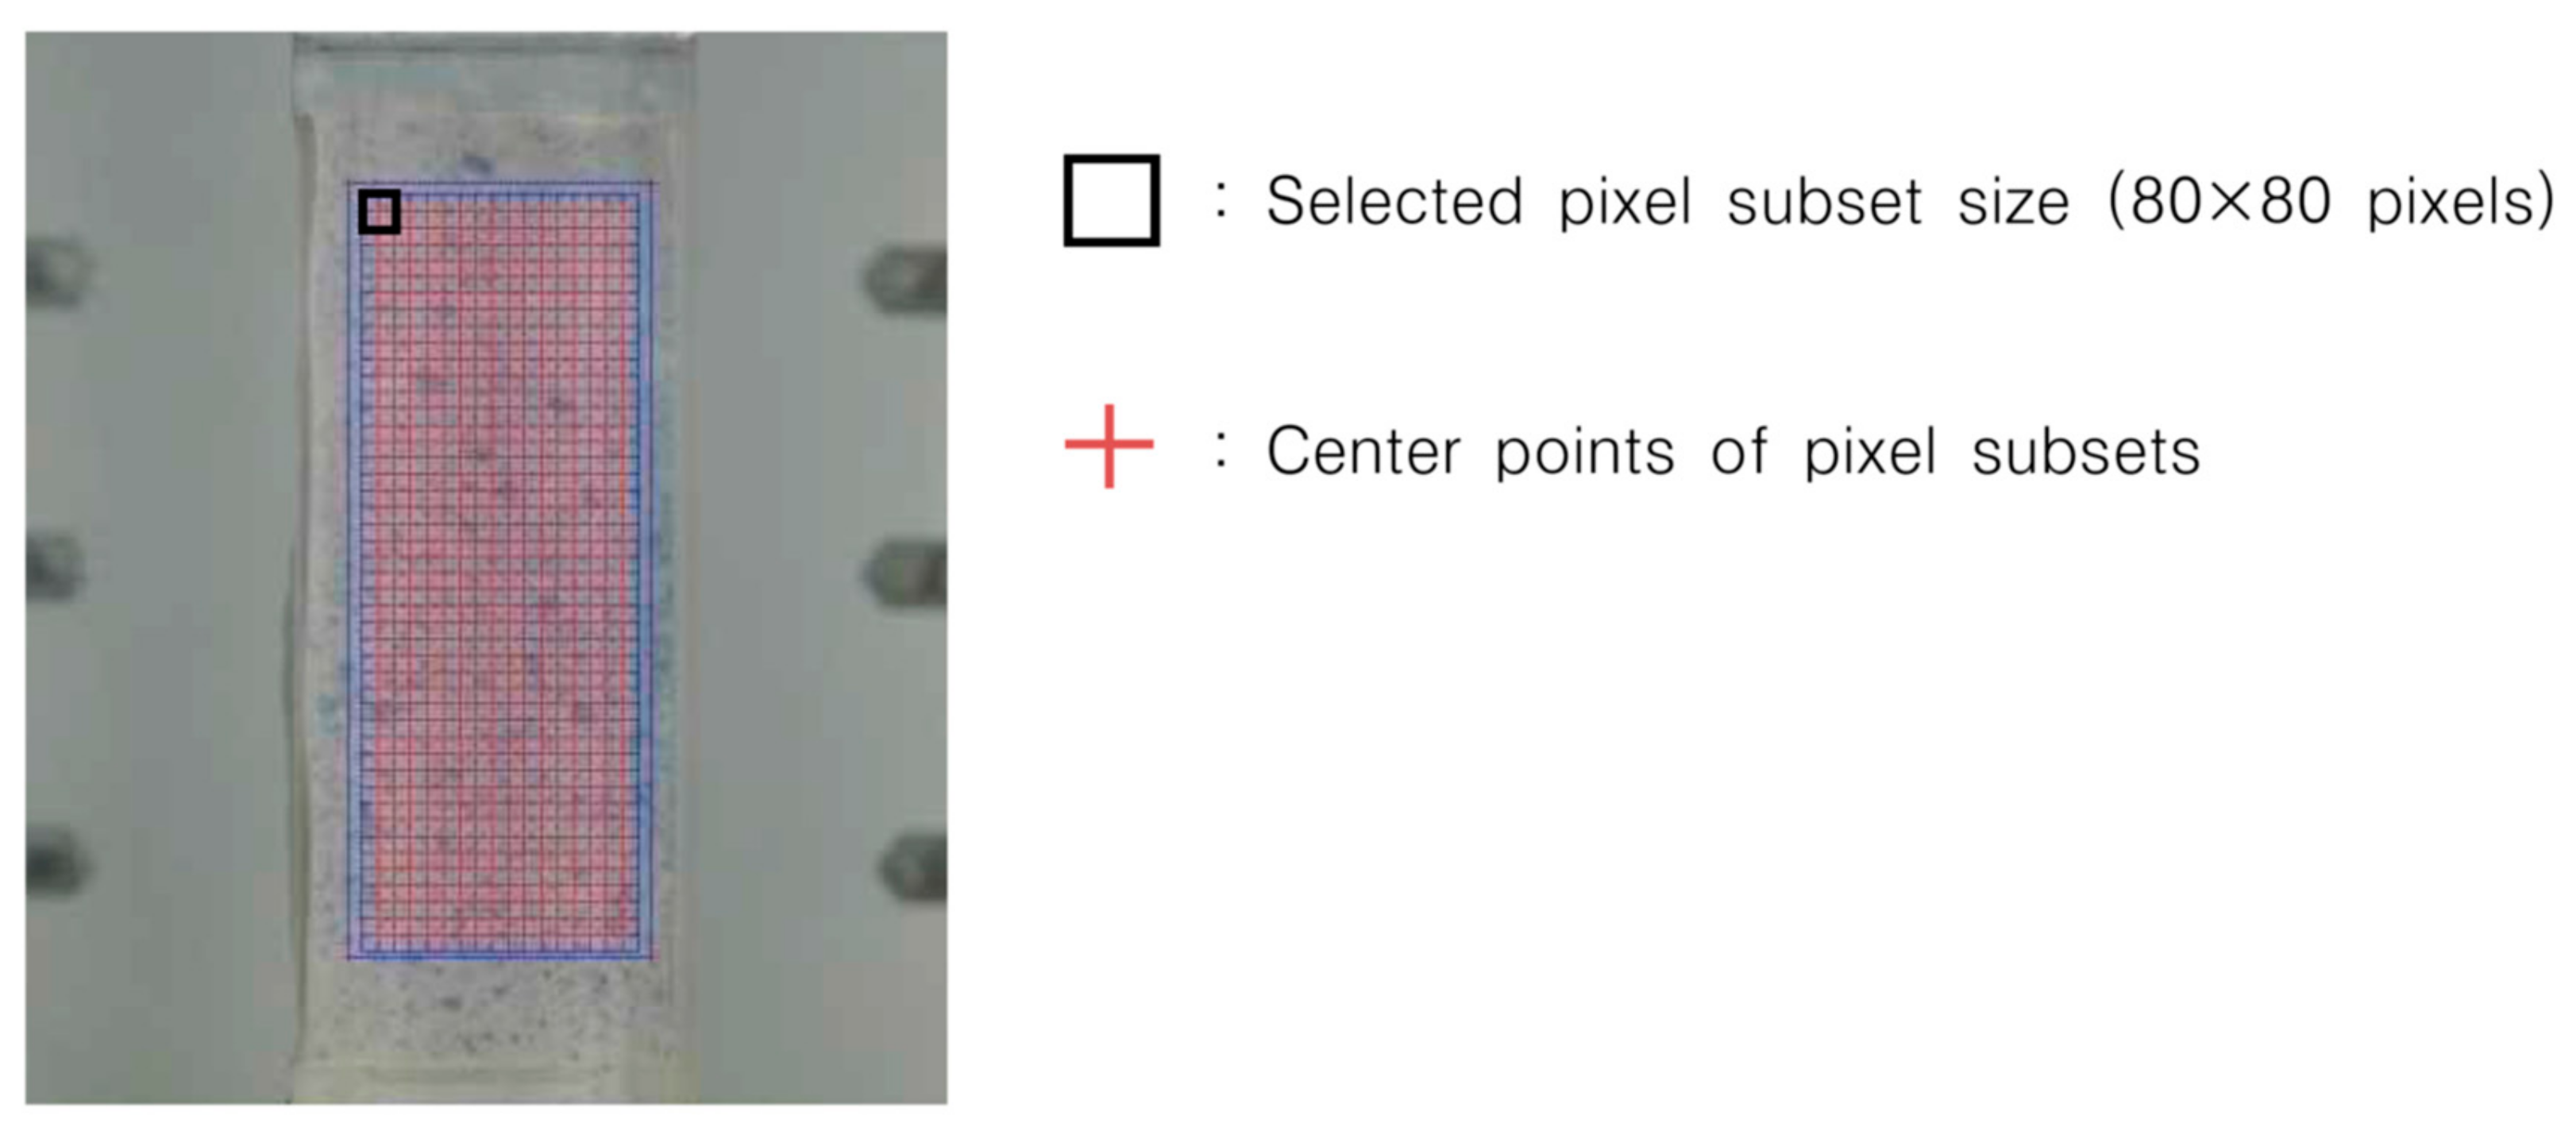
To exclude the boundary effect (i.e., the effect of the friction between the specimen and the upper and lower caps) as much as possible, DIA was performed on the area shown in Figure 6 at 720 (16 × 45) locations, and the displacement was calculated.

4. Experimental Results and Discussion

4.1. Global Stress–Strain Relationship during Shearing

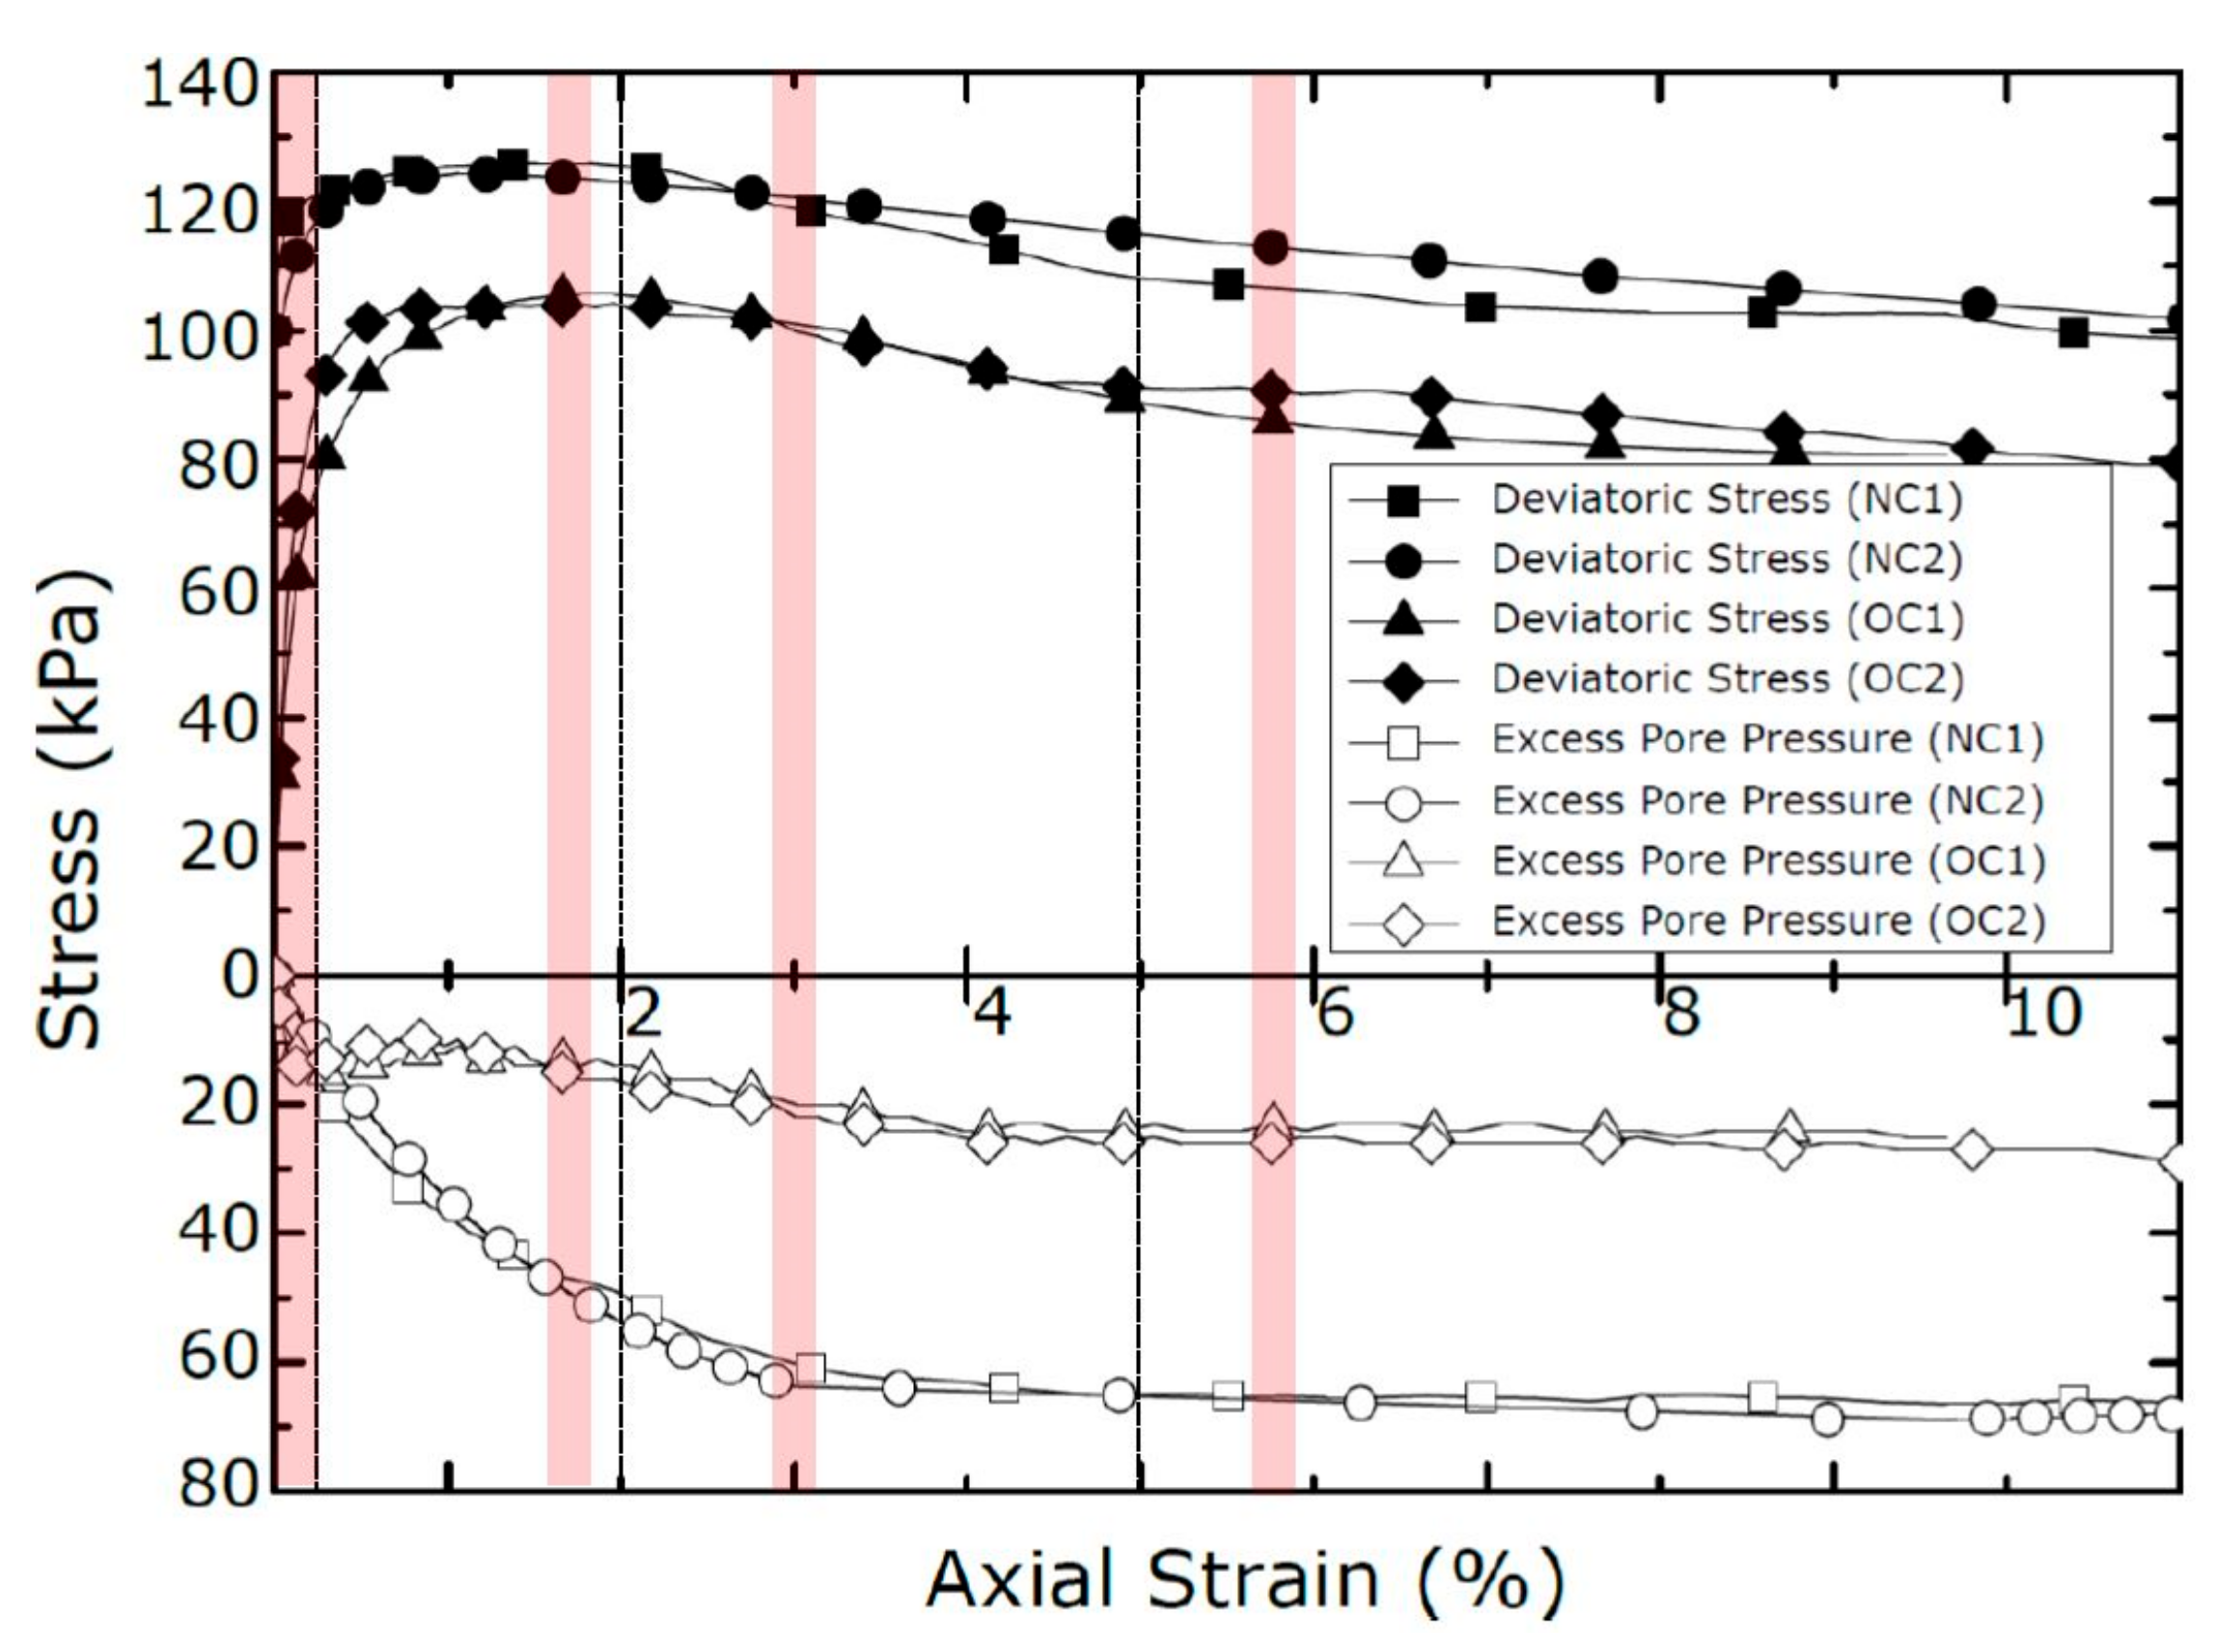
Figure 7 shows the stress–strain behavior of the NC and OC clays during the plane strain test. The stress–strain behavior can be divided into four stages according to the strain: (1) initial (0–0.25%); (2) peak (0.25–2.00%); (3) softening (2.00–5.00%); and (4) steady state (>5.00%). The stages are divided by dotted lines in Figure 7, and DIA was performed in the intervals shown as red bars.
For the NC clay (both NC1 and NC2), the vertical load was applied at a deviatoric stress of 100 kPa (confining stress of 100 kPa) immediately after anisotropic consolidation (see Table 2). In the initial stage of NC1 and NC2, the deviatoric stress increased to 120 and 117 kPa, and the excess pore pressure increased to 18 and 11 kPa during the period with a low deformation of 0.25% (around 30 min), respectively. In the peak stage, the deviatoric stress slowly increased within the interval of 0.25%–2.00% strain, and the maximum deviatoric stress of NC1 was 125.9 kPa at 1.66% strain, while it reached 124.3 kPa at 1.30% strain in NC2. The excess pore pressure of NC1 and NC2 in the peak stage continuously increased to 50 and 54 kPa as the shearing progressed, after which the rate of increase gradually slowed. At the interval of 2.00%–5.00% strain, softening behavior was observed, in which the deviatoric stress rapidly decreased, and the excess pore pressure gradually increased to 63 kPa for NC1 (pressure increment of 4.9 kPa/1% strain) and 64 kPa for NC2 (pressure increment of 4.1 kPa/1% strain) before stabilizing. In the steady-state stage, the deviatoric stress and excess pore pressure both remained stable without large changes. This confirmed that the failure was complete.
For the OC clay (both OC1 and OC2), isotropic consolidation was performed in the consolidation stage. Vertical loading was performed at a deviatoric stress of 0 kPa after loading-unloading of the consolidation (confining stress of 50 kPa) (see Table 2). In the initial stage (0%–0.25% strain) of OC1 and OC2, the deviatoric stress increased to 77 and 86 kPa, and the excess pore pressure increased to 15 and 14 kPa, respectively. The deviatoric stress increased continuously up to 0.99% strain and reached around 100 kPa, but the rate of increase in the stress then gradually slowed down. Up to 1.75% strain, peak deviatoric stresses of 105.6 and 104.1 kPa were observed in OC1 and OC2, respectively. The peak deviatoric stress was less than that of the NC clay because the shearing process took place at half the confining pressure. The commonly observed trend in which the OC clay has a greater peak deviatoric stress than the NC clay would most likely be observed in experiments in which the confining pressures for the two clays were the same. The excess pore pressure decreased until the peak deviatoric stress was reached. In the softening stage, the deviatoric stress and excess pore pressure tended to decrease at fixed rates. Similar to the trend for the excess pore pressure in this study, Gu et al. [33] reported that OC clay with an OCR of 4 (i.e., light to moderate OC clay) showed a decrease in the excess pore pressure in the peak stage, which then increased again due to localization in the softening stage (the excess pore pressure was less than that of the NC clay). In the steady-state stage, the deviatoric stress and excess pore pressure both remained stable without great changes, as was the case with the NC clay.

4.2. Localized Displacement Increment Field

To analyze the spatial distribution and evolution of deformation for the NC clay and OC clay in each stage, PIV was performed at vertical strain intervals of 0.25%. As shown by the red bars in Figure 7, vertical strain intervals that showed typical deformation behavior were selected for each stage of the stress–strain behavior. The vertical and horizontal contours for each strain interval were diagrammed based on the displacement vectors from the PIV analysis. The positive (+) values are in blue and indicate downward and rightward displacement for the vertical and horizontal displacement contours, respectively. The negative (−) values are in red and indicate upward and leftward displacement for the vertical and horizontal displacement contours, respectively. As aforementioned, the experiments were repeated twice to verify reproducibility (NC1, NC2, OC1, and OC2); the trends were similar, thus only representative figures evaluated in one test for the same conditions are presented in this paper (NC1 and OC1).
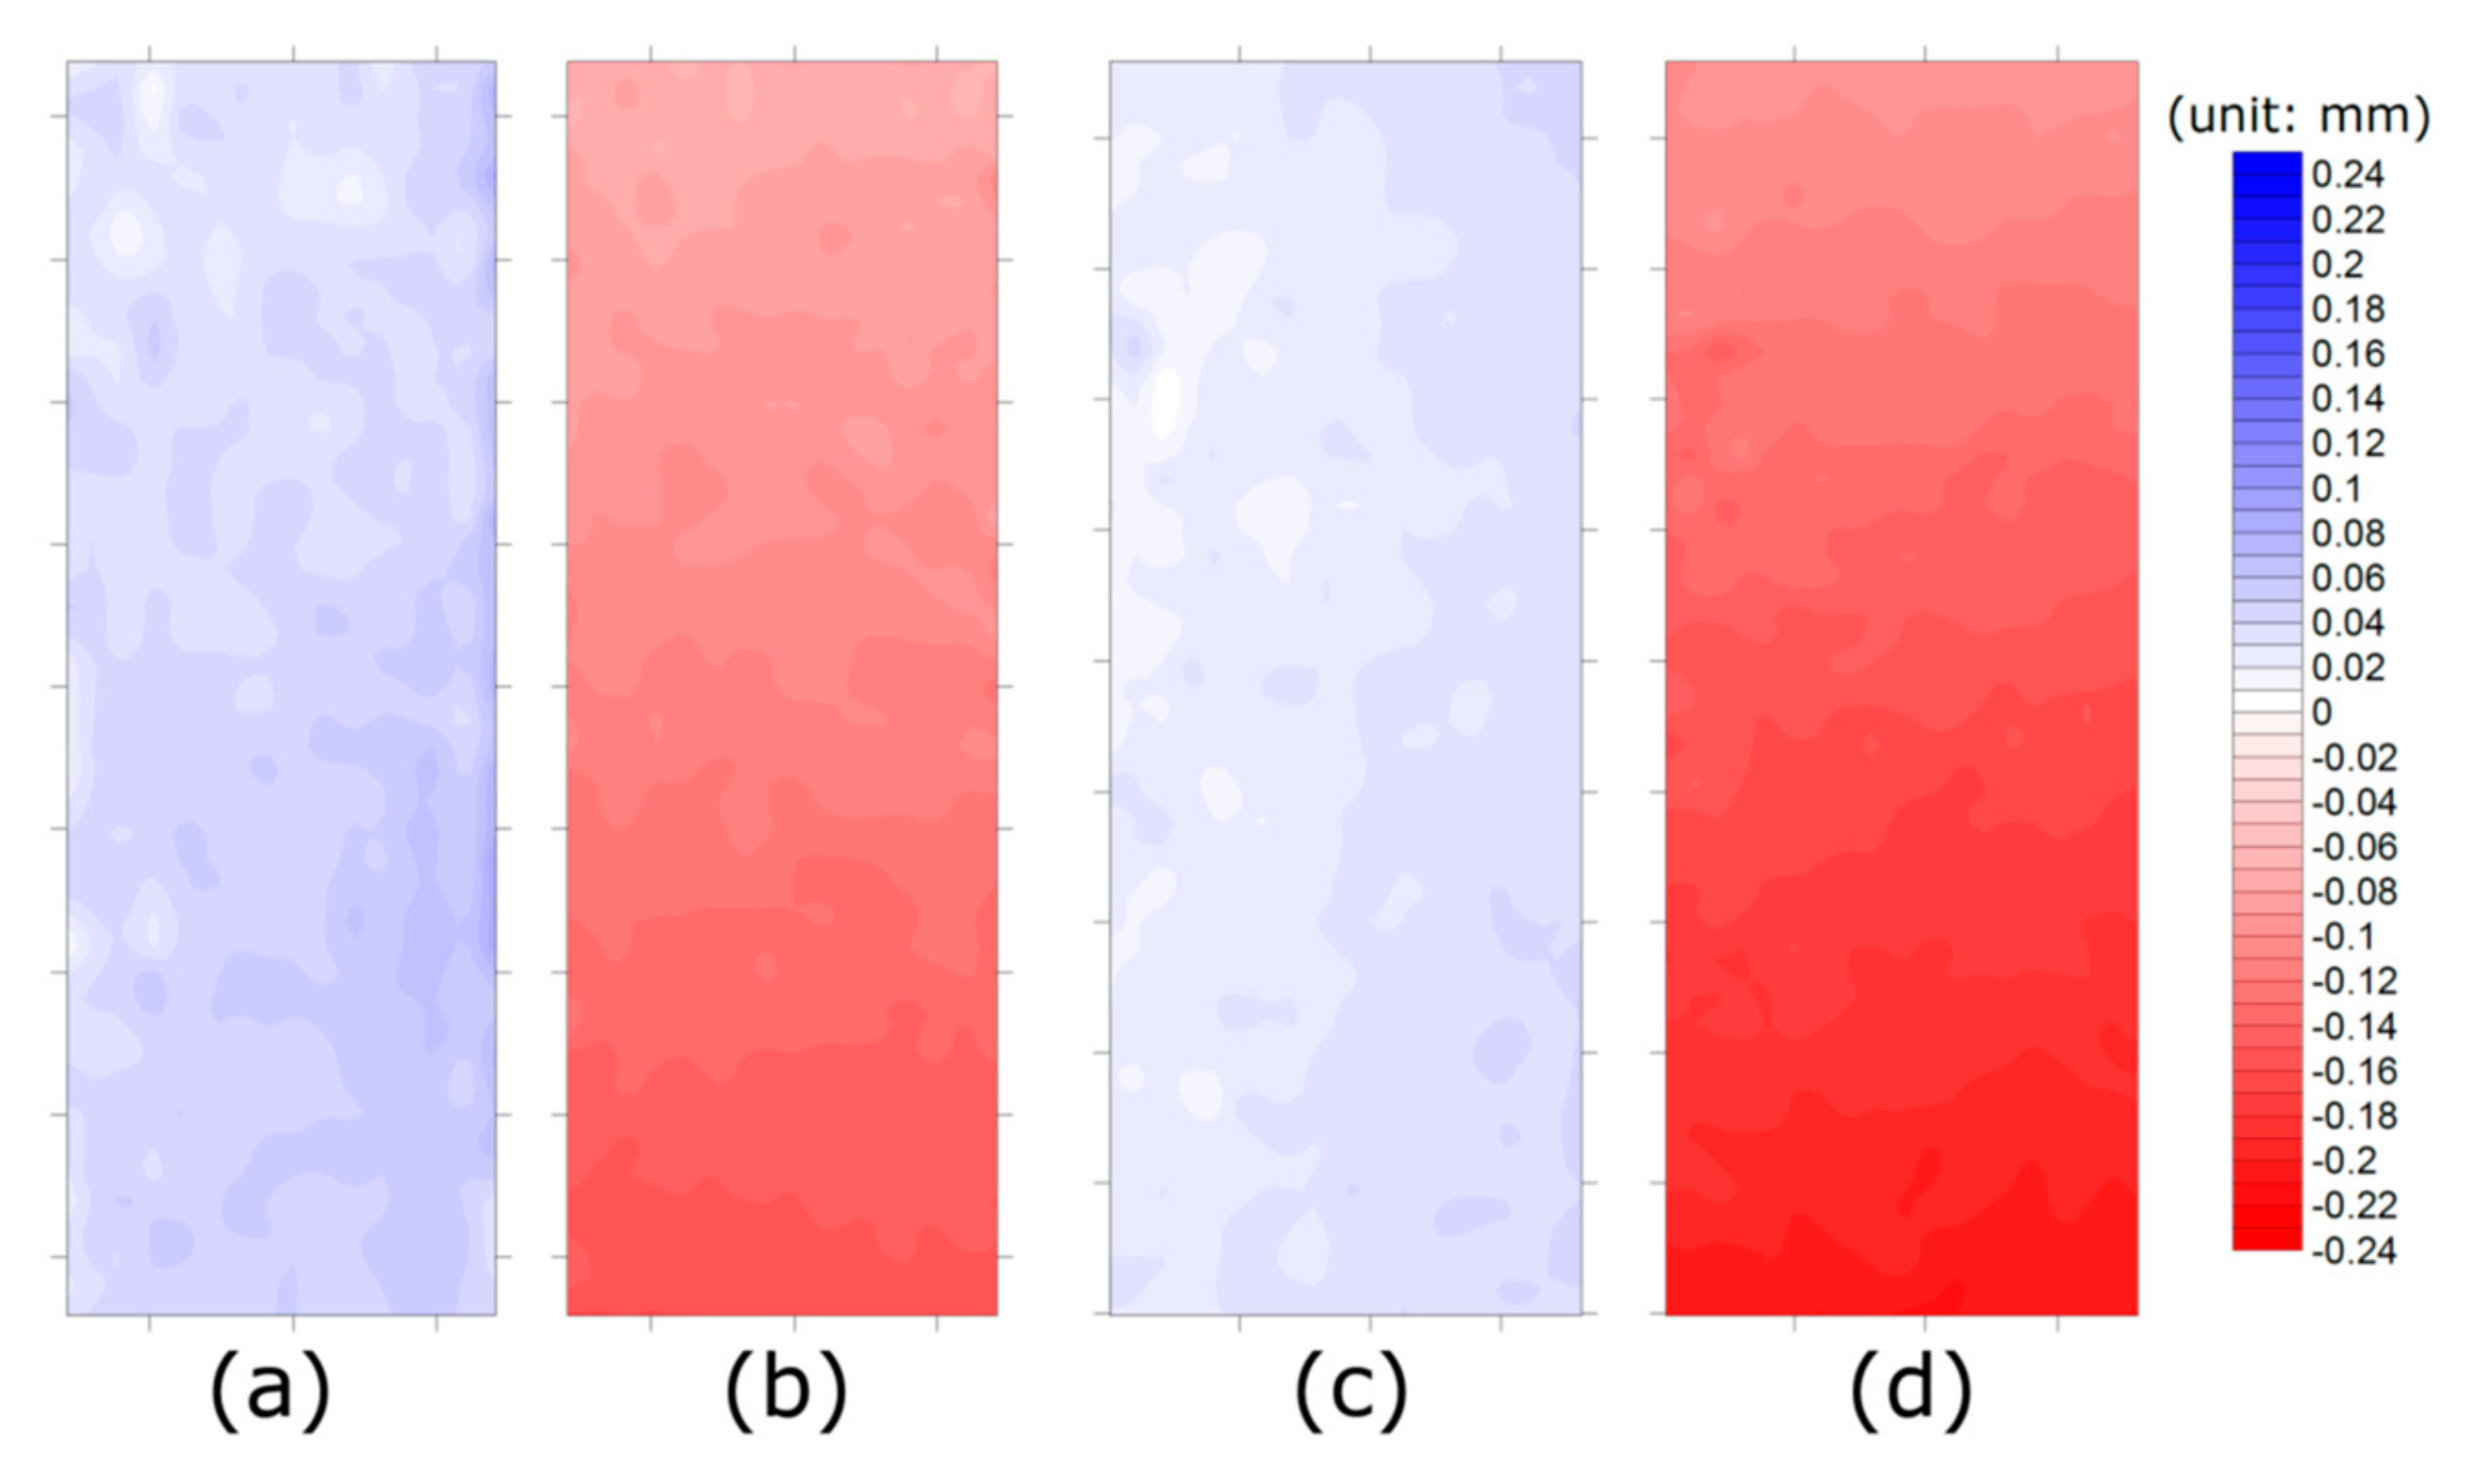
PIV was performed on the 0–0.25% strain interval in the initial stage immediately after axial stress was applied. Figure 8 shows the internal displacements in the NC and OC clays. As the vertical load was applied by raising the specimen, a large overall upward displacement occurred following the vertical upward movement of the specimen during shearing for both clays. However, no distinct deformation characteristics were identified with the vertical and horizontal contour lines. The initial stage in NC and OC clay showed a similar tendency with that of granular soils [17].
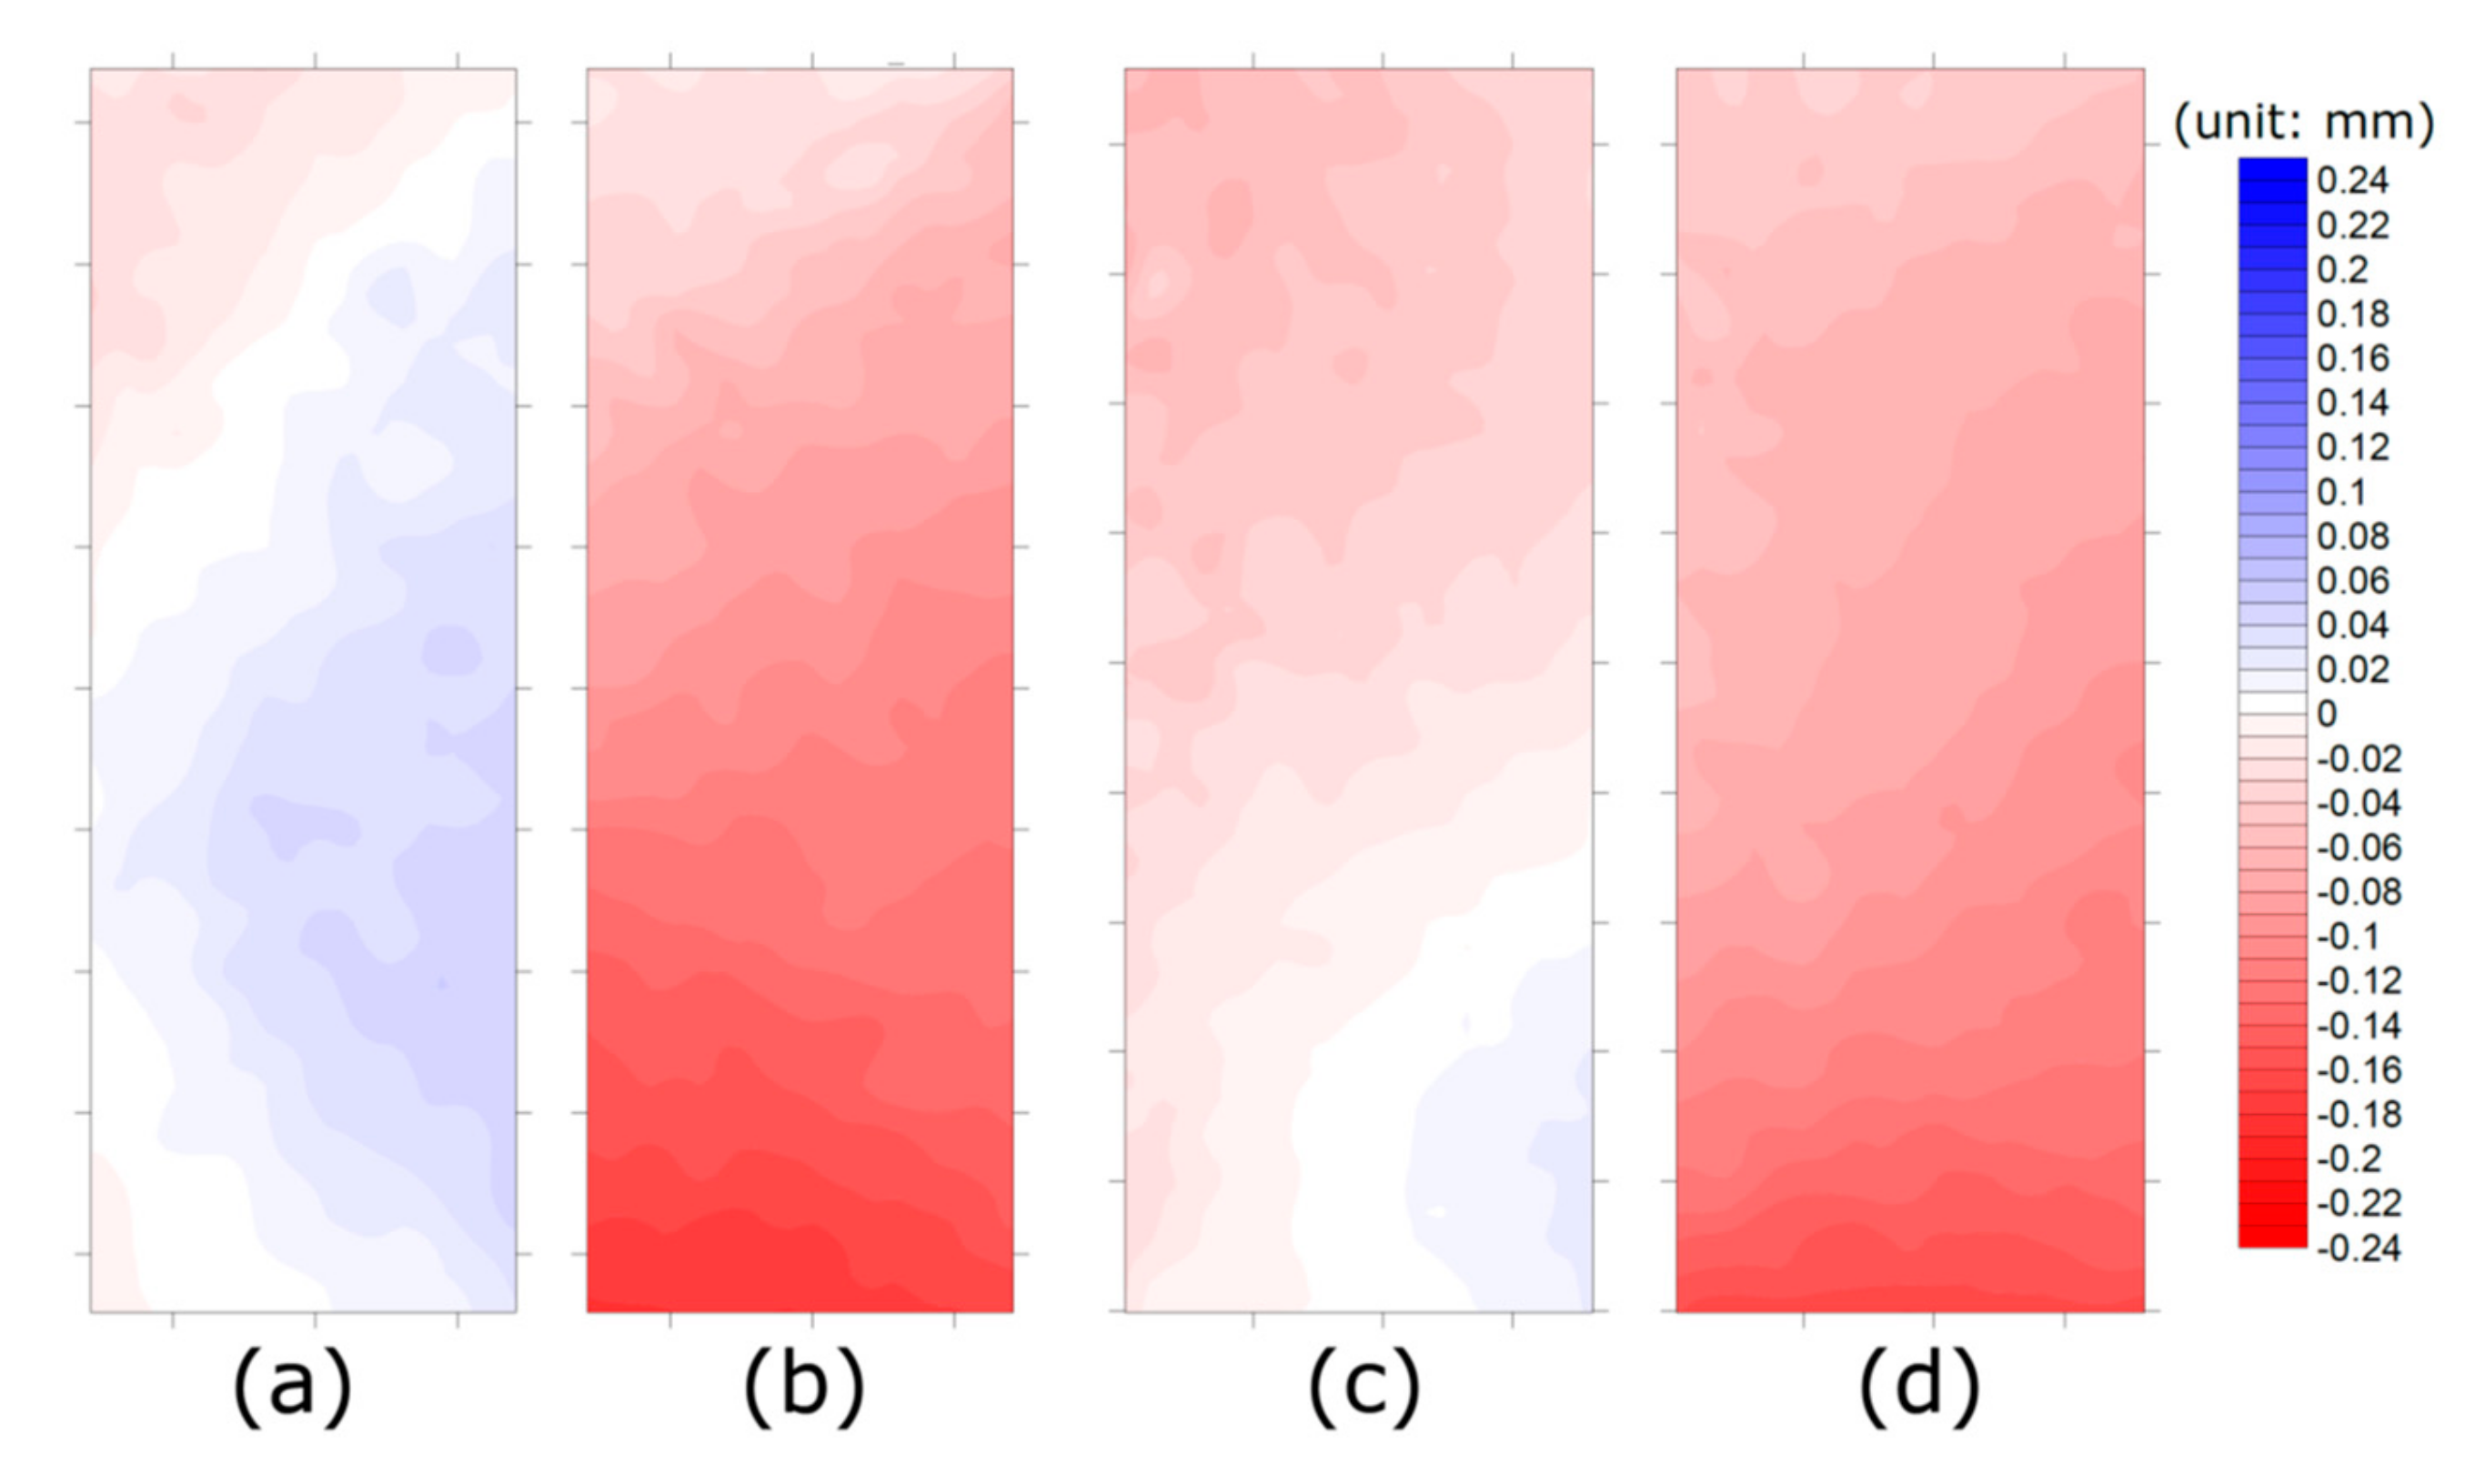
Figure 9 shows the displacement contours for the peak stage with 1.65–1.9% strain, which had the maximum deviatoric stress for both clays. In the case of the NC clay, the horizontal displacement contours indicate that the upper part of the specimen moved left and the lower part moved right centered around a point about one-third from the top of the specimen (Figure 9a). The vertical displacement contour lines indicate that the bottom part of the specimen showed a greater upward displacement than the top part centered around a point about one-third from the top. The top and bottom parts showed opposite displacement behaviors at the boundary of the potential failure surface (Figure 9b).
For the OC clay, the top part of the specimen showed leftward movement and the bottom part showed rightward movement centered around a point one-third from the bottom of the specimen (Figure 9c). The specimen’s bottom part showed greater upward displacement than the top part (Figure 9d). However, there was no clear difference in displacement at each location in the OC clay specimen compared to the NC clay in the peak stage. This confirmed that the development of the potential failure surface during shearing was delayed in the OC clay compared to the NC clay. In addition, in the case of granular soils [17], shear planes were clearly formed at the peak stage. Comparing the results between the sandy and clayey soils, it was found that shear surface formation was delayed in the clay.
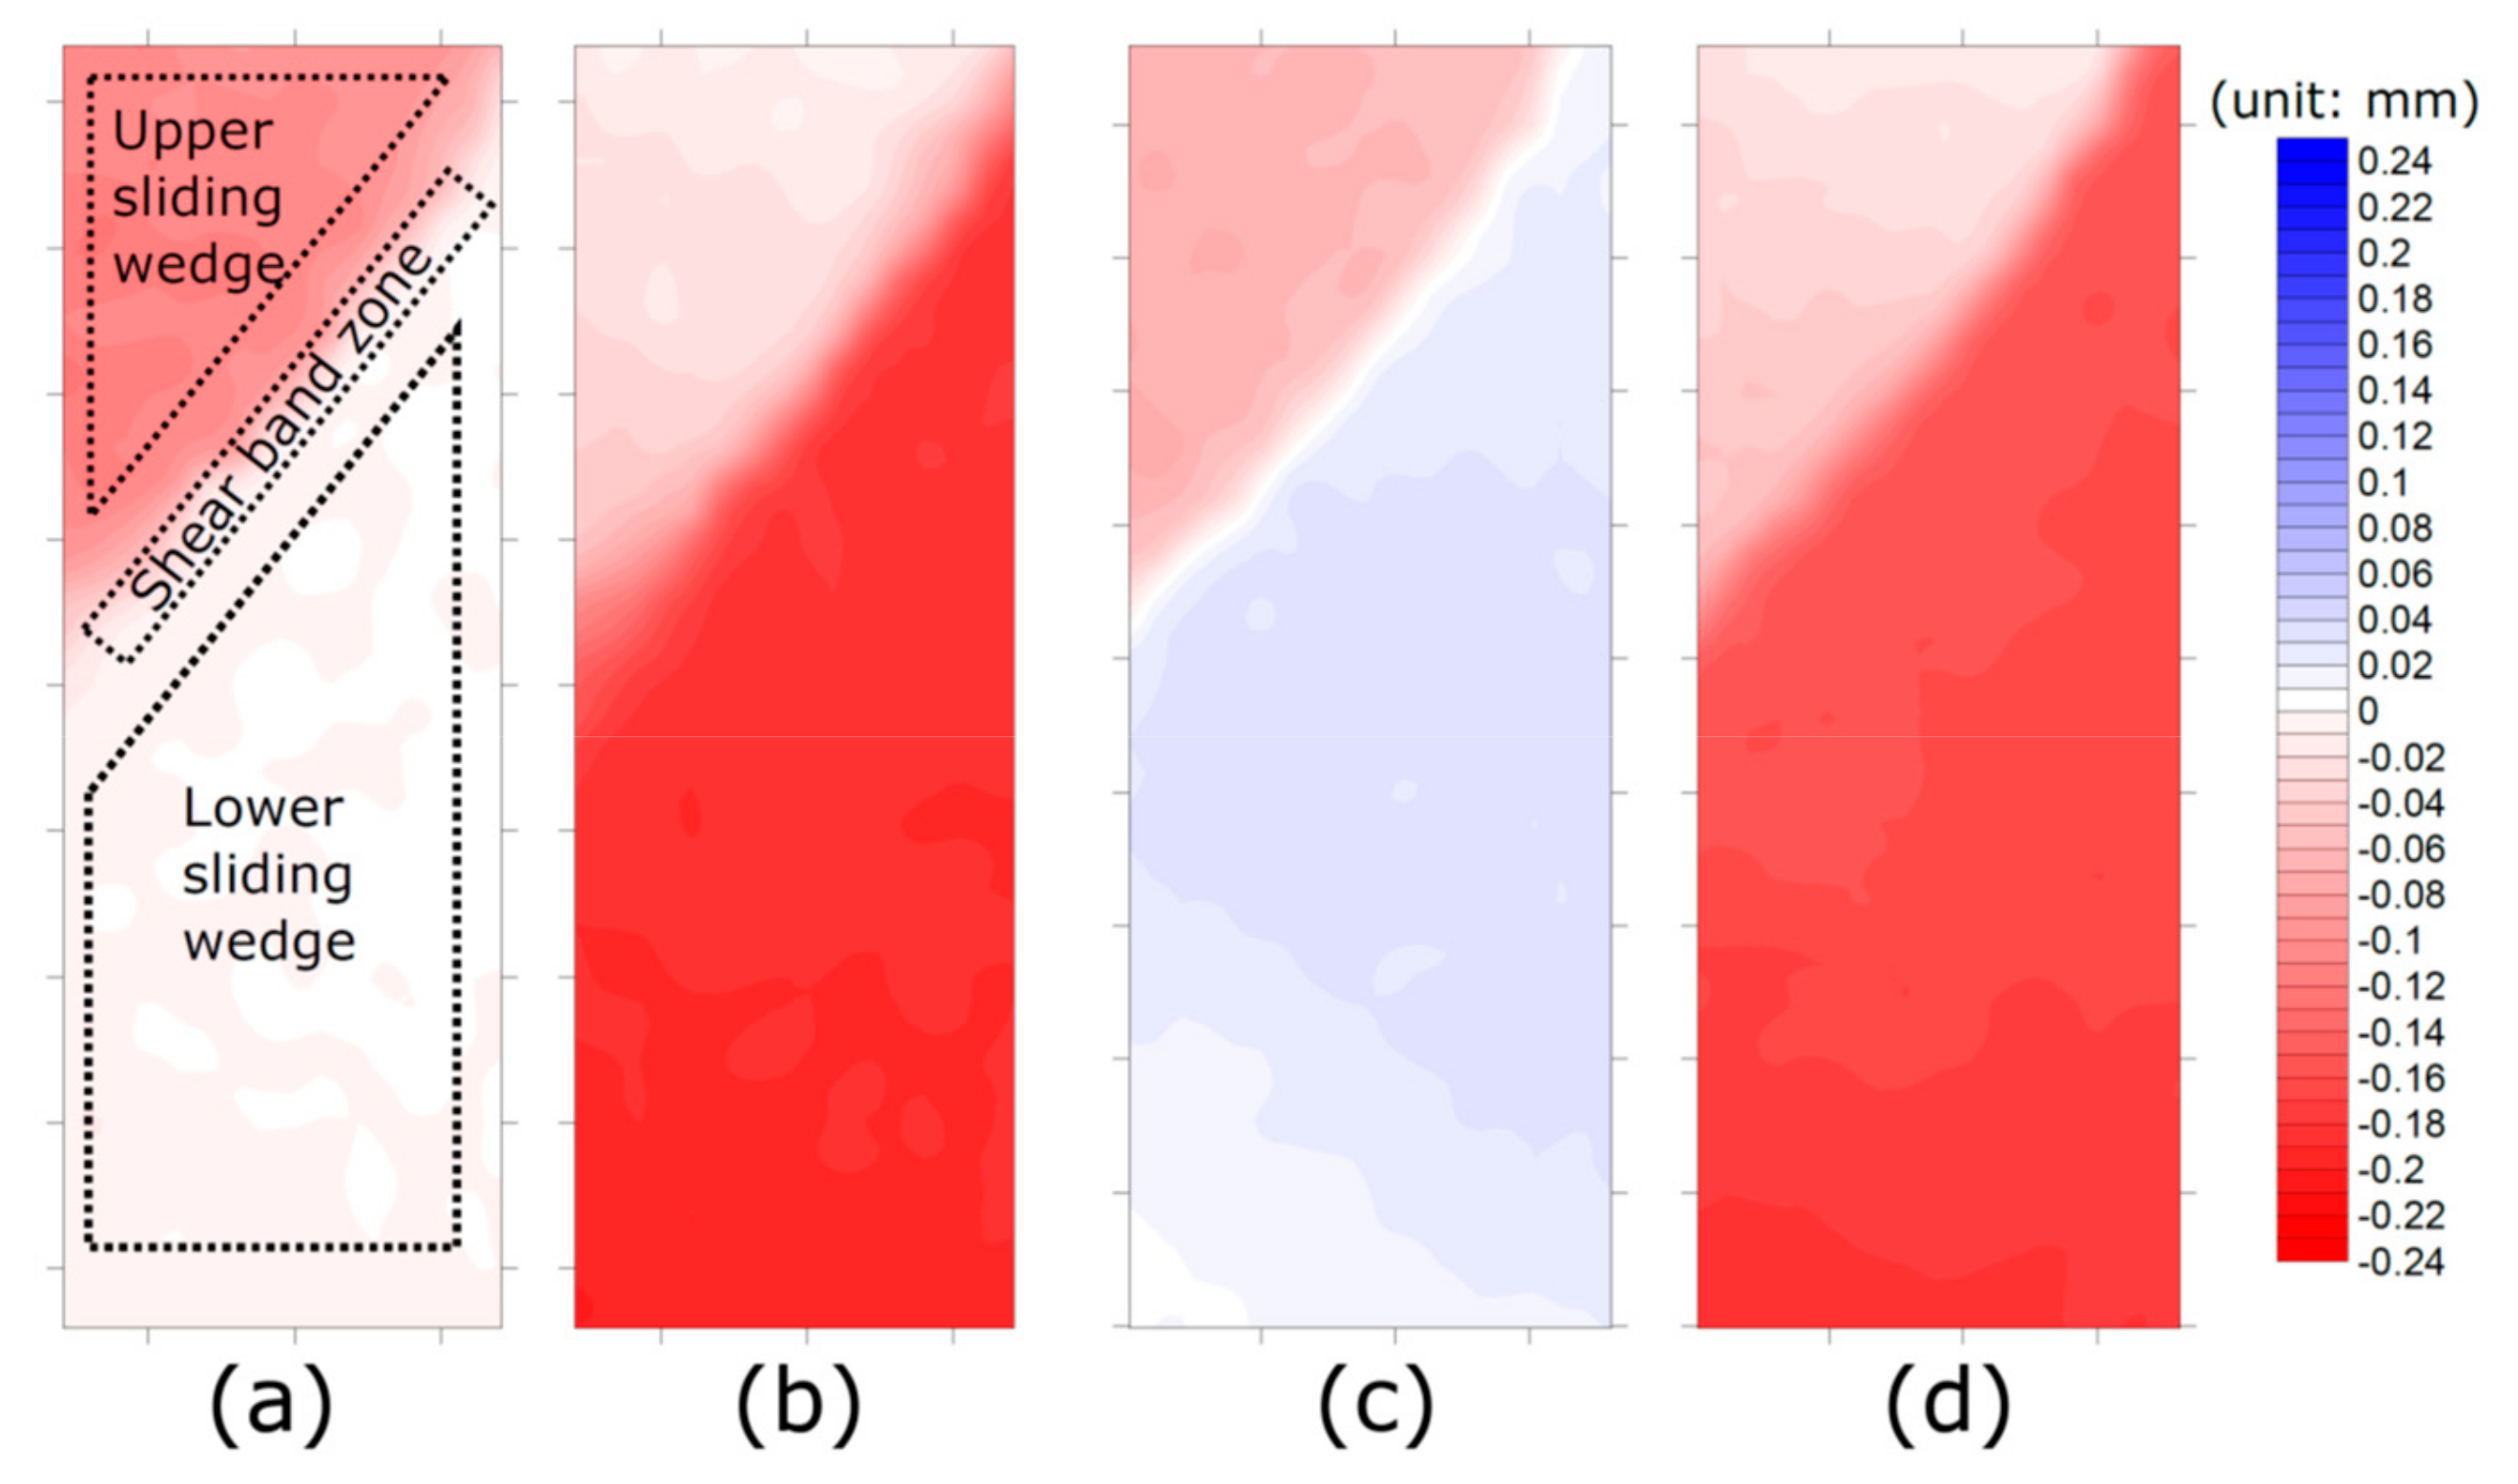
In the softening stage, the NC and OC clays were both divided into a shear band zone where the shear deformation was clearly concentrated and upper and lower sliding wedges occurred only where rigid-body movement occurred. Opposite behaviors occurred in the top and bottom parts centered on the shear band zone (Figure 10). The NC clay showed a maximum leftward horizontal displacement of 0.12 mm in the specimen’s top part but almost no vertical displacement (Figure 10a). In contrast, the specimen’s bottom part showed almost no horizontal displacement and a maximum upward displacement of only 0.2 mm (Figure 10b). For the OC clay, the specimen’s top part showed a maximum leftward displacement of 0.09 mm and upward displacement of 0.01 mm. The specimen’s bottom part showed a maximum rightward displacement of 0.04 mm and upward displacement of 0.19 mm. These results confirmed that the NC and OC clays showed similar behavior in the softening stage, but the lower sliding wedge of the OC clay showed additional rightward displacement.
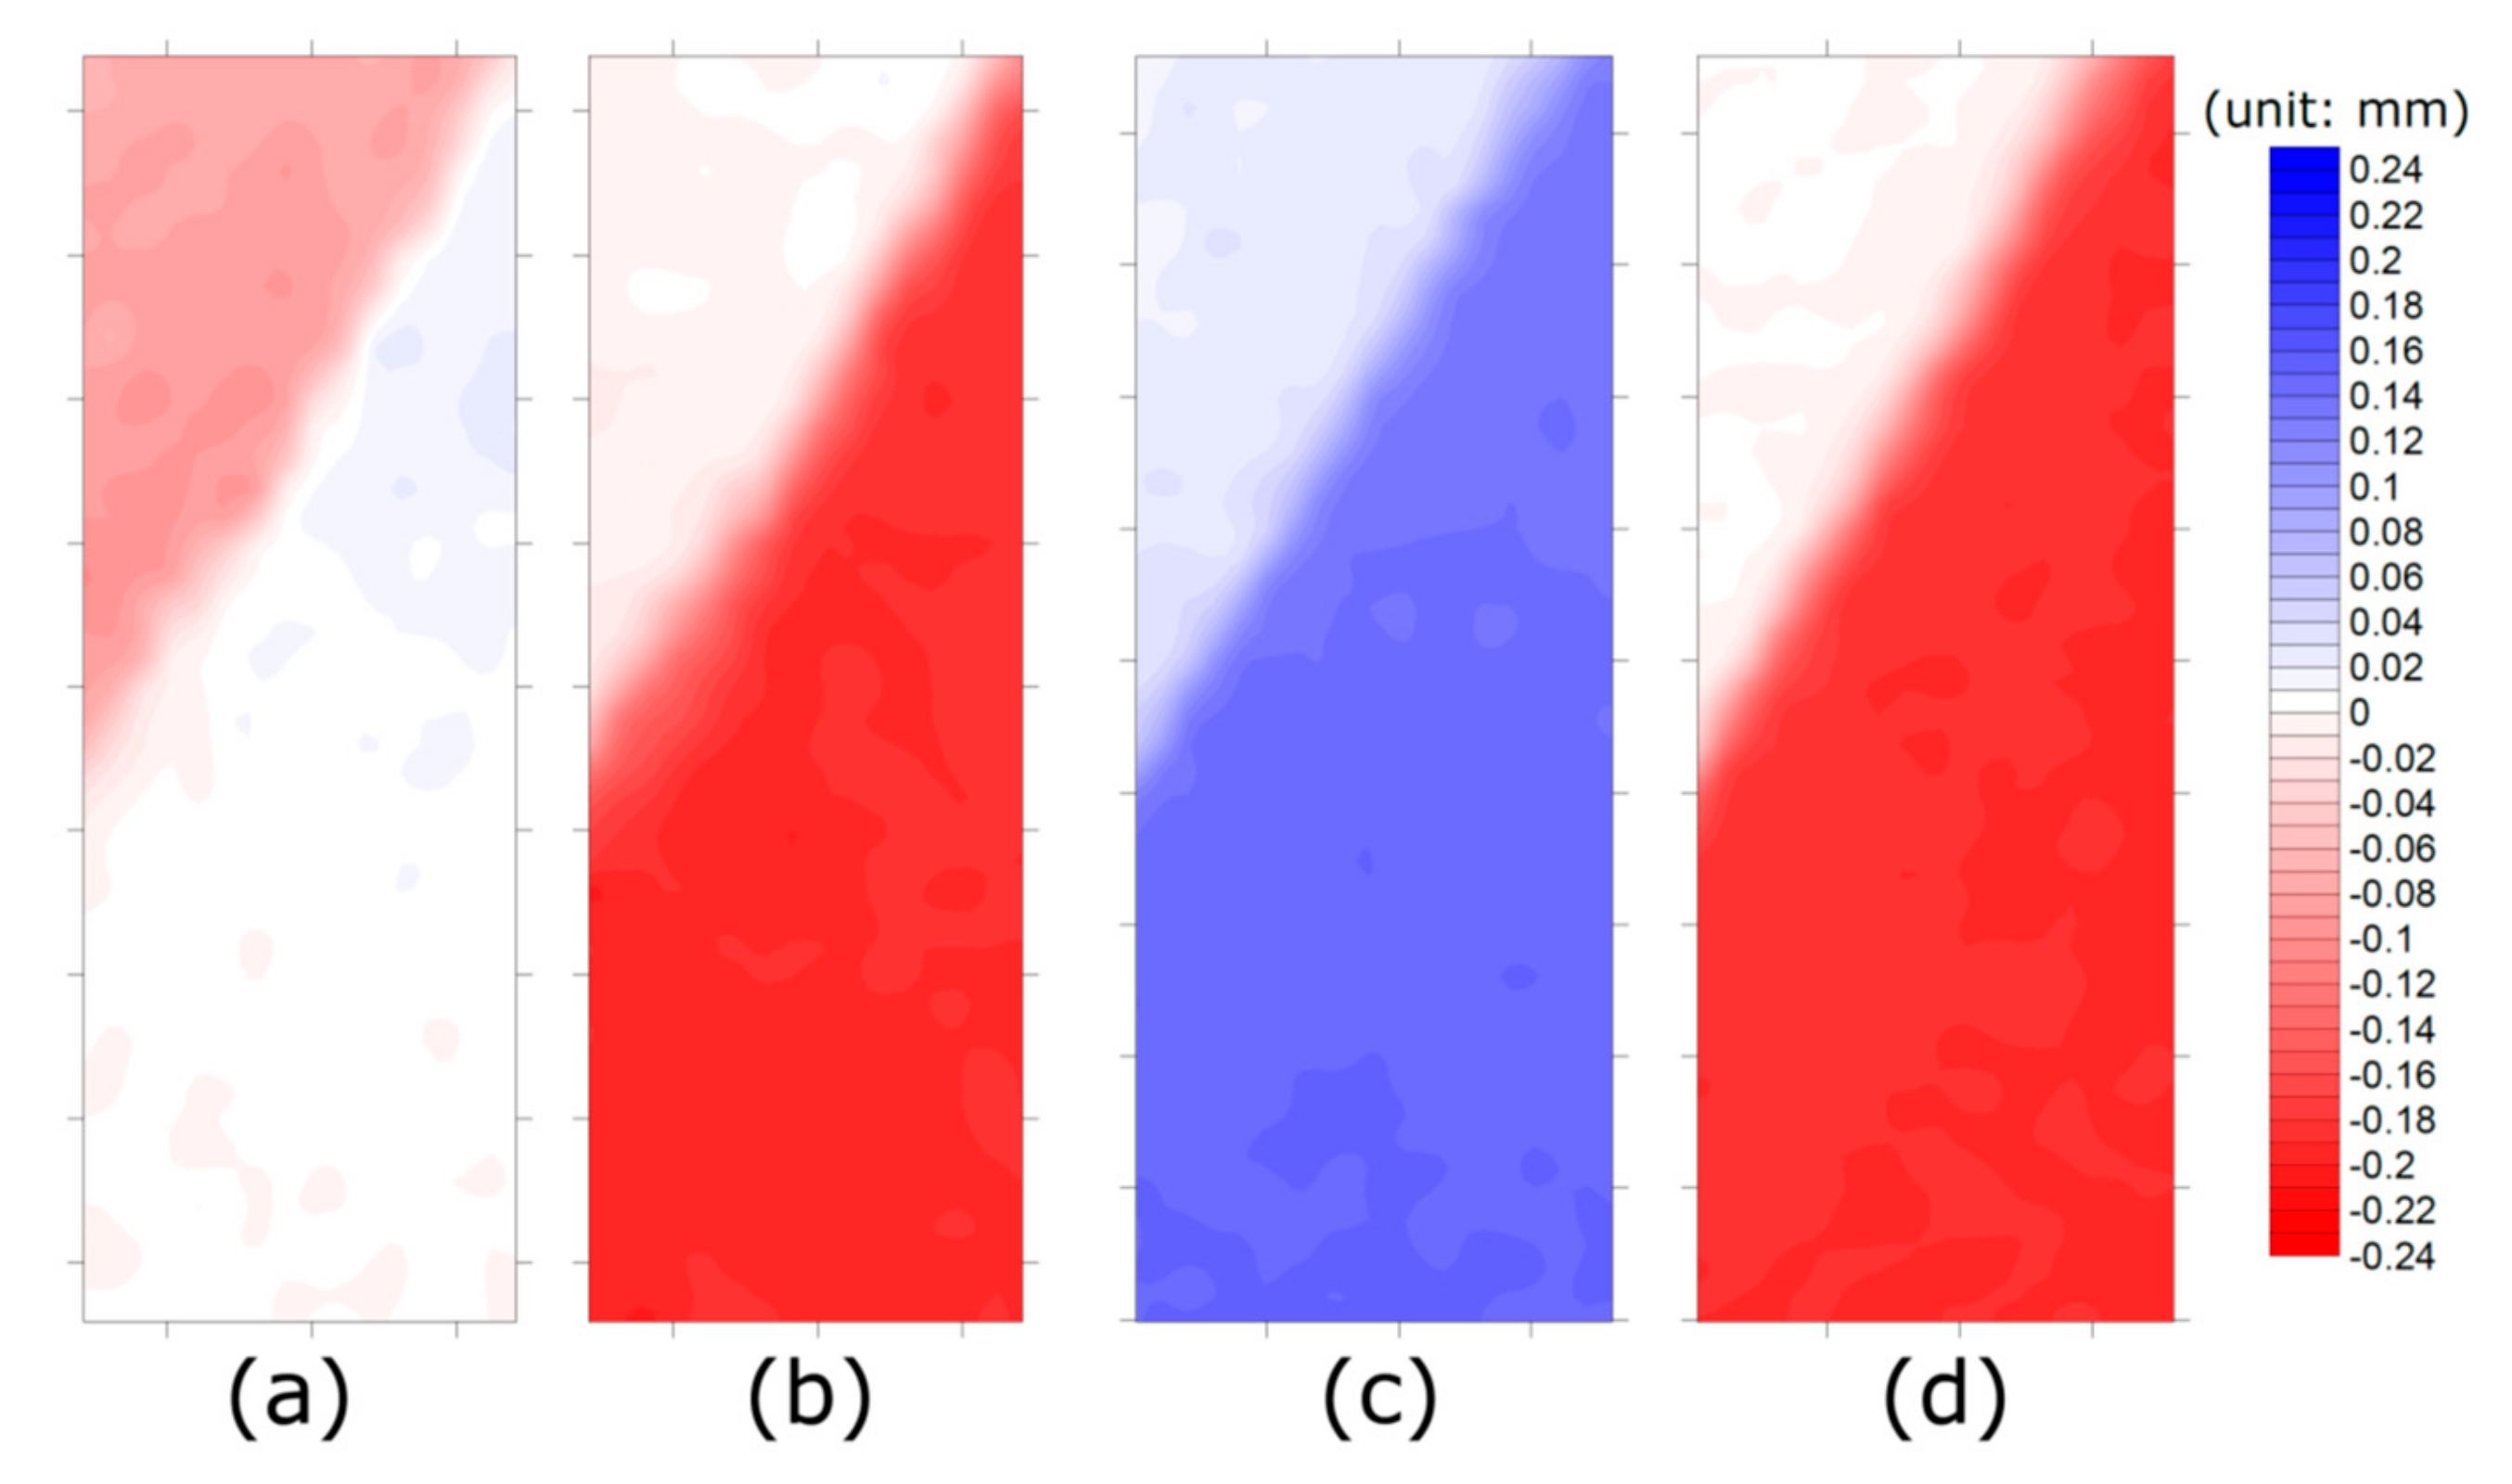
In the steady-state stage, the NC and OC clays both behaved similarly as in the softening stage (Figure 11). The NC clay’s upper and lower sliding wedges showed rigid-body movements with only leftward and upward displacements, respectively. The OC clay showed almost no displacement in the vertical direction, while there was a slight rightward displacement in the horizontal direction at the upper sliding wedge. The lower sliding wedge showed rigid-body movement with an upward and rightward displacement.

4.3. Shear Band Characteristics: Angle and Thickness

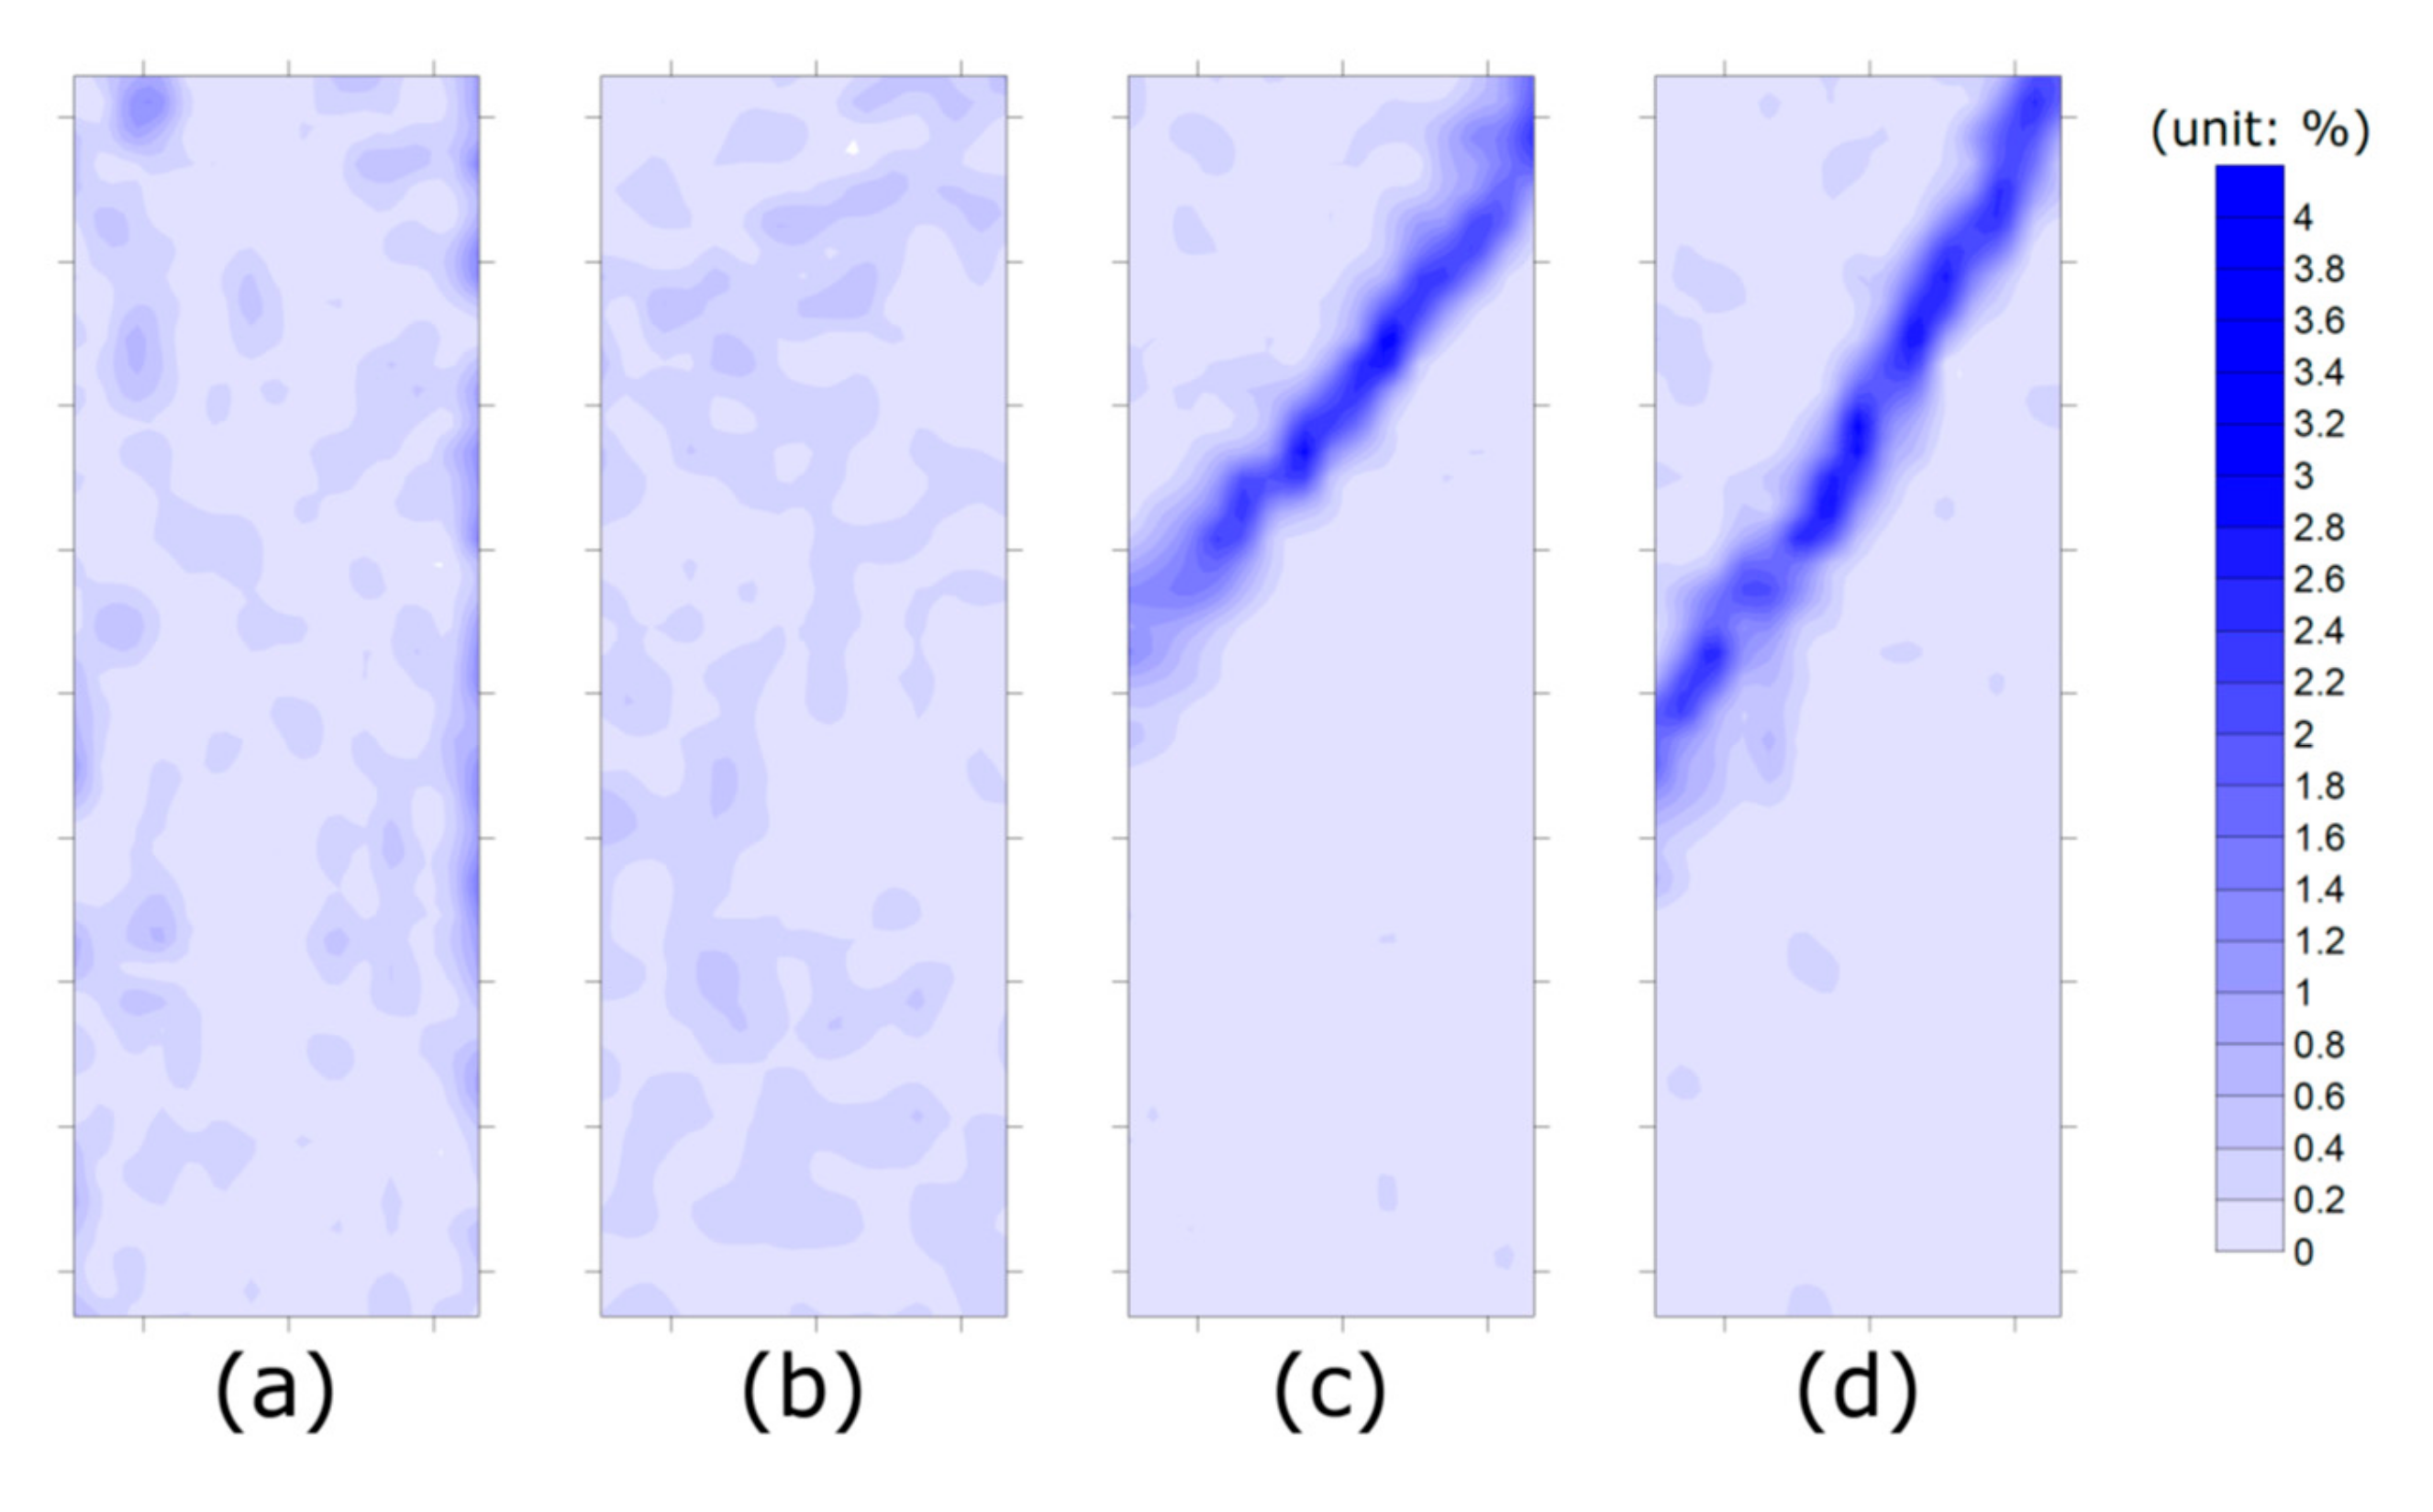
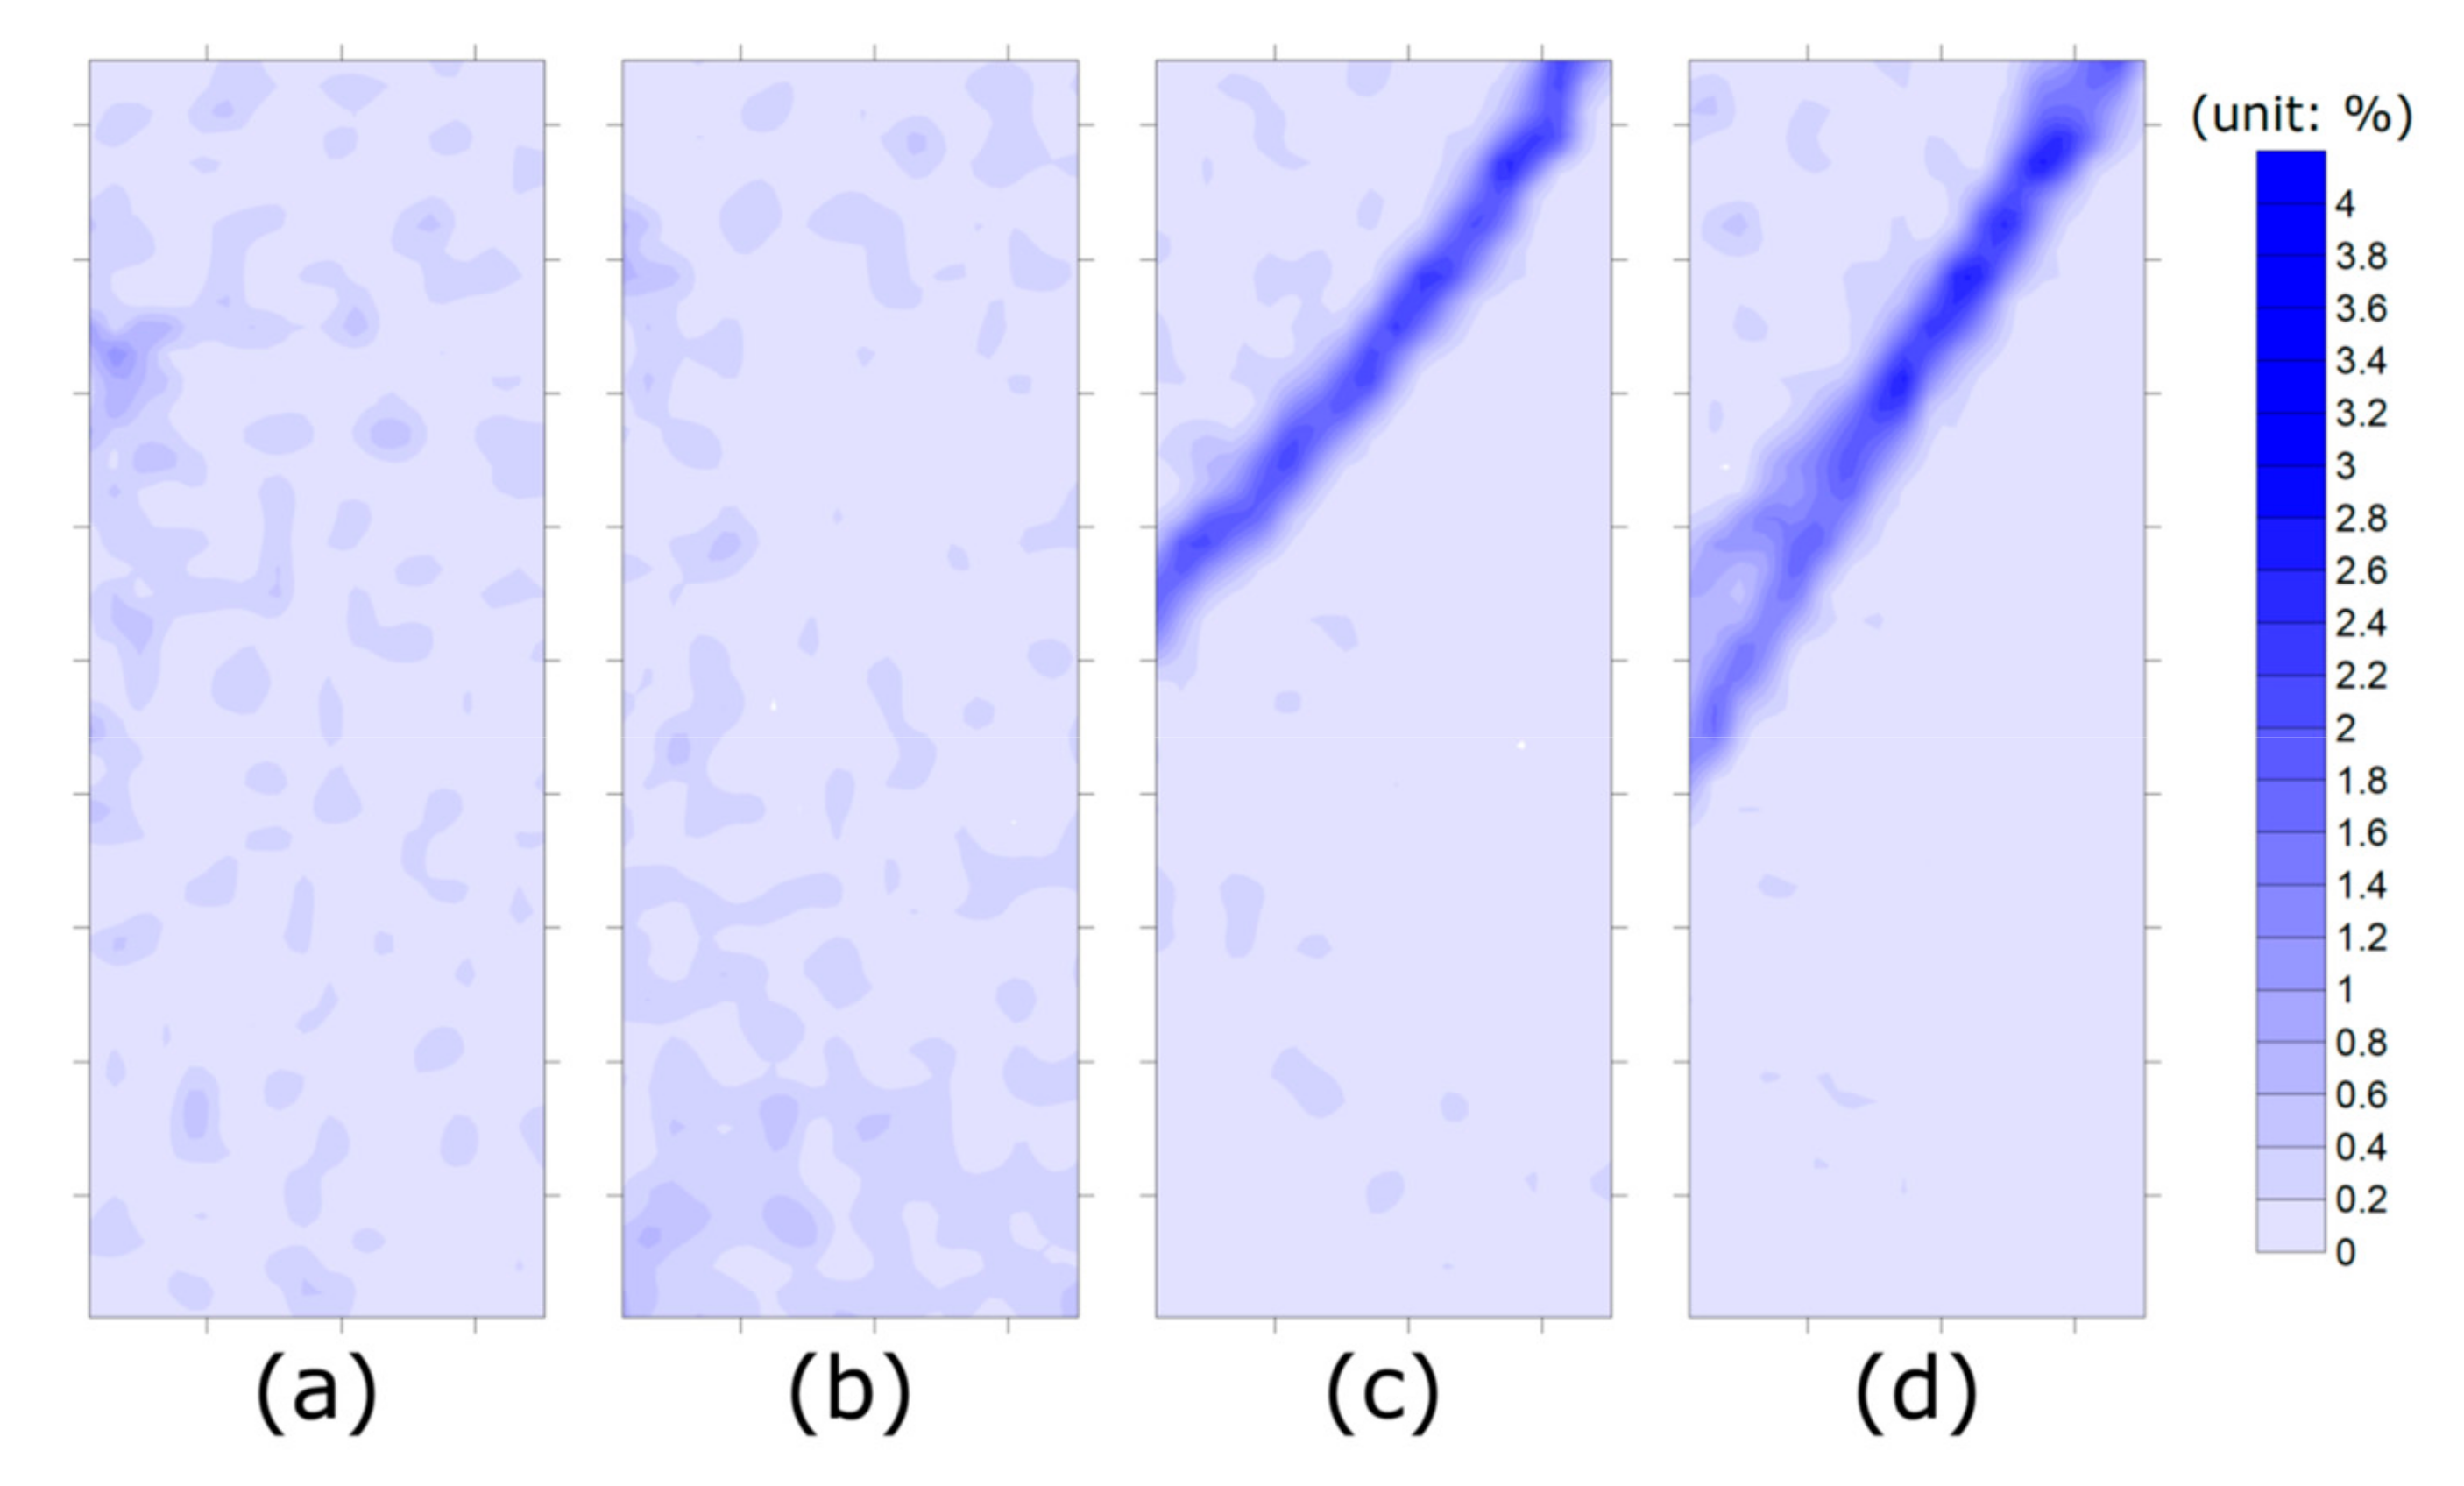
The shear strain was calculated with the displacement vectors from the PIV results for the four stress–strain behavior stages of the NC and OC clays. As the repeat test results were similar for each NC and OC clay, only the representative figures for NC1 and OC1 are shown in Figure 12 and Figure 13; all experiment results are tabulated in Table 3 and Table 4. Similar to the localized shear displacement, the localized shear strain did not show any particular behavior in the initial and peak stages of the four specimens. The NC clay vaguely showed a potential shear band in the peak stage (for both of NC1 and NC2). In both NC and OC clays, areas of shear strain concentration (shear band zone) formed in the softening stage and then gradually developed until the steady-state stage. As shear bands are normally characterized according to their slope and thickness [8,17,23,34], the slope and thickness were also used to characterize the shear bands of the NC and OC clays in this study.
Table 3 and Table 4 indicate the slope and thickness of shear bands for all experiments (NC1, NC2, OC1, and OC2). The slope of the shear band was measured as the average angle of the contour lines around the shear band ( θ m e a s u r e d in Table 3). This was compared to previous theories on the slope of the shear band after shearing is complete. Mohr and Coulomb criterion shows that failure occurs on the plane with the maximum ratio of the shear stress to the vertical confining stress. They calculated the shear band angle as follows:
θ M C = 45 ° +   ϕ / 2
where θ M C is the shear band angle calculated by Mohr and the Coulomb criterion and ϕ is the soil’s internal friction angle. Roscoe [35] experimentally confirmed that the shear band slope is more strongly related to deformation than stress and introduced the concept of the dilatation angle to propose the following shear band slope equation:
θ R = 45 ° + ψ / 2
where θ R is the shear band angle calculated by Roscoe [35] and ψ is the soil’s dilatation angle, which is calculated as the ratio of the volume strain to shear strain. Arthur et al. [36] showed that this equation did not agree with experimental results and proposed an equation that considers both the internal friction angle and dilatation angle:
θ A = 45 ° + ( ϕ + ψ ) / 4
where θ A is the shear band angle calculated by Arthur et al. [36]. Table 3 indicates that the shear band slopes of the NC1, NC2, OC1, and OC2 were 52.1°, 49.6°, 51.7°, and 52.3°, respectively, in the softening stage, which is similar to θ R that considers the dilatation angle of the soil. As noted above, the shear band starts to appear in the softening stage, and its slope continuously increases as the shearing progressed and remained fixed in the steady state. As shown in Table 3, the shear band slopes after shearing were complete (i.e., steady state) were 59.2° and 56.1° for the NC1 and NC2 and was between θ M C and θ A , as reported by other researchers [18,22,23,37]. In the case of OC clay, there is no existing research, but the final shear band slopes of 56.3° (for OC1) and 55.2° (for OC2) in this study (i.e., steady state) were similar to θ A . During shear band development, Jang et al. [17] showed that the inclination of the shear band of a granular soil decreased from the softening to the steady-state stage (which lies between θ MC and θ A ). These results indicate that θ M C , which considers only the internal friction angle and is widely adopted to represent the shearing behavior of clay, is not enough to calculate the final shear band slope of both NC and OC clays and that the dilatation angle should also be considered. In summary, the dilatation angle mainly influenced the softening stage when the shear band was continuously developing (while internal friction was influential in the softening stage of granular soils), and the internal friction angle was influential in the steady-state stage (i.e., after shearing was completed).
There are several previous studies on the thickness of shear band. For sandy soil, Roscoe [35], Oda et al. [34], Alshibli et al. [8], and Jang et al. [17] investigated the thickness of shear band, and they excluded the effect of the particle size on the shear band thickness by normalizing the thickness with an even particle distribution to the average particle diameter (D50). For clay, Rhee [22], Hicher et al. [37], and Gylland et al. [20] assessed the thickness of the shear band after shearing was completed. As the D50 of clay is very small, they did not normalize the shear band thickness. In this study, referring to previous relevant studies, the shear band was defined as the area where a shear strain increment of at least 1.0% occurred [17], and the thickness of this area was evaluated, as shown in Table 4, without normalization process [20,22,37]. In the softening stage, the thicknesses of the NC1, NC2, OC1, and OC2 were 4.42, 5.20, 3.84, and 4.66 mm, respectively. As the shearing progressed, the thicknesses gradually increased up to 7.56, 6.34, 6.56, and 7.01 mm, respectively (i.e., in the steady-state stage); these values showed good agreement with previous studies, indicating that the shear band thickness of clayey soil was 6–8 mm after shearing was completed [20,22,37]. It is interesting to note that the shear band thickness increases with the shearing process, unlike sandy soil, which gradually decreases with the development of shear band [17]. In this study, the thickness of shear band of clayey soil did not show any particular tendency between NC and OC clays. However, the effective confining stress of OC clay was less than that of NC clay, thus further research work with the experiments should be performed under the same effective confining stress.

5. Conclusions

This study evaluated the failure behavior of NC and OC clays based on their deformation and shear band characteristics as vertical stress was applied. Compressive tests were performed on reconstituted kaolinite under plane strain conditions, and digital images of the specimens were captured during the shearing process for analysis. The deformation behavior of the specimens was evaluated according to the vertical and horizontal displacements and the strain increment contour lines. The shear bands were characterized according to their slope and thickness. The conclusions are as follows:
  • Both clays showed no clear shear deformation in the initial stage (εa = 0–0.25%). In the peak stage (εa = 0.25–2.00%), the shear deformation started to become concentrated, but a clear failure surface still had not appeared. The development of the failure surface tended to be more delayed in the OC clay.
  • In the softening stage (εa = 2.00–5.00%), the specimens were divided into a shear band where the shear deformation was clearly concentrated as well as top and bottom parts where only rigid body movement occurred without shear deformation. In the steady-state stage (εa > 5.0%), the development of the shear band was completed, and the excess pore pressure remained at a fixed level.
  • The slopes of the shear bands that formed in the NC and OC clays were compared to those calculated from existing equations. In the softening stage, the shear band slopes of both clays were similar to that of Roscoe [35]. In the steady-state stage, the slope of the final shear band was between those of Mohr–Coulomb and Arthur et al. [36] for the NC clay and similar to that of Arthur et al. [36] for the OC clay. This indicates that the dilatation angle mainly influences the softening stage when the shear band is continuously developing and that the internal friction angle influences the steady-state stage when the shear band slope is gradually increasing.
  • For both clays, the shear band thickness tended to gradually increase as the shear band developed. In the softening stage, the thicknesses of the NC and OC clays were 4.42, 5.20, 3.84, and 4.66 mm, and they gradually increased up to 7.56, 6.34, 6.56, and 7.01 mm, respectively. The thickness of shear band of clayey soil did not show any particular tendency between NC and OC clays, but further research work with the experiments should be performed under the same effective confining stress of NC and OC clays.
The results of this study show the characteristics of shear bands that occur in clay and can be used to predict failure behavior and guide reinforcement at actual sites with soft ground. In addition, these experimental results can be extended to modeling the failure behavior of clayey ground. However, this study used one type of clay (commercial-grade EPK kaolinite) that has a low plasticity and low compressibility. Caution should be exercised when predicting the failure behavior in different soil (e.g., highly compressible or collapsible soil), whose shearing characteristics may considerably differ from those of the tested soil. The applicability of the results of this study should, thus, be verified for other types of clayey soil that exhibit significantly different plasticity or compressibility.

Author Contributions

Conceptualization, T.-Y.K. and C.-K.C.; methodology, J.K.; software, T.-Y.K.; validation, K.-H.P., C.-K.C., and S.-H.B.; formal analysis, T.-Y.K. and S.-H.B.; investigation, T.-Y.K.; resources, C.-K.C.; data curation, T.-Y.K.; writing—original draft preparation, T.-Y.K. and K.-H.P.; writing—review and editing, S.-H.B.; visualization, T.-Y.K. and J.K.; and supervision, C.-K.C. All authors have read and agreed to the published version of the manuscript.

Funding

This research was supported by a grant (code: 19SCIP-C151438-01) from Construction Technologies Program funded by Ministry of Land, Infrastructure and Transport of Korean government.

Acknowledgments

The Institute of Construction and Environmental Engineering at Seoul National University provided research facilities for this work. In addition, the support of Jin-Tae Han, research fellow of the Korea Institute of Civil Engineering & Building Technology, is greatly appreciated.

Conflicts of Interest

The authors declare no conflict of interest.

References

  1. Lambe, T.W.; Whitman, R.V. Soil Mechanics; John Wiley & Sons: Hoboken, NJ, USA, 1969. [Google Scholar]
  2. Lin, H.; Penumadu, D. Strain Localization in Combined Axial-Torsional Testing on Kaolin Clay. J. Eng. Mech. 2006, 132, 555–564. [Google Scholar] [CrossRef]
  3. Mokni, M. Relations entre deformations en masse et deformations localisees dans les materiaux granulaires. Ph.D Thesis, Université Joseph Fourier UJF, Grenoble, France, 1992. [Google Scholar]
  4. Desrues, J.; Chambon, R.; Mokni, M.; Mazerolle, F. Void ratio evolution inside shear bands in triaxial sand specimens studied by computed tomography. Géotechnique 1996, 46, 529–546. [Google Scholar] [CrossRef]
  5. Chaney, R.; Demars, K.; Wong, R. Shear Deformation of Locked Sand in Triaxial Compression. Geotech. Test. J. 2000, 23, 158. [Google Scholar] [CrossRef]
  6. Alshibli, K.A.; Batiste, S.N.; Sture, S. Strain Localization in Sand: Plane Strain versus Triaxial Compression. J. Geotech. Geoenvironmental Eng. 2003, 129, 483–494. [Google Scholar] [CrossRef]
  7. Kuo, C.Y.; Frost, J.D. Uniformity Evaluation of Cohesionless Specimens using Digital Image Analysis. J. Geotech. Eng. 1996, 122, 390–396. [Google Scholar] [CrossRef]
  8. Alshibli, K.A.; Sture, S. Sand Shear Band Thickness Measurements by Digital Imaging Techniques. J. Comput. Civ. Eng. 1999, 13, 103–109. [Google Scholar] [CrossRef]
  9. Jang, D.J.; Frost, J.D. Use of Image Analysis to Study the Microstructure of a Failed Sand Specimen. Can. Geotech. J. 2000, 37, 1141–1149. [Google Scholar] [CrossRef]
  10. Haines, S.H.; Van Der Pluijm, B.A.; Ikari, M.J.; Saffer, D.M.; Marone, C. Clay fabric intensity in natural and artificial fault gouges: Implications for brittle fault zone processes and sedimentary basin clay fabric evolution. J. Geophys. Res. Space Phys. 2009, 114. [Google Scholar] [CrossRef] [Green Version]
  11. Haines, S.H.; Kaproth, B.; Marone, C.; Saffer, D.; Van Der Pluijm, B. Shear zones in clay-rich fault gouge: A laboratory study of fabric development and evolution. J. Struct. Geol. 2013, 51, 206–225. [Google Scholar] [CrossRef]
  12. Wojatschke, J.; Scuderi, M.M.; Warr, L.N.; Carpenter, B.M.; Saffer, D.; Marone, C. Geochemistry, Geophysics, Geosystems. Geochem. Geophys. Geosyst. 2016, 17, 3865–3881. [Google Scholar] [CrossRef]
  13. Orellana, L.F.; Scuderi, M.M.; Collettini, C.; Violay, M. Frictional Properties of Opalinus Clay: Implications for Nuclear Waste Storage. J. Geophys. Res. Solid Earth 2018, 123, 157–175. [Google Scholar] [CrossRef]
  14. Finno, R.J.; Harris, W.W.; Mooney, M.A.; Viggiani, G. Shear bands in plane strain compression of loose sand. Géotechnique 1997, 47, 149–165. [Google Scholar] [CrossRef]
  15. White, D.J.; Take, W.A.; Bolton, M.D. Soil Deformation Measurement using Particle Image Velocimetry (PIV) and Photogrammetry. Geothechnique 2003, 53, 619–631. [Google Scholar] [CrossRef]
  16. Rechenmacher, A.L.; Finno, R.J. Digital Image Correlation to Evaluate Shear Banding in Dilative Sands. Geotech. Test. J. 2004, 27, 13–22. [Google Scholar] [CrossRef]
  17. Jang, E.-R.; Jung, Y.-H.; Kim, J.-Y.; Chung, C.-K. Assessment of Shear Band Characteristics in Granular Soils Using Digital Image Analysis Technique for Plane Strain Tests. J. Korean Geotech. Soc. 2011, 27, 51–65. [Google Scholar] [CrossRef] [Green Version]
  18. Saada, A.; Bianchini, G.; Liang, L. Cracks, bifurcation and shear bands propagation in saturated clays. Géotechnique 1994, 44, 35–64. [Google Scholar] [CrossRef]
  19. Callisto, L.; Calabresi, G. Mechanical behaviour of a natural soft clay. Géotechnique 1998, 48, 495–513. [Google Scholar] [CrossRef]
  20. Gylland, A.S.; Jostad, H.P.; Nordal, S. Experimental Study of Strain Localization in Sensitive Clays. Acta Geotech. 2014, 9, 227–240. [Google Scholar] [CrossRef]
  21. Sachan, A.; Penumadu, D. Strain Localization in Solid Cylindrical Clay Specimens Using Digital Image Analysis (Dia) Technique. Soils Found. 2007, 47, 67–78. [Google Scholar] [CrossRef] [Green Version]
  22. Rhee, Y. Experimental Evaluation of Strain-softening Behavior of Normally Consolidated Chicago Clays in Plane Strain Compression. Ph.D Thesis, Northwestern University, Evanston, IL, USA, 1991. [Google Scholar]
  23. Alshibli, K.A.; Akbas, I.S. Strain Localization in Clay: Plane Strain versus Triaxial Loading Conditions. Geotech. Geol. Eng. 2007, 25, 45–55. [Google Scholar] [CrossRef]
  24. Jang, E.-R.; Choo, Y.; Lee, W.-T.; Chung, C.-K. Restrained Effect of End Plate on Plane Strain Test Evaluated by Digital Image Correlation Method. J. Korean Geotech. Soc. 2008, 24, 25–36. [Google Scholar]
  25. Sheeran, D.E.; Krizek, R.J. Preparation of Homogenous Soil Samples by Slurry Consolidation. J. Mater. 1971, 6, 356–373. [Google Scholar]
  26. Zhang, Y.; Tan, T.; Leung, C. Application of particle imaging velocimetry (PIV) in centrifuge testing of uniform clay. Int. J. Phys. Model. Geotech. 2005, 5, 15–26. [Google Scholar] [CrossRef]
  27. Kim, J.; Woo, S.I.; Chung, C.-K. Assessment of non-uniform deformation during consolidation with lateral drainage using Particle Image Velocimetry (PIV). KSCE J. Civ. Eng. 2017, 22, 520–531. [Google Scholar] [CrossRef]
  28. Zhang, G.; Hu, Y.; Zhang, J.-M. New image analysis-based displacement-measurement system for geotechnical centrifuge modeling tests. Meas. J. Int. Meas. Confed. 2009, 42, 87–96. [Google Scholar] [CrossRef]
  29. Adrian, R.J. Particle-Imaging Techniques for Experimental Fluid Mechanics. Annu. Rev. Fluid Mech. 1991, 23, 261–304. [Google Scholar] [CrossRef]
  30. Kwak, T.Y.; Woo, S.I.; Kim, J.; Chung, C.-K. Model test assessment of the generation of underground cavities and ground cave-ins by damaged sewer pipes. Soils Found. 2019, 59, 586–600. [Google Scholar] [CrossRef]
  31. White, D.J.; Take, W.A. GeoPIV: Particle Image Velocimetry (PIV) Software for Use in Geotechnical Testing. Cambridge Univ. Eng. Dep. Tech. Rep. 2002, 322, 15. [Google Scholar]
  32. Kim, J.-Y.; Jang, E.-R.; Chung, C.-K. Evaluation of Accuracy and Optimization of Digital Image Analysis Technique for Measuring Deformation of Soils. J. Korean Geotech. Soc. 2011, 27, 5–16. [Google Scholar] [CrossRef] [Green Version]
  33. Gu, C.; Wang, J.; Cai, Y.; Sun, L.; Wang, P.; Dong, Q. Deformation characteristics of overconsolidated clay sheared under constant and variable confining pressure. Soils Found. 2016, 56, 427–439. [Google Scholar] [CrossRef]
  34. Oda, M.; Kazama, H. Microstructure of shear bands and its relation to the mechanisms of dilatancy and failure of dense granular soils. Géotechnique 1998, 48, 465–481. [Google Scholar] [CrossRef]
  35. Roscoe, K.H. The Influence of Strains in Soil Mechanics. Géotechnique 1970, 20, 129–170. [Google Scholar] [CrossRef]
  36. Arthur, J.R.F.; Dunstan, T.; Al-Ani, Q.A.J.L.; Assadi, A. Discussion: Plastic deformation and failure in granular media. Géotechnique 1978, 28, 125–128. [Google Scholar] [CrossRef]
  37. Hicher, P.; Wahyudi, H.; Tessier, D. Microstructural analysis of strain localisation in clay. Comput. Geotech. 1994, 16, 205–222. [Google Scholar] [CrossRef]
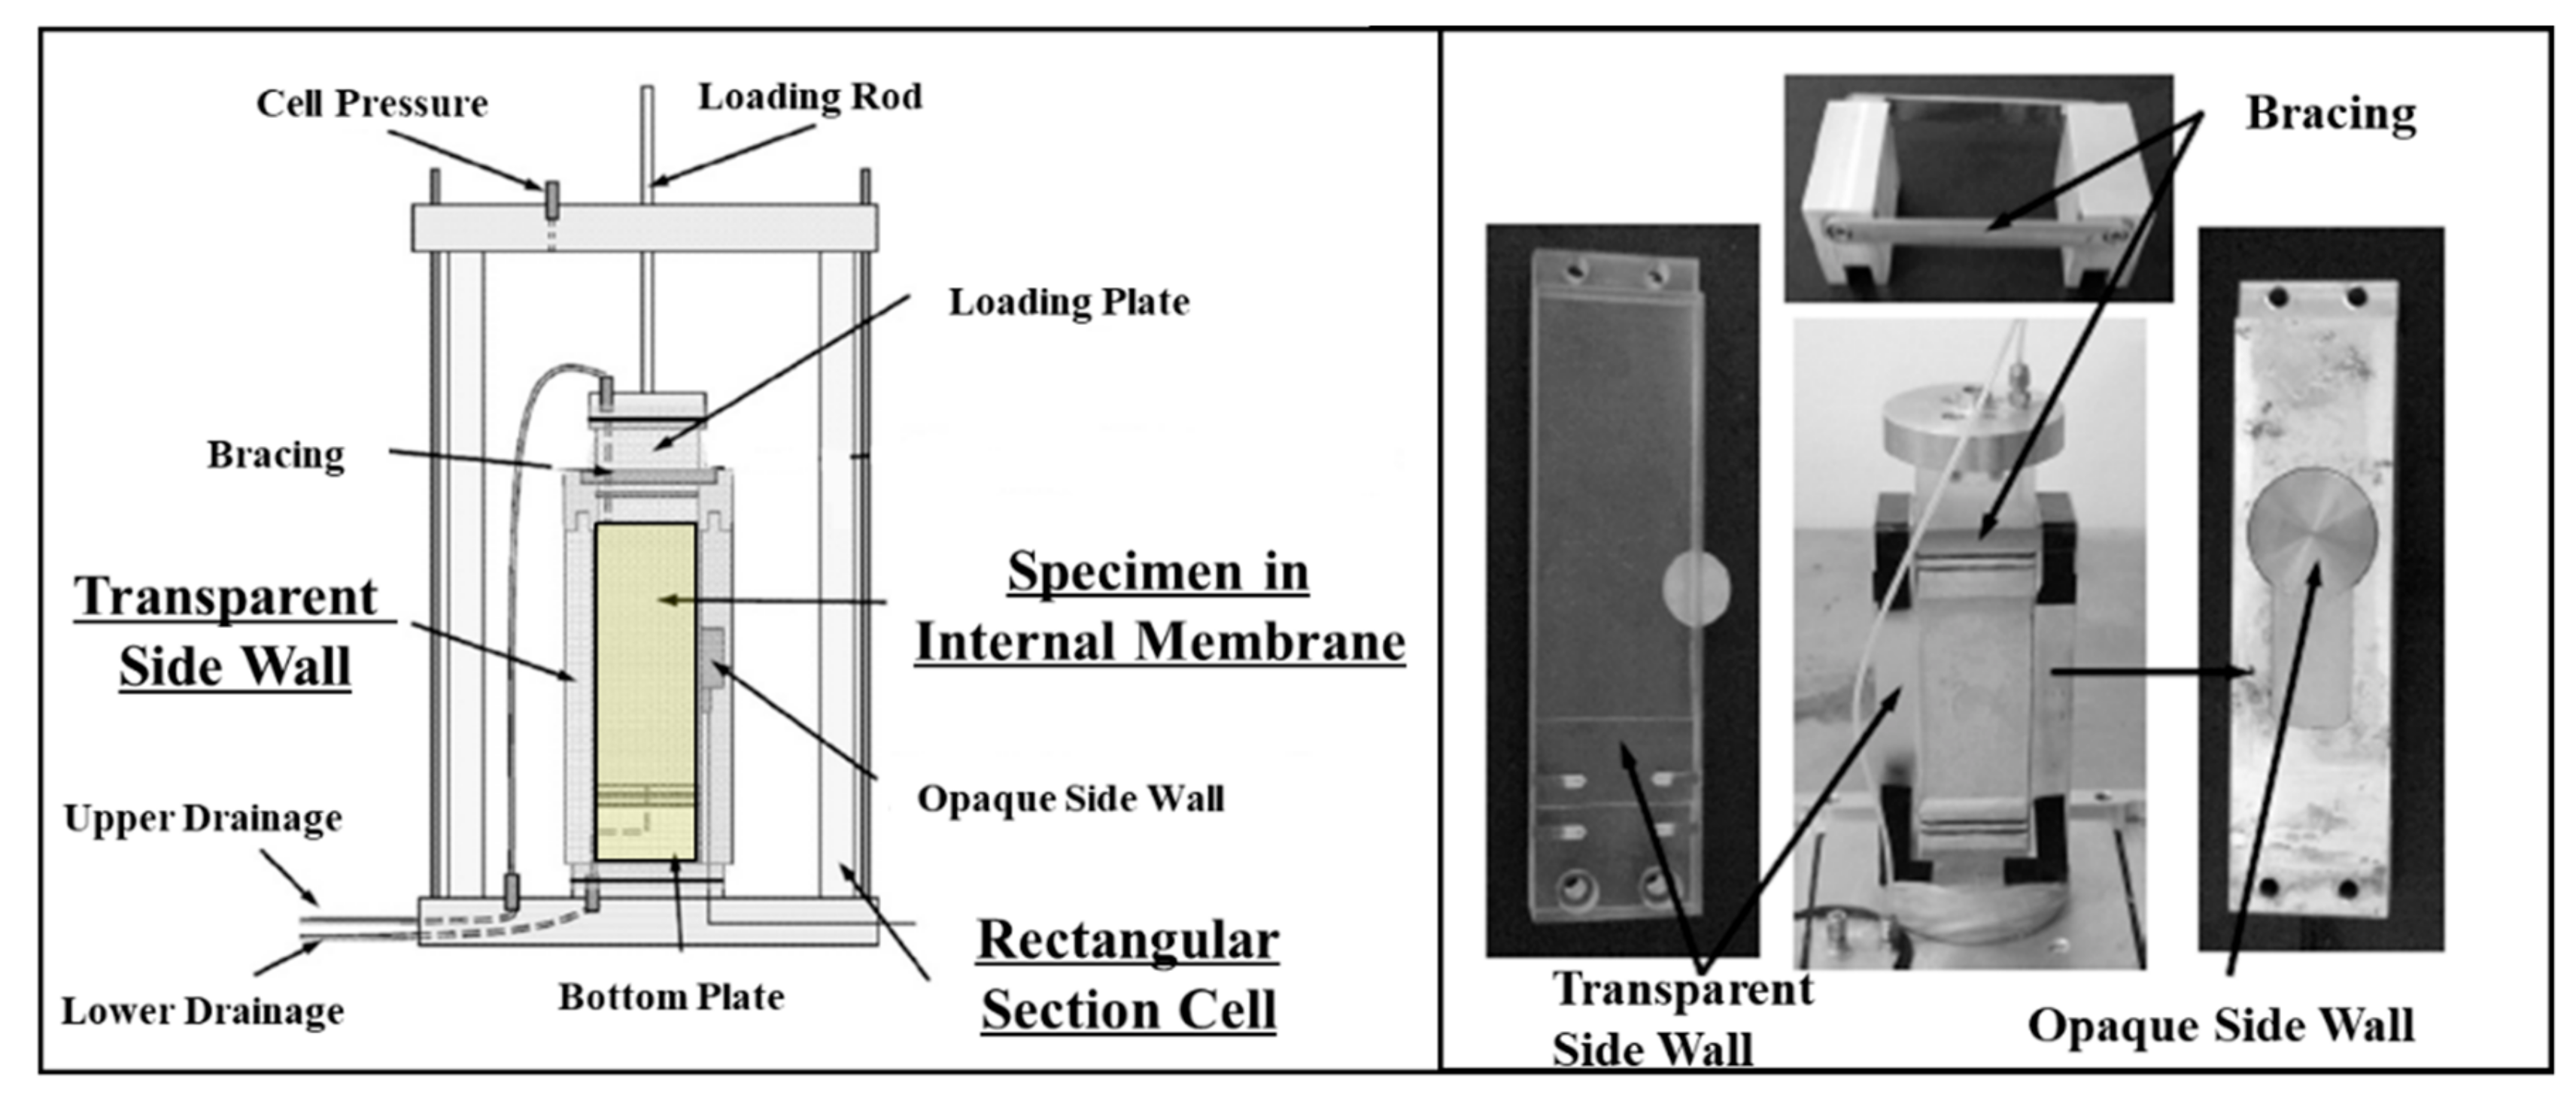
Figure 1. Plane strain testing apparatus.
Applsci 10 01139 g001
Figure 2. Artificial texture of the surface of the clay specimen.
Applsci 10 01139 g002
Figure 3. Flowchart of the experiments conducted in this study.
Applsci 10 01139 g003
Figure 4. Cross-correlation with the Particle image velocimetry (PIV) technique.
Applsci 10 01139 g004
Figure 5. Accuracy and precision of the GeoPIV program: accuracy (left) and precision (right).
Applsci 10 01139 g005
Figure 6. Selected pixel subsets and center points for the PIV technique.
Applsci 10 01139 g006
Figure 7. Stress–strain behavior for normally consolidated (NC) and over-consolidated (OC) clays.
Applsci 10 01139 g007
Figure 8. Displacement contours for the initial stage of stress–strain behavior (0–0.25% strain): (a) NC1 horizontal; (b) NC1 vertical; (c) OC1 horizontal; and (d) OC1 vertical.
Applsci 10 01139 g008
Figure 9. Displacement contours for the peak stage of stress–strain behavior (1.65–1.9% strain): (a) NC1 horizontal; (b) NC1 vertical; (c) OC1 horizontal; and (d) OC1 vertical.
Applsci 10 01139 g009
Figure 10. Displacement contours for the softening stage of the stress–strain behavior (2.9–3.15% strain): (a) NC1 horizontal; (b) NC1 vertical; (c) OC1 horizontal; and (d) OC1 vertical.
Applsci 10 01139 g010
Figure 11. Displacement contours for the steady-state stage of the stress–strain behavior (5.5–5.75% strain): (a) NC1 horizontal; (b) NC1 vertical; (c) OC1 horizontal; and (d) OC1 vertical.
Applsci 10 01139 g011
Figure 12. Increasing shear strain for NC1: (a) initial; (b) peak; (c) softening; and (d) steady state.
Applsci 10 01139 g012
Figure 13. Increasing shear strain for OC1: (a) initial; (b) peak; (c) softening; and (d) steady state.
Applsci 10 01139 g013
Table 1. Index properties of EPK kaolinite used in this study.
USCS ClassificationMH
Liquid Limit, LL (%)65.3
Plastic Index, PI (%)23.1
Plastic Limit, PL (%)42.2
Specific Gravity, Gs 2.62
Percent Finer than #200 Sieve (%)99.8
Table 2. Loading and unloading conditions during the consolidation stage.
DescriptionNC ClayOC ClayBack Pressure for Both Clays (u)
Effective Vertical Stress (σ1′)Effective Horizontal Stress (σ3′)Effective Vertical Stress (σ1′)Effective Horizontal Stress (σ3′)
Loading200 kPa100 kPa200 kPa100 kPa100 kPa
Unloading--50 kPa50 kPa100 kPa
Table 3. Inclination angles for each stage with the internal friction and dilatation angle.
DescriptionStage ϕ ψ θ M e a s u r e d θ M C θ R θ A
NC1Softening37.1°13.2°52.1°63.6°51.6°57.6°
Steady state36.7°7.1°59.2°63.4°48.6°56.0°
NC2Softening36.9°8.3°49.6°63.5°49.2°56.3°
Steady state36.1°1.5°56.1°63.1°45.8°54.4°
OC1Softening39.0°12.8°51.7°64.5°51.4°58.0°
Steady state37.9°9.4°56.3°64.0°49.7°56.8°
OC2Softening38.7°17.8°52.3°64.4°53.9°59.1°
Steady state38.1°9.3°55.2°64.1°49.7°56.9°
Table 4. Thickness of shear band for each stage.
DescriptionNC1NC2OC1OC2
Softening4.42 mm5.20 mm3.84 mm4.66 mm
Steady state7.56 mm6.34 mm6.56 mm7.01 mm