Article

Application of Support Vector Machine (SVM) in the Sentiment Analysis of Twitter DataSet

1
College of Electronic and Information Engineering, Beibu Gulf University, Qinzhou 535011, China
2
Ningde Zhongwei Network Technology Co., Ltd., Ningde 352100, China
3
Department of Electrical Engineering, Tamkang University, Tamsui 236, Taiwan
*
Authors to whom correspondence should be addressed.
Appl. Sci. 2020, 10(3), 1125; https://doi.org/10.3390/app10031125
Submission received: 23 December 2019 / Revised: 27 January 2020 / Accepted: 30 January 2020 / Published: 7 February 2020
(This article belongs to the Special Issue Intelligent System Innovation)

Abstract

:
At present, in the mainstream sentiment analysis methods represented by the Support Vector Machine, the vocabulary and the latent semantic information involved in the text are not well considered, and sentiment analysis of text is dependent overly on the statistics of sentiment words. Thus, a Fisher kernel function based on Probabilistic Latent Semantic Analysis is proposed in this paper for sentiment analysis by Support Vector Machine. The Fisher kernel function based on the model is derived from the Probabilistic Latent Semantic Analysis model. By means of this method, latent semantic information involving the probability characteristics can be used as the classification characteristics, along with the improvement of the effect of classification for support vector machine, and the problem of ignoring the latent semantic characteristics in text sentiment analysis can be addressed. The results show that the effect of the method proposed in this paper, compared with the comparison method, is obviously improved.

1. Introduction

As an emerging field, text sentiment analysis has great potential in research and practical applications, helping explain that the research of text sentiment analysis has been attracting increasingly more attention at home and abroad [1,2,3]. Statistical methods, such as keyword matching method, are adopted in most of the thematic information mining for information mining. However, this method can only be used to retrieve documents with same or similar theme keywords, not to calculate the opinions and emotions of documents. Moreover, it is generally acknowledged that the thematic information cannot be searched simply by keywords in some cases. Although it can be classified into related topics, it holds contradictory or neutral emotional views. Thus, when conducting sentiment analysis of such texts, it is necessary to analyze not only the themes, but also the viewpoints and positions, that is, text orientation. Moreover, in terms of the dominant research methods in sentiment analysis, the situations of “Synonymy” and “Polysemy” in natural language and the semantic correlations between vocabulary and document are often ignored in the process of modeling [4,5]. Even more, other features, such as Semantic Structure, the latent semantic information of documents, are also ignored [6]. Overall, these problems can influence the degree of coincidence between the sentiment analysis and the actual semantics, thus affecting the accuracy of the sentiment analysis. Thus, how to solve these problems and improve the accuracy of sentiment analysis has become a challenging research topic.

1.1. Kernel Function

So far, in support of vector machines, the research on the theory of kernel function has been focusing mainly on the following aspects. The first one is the properties of kernel function. To be more specific, some properties of Mercer kernel are deeply studied and discussed in reference [7]; for example, Burges studied the nature of kernel functions from a geometric point of view [8]. The second one is the construction and improvement of kernel function. For example [9], Tao Wu, Hangen He et al. regard the construction of kernel function as a function interpolation problem, proposing that it is not necessary to construct explicit function satisfying Mercer condition. The key to the performance difference of the kernel function is to determine the inner product value between the test samples and the training samples according to the inner product between the training samples. It is not necessary to construct the analytic expression of the kernel functions when using this method, for which can directly construct the kernel functions from the samples, thus opening up a new channel for the construction of the kernel functions. However, this method is disadvantageous due to too large amount of calculation when solving the actual classification problem. Amari et al. [10], through conducting the Riemann geometric analysis of kernel function, gradually modified the existing kernel function based on experimental data, to make it better matched with the actual problem. The third one is the selection of the kernel function. Through literature review [11], a method of selecting the kernel function based on hybrid genetic algorithm for addressing the upper limit of Loo upper bound is proposed. Fengting Jia [12] proposed two methods to automatically determine the kernel function, namely, the parameter determination method based on the matrix similarity measure, and the parameter determination method based on the separable kernel function. These two methods are commonly advantageous due to their small amount of calculation and the convenient calculation, but disadvantageous in that the parameters obtained by using the two methods are usually satisfactory solutions rather than optimal solutions.
The usual methods of selecting kernel functions to solve practical problems are as follows. Firstly, kernel functions are selected in advance based on the prior knowledge of experts; secondly, Cross-Validation method is adopted, that is, different kernel functions should be tried separately when selecting kernel functions, with the kernel function with the smallest error as the best kernel function. For example, aiming at the Fourier kernel and RBF kernel, combined with the function regression problem in signal processing problems, simulation experiments show that the error of SVM with Fourier kernel is much less than that with RBF kernel under the same data conditions. The third one, also known as the mainstream method for selecting kernel functions at present, is to use the hybrid kernel function method proposed by Smits et al. [13], which is also the pioneering work of constructing kernel functions.

1.2. LSA & PLSA

Also known as the Latent Semantic Index, Latent Semantic Analysis (LSA) preserves the method of calculating the similarity between terms and documents expressed by space vectors by using the angle between the space vectors in the traditional vector space model. Besides, the words and documents are further mapped into the latent semantic space, along with the mining of the underlying semantics and latent topics under the text and document surface, thereby improving the effect of information retrieval. The essence of the latent semantic analysis method is to find out the true semantics of the vocabulary in the document, and then dig out the topic not dependent on vocabulary in the document, that is, the latent semantic theme, to address the related problems and deficiencies caused by the inability to consider the latent semantic in the Vector Space Model [14]. Because LSA expresses each word as a point in the latent semantic space, multiple meanings of a word correspond to a point in this space, which are not distinguished, helping explain that it only solves the problem of “Synonymy”, but not “Polysemy”.
Probabilistic Latent Semantic Analysis (PLSA) was firstly proposed by THOMAS HOFMAN abroad based on statistical latent block model, applying it for unsupervised learning. Experimental results show that the method, when compared with standard latent semantic analysis, marks an obvious progress. Later, in another article, THOMAS HOFMAN introduced the probabilistic latent semantic analysis method and applied it to automatic retrieval. The experimental results show that the probabilistic latent semantic retrieval significantly improves accuracy compared to the matching of standard terms and latent semantic analysis.
Derived from the statistical perspective of latent semantic analysis, the probabilistic latent semantic analysis method is a new statistical technique for analyzing two-mode and co-occurrence data. More specifically, it has been widely used in many related fields such as information extraction and information filtering, natural language processing, and machine learning [15,16]. In terms of the most general application, it means that standard statistical techniques can be applied to text filtering, text selection and complexity control [17]. For example, marginal trust can be used to estimate the performance of the PLSA by calculating the classification results of the PLSA. More specifically, the PLSA associates latent semantic variables with each co-occurring word are all polar [18].
Based on mathematical statistics, traditional text features extraction methods ignore the semantic relationship between words in the text, as well as the semantic problems caused by “Synonymy” and “Polysemy” [19].
Probabilistic latent semantic analysis is a probabilistic latent layer semantic analysis method based on statistical latent block model, which can obviously improve accuracy compared with standard items and latent semantic analysis. Besides, derived from the statistical viewpoint of latent semantic analysis, probabilistic latent semantic analysis method can make the latent semantic information with probabilistic features as the classification feature, thus effectively reducing the negative effects exerted by “Synonymy” and “Polysemy” in natural language, which in turn improves the emotional classification effect.
In the next section, we will introduce the Fisher kernel function and the reason for choosing it. More specifically, the Fisher kernel function can be used to measure the similarity between two objects on the generated model set and the statistical model set. Combined with the probabilistic latent semantic analysis method, it constructs a new kernel function by considering the probabilistic features of the latent semantics in the inner product of the kernel function. As one of the similar methods for comparison [6], PLSA-SVM does not make any improvement to the kernel function, only transferring to the support vector machine for classification using the topic features in PLSA. However, the most prominent characteristic of the method proposed in this paper is that it derives Fisher kernel similarity function based on the PLSA model, and use it as the kernel function of support vector machine for classification tasks.
In this paper, based on support vector machine for text sentiment analysis, the probabilistic latent semantic analysis is studied, based on which, the Fisher kernel function is improved. Besides, the Fisher kernel similarity function is derived to improve the sentiment classification effect of support vector machine.

2. Materials and Methods

2.1. Fisher Kernel Function

Named after the contribution of Ronald Fisher [20,21], the Fisher kernel in the field of statistical classification can help measure the similarity between two objects on a statistical model set of a generated model set. It can combine the advantages of generating models with those discriminating classification methods, such as Support Vector Machine. Also, the Fisher kernel model is a dynamically generated probability model. Therefore, serving as a bridge between file generation and the probabilistic model, it can take the entire corpus as background information into account.
The Fisher kernel is generally used in speech recognition, image classification, etc. [22,23,24], which, compared with the traditional kernel function, is featured by its direct relation to the sample. Another feature of the Fisher kernel is that it is suitable for variable-size training and test sample, thus making Fisher kernel a successful application in speech signal recognition. Since the Fisher kernel is a kind of local kernel, whose parameters can be less than that of general hybrid kernel after mixing Fisher kernel with other global kernels, thus capable of effectively reducing the time consumption. Besides, it is expected that such hybrid kernels still have good learning ability and generalization ability.
The Fisher kernel uses the Fisher score method. The Fisher score is defined as follows:
U X = θ log P ( X | θ )
where θ denotes the parameter vector, which can be estimated by the Gaussian mixture model using the Expectation Maximum (EM) algorithm.
The Fisher kernel is defined as follows:
K ( X i , X j ) = U X i T I 1 U X j
where I refer to Fisher kernel information matrix, which is defined as follows:
I = E x [ U x U x T ]
According to Formula (1)–(3), the Fisher kernel depends entirely on the original training sample information.
In general, the steps to calculate the Fisher kernel are as follows: First, construct a Gaussian mixture model, then use the EM algorithm to estimate the parameters of the model, and finally derive the Fisher kernel based on the Fisher score.
The Fisher kernel is correlated with the number of training samples to some degree. The more training samples, the more compact the Fisher kernel value is, thus indicating a better the classification performance.

2.2. Topical Features by PLSA Model

The Probabilistic Latent Semantic Analysis model is a statistical model based on the Aspect Model which is a latent variable model serving the data of the co-occurrence matrix. Each hidden variable, called z k , refers to associated with each observation. Here, each observation refers to the appearance of a term in a document. We can derive and solve the PLSA model to get the topical features of the text.
The probabilistic variables in the model are introduced as follows:
P ( d i ) represents the probability of selecting document d i in the document data set;
P ( w j | z k ) represents the conditional probability of a specific word w j with latent class variable z k ;
P ( z k | d i ) represents the probability distribution of the text d i in the latent variable space;
Based on these definitions, a generative model can be defined to generate new data in three steps:
Firstly, select a document d i based on P ( d i ) using the method of random sampling;
On the basis of the selected document d i , the meaning (topic) z k of the document is selected according to P ( z k | d i ) .
After selecting the semantics, select the words of the document according to P ( w j | z k ) ;
Thus, an observation variable pair z without latent class variable ( d i , w j ) can be obtained, followed by the transformation of the data generation process into a joint probability distribution. The expression is as follows:
P ( d i , w j ) = P ( d i ) P ( w j | d i )
P ( w j | d i ) = k = 1 K P ( w j | z k ) P ( z k | d i )
The conditional independence hypothesis is introduced in the aspect model, that is, d i and w j are conditionally independent with respect to the latent variable z k . The most intuitive interpretation of the aspect model can be obtained based on approximate estimation of conditional probability P ( w j | d i ) : it can be regarded as a convex combination of K conditional classes or aspect P ( w j | z k ) .
Once the model is determined, the parameters can be determined based on the maximum similarity formula. The objective function can be expressed as:
L = i = 1 N j = 1 M n ( d i , w j ) log p ( d i , w j ) = i = 1 N n ( d i ) [ log p ( d i ) + j = 1 M n ( d i , w j ) n ( d i ) log k = 1 K P ( w j | z k ) P ( z k | d i ) ]
The standard procedure for estimating the maximum similarity function in the probabilistic latent model is implemented by the expectation maximization (EM) algorithm.
In order to understand the topical features of the text, it is essential to deduce and solve the PLSA model, so the determined probabilities P ( w | z ) and P ( z | d ) are needed, which are determined by maximizing the following log-likelihood function:
L = log P ( D , W ) = d D w W n ( w , d ) log P ( w , d )
Maximizing the log-likelihood function is equivalent to minimizing the KL difference (relative entropy) between the empirical distribution and the parametric model. The expectation maximization (EM) algorithm is used to train the model effectively, involving the determination of the subject parameters of all files and that of the blending coefficients for each document.

2.3. Improved Fisher Kernel Function

The research on the kernel function of support vector machine is ultimately served for the discriminant function of support vector machine. Therefore, before improving Fisher kernel function, this section first addresses the discriminant function of support vector machine under normal circumstances, followed by the improvement of the Fisher kernel function, and combines it with the discriminant function of support vector machine.
Fisher kernel similarity function, based on the PLSA model of Section 2.2, is derived in this section. Based on the generated model, a general method, called Fisher kernel algorithm, is proposed to extract the features of the promoter sequence.
First, suppose there is an instance set X i , X i and X whose similarity is represented by the kernel function K ( X i , X ) , it corresponds to the label S i (which can be taken as ± 1 ). Corresponding to example X , Label S ^ is obtained by summing all S i weights, and S ^ = sign ( i S i λ i K ( X i , X ) ) can be obtained. In the above formula, the coefficient λ i serves as a free parameter, and the kernel function K , to some extent, also serves as a free parameter. An optimal coefficient λ i must be found so that the label S ^ has the largest probability value. Small changes which occurred in solving this optimal problem may exert a great impact, such as the change from support vector machine to generalized linear model.
Another important issue is related to the selection of kernel functions. Logical regression model is considered in the generalized linear model, because the probability of label S and a vector parameter θ in the logistic regression model is shown by P ( S | X , θ ) = δ ( S θ T X ) , where δ ( ) denotes a logical function, δ ( z ) = ( 1 + e z ) 1 ; and the parameter θ can be obtained by maximizing the following formula:
log P ( S i | X i , θ ) + log P ( θ ) = i log δ ( S θ T X ) 1 2 θ T Σ 1 θ + c
where c denotes independent of θ ; in terms of the kernel function k ( ) , the inner product form K ( X i , X ) = X i T Σ X is adopted. In fact, the form of the kernel function will be universal as long as the feature vectors from the samples can replace these features. The following discussion further discusses how to make a general kernel function more effective. Under the guidance of the “Mercer” theory, an effective kernel function can simply describe the inner product between the defined feature vectors, that is,
K ( X i , X j ) = ϕ ( X i ) T ϕ ( X j )
The feature vectors in the formula are derived from some specific mappings X ϕ ( X ) , with the definite requirement for kernel function in the application. The key now lies in how to derive it from the generated probability model generally. It is known from the previous description that automatically defining a kernel function means assuming a metric relationship in the example. Thus, it is necessary to define these metric relationships directly in the generated model P ( X | θ ) . Since the goal is classification, then a latent variable should be included into the generated model, which is the categorical variable S . In order to make this idea more general, a parametric model class P ( X | θ ) is taken into consideration, where θ Θ . This probability model is defined as a Riemannian manifold M Θ by the local metric given by Fisher’s information matrix I. Here,
I = E x { U x U x T } U X = log P ( X | θ )
This expectation exceeds P ( X | θ ) . To simplify the model, this limits the independence of the matrices I and U X in the parameter set θ. The gradient U X of the log-likelihood function, called as the Fisher score, plays a fundamental role in the process of derivation and application.
The local metric M Θ defines a distance between P ( X | θ ) and P ( X | θ + δ ) , as represented by the following form:
D ( θ , θ + δ ) = 1 2 δ T I δ
The Fisher score U X maps the instance X into a feature vector and specifies its steepness in P ( X | θ + δ ) . Later, called as the natural gradient, the gradient is derived from the ordinary gradient by:
ϕ ( X ) = I 1 U X i
The mapping X ϕ ( X ) that transforms the instance X into a feature vector is called a natural mapping, and the value of the parameter θ is set. The core of this mapping is the inner product of these feature vectors related to the Riemann system:
K ( X i , X j ) ϕ ( X i ) T I ϕ ( X i )
The Fisher score is core of the Fisher algorithm. In fact, in the logistic regression model, as shown above, the matrix appears in the Gaussian covariance associated with the feature vector, helping explain that this information matrix does not actually exist, with this simple core function as:
K U ( X i , X j ) U X i T U X j
A suitable alternative is provided for the Fisher kernel function. From a metric point of view, for c , c 0 0 , the following kernel function serves as an equivalent kernel,
K ^ ( X i , X j ) = c K ( X i , X j ) + c 0 K ( X i , X j )
In the logistic regression model, the incremental constants exert an effect on the prior change of the bias term in the kernel, with the incremental factor c related to the remaining parameter change of the whole.
Finally, the Fisher kernel function is directly substituted into the K ( X i , X ) = X i T Σ X in the support vector machine as a kernel function, which is substituted into the support vector machine decision function.
f ( x ) = sgn ( g ( x ) ) = sgn ( i = 1 l α i y i ( ϕ ( x ) ϕ ( x i ) ) + b )
The inner product ( ϕ ( x ) ϕ ( x i ) ) corresponds to the sample function k ( x i x j ) , thus improving support vector machine method based on Fisher kernel function, namely, FK-SVM method.

2.4. Convergence Based on Fisher Kernel Support Vector Machine

The method proposed above is based on SVM, proving that the solution of SVM embedded with Fisher function is stable. The following two sub-problems prove 1. Firstly, the Fisher function is proved to be the kernel function of SVM. 2. The solution of the SVM using the kernel function is stable and convergent.
1 Proof: According to Mercer’s theorem, the sufficient condition for the Fisher function to be a kernel function is that the Fisher matrix has to be a symmetric and semi-positive definite matrix.
First, it needs to prove that the Fisher matrix is a symmetric matrix. The element K i j = κ ( x i , x j ) of the Fisher function is defined by the inner product, then
K i j = κ ( x i , x j ) = x i T x j = x j T x i = κ ( x j , x i ) = K j i
Therefore, the Fisher function is symmetrical.
Secondly, it needs to prove that Fisher matrix is a semi-positive definite matrix. Since the study in this paper only involves the real field, the diagonal element κ ( x i , x i ) = x i T x i 0 of Fisher matrix, namely, the diagonal element K, is not negative. According to the properties of semi-positive definite matrix, the diagonal element of an n-order diagonal dominance matrix is not negative, thus making the matrix a semi-positive definite matrix. Hence, Fisher matrix K ( X i , X j ) = ϕ ( X i ) T ϕ ( X j ) is a semi-positive definite matrix.
It can be concluded from the above proof that the Fisher function conforms to the Mercer theorem, thus making the Fisher function a kernel function.
2 Proof: SVM with Fisher kernel function has stable local optimal solution, which indicates that the proposed method is stable.
The dual form of the SVM using the Fisher kernel function is:
min α i = 1 l α i 1 2 i = 1 l j = 1 l α i α j k ( x i , x j ) s . t .   α i 0 ,   i = 1 l α i y i = 0
Essentially, it is a quadratic programming issue with respect to α = ( α 1 , , α l ) T , which can be obtained based on the following analysis:
min α i = 1 l α i 1 2 i = 1 l j = 1 l α i α j k ( x i , x j ) = min α 1 T α 1 2 α T K α
where K i j = κ ( x i , x j ) . Simultaneous binding can be expressed as:
i = 1 l α i y i = 1     y T α 1 , y T α 1
α i 0     1 T α 0
Therefore, the dual form of the formula can be expressed as the following standard quadratic programming form:
min α 1 T α 1 2 α T K α s . t .   c T α d
where c = ( y T , y T , 1 T ) T , d = ( 1 T , 1 T , 0 T ) T .
Hence, the SVM using the Fisher kernel function is a standard quadratic programming form, and same as the quadratic programming, the SVM also converges and has a stable local optimal solution.
Therefore, the method proposed in this section is stable and convergent.

3. Results

3.1. Twitter Data Set

English is the most widely spoken language worldwide, helping explain that English data set is selected as the corpus for experimental verification. Particularly, the corpus used here is extracted from Stanford University’s “Sentiment140” [25] (The data set can be downloaded from the following link: http://cs.stanford.edu/people/alecmgo/trainingandtestdata.zip).
Information for each field is available in the data set in the link:
0—the polarity of tweet (0 = negative, 2 = neutral, 4 = positive)
1—tweet ID (2087)
2—tweet date (Sat May 16 23:58:44 UTC 2009)
3—Query (lyx). If there is no query, then this value will be NO_QUERY.
4—tweet user (robotickilldozr)
5—tweet text (Lyx is cool)
There are 1.6 million records in the dataset, without empty records. Although the neutrals are mentioned in the dataset description, no neutral classes are involved in the training set. 50% of the data has negative tags while the other 50% has positive tags.
Before training, it is necessary to preprocess the data, mainly including removing the columns in the data set that are useless for sentiment analysis, and processing @ mentioned (although @mention has provided certain information, such as another user mentioned in the tweet, these Information is not valuable for constructing sentiment analysis models.), URL links, stop words, etc. Thus, preprocessed data sets can contribute to training and testing sentiment analysis algorithms.

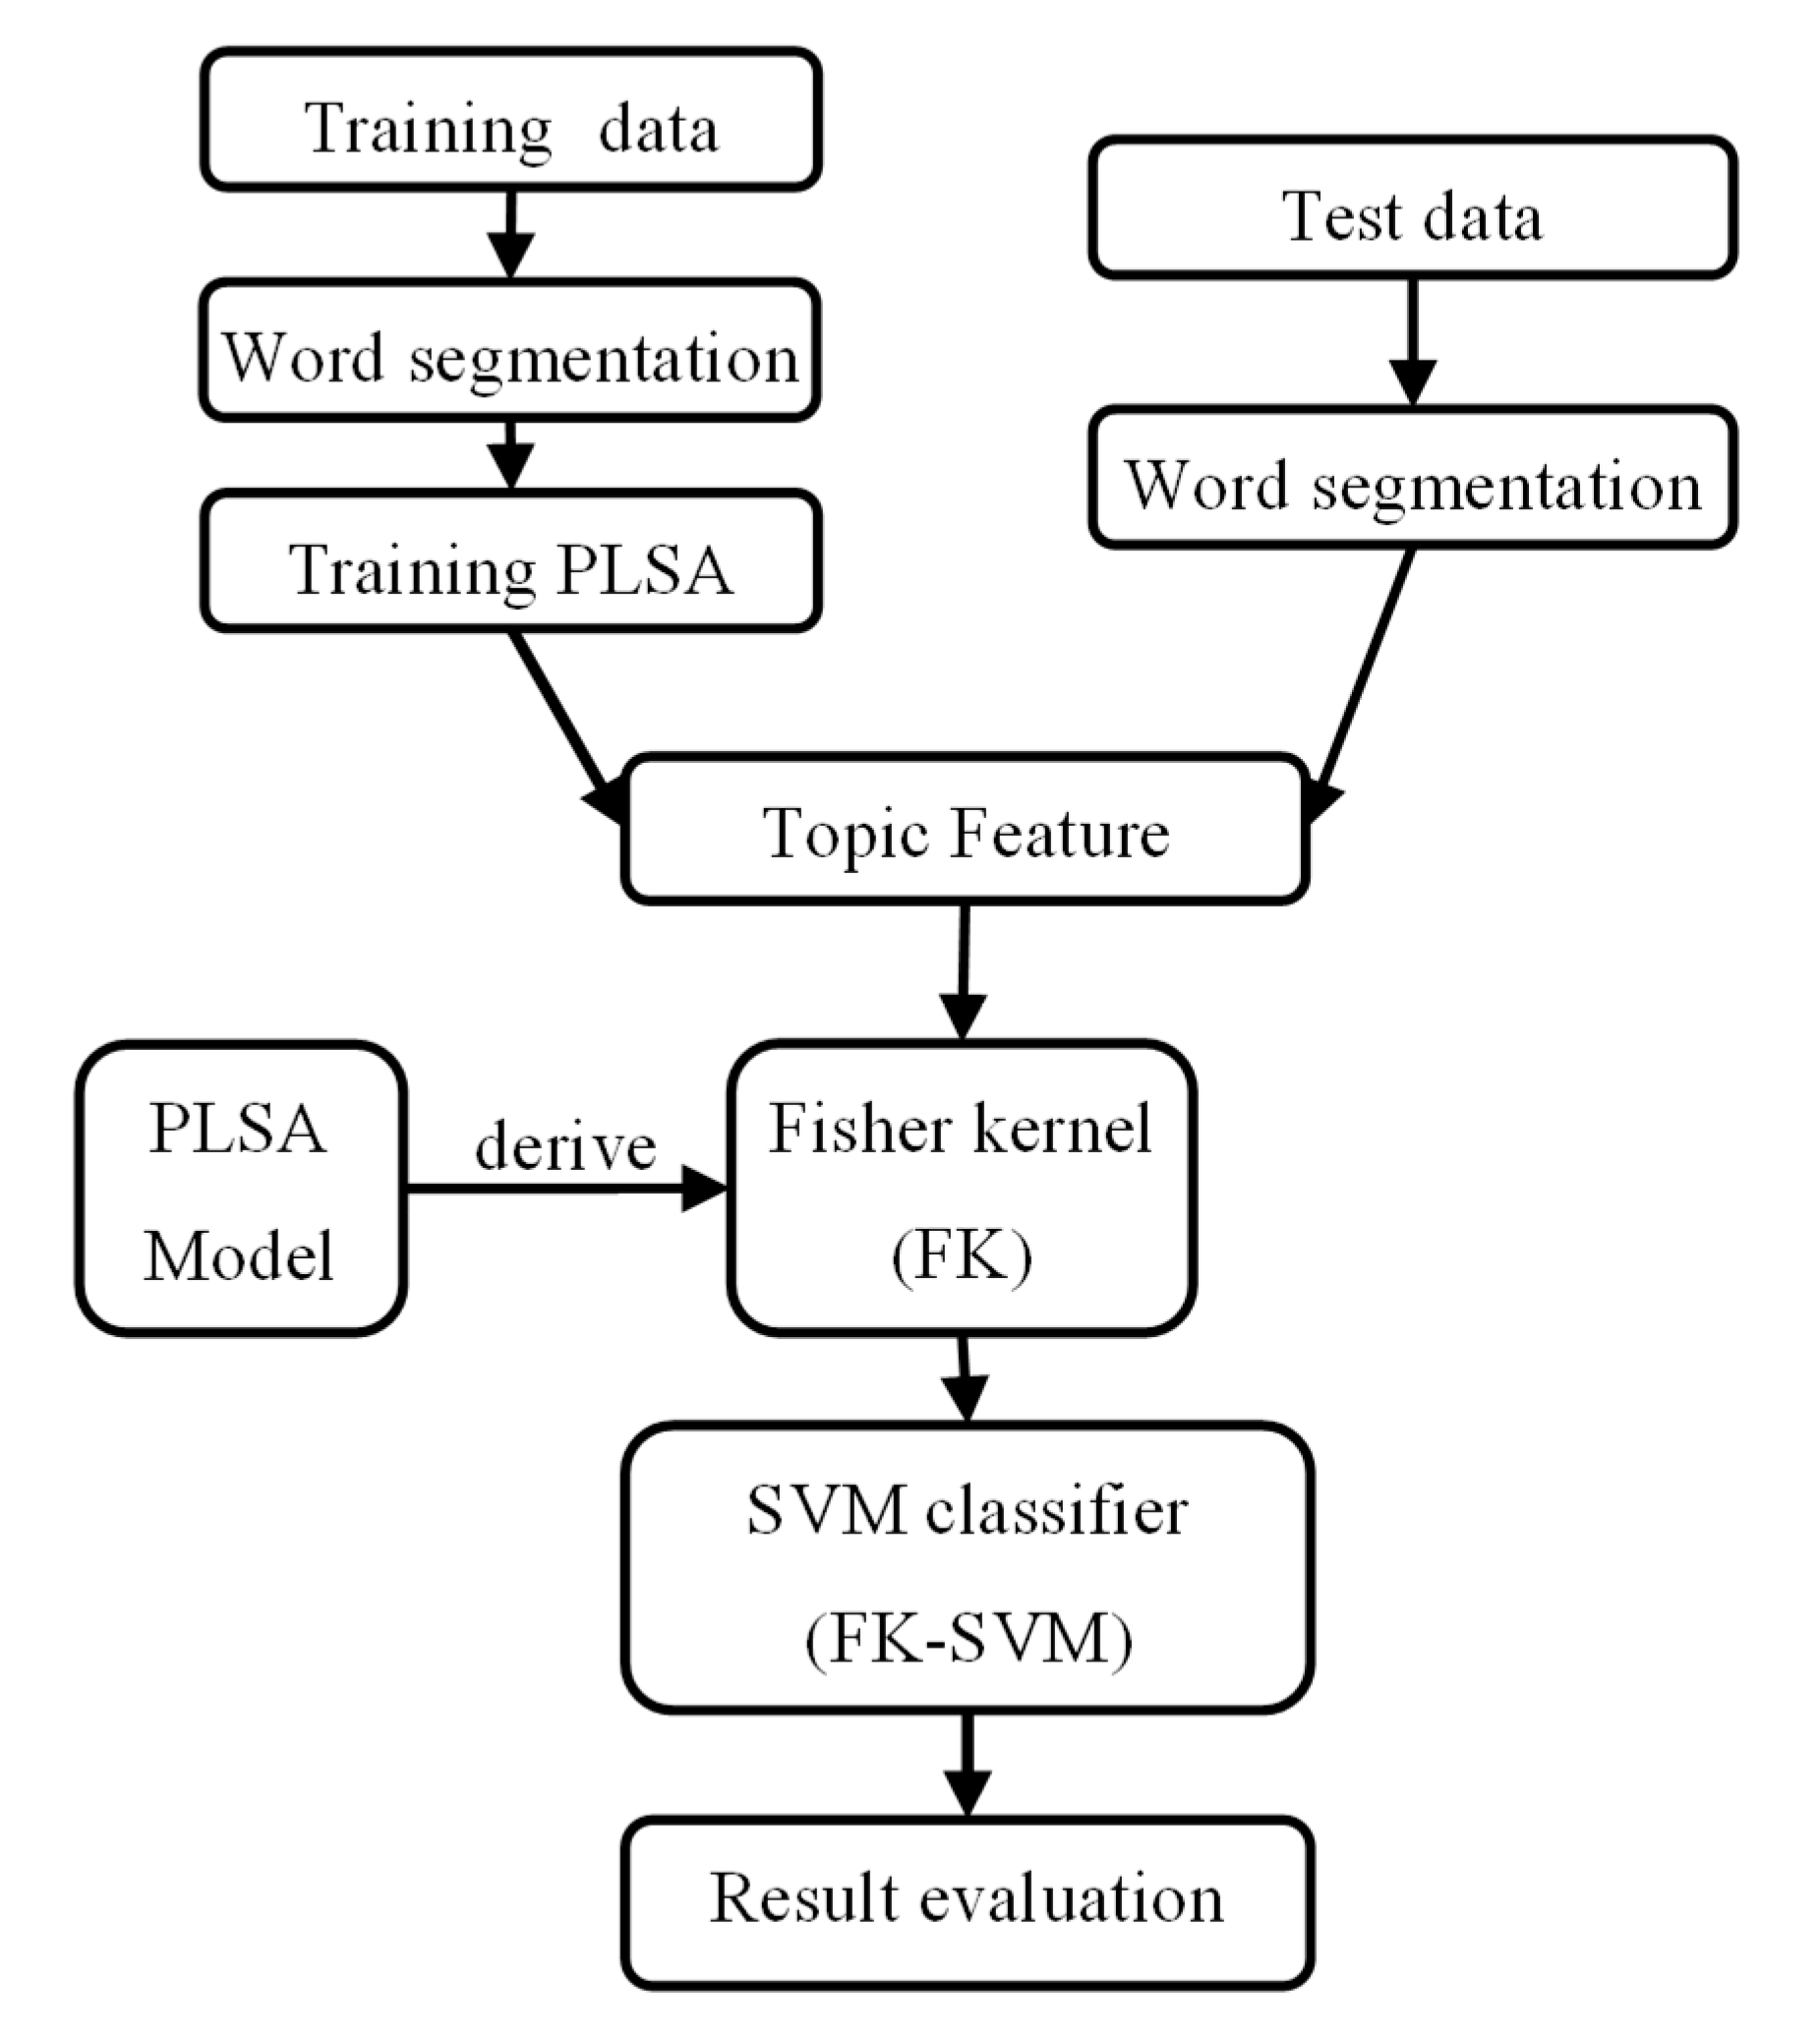
3.2. Text Sentiment Analysis Experiment Based on FK-SVM

Based on the previous section, this section combines the Fisher kernel function-based support vector machine method (FK-SVM) with PLSA to propose a new text sentiment analysis method. The understanding and model combination of PLSA in text sentiment analysis is the same as the method in the previous section.
This section mainly incorporates the improved Support Vector Machine (FK-SVM) which is also called as the FK-SVM method, for which combines the advantages of the PLSA model and FK-SVM.
Additionally, the effect of the FK-SVM algorithm on sentiment detection is evaluated in this section, with the experimental process involving the following steps:
  • Pre-process emotional detection data;
  • Extract the characteristics of the preprocessed data;
  • Pass the extracted features to a linear support vector machine for training and recognition;
  • Output classification results.

3.3. Experimental Design and Algorithm Evaluation Criteria

The FK-SVM-based text sentiment analysis method will be experimentally verified in this section, with the basic procedure of the FK-SVM method shown in Figure 1, including the following parts:
  • Prepare the training data set;
  • Data preprocessing;
  • Train the PLSA model;
  • Derive the Fisher kernel function through the PLSA model for use in SVM methods supporting kernel functions;
  • Train and classify the SVM classifier. The emotional theme vector, namely, the Z vector in the PLSA, is used as the feature of the document and delivered to the SVM based on the Fisher kernel function for binary classification.
The two indexes of “recall rate” and “accuracy” are involved in all the retrieval and selection involving large-scale data collection. Due to the two mutually constrained indicators, it is usually necessary to select a suitable degree for the “search strategy” according to needs. Moreover, it should not be too strict or too loose, and a balance point should be achieved between the recall rate and the accuracy. This balance point is determined by specific needs.
Assumption: The documents can be divided into four groups when retrieving documents from a large data set:
  • Documents that are relevant and retrieved by the system (TP);
  • Documents that are irrelevant and retrieved by the system (FP);
  • Documents that are relevant but not retrieved by the system (FN);
  • Documents that are irrelevant but not retrieved by the system (TN);
Of course, the negative samples in this case do not mean the wrong classification, but the type of sample with the category “negative”. Thus, it can be concluded that FN and TN are used to calculate the classifier error rate. Then:
Recall rate R: The number of related documents retrieved is used as the numerator, with the total number of all related documents as the denominator, namely: Recall = T P T P + F N .
Accuracy rate P: The number of related documents retrieved is used as the numerator, with the total number of all retrieved documents as the denominator, namely: True   positive   rate = T P T P + F P .

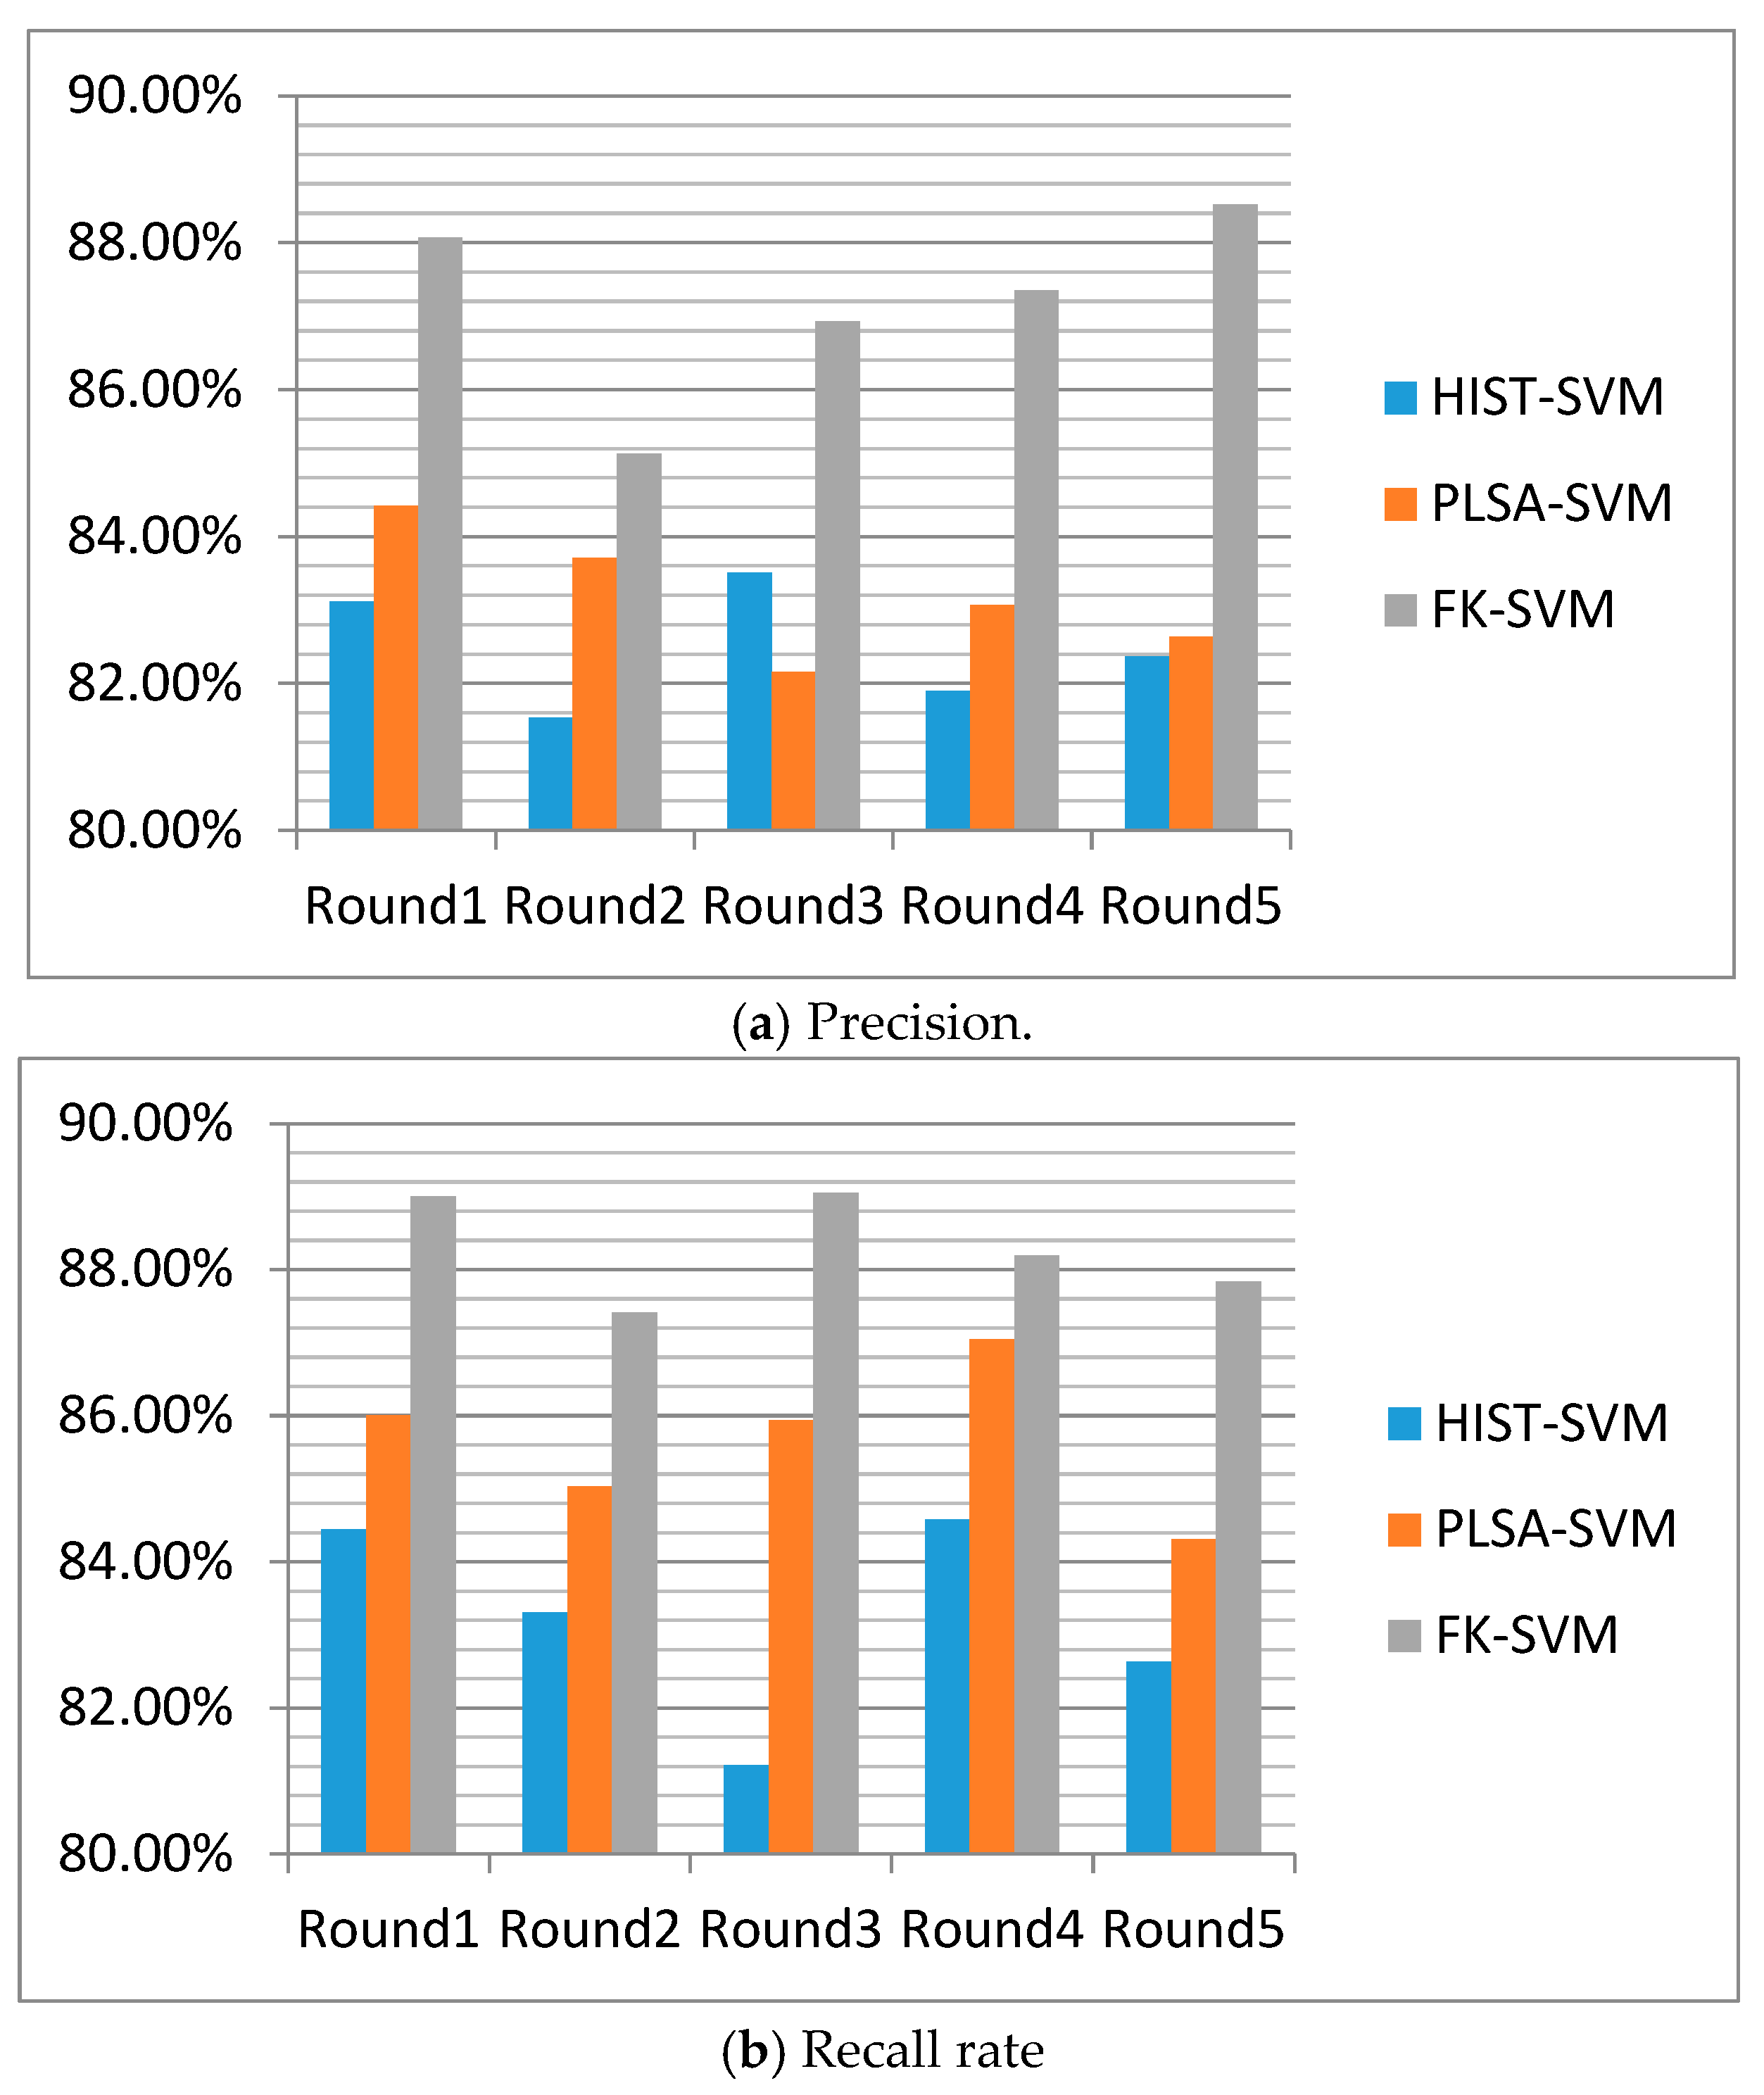
3.4. Experimental Results of FK-SVM, HIST-SVM and PLSA-SVM

To verify the superiority of the FK-SVM method, a comparison between FK-SVM method and text sentiment analysis method is used in this section based on HIST-SVM and PLSA-SVM, to prove [6]. The comparison includes accuracy and recall rate.
The histogram of words appearing in the document is mainly used as the feature of the document in HIST-SVM method, and the histogram feature is submitted to the SVM for text sentiment analysis.
The PLSA-SVM method mainly consists of two parts. First, the PLSA algorithm is used to simulate the probability distribution of text and text topic features are used to identify text. Secondly, the text theme features transferred to support vector machine are applied as features of sentiment analysis for classification, that is, text sentiment analysis. Combining the advantages of PLSA generative model and SVM discriminative model, this method is called as PLSA-SVM method which uses topics as hidden variables and uses EM algorithms to estimate model parameters. Detailed training methods can be obtained in reference [6].
The comparison method involves multiple rounds of experimental comparisons and comparisons with different percentages of samples.
Two experiments are conducted in this paper:
  • On the twitter data set, five rounds of cross-validation training and testing are carried out for FK-SVM method, HIST-SVM method and PLSA-SVM method, followed by the obtaining and comparison of the accuracy, recall rate and corresponding average value of each round.
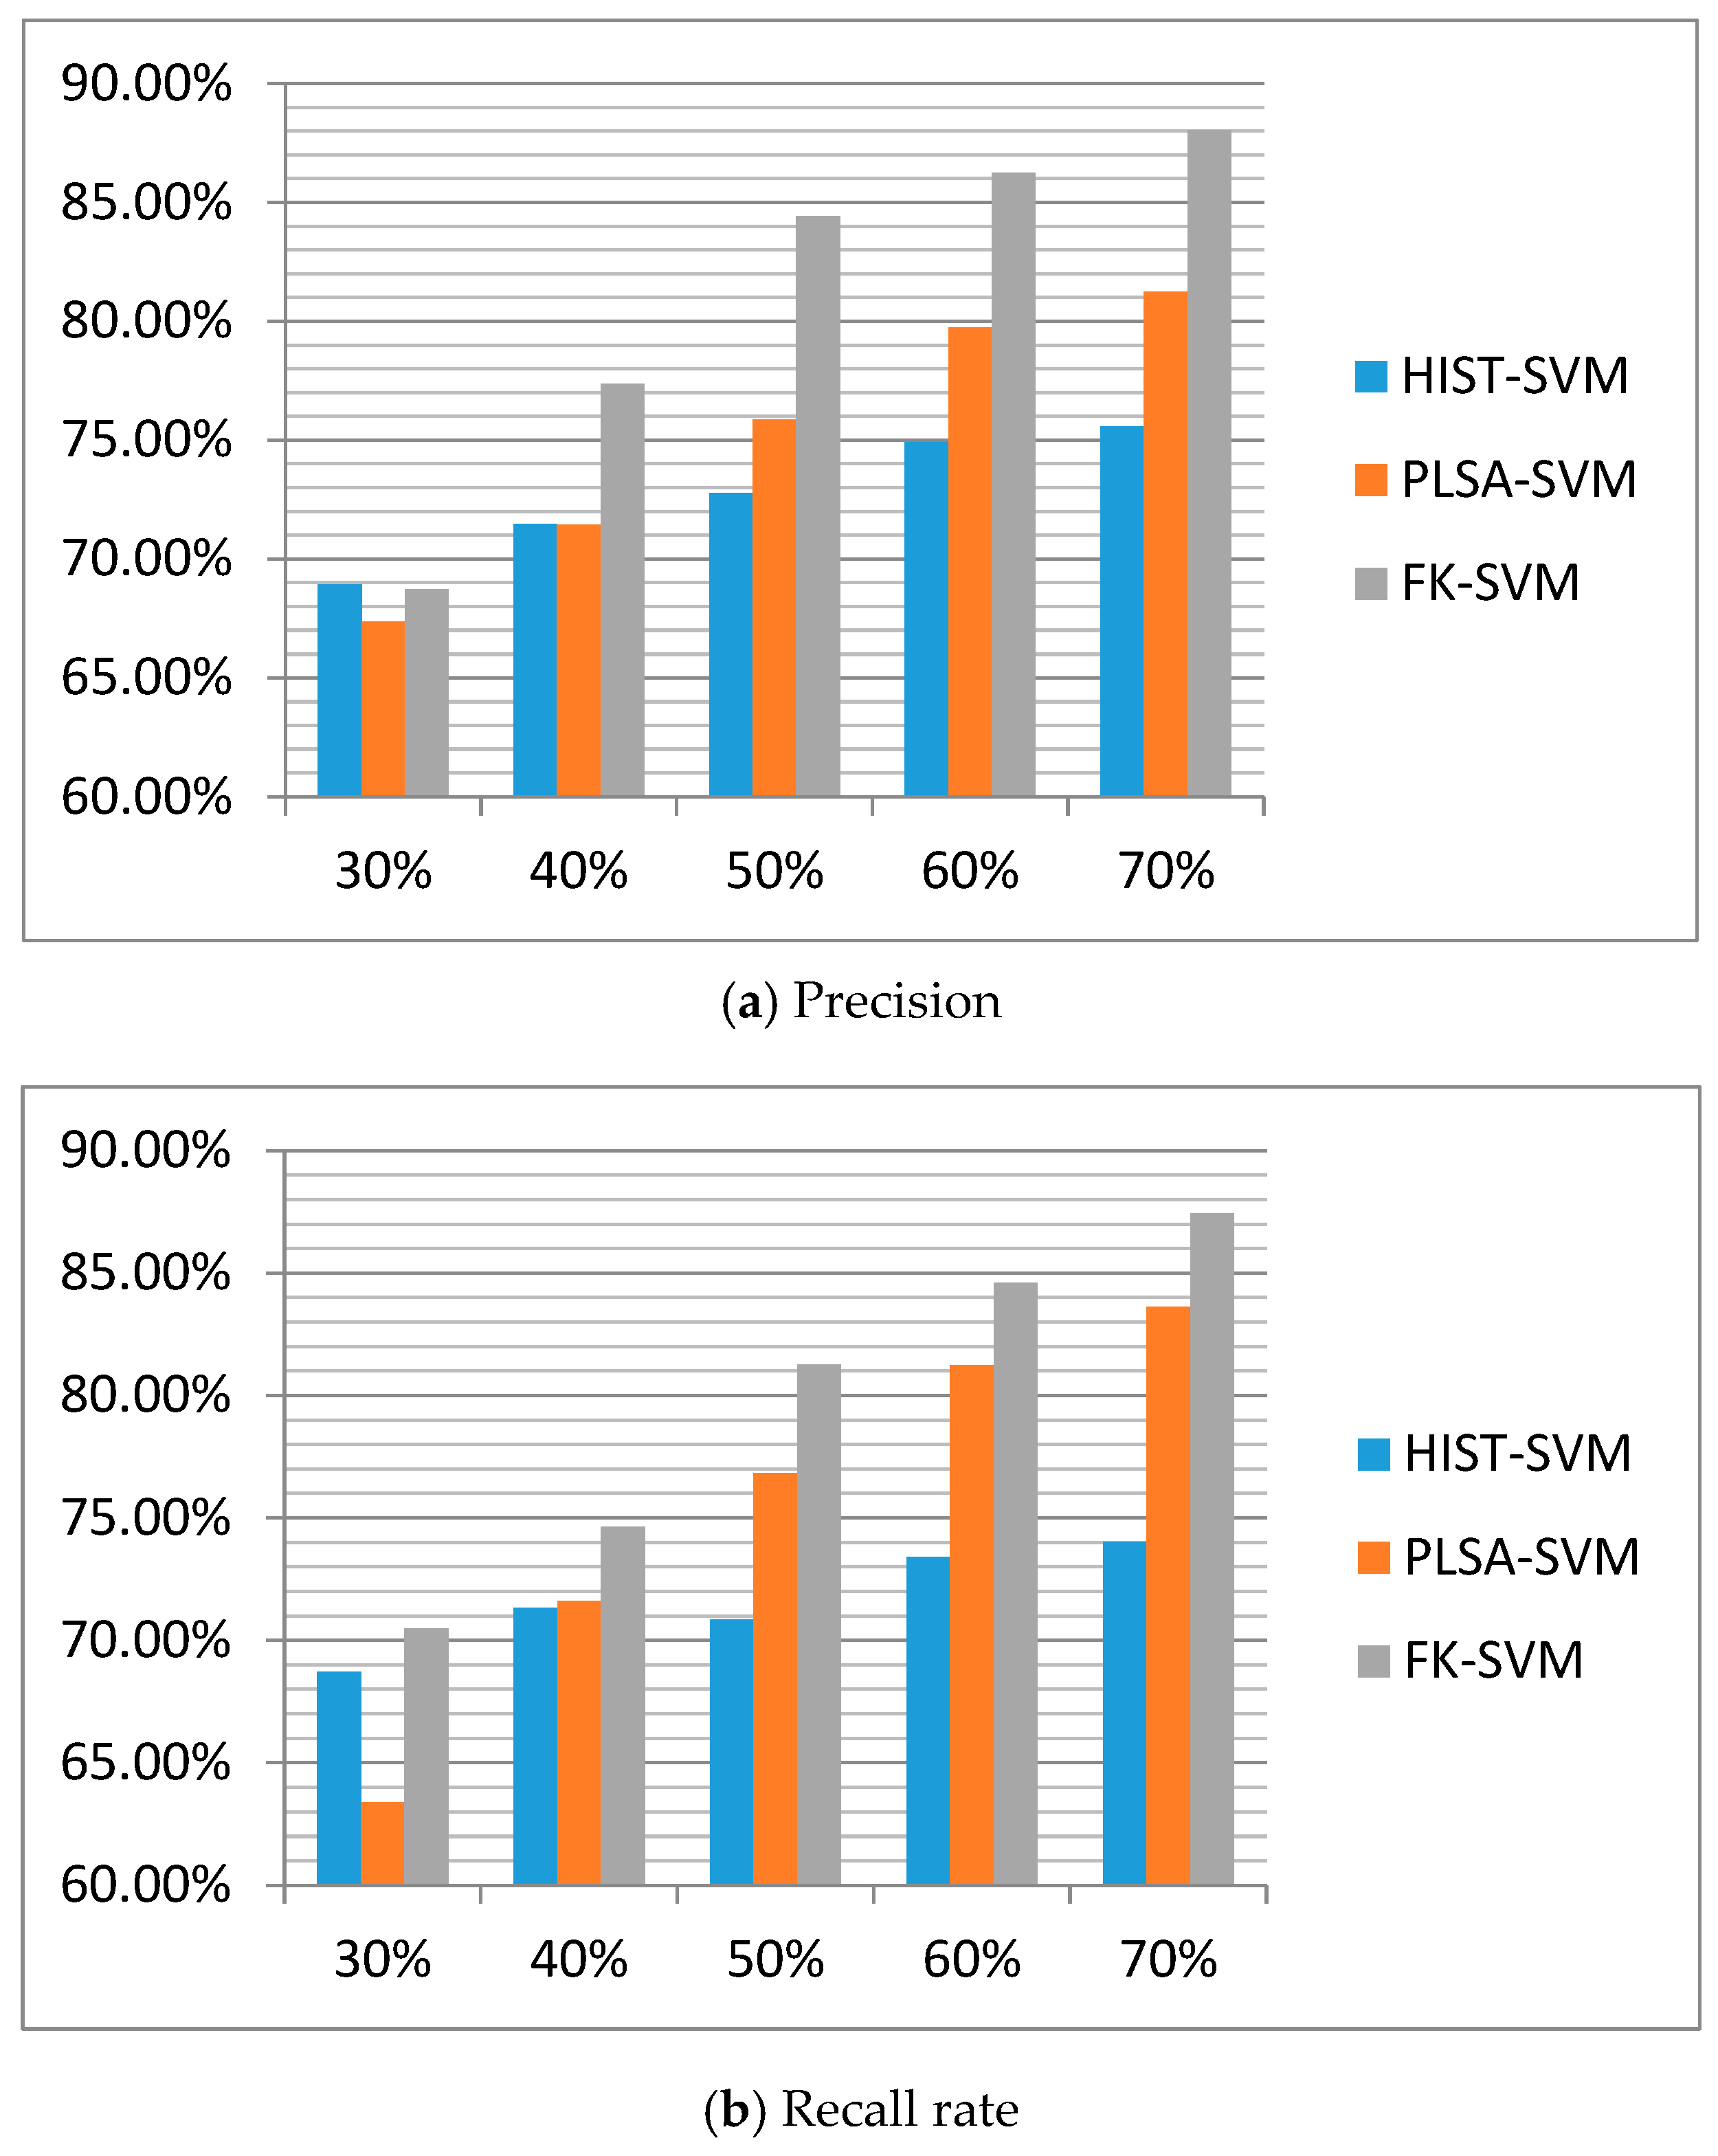
  • On the twitter data set, FK-SVM, HIST-SVM method and PLSA-SVM methods are trained and tested in 5 rounds with different proportions of training samples, followed by the obtaining and comparison of the accuracy, recall rate and corresponding average value of each round.
Main experimental results and analysis:
Experiment 1: In the first experiment, FK-SVM method, HIST-SVM method and PLSA-SVM method are compared for several rounds of experiments, followed by the use of the recognition accuracy and recall rate as evaluation criteria to verify the effectiveness of HIST-SVM and PLSA-SVM algorithm. In this section, the FK-SVM method, as long as tested, can be compared with the HIST-SVM and the PLSA-SVM experimental results.
Table 1 and Figure 2 present the experimental results of the algorithm, respectively.
Experiment 2: The second experiment was carried out on the basis of the first experiment. Table 2 compares the results of experiments using the FK-SVM algorithm proposed in this paper with those using the HIST-SVM and the PLSA-SVM algorithm.
Table 2 and Figure 3 present the experimental results of the algorithm, respectively.

4. Discussion

4.1. Experiment Analysis of Experiment 1

Test experiments are conducted using the method proposed in this section, with the classification performance presented in Table 1. The recognition accuracy and recall rate of FK-SVM method in this section, as shown in Table 1, are higher than HIST-SVM method and PLSA-SVM method. The average accuracy is 87.20% and the recall rate is 88.30%, respectively.
1
Comparison between FK-SVM and HIST-SVM:
Table 1 and Figure 2 demonstrate that a significantly higher accuracy can be obtained by using the FK-SVM method proposed in this paper than the HIST-SVM method, whether in the average value or in the comparison test each time. This is because HIST-SVM, as a text sentiment recognition method with excellent experimental results, uses the occurrence times/frequency of words (i.e., statistical histogram) as the text features, and uses SVM for classification and recognition. Obviously, compared with the FK-SVM method, HIST-SVM method is incapable of obtaining the latent topics of the text hidden under the words, that is, the latent sentiment category. Thus, HIST-SVM cannot achieve a good recognition effect in the face of polysemy and other problems. In terms of text classification, FK-SVM method can map low-dimensional linear non-separable data to high-dimensional space and make it linear separable; Even more, with more advantages in mining latent topics of text, especially latent sentiment topics, it is less disturbed by specific emotional words and irregular vocabulary usage. Therefore, it performs better in text emotional classification than HIST-SVM method.
2
Comparison between FK-SVM and PLSA-SVM:
The experiment demonstrates that in the 5 rounds of experiments, the accuracy and recall rate fluctuate within a small range, with a relatively stable overall result, indicating that both methods have a good effect on text sentiment classification. In contrast, a slightly higher accuracy can be achieved by using the FK-SVM proposed in this paper than the PLSA-SVM method, whether in the average or the comparison test each time, because the main difference between the two methods lies in Fisher kernel function in the support vector machine. Therefore, it can be concluded that the Fisher kernel function based on PLSA plays a decisive role in these experiments. Besides, this method can map non-linear data from low-dimensional space to high-dimensional space through the kernel function. When deriving the Fisher kernel function based on the PLSA model, the probability distribution information of the data, and the high-level semantic information of the PLSA, especially, the statistical information of the text itself, are taken into account. This allows the support vector machine based on Fisher kernel function to take the probabilistic information of text units and the latent emotional topics of text as classification features in text classification, thus improving the effect of classification.

4.2. Experiment Analysis of Experiment 2

Test experiments are conducted using the method proposed in the previous section, with the classification performance being presented in Table 2. The average accuracy and recall rate of FK-SVM are 80.96% and 79.68%, respectively.
1.
Comparison between FK-SVM and HIST-SVM:
Table 2 and Figure 3 indicate that the HIST-SVM method is basically stable when faced with different percentages of training samples, while the test results of FK-SVM method slightly improve with the increase of the percentage of training samples This is because when the training samples are few, the probability distribution of vocabulary, documents and emotional topics in the samples will be greatly affected by noise. As the proportion of the sample increases, the corresponding probability distribution will gradually approach to the real distribution, thus making the topic mining more accurate, and improving the effect on the test set. But overall, the average accuracy and recall rate of the FK-SVM method are more obvious than those of the HIST-SVM method.
2.
Comparison between FK-SVM and PLSA-SVM:
Experiment 2 shows that the FK-SVM method is basically stable when faced with different percentages of training samples, and the test results slightly improve with the increase of percentage of training samples. This is can be attributed to the Fisher kernel function in the support vector machine. More specifically, the probability distribution information of the data has been taken into consideration when deriving the Fisher kernel function. In addition, the probability distribution of vocabulary, documents and emotional topics in samples, influenced by the small number of training samples, is greatly affected by noise. As the sample ratio increases, the corresponding probability distribution gradually approaches to the real distribution, thus making the topic mining more accurate, and improving the effect on the test set. But overall, the average accuracy and recall rate when using FK-SVM method are slightly higher than those using PLSA-SVM.
This section and the preceding section illustrate the specific experimental method of the FK-SVM method in text sentiment analysis, along with the comparison of it with the PLSA-SVM method. The experimental results demonstrate that accuracy and recall are higher when using the FK-SVM method than using the PLSA-SVM method. Theoretically, when deriving the Fisher kernel function based on the PLSA model, the probability distribution information of the data, and the high-level semantic information of the PLSA, especially, the statistical information of the text itself are taken into account. This allows the support vector machine based on Fisher kernel function to take the probabilistic information of text units and the latent emotional topics of text as classification features in text classification, thus improving the effect of classification. The algorithm proposed in this section can better perform sentiment analysis on the text. The classification accuracy is proportional to the number of training samples within a certain range. More specifically, the training complexity and training time of the model will not be affected by the scale of test sets. Furthermore, this method can be applied to large-scale text sentiment classification without additional training process.
In the twitter dataset used in this paper, the difference between the HIST-SVM method and the PLSA-SVM method is slightly smaller than that in the dataset composed of Internet posts. This is because there are many sources of Internet posts whose distribution is more representative of the probability distribution of real data, while twitter, as a single data source, has a tendency of cohesion in its topics, making its probability distribution less close to the real distribution than that of Internet posts. Hence, the PLSA-SVM effect is slightly reduced, while HIST-SVM shows little effect. In short, the experimental results of the FK-SVM method will definitely be more improved than the HIST-SVM method and PLSA-SVM method if the FK-SVM method is applied to the network post data set.

5. Conclusions

A Fisher kernel function method based on probabilistic latent semantic analysis is proposed in this paper, which improves the kernel function of support vector machine. The Fisher kernel function is derived based on the probabilistic latent semantic analysis model, which fully takes the probability relationship and latent relationship among text, vocabulary and subject into consideration. The support vector machine, based on Fisher kernel function, can classify the text sentiment from the probability level of the generated model, such as the latent semantic level. The main contents are as follows:
  • A Fisher kernel function based on Probabilistic Latent Semantic Analysis is proposed in this paper. More specifically, the Fisher kernel function based on probability latent semantic analysis can be deduced by using Fisher function to measure the similarity between two objects on the generated model set and the statistical model set. By means of this method, latent semantic information involving the probability features can be used as the classification features, which also improves the effect of classification for support vector machine, and helps address the problem of ignoring the latent semantic features in text sentiment analysis.
  • FK-SVM method is proposed and compared with HIST-SVM and PLSA-SVM. The classification accuracy of the proposed method is verified by using Twitter data set, along with the comparison between the results of the experiment to verify the effect of the sentiment analysis method. The experimental results show that the average accuracy of the FK-SVM method on the Twitter sentiment corpus is 87.20%, a great improvement on the basis of the HIST-SVM and the PLSA-SVM method.

Author Contributions

C.-C.C., W.C. and K.-X.H. contributed to the conception of the study. C.-C.C. and K.-X.H. contributed significantly to analysis and manuscript preparation; K.-X.H. performed the data analyses and wrote the manuscript; W.C. and Y.-T.C. helped perform the analysis with constructive discussions. All authors have read and agreed to the published version of the manuscript.

Funding

This research was funded by National Natural Science Foundation of China, with grant number as 61374127 and the Research Initiation Project of Introducing High-level Talents from Beibu Gulf University of China, with grant number as 2018KYQD35.

Acknowledgments

We note that a shorter conference version of this paper has been accepted in ECICE (2019). Our initial conference paper did not address the problem of the improved Fisher kernel function. This manuscript addresses this issue and lays foundation for additional analysis.

Conflicts of Interest

The authors declare there is no conflicts of interest regarding the publication of this paper.

References

  1. Tran, T.K.; Phan, T.T. Deep Learning Application to Ensemble Learning-The Simple, but Effective, Approach to Sentiment Classifying. Appl. Sci. 2019, 9, 2760. [Google Scholar] [CrossRef] [Green Version]
  2. Coşkun, M.; Ozturan, M. europehappinessmap: A Framework for Multi-Lingual Sentiment Analysis via Social Media Big Data (A Twitter Case Study). Information 2018, 9, 102. [Google Scholar] [CrossRef] [Green Version]
  3. Wang, Y.-L.; Youn, H.Y. Feature Weighting Based on Inter-Category and Intra-Category Strength for Twitter Sentiment Analysis. Appl. Sci. 2019, 9, 92. [Google Scholar] [CrossRef] [Green Version]
  4. Koltcov, S.; Ignatenko, V.; Koltsova, O. Estimating Topic Modeling Performance with Sharma–Mittal Entropy. Entropy 2019, 21, 660. [Google Scholar] [CrossRef] [Green Version]
  5. Hofmann, T. Unsupervised Learning by Probabilistic Latent Semantic Analysis. Mach. Learn. 2001, 42, 177. [Google Scholar] [CrossRef]
  6. Ren, W.-J.; Han, K.-X. Sentiment Detection of Web Users Using Probabilistic Latent Semantic Analysis. J. Multimed. 2014, 10, 863–870. [Google Scholar] [CrossRef] [Green Version]
  7. Liu, H.-F. Some Properties of Support Vector Machines Mercer’s Nuclear. J. Beijing Union Univ. Nat. Sci. 2005, 19, 45–46. [Google Scholar]
  8. Burges, J.C. Geometry and Invariance in Kernel based methods. In Advances in Kernel Methods-Support Vector Learning; MIT Press: Cambridge, UK, 1999; pp. 89–116. [Google Scholar]
  9. Wu, T.; He, H.-G.; He, M.-K. Interpolation Based Kernel Function’s Construction. Chin. J. Comput. 2003, 26, 990–996. [Google Scholar]
  10. Amari, S.; WU, S. Improving support vector machine classifiers by modifying kernel function. Neural Netw. 1999, 12, 783–789. [Google Scholar] [CrossRef]
  11. Liu, C.-W.; Luo, J.-X. A PSO-SVM Classifier Based on Hybrid Kernel Function. J. East China Univ. Sci. Technol. Nat. Sci. Ed. 2014, 1, 96–101. [Google Scholar]
  12. Jia, F.-T.; Song, Z.-L. A New Algorithm Based on SVM Parameter Optimization. Math. Pract. Theory 2014, 1, 200–204. [Google Scholar]
  13. Smits, G.F.; Jordaan, E.M. Improved SVM Regression using Mixtures of Kernel. In Proceedings of the 2002 International Joint Conference on Neural Networks, Honolulu, HI, USA, 12–17 May 2002. [Google Scholar]
  14. Liu, H.-F.; Wang, Y.-Y.; Zhang, X.-R.; Liu, S.-S. A Method of Reducing Text Features Based on the Combing of Features Clustering and LSA. J. Inf. 2008, 2, 3–6. [Google Scholar]
  15. Langerak, T.R.; Berendsen, F.F.; Van der Heide, U.A.; Kotte, A.N.T.J.; Pluim, J.P.W. Multiatlas-based segmentation with preregistration atlas selection. Med. Phys. 2013, 409, 091701. [Google Scholar] [CrossRef] [PubMed]
  16. Shah-Hosseini, A.; Knapp, G.M. Semantic Image Retrieval Based on Probabilistic Latent Semantic Analysis; ACM: New York, NY, USA, 2006. [Google Scholar]
  17. Wang, Z.-H.; Wang, L.-Y.; Dang, H. Web clustering based on hybrid probabilistic latent semantic analysis model. J. Comput. Appl. 2012, 11, 3018–3022. [Google Scholar] [CrossRef]
  18. Zhang, W.; Huang, W.; Xia, L.-M. Recommendation research based on general content probabilistic latent semantic analysis model. J. Comput. Appl. 2013, 5, 1330–1333. [Google Scholar] [CrossRef]
  19. Zhang, Y.-F.; He, C. Research on Text Categorization Model Based on Latent Semantic Analysis and HS-SVM. Information Studies. Theory Appl. 2010, 7, 104–107. [Google Scholar]
  20. Perronnin, F.; Rodriguez-Serrano, J.A. Fisher kernels for hand-written word-spotting. In Proceedings of the 10th International Confere- nce on Document Analysis and Recognition, Beijing, China, 10–15 November 2009. [Google Scholar]
  21. Travieso, C.M.; Briceño, J.C.; Ferrer, M.A.; Alonso, J.B. Using Fisher kernel on 2D-shape identification. In Proceedings of the Computer Aided Systems Theory-EUROCAST 2007, LNCS 4739, Berlin, Germany, 12–16 February 2007; pp. 740–746. [Google Scholar]
  22. Won, C.; Saunders, A. Prügel-Bennett. Evolving fisher kernels for biological sequence classification. Evol. Comput. 2011, 21, 83–105. [Google Scholar] [CrossRef] [PubMed]
  23. Inokuchi, R.; Miyamoto, S. Nonparametric fisher kernel using fuzzy clustering. In Knowledge-Based Intelligent Information and Engineering Systems; LNCS4252; Springer: Berlin/Heidelberg, Germany, 2006; pp. 78–85. [Google Scholar]
  24. Salvador, D.-B.; Thomas, W.; Susan, L.D. Top-down feedback in an HMAX-like cortical model of object perception based on hierarchical Bayesian networks and belief propagation. PLoS ONE 2012, 7, e48216. [Google Scholar]
  25. The Corpus Used in this Paper is from Stanford University’s “Sentiment140”. Available online: http://help.sentiment140.com/for-students/ (accessed on 9 September 2019).
Figure 1. The flow chart of text sentiment analysis based on FK-SVM method.
Applsci 10 01125 g001
Figure 2. The multi round compared experimental results of FK-SVM, HIST-SVM and PLSA-SVM. (a) Precision. (b) Recall rate.
Applsci 10 01125 g002
Figure 3. Sample comparison of different training percentages of FK-SVM, HIST-SVM and PLSA-SVM. (a) Precision, (b) Recall rate.
Applsci 10 01125 g003
Table 1. The multi round compared experimental results of FK-SVM, HIST-SVM and PLSA-SVM. (a) Precision. (b) Recall rate.
Experimental RoundHIST-SVMPLSA-SVMFK-SVM
Round 183.12%84.42%88.07%
Round 281.53%83.71%85.13%
Round 383.51%82.16%86.93%
Round 481.89%83.07%87.35%
Round 582.37%82.64%88.52%
Average82.49%83.20%87.20%
(a)
Round 184.45%86.01%89.00%
Round 283.31%85.03%87.41%
Round 381.22%85.94%89.05%
Round 484.58%87.05%88.19%
Round 582.63%84.31%87.83%
Average83.24%85.67%88.30%
(b)
Table 2. Sample comparison of different training percentages of FK-SVM, HIST-SVM and PLSA-SVM. (a) Precision. (b) Recall rate.
Experimental RoundHIST-SVMPLSA-SVMFK-SVM
30%68.93%67.37%68.71%
40%71.46%71.43%77.37%
50%72.77%75.86%84.42%
60%74.92%79.75%86.25%
70%75.56%81.24%88.04%
Average72.73%75.13%80.96%
(a)
30%68.72%63.38%70.47%
40%71.33%71.61%74.63%
50%70.86%76.83%81.25%
60%73.39%81.22%84.59%
70%74.03%83.63%87.45%
Average71.67%75.33%79.68%
(b)

