Article

Fault Diagnosis of Diesel Engine Valve Clearance Based on Variational Mode Decomposition and Random Forest

1
Beijing Key Laboratory of High-end Mechanical Equipment Health Monitoring and Self-Recovery, Beijing University of Chemical Technology, Beijing 100029, China
2
Key Lab of Engine Health Monitoring-Control and Networking of Ministry of Education, Beijing University of Chemical Technology, Beijing 100029, China
3
Dongfeng Motor Corporation Technical Center, Wuhan 430100, China
*
Author to whom correspondence should be addressed.
Appl. Sci. 2020, 10(3), 1124; https://doi.org/10.3390/app10031124
Submission received: 26 November 2019 / Revised: 26 January 2020 / Accepted: 4 February 2020 / Published: 7 February 2020
(This article belongs to the Special Issue Machine Fault Diagnostics and Prognostics)

Abstract

:
Diesel engines, as power equipment, are widely used in the fields of the automobile industry, ship industry, and power equipment. Due to wear or faulty adjustment, the valve train clearance abnormal fault is a typical failure of diesel engines, which may result in the performance degradation, even valve fracture and cylinder hit fault. However, the failure mechanism features mainly in the time domain and angular domain, on which the current diagnosis methods are based, are easily affected by working conditions or are hard to extract accurate enough from, as the diesel engine keeps running in transient and non-stationary processes. This work aimed at diagnosing this fault mainly based on frequency band features, which would change when the valve clearance fault occurs. For the purpose of extracting a series of frequency band features adaptively, a decomposition technique based on improved variational mode decomposition was investigated in this work. As the connection between the features and the fault was fuzzy, the random forest algorithm was used to analyze the correspondence between features and faults. In addition, the feature dimension was reduced to improve the operation efficiency according to importance score. The experimental results under variable speed condition showed that the method based on variational mode decomposition and random forest was capable to detect the valve clearance fault effectively.

1. Introduction

As a large-scale reciprocating power machine, a diesel engine is widely used in industrial, military, and agricultural fields. Because it has complex mechanical structure, some faults also exhibit diversity and complexity. The major faults reported include misfire, piston slap, knock, fuel injection fault, and valve fault. Among them, valve fault is one of the most common fault modes in diesel engines. The valve clearance of a diesel engine, which controls the intake and exhaust of the cylinder, usually exceeds the normal value due to wear or faulty adjustment. The increase or decrease of valve clearance will affect the performance and reliability of the entire equipment and cause unnecessary economy loss. Therefore, it is very important to apply the techniques of condition monitoring and fault diagnosis on diesel engines to ensure the safety and reliability during operation process [1,2].
The common methods used for the research of fault diagnosis are divided into two types. One type of research is to identify the state of the valve, to distinguish between good and faulty valves, and to indicate abnormal alarms. Another is to directly diagnose the specific fault type of valve [3]. The first type is the widest research area and is very important for timely warning when the equipment has a problem. This article includes two layers of content. Besides the first type, methods for identifying specific fault types of valve clearance on the premise of abnormal warning are also discussed here.
Measurement methods used for condition monitoring and diagnosis of diesel engines mainly include vibration, acoustic emission, cylinder pressure, etc., which has shown good performance in the signal processing field. In all of these ways, vibration signal on the surface of cylinder head of diesel engine is easy to obtain, and contains abundant state information of a machine, such as in-cylinder combustion, valve opening, and valve closing [4]. However, due to the large number of excitation sources and the influence of external noise, vibration signal is usually non-stationary and non-linear [5]. Thus, the methods used in the past are not applicable, including fast Fourier transform (FFT) analysis, cepstrum analysis, the envelope spectra technique, and higher-order statistics [6]. Researchers have tried various ways to extract effective feature parameters from surface vibration signals. Si et al. [7] used the wavelet packet method to analyze diesel engine valve seating’s excitation response signal segment, and diagnosed the valve clearance fault by calculating the root mean square (RMS) value of the energy. Shen et al. [8] used empirical mode decomposition (EMD) and support vector machine (SVM) to extract the energy characteristics of modal components to identify the state of diesel engine. Zhang et al. [9] used the local mean decomposition (LMD) method to extract the feature vector of a cylinder head’s vibration signal and applied SVM to identify the valve fault. However, wavelet packet decomposition needs to determine the proper wavelet basis and the number of decomposition layers. Although EMD and LMD methods can achieve the adaptive decomposition process of non-stationary signals, they all have a mode mixing phenomenon, and their robustness is poor. In order to overcome this shortcoming, the ensemble empirical mode decomposition (EEMD) method was proposed, so it had received extensive attention in the field of fault diagnosis. However, white noise was still left in the signal decomposed by the EEMD method. In order to eliminate white noise, the average number of integrations also increased, which resulted in lower data processing efficiency [10].
Recently, a new non-stationary signal processing method called the variational mode decomposition (VMD) algorithm has been proposed. VMD can determine the relevant bands of fault feature and obtain the modes concurrently by decomposing the original signal, separating the signal into several intrinsic mode functions (IMFs) [11]. Because of non-iterative decomposition and adaptively-chosen bands, VMD is able to overcome the mode mixing and misclassification problem caused by fixing band allocation [12]. At the same time, it also has better robustness and higher data processing efficiency. Therefore, since it was proposed, the VMD method has become a hot research issue and been successfully applied to the field of rotating machines [13,14]. However, little research was carried out on the use of these techniques in reciprocating machines, such as diesel engines. In the research reported in this paper, the VMD method is studied to verify its ability to handle a cylinder head’s vibration signals in diesel engines.
Nevertheless, due to the complexity of diesel engines, it is difficult to identify the conditions or faults from a single feature obtained from the IMFs [15]. To better reflect the diesel engine’s health states, features at different scales should be extracted from the original acceleration signal. Combining time domain and frequency domain feature parameters, 18-dimensional feature vectors are constructed in this paper.
Commonly, a classification algorithm is used for fault identification after feature extraction. The Random forest (RF) algorithm is one of the widely used classifiers in data mining techniques. It is more accurate and efficient when working with large database. The RF classifier is a combination of many decision trees. Decision trees are grown by a binary partitioning method to make for easy interpretation [16]. Compared to single classifier such as decision tree, neural network, support vector machine, and so on, RF has better stability and generalization. It can not only perform multi-category pattern recognition accurately, but also can sort multi-dimensional features according to the importance score. Proper reduction to features can keep the useful information to the maximum extent, eliminate useless information, and improve the efficiency of the algorithm. The RF supervised classifier has the above characteristics at the same time, so this algorithm is used to identify faults and reduce dimensions.
This paper presented a new diesel engine valve fault diagnosis method based on the VMD and the RF algorithm. Based on the two-time decomposition strategy, the signal was decomposed by the VMD method, and the penalty function α value was determined by the criterion for optimal selection. After acquiring several IMF signals, the spectral energy characteristics of the IMFs were extracted. In addition, we also combined the time domain features and frequency domain features of the original signals to form an 18-dimensional feature vector. With the RF used for feature selection and the low-dimensional features used as the input parameters of the RF classifier, the alarm of the abnormal valve state of the diesel engine and the identification of the three types of valve clearance faults were finally realized. The analysis of the actual data under the condition of variable speed indicated that the combination of VMD and RF was an effective method for the diagnosis of valve clearance faults. The main contribution of this work could be summarized as follows: (1) Based on reducing the energy leakage of the IMF component frequency spectrum and the minimum IMF component of power spectral entropy, the VMD penalty function α was optimized; (2) The RF algorithm was adopted to rank the importance of all extracted features, so as to reduce dimensions and improve calculation efficiency; (3) The combined VMD and RF method improved the accuracy of fault identification. The organization of this paper is as follows: Section 2 introduces the diesel engine experimental test system. Section 3 introduces the principle of diagnosis based on optimized VMD-RF algorithm. The examples of application are described in Section 4. Finally, conclusions are given in Section 5.

2. Diesel Engine Experimental Test System

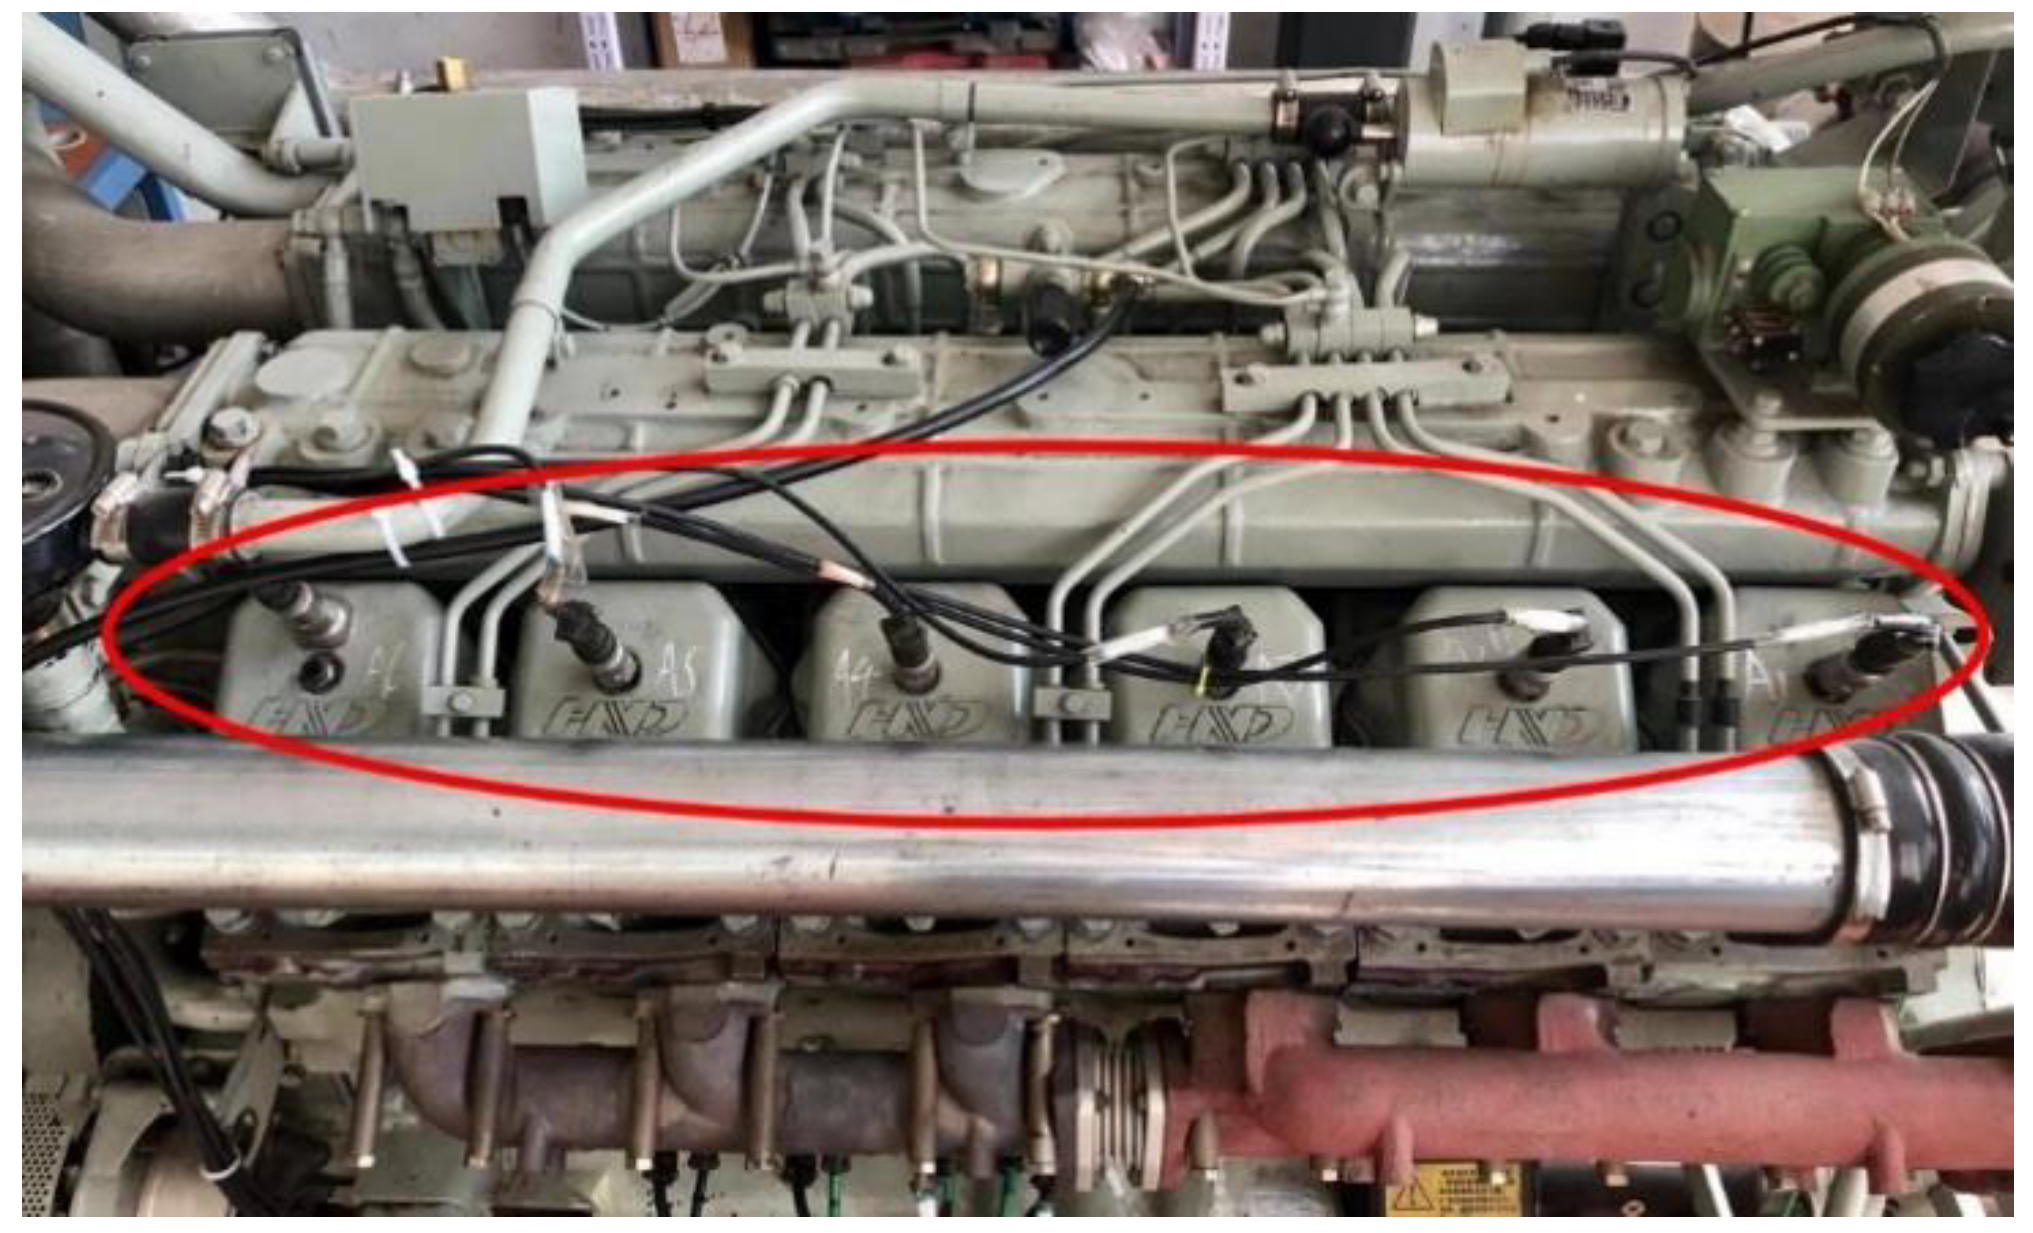
In order to verify the effectiveness of the proposed method in valve fault diagnosis, all the experiments would be conducted on a TBD234V12 direct injection diesel engine. The increase of valve clearance would lead to the increase of impact force when the valve was seated. According to the transmission path of vibration, the vibration generated by the valve was finally reflected on the surface of diesel engine cylinder head. Therefore, the vibration measurement point was determined to be the upper surface of the cylinder head of a diesel engine. The diesel engine has 12 cylinders which were arranged in two columns, named column A and column B. The major features of the diesel engine were summarized in Table 1. The vibration signals and pulse signals were sampled using a data acquisition (DAQ) system, in which the DAQ card had a 16-bit analog-to-digital converter (ADC) resolution and a maximum sampling rate of 102.4 KS/s per channel, and up to 32 analog inputs. Signals were processed by a computer with 16 GB of random access memory (RAM), and a 3.10 GHz Intel i7 processor. The interconnection of the main test rig components was shown in Figure 1.
The simulation experiment of valve faults was carried out under variable speed conditions with speeds of 1500, 1800, and 2100 r/min, respectively, and the load was kept constant at 1000 N·m. The accelerometer was mounted on the cylinder head through a screw connection. The sampling frequency was 51,200 Hz. The installation position of acceleration sensor is shown in Figure 2. In addition, a key phase sensor (i.e., an eddy current sensor) was mounted on the flywheel. Each time the diesel crankshaft made one revolution, the key phase pulse signals used to identify the start of the duty cycle would be recorded. The main parameters of the acceleration sensor and the eddy current sensor were shown in Table 2 and Table 3, respectively.
There were two groups in total, which were normal gap test and abnormal gap test. In view of the fact that the velocity and acceleration of the valve movement in the cam buffer section were small and the amount of change was small, the slight deviation of the valve clearance near the standard value would not have a significant impact on the operation of the unit. Therefore, a total of six valve clearances were set in the valve abnormality test group. The status and specific parameter settings are shown in Table 4. First, we needed to loosen the lock nut above the B1 to B6 cylinder valve in column B, then turned the adjusting screw to simulate the six types of faults according to the cylinder number sequence in the table: small intake valve clearance increment (fault 1), large intake valve clearance increment (fault 2), small exhaust valve clearance increment (fault 3), large exhaust valve clearance increment (fault 4), small intake and exhaust valve clearance increment (fault 5), and large intake and exhaust valves clearance increment (fault 6).

3. Principle of Diagnosis Based on Optimized VMD-RF Algorithm

3.1. The Basic Principle of VMD Algorithm

VMD is a new non-stationary and non-linear method in the signal decomposition and calculation field, which is based on the theoretical basis of classical Wiener filtering, Hilbert transform, and heterodyne demodulation. The essence is to iteratively solve the variational problem. VMD has a strict mathematical theory as the basis for the adaptive decomposition of signals [17].
According to the preset number of modal components, VMD can decompose the signal into K modes with center frequency and limited bandwidth. Through continuous iteration, the center frequency and bandwidth are updated to finally determine an ensemble of IMFs, written as u k ( t ) , k = 1 , 2 , , K . Input signal x ( t ) can be restored by simple summation. The decomposition of the algorithm is as follows [18,19,20]:
  • The analytic signal of each mode function u k ( t ) is computed by the Hilbert transform method, thus a unilateral spectrum of the analytic signal is obtained:
    [ δ ( t ) + j π t ] u k ( t ) .
  • Since it is necessary to adjust the center frequency of the analytical signal corresponding to each mode component, an exponent term e j ω k t is added to modulate the spectrum of each mode component to the baseband:
    [ ( δ ( t ) + j π t ) u k ( t ) ] e j ω k t .
  • The bandwidth of each component is estimated through the Gaussian smoothness of the demodulated signal, that is, the squared 𝐿2-norm of the gradient. According to the constraint conditions, the optimal variational mode is established:
    min { u k } , { ω k } { k = 1 K t [ ( δ ( t ) + j π t ) u k ( t ) ] e j ω k t 2 } s . t .     k = 1 K u k ( t ) = x ( t ) } ,  
    where ω k = { ω 1 , , ω k } are central frequencies of modes.
  • On this basis, the secondary penalty factor α and Lagrange multiplier factor λ ( t ) are introduced to solve the problem by transforming into a variational problem. Among them, the second penalty factor can guarantee the reconstruction accuracy of the signal and is not affected by Gaussian noise. The Lagrange multiplication factor can keep the constraint condition strict, and the extended Lagrange expression is as follows:
    L ( { u k ( t ) } , { ω k } , λ ( t ) )          = α k = 1 K t [ ( δ ( t ) + j π t ) u k ( t ) ] e j ω k t 2 2 + x ( t ) k = 1 K u k ( t ) 2 2          + λ ( t ) , x ( t ) k = 1 K u k ( t )   .
  • An alternate direction multipliers method (ADMM) is used to solve the original minimization problem, to find the saddle point of the augmented Lagrange expression through updating { u k ( t ) } ,   { ω k } ,   λ ( t ) alternately. So the signal was decomposed into different discrete modes adaptively.

3.2. VMD Algorithm Optimization Strategy

Before the vibration signal is decomposed by VMD method, the parameters including the number of the modes K and the penalty function α should be predefined in advance. However, it is usually very difficult to determine the number of the modes K in practical applications. In addition, we find that a certain value of K cannot keep good decomposition performances both in normal and fault conditions after manually adjusting the parameters many times. Therefore, based on the idea of wavelet packet decomposition, we propose a two-time decomposition strategy. In the process of testing parameters using the strategy, we found that the penalty function α has a significant impact on the width of the decomposition band. The larger the value of α , the smaller the bandwidth of the IMF component; the smaller the value of α , the larger the bandwidth of the IMF component. In order to obtain a suitable penalty function α , we consider that the IMF component after VMD satisfies the following two conditions [21]:
  • When the original signal two-time decomposition strategy is processed, the frequency spectral energy of the original signal leaks due to VMD. In order to make the IMF component signal have more valid information about the original signal, the energy leakage of the IMF component frequency spectrum should be minimized.
  • If the IMF component after the VMD contains more noise, and the impact characteristics associated with the fault are not obvious, the sparsity of the component signal is weak, and the power spectrum entropy value is large. If the IMF component contains more fault characteristic information and there is a significant pulse in the waveform, the signal has strong sparse characteristics and the power spectrum entropy is small. Therefore, we need to have the IMF component with the smallest power spectral entropy value.
At the same time based on the above two points, we propose a criterion for optimal selection:
T ar = p ( α ) + λ q ( α )   ,
where p represents the energy leakage ratio, q represents the power spectrum entropy increment ratio, α represents the penalty function, and λ represents the weighting factor. This paper takes λ = 0.75 .
Taking the vibration signal of large exhaust valve clearance increment (fault 4) at 1500 rpm as an example, we analyze the penalty function α as an independent variable, here the penalty function α [ 10 , 3000 ] . According to the above criteria for optimal selection, we can get the parabolic curve of Tar changing with α , as shown in the Figure 3.
From a partially enlarged image, we can find that when the penalty function α takes a value of 80, Tar can get the minimum value. Therefore, we decided to choose the penalty function α = 80 in this paper. The program code involved in this paper is all achieved in the MATLAB R2015b environment.
According to the two-time decomposition strategy performing the VMD algorithm, in the first time decomposition, the original signal D00 (fault 4) is decomposed into two modes defined as D11 and D12, then the low frequency mode decomposed again into two modes D21 and D22, equally the high frequency mode decomposed again into two modes D23 and D24, as shown in Figure 4. Obviously, the spectrum of different IMF components can be well separated and we calculate the spectral energy of each component as a fault feature that characterizes the valve clearance anomaly, indicating that the VMD method with the two-time decomposition strategy is capable of obtaining the fault-reflected components of vibration signals.

3.3. The Introduction of RF

The RF algorithm essentially belongs to the category of ensemble learning. It builds multiple individual decision trees based on randomly sampled information to make predictions, and finally selects the mode of the prediction target class as the final result by voting [22]. The randomness of RF is reflected in two aspects, one is the randomness of sample selection and the other is the randomness of the selection of feature attributes. Suppose that N decision trees are generated, there are M feature attributes of the sample. The RF model is based on the bootstrap sampling method to extract sample subsets from all training samples, and then randomly selects the specified number of feature attributes to establish each decision tree. Out-of-bag (OOB) data that is not in the sample subset can be used to evaluate the internal error of the decision tree classification accuracy. The most likely target category of OOB data can be comprehensively determined by voting. Through continuous iteration, the relationship between the OOB error and the number of decision trees is obtained, which provides a selection foundation for the number of decision trees [23]. The OOB error is expected to be lower, so the classification accuracy of RF is higher, and the generalization performance of the model is also better. The construction process for the RF classifier is shown in the Figure 5.
In addition to excellent classification performance, RF can also calculate the importance score V for each feature. After calculating the OOB error (B1) for each decision tree, the interference noise is randomly added to each feature variable of the out-of-pocket data. The values of other features are fixed and the OOB error (B2) is calculated again. The sum of the differences of the two types of OOB errors for all decision trees is divided by the number of decision trees N to obtain V. The importance score for any feature X can be expressed as:
V ( X ) = 1 N n = 1 N ( B 2 B 1 ) .
According to the importance score of feature parameters, feature selection can be performed on multi-dimensional features. Extracting feature parameters with larger V-values to optimize feature vectors can greatly improve the efficiency of program operation.

3.4. Proposed Optimized VMD-RF Analysis

In this paper, the advantage of VMD on the non-stationary signal is combined with the RF algorithm to diagnose the valve clearance fault of a diesel engine. Firstly, VMD parameters are determined by optimization criteria. Then, for each IMF component obtained by the two-time decomposition strategy, spectrum energy characteristics are extracted. In addition, some common time domain and frequency domain features are extracted from the original signal to form a comprehensive feature vector. Finally, the reduced feature parameters are determined through RF feature selection, and input into the RF classifier for abnormality alarm and fault identification of valve clearance. The fault diagnosis process is shown in Figure 6.

4. Examples of Application

4.1. Theoretical Analysis of Valve Train

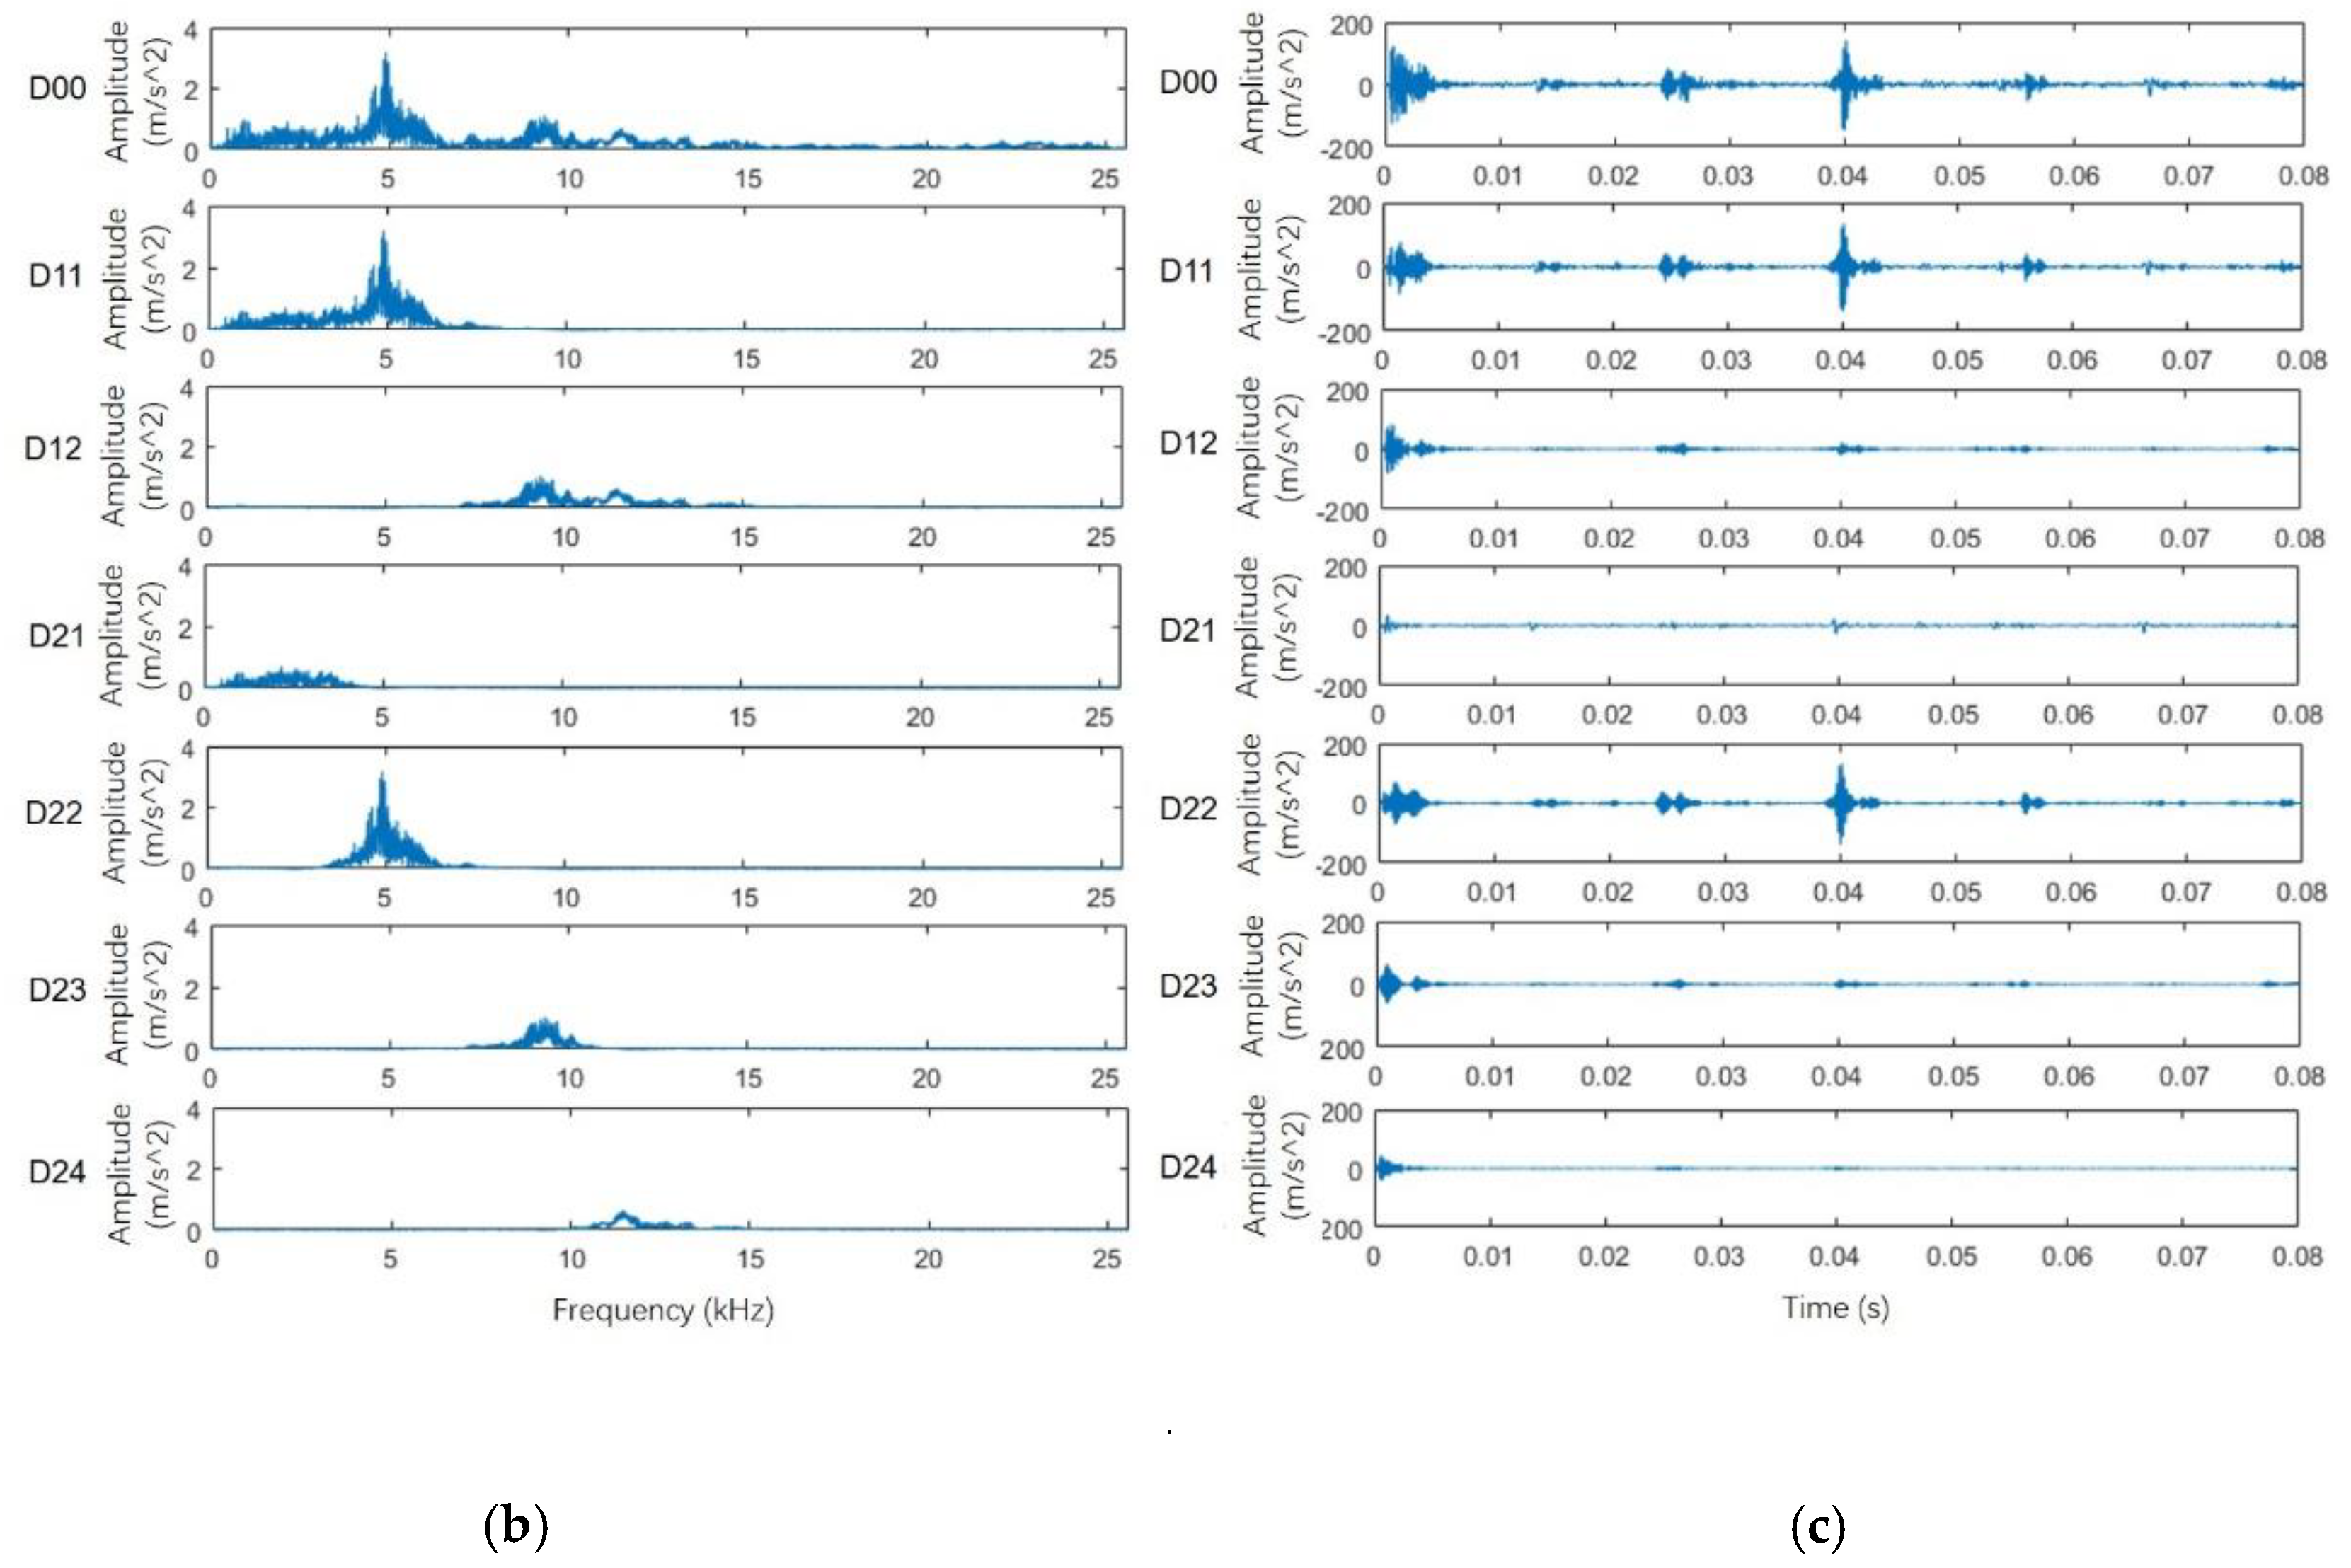
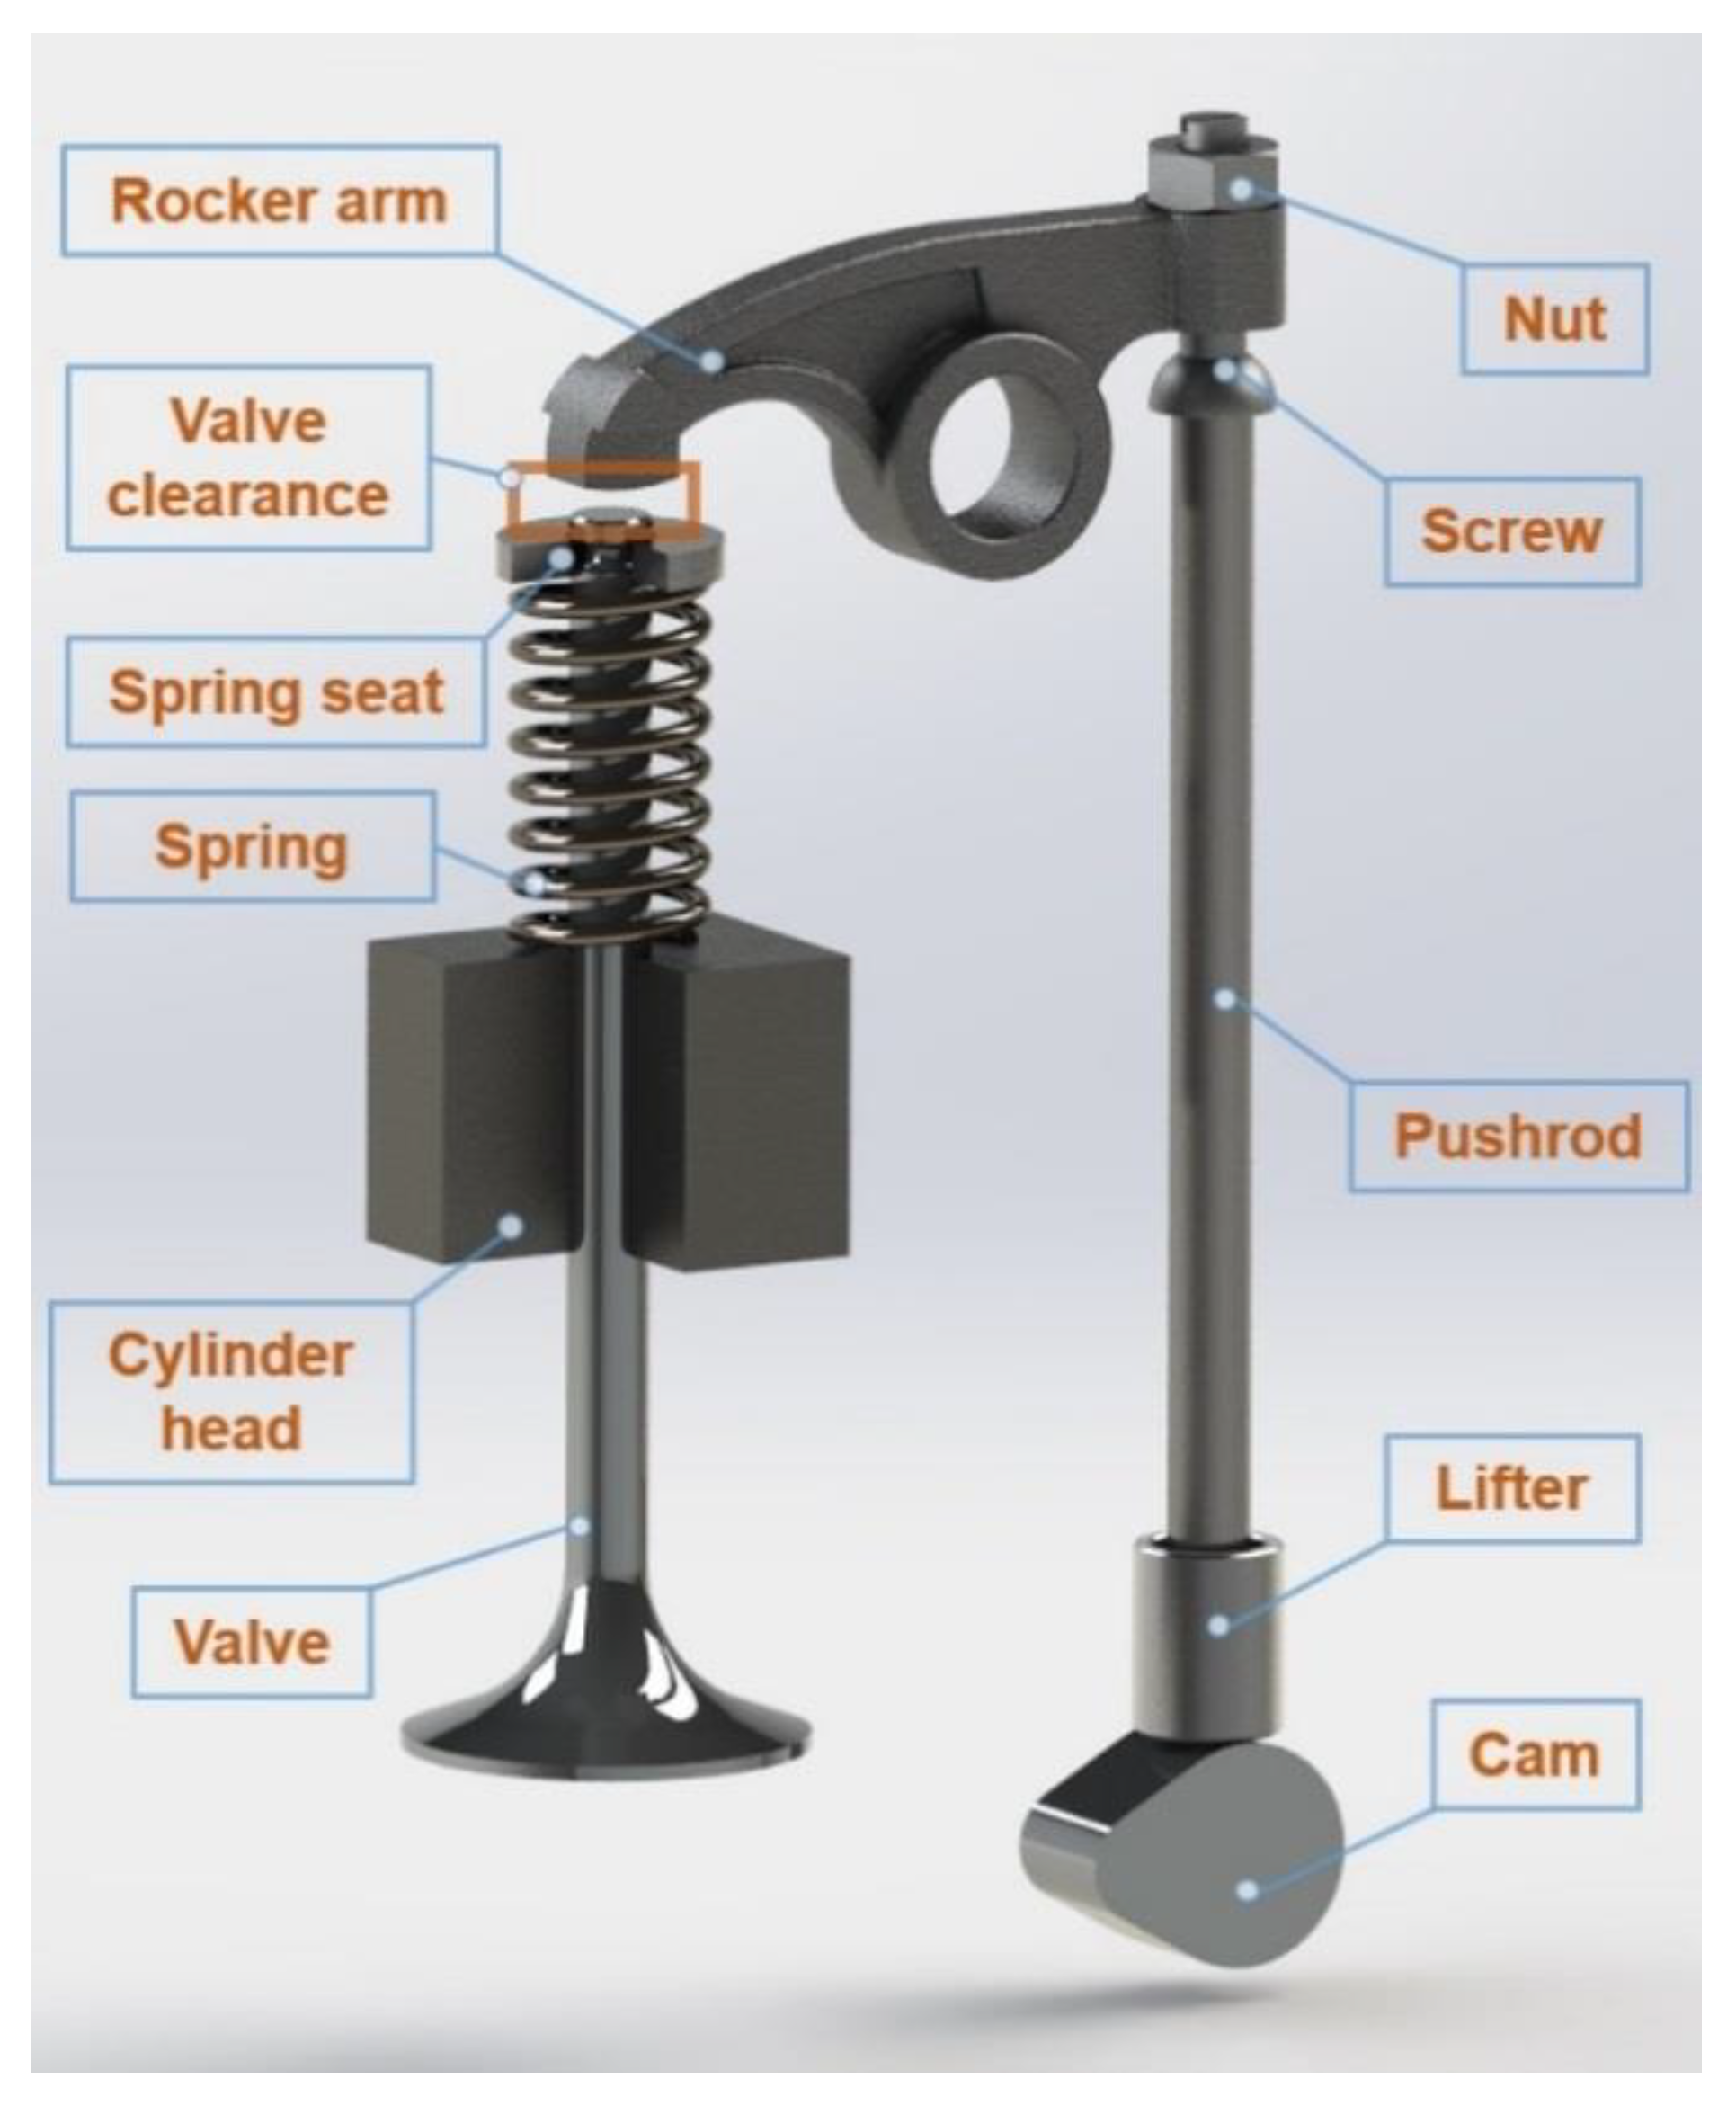
The valves allow mixture of air and fuel to enter into a cylinder’s compartment and the exhaust of residue to leave the cylinder’s compartment after one combustion cycle of a cylinder has been completed. As shown in Figure 7, a camshaft uses a cam to push against a valve so that it can be opened when the camshaft is rotated to its specific profile. A spring located on top of the valve returns it to the closed position. The lifting of the valve depends on the cam profile and the valve clearance [24]. When the valve has excessive clearance, the energy of vibration induced by impacting during the process of the valve opening and closing increases [25]. Therefore, vibration energy could be considered as an identification feature for valve clearance’s fault.
However, if an inspector uses only amplitude or energy of vibration signals to observe whether the clearance of the valve is proper, then the result could be misleading. A change in the diesel engine’s operating condition, such as working at different speeds, also affects the value of amplitude or vibration energy. Thus, there is a need for an analysis method that can obtain stable characteristics that do not change with the rotational speed of diesel engine to characterize changes in valve clearance.

4.2. Feature Extraction

These are considered as a pattern recognition problem which consists of three phases namely, feature extraction, feature selection and feature classification. Among them, feature extraction is a key step in fault diagnosis. It usually involves two important aspects: one is that the extracted features should be sensitive to the target fault, and the other is that they should be insensitive or less sensitive to other conditions. For this article, ideal characteristics should be able to effectively identify the fault of abnormal valve clearance under different rotational speed conditions of the diesel engine, that is, stability to the rotational speed conditions. The main purpose of this work was to develop a method to obtain desirable features for detecting and diagnosing abnormal valve clearance.
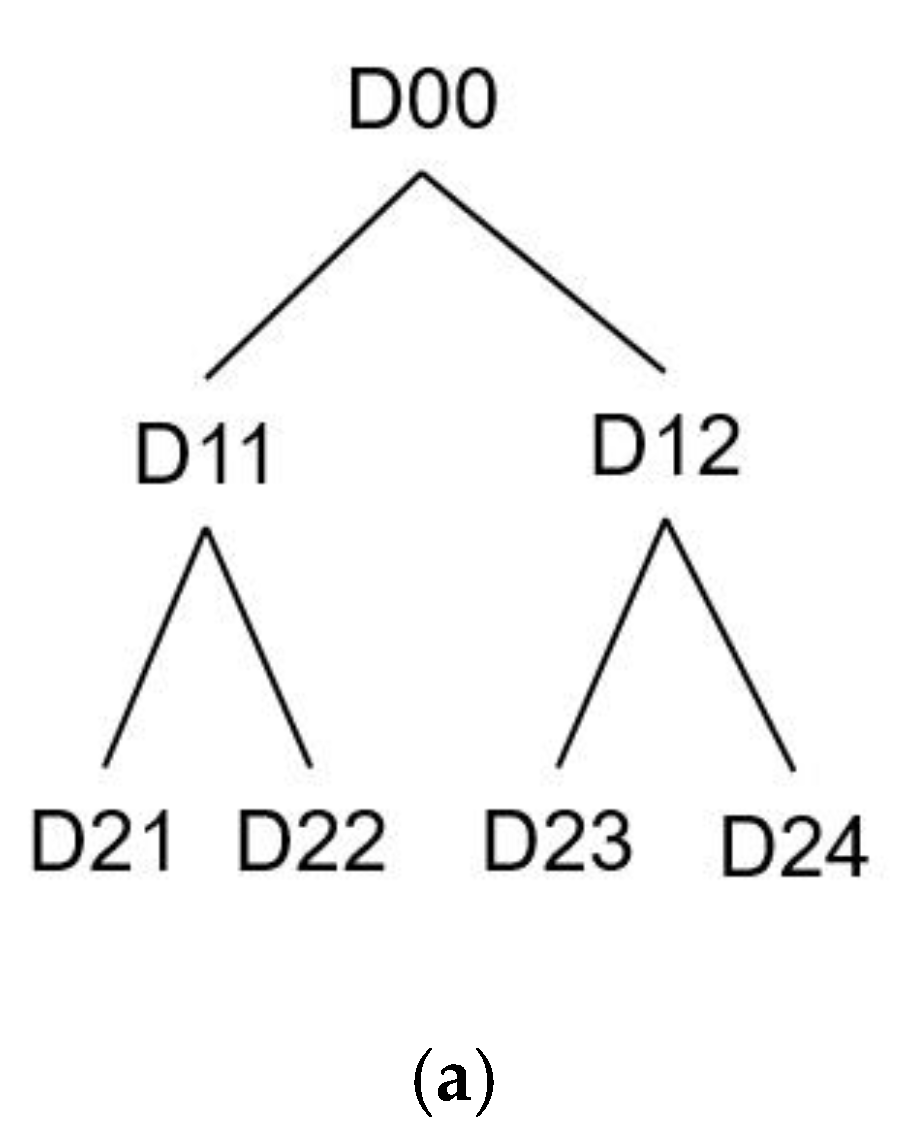
When the valve clearance became abnormal, the force of the valve impacting on valve seat changed, and the spectral energy of each frequency component in the signal changed accordingly. The IMFs produced by VMD represent a set of stationary signals in feature scales, of which the spectrum energy could be used to characterize different working states of valves. Therefore, the original signal was decomposed into D21, D22, D23, and D24 by the two-time decomposition strategy, and their spectral energies were taken as characteristic parameters.
Diesel engine’s vibration signal has the problems of local impact, wide frequency band distribution, and being susceptible to external noise. If we only used the VMD method to decompose the vibration signal, the characteristic information of valve fault could not be completely extracted. In order to fully reflect the working state of the valve, RMS value, peak value, peak-to-peak value, waveform index, pulse index, K-factor, crest factor, kurtosis, and skewness might be taken as time domain characteristic parameters representing the state of the vibration signal. For the valve, when the clearance was abnormal, the main frequency of the cylinder head’s vibration signal might move to high or low frequency, and its distribution was also an effective parameter reflecting the working state of the valve. Therefore, the center of gravity frequency, mean square frequency, frequency variance, RMS frequency, and standard deviation of frequency were used as frequency domain characteristics to reflect different valve’s operating conditions.
To sum up, this paper proposed to extract the spectral energy characteristics of IMFs, and combined the time domain and frequency domain features to comprehensively select feature parameters for establishing the feature vectors. The specific steps are as follows:
  • Acquiring experimental data for normal and fault conditions of diesel engine’s valves.
  • Studying the frequency components of the vibration signal. After determining the penalty function α by the criterion for optimal selection, each group of vibration signals was decomposed by the VMD method according to the two-time decomposition strategy.
  • The IMFs performed Fourier transform to calculate the corresponding spectral energy Ei and extracted the spectral energy characteristics. The formula is as follows:
    E i = n = 1 N | x i ( n ) | 2 , i = 1 , 2 , 3 .
  • Calculating the RMS value, peak value, peak-to-peak value, waveform index, pulse index, K factor, crest factor, kurtosis, and skewness of each group of signals.
  • Calculating the gravity frequency, mean square frequency, frequency variance, RMS frequency, and standard deviation of frequency of each group of signals.
  • Integrating spectrum energy of IMFs, nine time domain features and five frequency domain features, a total of 18-dimensional features were used to construct feature vectors.

4.3. Feature Selection

Since each feature parameter had to be calculated several times during the training and testing process, RF algorithm was complicated and had much calculation. If there were a lot of decision trees, the operation efficiency would be very low. Therefore, in practical applications, in order to improve the execution efficiency of the algorithm, feature selection ways needed to be performed on the initial feature vectors.
In order to reflect the classification effect of the method described in this paper under the condition of variable speed, the sample database was constructed by mixing the characteristic data under different working conditions. From all normal and faulty data obtained from experimental testing, 70% were randomly selected as the training set, and the remaining 30% as the test set. The training set data was input into the RF algorithm. There were two important parameters in the RF model, which were the number of decision trees and the number of random feature variables. Figure 8 showed the relationship between OOB error and number of decision trees. It could be seen from the figure that, with the increase of the number of decision trees, the OOB error gradually tended to be stable. Taking into account the accuracy and computational efficiency, 100 decision trees were selected. The random feature variable was called mtry which took the default value M = 5 , where M was the total number of features.
After the establishment of the RF model, random disturbances were applied to the individual characteristic variables of all the samples of the OOB (Out-of-Bag) data, and the importance score of the individual characteristic variable was calculated by Formula (6). Figure 9 showed the importance score’s ranking of all the characteristic variables.
According to Figure 9, the importance scores of the waveform index and the pulse index were very low. In order to reduce the redundancy of the feature parameters, only the first 15 feature parameters with high importance scores were retained. However, the feature dimension could not be too small, otherwise it was difficult to accurately detect the difference between distinct classification targets. Therefore, according to the order of importance scores from big to small, three to 15 dimensional feature vectors were selected in order to identify the abnormal valve condition. Figure 10 showed the average recognition rate of the valve condition in different dimensions of feature.
Figure 10 showed that, as the dimension of the feature vector increases, the average recognition rate gradually increased. When the dimension of the feature was 8, the average recognition rate reached the maximum and remained basically constant, indicating that the dimension of the optimal feature vector was 8, which could significantly highlight the difference between normal and abnormal valve conditions. Therefore, we chose 0.7 as the threshold to reduce the dimension of the initial 18-dimensional feature vector to obtain the optimal eigenvector. According to the order of importance scores, the D22 spectral energy, D21 spectral energy, D23 spectral energy, skewness, RMS value, K factor, D24 spectral energy, and peak-to-peak value were the characteristic parameters which contributed the most to the RF model’s classification effect. Table 5 showed the optimal eigenvectors for each valve state of the diesel engine. Due to space limitations, two samples were listed for each valve state. The optimal eigenvector was input into the RF algorithm to establish a classifier model which could identify the normal and abnormal valve state.

4.4. Valve Abnormality Alarm and Fault Diagnosis

In this experiment, 490 data were collected under each working condition of the diesel engine. Three different operating speeds (1500, 1800, and 2100 rpm) were investigated, and for every normal or fault conditions, there were 50 training and 20 test samples.
For the importance of fault alarm in the actual diesel engine, the normal or abnormal state should be identified first. So online monitoring system on site could timely give a warning to the machine protectors when the valve clearance was abnormal. A total of 420 groups of characteristic data in the test set were input into the RF algorithm for abnormal alarm processing, among which 60 groups were normal characteristic data and the remaining 360 groups were abnormal characteristic data. The comparison result of the classification effect of the RF reduction dimension and the initial feature vector was shown in Table 6.
The above analysis showed that the use of the RF algorithm for feature selection could retain the main feature information, that was, while reducing the data dimension, the recognition rate basically remained the same, and the time was significantly reduced, effectively improving the efficiency of fault diagnosis. In addition, this method ensured that the average recognition accuracy was above 90%, and could accurately make an alarm when the valve clearance became abnormal.
In order to help the on-site personnel to diagnose the fault type preliminary, under the premise that the system had made an abnormal alarm, it was necessary to make further decisions on what fault type the valve specifically belonged to. For the 1260 groups of the abnormal valve data, there were 420 groups data of increasing intake valve clearance (fault 1 and fault 2), 420 groups of increasing exhaust valve clearance (fault 3 and fault 4), and 420 groups of increasing both intake and exhaust valve clearance (fault 5 and fault 6). A total of 360 groups of data are randomly selected as the test set, and the number of each fault state data is 120 groups. The rest of the data was used as a training set. The RF classifier was again constructed using the training set data. Furthermore, the confusion matrix was shown in Table 7.
According to Table 7, after the system alarms, it could accurately identify the specific fault type of the valve clearance as well. Among them, only nine intake valve clearance faults were diagnosed as other faults, and the recognition rate reached 92.5%. Only eight exhaust valve clearance faults were misdiagnosed as other faults, and the accuracy reached 93.33%. The situation of both valve clearance faults was the same as the exhaust valve clearance fault. The recognition rate of the overall valve fault reached 93.06% and satisfactory results were obtained under different speed conditions.
In order to highlight the advantages of the fault diagnosis method based on VMD and RF, this method was compared with the other two methods, as shown in Table 8.
As could be seen from Table 8, the combination method of statistical characteristics in the time and frequency domain and KNN was poor in the performance of the fault identification rate for the increase of exhaust valve clearance. Although the performance of EMD and the decision tree algorithm in the recognition accuracy of three faults was not bad, the average recognition rate was only 84.76%. The combined method of VMD and RF presented in this paper performed well in the recognition rate of three valve clearance faults, and the average recognition rate was obviously higher than the other two methods.

5. Conclusions

In this paper, a new fault identification method of the diesel engine valve clearance was proposed, which was based on the improved VMD and RF. It not only could alarm the valve abnormality, but also could identify the specific fault type accurately. In the key process of the nonstationary signal decomposition of this method, a novel parameters optimization strategy for VMD was carried out, which was based on reducing the energy leakage of the IMF component frequency spectrum and the minimum IMF component of power spectral entropy. Moreover, the RF algorithm was employed to rank the importance of all the extracted features for the purpose of reducing the dimension and improving the computational efficiency. According to the threshold value, the features with greater importance were selected to form the feature vector. The verification results under the variable operating condition of the diesel engine proved that the fault diagnosis method could effectively recognize the specific fault type of valve clearance, of which the average recognition accuracy reached more than 90%. In addition, this paper also made a comparative analysis with frequently-used feature extraction and fault detection methods. The combined VMD and RF method proposed in this paper had a better identification rate for the three valve clearance faults. In the future, the valve clearance detection approach will be further studied on different engines and finally built into a real-time monitoring system.

Author Contributions

Conceptualization, N.Z. and Z.M.; methodology, D.W.; software, H.Z.; validation, Z.M., J.Z. and Z.J.; investigation, H.Z.; resources, Z.J.; data curation, N.Z.; writing—original draft preparation, N.Z.; writing—review and editing, Z.M.; visualization, N.Z.; supervision, J.Z.; project administration, Z.J. All authors have read and agreed to the published version of the manuscript.

Funding

This research was funded by National Key Research and Development Plan, grant number 2016YFF0203305 and by the Fundamental Research Funds for the Central Universities, grant number JD1815.

Conflicts of Interest

The authors declare no conflicts of interest.

Abbreviations

ADMMalternate direction multipliers method
ADCanalog-to-digital converter
DAQdata acquisition
EEMDensemble empirical mode decomposition
EMDempirical mode decomposition
FFTfast Fourier transform
IMFintrinsic mode function
LMDlocal mean decomposition
RFrandom forest
OOBout-of-bag
RMSroot mean square
RAMrandom access memory
SVMsupport vector machine
VMDvariational mode decomposition
KNNk-nearest neighbor

References

  1. Jiang, Z.; Mao, Z.; Wang, Z.; Zhang, J. Fault diagnosis of internal combustion engine valve clearance using the impact commencement detection method. Sensors. 2017, 17, 2916. [Google Scholar] [CrossRef] [PubMed] [Green Version]
  2. Szymański, G.M.; Tomaszewski, F. Diagnostics of automatic compensators of valve clearance in combustion engine with the use of vibration signal. Mech. Syst. Signal Process. 2018, 68–69, 479–490. [Google Scholar]
  3. Qin, X.; Li, Q.; Dong, X.; Lv, S. The fault diagnosis of rolling bearing based on ensemble empirical mode decomposition and random forest. Shock Vib. 2017, 2017, 1–9. [Google Scholar] [CrossRef]
  4. Kim, J.; Park, S.S.; Bae, C. The effects of late intake valve closing and different cam profiles on the in-cylinder flow field and the combustion characteristics of a compression ignition engine. Part D J. Automob. Eng. 2018, 232, 853–865. [Google Scholar] [CrossRef]
  5. Li, M.; Yang, Q.; Song, M.; Yang, F. Fault diagnosis of diesel engine based on energy and time frequency domain characteristics of vibration signals IMF. Trans. Chin. Soc. Agric. Eng. 2012, 28, 37–43. [Google Scholar]
  6. Flett, J. Fault detection and diagnosis of diesel engine valve trains. Mech. Syst. Signal Process. 2016, 72–73, 316–327. [Google Scholar] [CrossRef]
  7. Si, J.P.; Ren, Q.S.; Liang, H.B.; Zhang, B.W. Valve clearance fault detection based on wavelet packet analysis. J. Vib. Shock. 2011, 30, 64–68. [Google Scholar]
  8. Shen, Z.X.; Huang, X.Y.; Ma, X.X. Fault diagnosis of diesel engine based on empirical mode decomposition and support vector machine. J. Vib. Meas. Diagn. 2010, 30, 19–22. [Google Scholar]
  9. Zhang, J.H.; Liu, Y.; Bi, F.R.; Lin, J.W.; Ma, W.P.; Ma, L. Diesel engine valve fault diagnosis based on LMD and SVM. Trans. Csice. 2012, 30, 469–473. [Google Scholar]
  10. Xu, Y.B.; Cai, Z.D. Application of variational modal decomposition and K-L divergence to bearing fault diagnosis of vibrating screens. Noise Vib. Control. 2017, 37, 160–165. [Google Scholar]
  11. Li, Z.; Chen, J.; Zi, Y.; Pan, J. Independence-oriented VMD to identify fault feature for wheel set bearing fault diagnosis of high speed locomotive. Mech. Syst. Signal Process. 2017, 85, 512–529. [Google Scholar] [CrossRef]
  12. Mohanty, S.; Gupta, K.K.; Raju, K.S. Comparative study between VMD and EMD in bearing fault diagnosis. In Proceedings of the IEEE International Conference on Industrial & Information Systems, Gwalior, India, 15–17 December 2015; pp. 1–6. [Google Scholar]
  13. Jiang, X.X.; Li, S.M.; Chen, C. A novel method for adaptive multiresonance bands detection based on VMD and using MTEO to enhance rolling element bearing fault diagnosis. Shock Vib. 2016, 2016, 1–20. [Google Scholar] [CrossRef] [Green Version]
  14. Wang, Y.; Markert, R.; Xiang, J.; Zheng, W. Research on variational mode decomposition and its application in detecting rub-impact fault of the rotor system. Mech. Syst. Signal Process. 2015, 60–61, 243–251. [Google Scholar] [CrossRef]
  15. Li, Y.; Wang, Y.; Zi, Y.; Zhang, M. An enhanced data visualization method for diesel engine malfunction classification using multi-sensor signals. Sensors 2015, 15, 26675–26693. [Google Scholar] [CrossRef] [PubMed] [Green Version]
  16. Satishkumar, R.; Sugumaran, V. Vibration based health assessment of bearings using random forest classifier. Indian J. Sci. Technol. 2016, 9, 1–6. [Google Scholar] [CrossRef] [Green Version]
  17. Chen, K.; Zhou, X.C.; Fang, J.Q.; Qin, L. Study on frequency characteristics of rotor systems for fault detection using variational mode decomposition. Int. J. Rotating Mach. 2017, 2017, 1–11. [Google Scholar] [CrossRef]
  18. Dragomiretskiy, K.; Zosso, D. Variational mode decomposition. IEEE Trans. Signal Process. 2014, 62, 531–544. [Google Scholar] [CrossRef]
  19. Li, F.; Li, R.; Tian, L.; Chen, L.; Liu, J. Data-driven time-frequency analysis method based on variational mode decomposition and its application to gear fault diagnosis in variable working conditions. Mech. Syst. Signal Process. 2019, 116, 462–479. [Google Scholar] [CrossRef]
  20. Jiang, X.; Wang, J.; Shi, J.; Shen, C.; Huang, W.; Zhu, Z. A coarse-to-fine decomposing strategy of VMD for extraction of weak repetitive transients in fault diagnosis of rotating machines. Mech. Syst. Signal Process. 2019, 116, 668–692. [Google Scholar] [CrossRef]
  21. Zhou, S.L.; Liao, X.J.; Shi, J. Kernel parameter selection of RBM-SVM and its application in fault diagnosis. J. Electron. Meas. Instrum. 2014, 9, 69–74. [Google Scholar]
  22. Cabrera, D.; Sancho, F.; Sánchez, R.V.; Zurita, G.; Cerrada, M.; Li, C.; Vásquez, R.E. Fault diagnosis of spur gearbox based on random forest and wavelet packet decomposition. Front. Mech. Eng. 2015, 10, 277–286. [Google Scholar] [CrossRef]
  23. Sonje, D.M.; Kundu, P.; Chowdhury, A. A novel approach for multi class fault diagnosis in induction machine based on statistical time features and random forest classifier. In Proceedings of the IOP Conference Series: Materials Science and Engineering, Narsimha Reddy Engineering College, Hyderabad, India, 3–4 July 2017; pp. 1–10. [Google Scholar]
  24. Kim, J.; Bae, C. An investigation on the effects of late intake valve closing and exhaust gas recirculation in a single-cylinder research diesel engine in the low-load condition. Part D J. Automob. Eng. 2016, 230, 771–787. [Google Scholar] [CrossRef]
  25. Jiang, J.; Gu, F.; Gennish, R.; Moore, D.J.; Harris, G.; Ball, A.D. Monitoring of diesel engine combustions based on the acoustic source characterisation of the exhaust system. Mech. Syst. Signal Process. 2018, 22, 1465–1480. [Google Scholar] [CrossRef]
Figure 1. The interconnection of the main test rig components.
Applsci 10 01124 g001
Figure 2. Installation diagram of the cylinder head accelerometer.
Applsci 10 01124 g002
Figure 3. Optimal selection criteria curve.
Applsci 10 01124 g003
Figure 4. The spectrum and mode obtained by VMD (Variational Mode Decomposition) in fault 4 condition: (a) VMD decomposition tree (b) spectrum (c) mode.
Applsci 10 01124 g004aApplsci 10 01124 g004b
Figure 5. Construction process for the RF (Random Forest) classifier.
Applsci 10 01124 g005
Figure 6. Fault diagnosis process.
Applsci 10 01124 g006
Figure 7. Sketch of valve train.
Applsci 10 01124 g007
Figure 8. Relationship between OOB (Out-of-Bag) error and number of decision trees.
Applsci 10 01124 g008
Figure 9. Importance score’s ranking of variables.
Applsci 10 01124 g009
Figure 10. Average recognition rate of the valve condition in different dimensions of feature.
Applsci 10 01124 g010
Table 1. Features of the TBD234V12 diesel engine.
ItemValue
Number of cylinders12
ShapeV-shaped 60°
Firing sequenceB1-A1-B5-A5-B3-A3-B6-A6-B2-A2-B4-A4
Rating speed2100 rev/min
Rating power485 kW
Intake valve normal clearance0.3 mm
Exhaust valve normal clearance0.5 mm
Table 2. The main parameters of the acceleration sensor.
Performance SpecicationUnitValue
Voltage sensitivitymV/g10
Frequency range (±5%)Hz1~10,000
Frequency range (±10%)Hz0.4~16,000
Natural frequencyHz42,000
Amplitude range±g pk500
Residual noiseg rms0.0003
Mechanical shock limit±g pk5000
Temperature range°C−55~125
Amplitude linearity%±1
Table 3. The main parameters of the eddy current sensor.
Performance SpecicationUnitValue
Incremental scale factorV/mm3.94
Frequency ResponseHz0~8000
Temperature range°C0~45
Linear Rangemm4
Table 4. The experimental parameters of valve clearance faults.
CylinderNormal Valve ClearanceAbnormal Valve Clearance
Intake Valve/mmExhaust Valve/mmIntake Valve/mmExhaust Valve/mm
B40.30.50.60.5
B10.30.50.90.5
B50.30.50.30.8
B20.40.40.41.1
B60.30.50.60.8
B30.30.40.91.1
Table 5. The optimal eigenvectors for each valve state.
Characteristic ParametersNormalFault 1Fault 2Fault 3Fault 4Fault 5Fault 6
D22 spectral energy171.90189.17189.73110.79333.94200.77338.66
D21 spectral energy26.5931.7324.4923.9848.5351.7736.34
D23 spectral energy20.6534.3820.5481.3327.3558.3728.03
Skewness521.87351.68340.76269.50267.59151.3671.69
RMS value12.2313.3912.6511.9716.5914.7317.10
K factor1554.592267.511675.371325.592592.552323.663462.29
D24 spectral energy4.509.866.416.4410.317.6650.48
Peak-to-peak value239.2313.1264.4200.3309.9299.7367.7
Table 6. The comparison result of the classification effect.
Data Processing MethodRecognition Accuracy of Normal State/%Recognition Accuracy of Abnormal State/%Average Recognition Accuracy/%Running Time of Program/s
RF reduction dimension91.67 (55/60)92.5 (333/360)92.38 (388/420)7.22
initial feature vector93.33 (56/60)92.22 (332/360)92.38 (388/420)14.06
Table 7. Confusion matrix.
Fault TypeNumber of Test’s GroupClassification ResultRecognition Rate/%Average Recognition Rate/%
Increased Intake Valve ClearanceIncreased Exhaust Valve ClearanceIncreased in Both Valve Clearance
Increased intake valve clearance1201115492.593.06
Increased exhaust valve clearance1205112393.33
Increased in both valve clearance1204411293.33
Table 8. Comparison of different fault diagnosis methods.
Recognition Rate/%
Fault ModeStatistical Characteristics in Time and Frequency Domain + KNN (K-Nearest Neighbor)EMD + Decision TreeVMD + RF
Increased intake valve clearance85.7188.5792.5
Increased exhaust valve clearance71.438093.33
Increased in both valve clearance91.4385.7193.33
Average recognition rate/%82.8684.7693.06

