Abstract
When inner cavities of significant dimensions exist in natural rocks, problems arise when a shallow foundation for a building, bridge or other structure is builtonthem. Thus, taking one of the most representative cavity geometries in nature, the ellipsoidal horizontal shape, the main objective of this study is to obtain the ultimate bearing capacity of the foundation with cavities of different sizes and positions, on rock masses with different strengths and deformation characteristics. The study focuses on natural rocks of karst origin (in limestones, dolomites or gypsums) and of volcanic origin. The ultimate bearing capacity is determined relative to a situation without the existence of the cavity for different cavern positions and sizes, rock types (mi), strengths (UCS), and states (GSI) of the rock mass. The results showed that the most decisive parameter is the relative eccentricity. The influence of the rock type (Hoek’s parameter mi) is, for practical purposes, negligible (lower than 10%). The strength and condition of the rock mass (parameters UCS and GSI) have relatively little influence on the results obtained. This study aims to provide a simple design criteria for universal use, with different geometric configurations and qualities of rock masses that can be used directly without the need for sophisticated calculations by the designer.
1. Introduction and Objectives
Cavities of significant dimensions may exist in natural rocks, mainly in evaporitic and carbonate rocks but also in volcanic rocks. These cavities can represent a grave risk when a shallow foundation, such as for a building, bridge or other structure, is builtonthem. This fact may substantially determine the calculation results of the foundations. This is a relatively frequent problem worldwide, given the vast areas where these types of rocks appear. In the history of construction, there are many examples of failures of this nature, and the issue is the subject of periodic meetings of experts [1] and of studies evaluating their risk [2]. In Spain, these three types of rock masses are all present, with the surfaces occupied by limestones and dolomites covering 30% of the territory each, while 12% is occupied by evaporitic rocks [3]. The volcanic rocks are mainly located in the Canary Islands, where there are important networks of lava tubes in which safety and stability measures for the vaults must be maximised [4,5].
In carbonate and volcanic rock masses, the voids are inherited and do not usually evolve in short periods of time, unlike in evaporites, where the cavities can be enlarged by dissolution, compromising the stability of the infrastructures within their useful life.
On the other hand, there are many precedents and information in the literature about the stability of anthropic caverns such as tunnels and galleries [6,7,8,9]. However, there are not many studies on the influence of a cavity in the vicinity of a shallow foundation on it sultimate bearing capacity. Jianyi and Jian [10] conducted an analytical calculation on the roof of a karst cavity with a Quaternary cover, which is presented in Mancebo [11] for different cases of flat or semi-spherical roofs with water tables both below and above the roof. There are other stability analyses that consider failures assimilated to landslides. Wei Yong Yao [12] discussed three different processes of karst collapse under the effects of positive and negative pressures, establishing critical mechanical models for each of them. Jorda et al. [13] investigated the stability calculation of a known karst cavity, accessible through the stability graph method, which is widely used to analyse polyhedral mining rooms (approach index engineering rock mass classifications). The analytical solutions of Serrano et al. [4] are also available, which refer to large cavities in volcanic rocks, in which the size and shape of the lava tube section (rectangular and circular) are correlated with the surface’s ultimate bearing capacity by means of simple calculation models (beam under uniformly distributed load for rectangular sections).
The analysis of Waltham and Fookes [14] stands out. This research deals with the cover stability of large cavities near the surface through reduced-scale laboratory tests. From this study, the increase of the failure loads with the cover and the bed/strata thickness can be observed. According to this reference, for a given quality of a typical limestone, the cover stability is ensured when its thickness is 70% of the cave width. In the case of gypsum, because it has a lower strength, a greater cover thickness is required. In the present paper, unlike in the previous reference, the determination of the bearing capacity of a shallow foundation over a rock mass with cavities is analysed by applying sophisticated numerical models to study how its presence influences the ultimate bearing capacity of the footing.
Thus, taking one of the most representative cavity geometries in nature as the starting point, the main objective of this study is to obtain the ultimate bearing capacity of the foundation with cavities of different sizes and positions, on rock masses with different strengths and deformation characteristics, by means of the modified Hoek–Brown failure criterion. It aims to provide simple design criteria for universal use, with different geometric configurations and qualities of rock mass, that can be used directly without the need for sophisticated calculations by the designer.
The significance of this work is that it enables the correlation of the foreseeable cavities near a shallow foundation, limited by the scope of the geotechnical survey carried out in the subsoil, with the reduction of their sinking load, by using the different penalty curves obtained, without forgetting the necessary precautions that a natural environment requires to minimize risks.
2. Methodology
2.1. Election of the Standard cross Section of the Cavity to Be Modelled. Morphology of Frequenet Real Cases
One of the first difficulties encountered in this study was the definition of representative typologies of the morphology and size of the cavities that may be found under projects with shallow foundations, given that there may exist a great variability depending on the type of rock mass, even within the same cave. Thus, this high variability in cavities in karst environments is not related to the homogeneous types of sections and the resemblance in shapes found in lava tubes.
The size and sections of cavities in karst rocks are influenced by many factors (lithology, structure, geomorphological processes, hydrogeological evolution, etc.); therefore, the resulting geological models may be very different. It is likely that only through a comprehensive study of the local karsts would we get an idea about the typical and maximum sections and sizes.
To be able to study most of the geological cases present in reality by means of mathematical models, these cases need to be grouped and classified. In this context, specific examples of cavities with the usual sections, representative of the three types of grounds with cavities of considerable size in Spain, have been examined.
After a detailed bibliographic review of characteristic sections of simple horizontal cavities in karst and volcanic terrains, a cross-section of the ellipsoidal horizontal type was selected as the most representative, varying its horizontal and vertical axes for modelling (Figure 1).
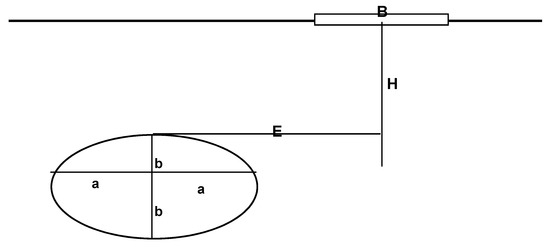
Figure 1.
Geometry: a: horizontal semi-axis, b: vertical semi-axis, E: load eccentricity, H: cavity depth or cover thickness, B: foundation width.
2.1.1. Characteristic Sections of Lava Tubes in the Canary Islands
Lava tubes, or sub-basaltic tunnels, are characteristic caverns that are created inside basic basaltic lava flows (generally of the pahoehoe and aa types) during an eruption, which flow underground because the upper part of the flow hardens in contact with the atmosphere or under the cooler seawater, forming a shell. When the flow of lava from the source decreases, these pipes are gradually emptied of lava, constituting genuine galleries. These natural tunnels develop more longitudinally than transversally, with lengths ranging from a few metres to several kilometres. They also present a reduced slope; therefore, for engineering purposes, they may be considered as horizontal. According to the bibliography consulted about lava tubes in the Canary Islands [15,16,17,18]), it may be concluded that, although the tubes of the Canary Islands are often classified as presented either in a single gallery (channel type) or in labyrinthine pipes, the existing typical simple cavities are quite similar to those shown in Table 1. The first entry in the table corresponds to the Corona volcano [17] in Lanzarote Island, representative of the channel type, whose dimensions are: 9 m wide and 12 m high and which will be approximated as an ellipse with axes of the same dimensions (width 2a = 9 m, height 2b = 12 m, and height/width ratio = 1.33) in the calculation model analysed. In the same table, the dimensions of the other characteristic sections of the labyrinthine type, such as the tubes of the caves of El Llano, El Viento and Don Justo [18], can also be observed, with height/width ratios that range between 0.33 and 0.50.

Table 1.
Morphology of the most representative real cases of caverns.
2.1.2. Characteristic Sections in Carbonate Massifs
Although the morphologies of cavities in carbonate rock masses are highly variable [19], a characteristic cavity can be considered to be an elemental ellipsoidal, almost rectangular, section (see dimensions in Table 1), with a sub-horizontal axis, conditioned by the distinctive horizontal alignment of the caves [20,21,22]. According to Waltham and Fookes’ classification of karsts from an engineering perspective [14], most caves in temperate climate zones are less than 10 m wide in cross-section, although in tropical areas they can be up to 100 m wide. This has been approximately corroborated with a review of Puch’s Catalogue of large cavities from Spain [23]. Based on the above, sections of the Güerta cave (Asturias), which is 10 m wide and 2.5 m high, and El Reguerillo cave (Torrelaguna, Madrid), which is 7 m by 5 m [23], have been chosen to carry out the calculations in this study.
2.1.3. Characteristic Sections in Gypsum Massifs
In the case of evaporitic rock masses, such as the ones from Sorbas (Almería) [24] and Madrid [2], two types of sections have been considered (Table 1): the first one with a 12-m-wide and 5-m-high inverted triangular shape, which is approximated as a 12-m-wide and 2.50-m-high ellipse, and the second one with a 7-m-wide and 1.5-m-high flat arched section, which is approximated as a7-m-wide and 3-m-high ellipse.
2.1.4. General Characteristic Section Adopted
Based on the above, all the previous sections can be reasonably adjusted to a cross section of the ellipsoidal horizontal type, varying its horizontal (2a) and vertical (2b) axes for modelling, as indicated in Table 1.
2.2. Characterisation of the Rock Mass
The geomechanical characterisation of the rock mass prior to the numerical modelling is usually based on the identification and quantification of the ten basic parameters recommended by the International Society for Rock Mechanics (ISRM) [25]. For simplification purposes, to be able to reproduce the behaviour of rock masses at failure in the face of external static loads, there are three fundamental parameters, in addition to the anthropic factors, that condition their response:
- -
- The rock lithology (in this case, the parameter used is mi).
- -
- The quality of the rock mass, identifiable through any of the geomechanical classifications, especially the geological strength index (GSI) [26], which, in general, can be assumed to be equal to the basic rock mass ratio (RMRb) of Bieniawskii [27].
- -
- The uniaxial compressive strength of the rock matrix (UCS).
The representative values of these parameters, used in this study for each type of rock mass, are presented in Table 2.

Table 2.
Geomechanical parameters used according to the type of rock mass.
2.3. Numerical Analysis
2.3.1. General Hypotheses
In the numerical study performed, the following hypotheses have been adopted:
- -
- The rock mass is considered to be homogeneous and isotropic.This isotropy hypothesis is particularly important because the possible presence of singularities or discontinuities in the rock mass volume would lead to a drastic decrease in the values of the ultimate load that would be obtained.
- -
- The finite difference method is used, with a perfect elastoplastic behaviour. The software employed is FLAC 3Dv 5.01 (ITASCA, Minneapolis, MN, USA) [28]. It allows for the parameterisation of the variable dimensions of the model in a simple way. Additionally, this code can simulate the effect of the foundation by applying a very reduced speed movement (analysis in displacement control) to correct possible convergence problems when approaching plasticisation.
- -
- The modelling domain considers the separation of the lateral boundaries to allow for the assumption that they have no influence on the results obtained. In relation to the lower boundary, it has always been placed in such a way that there is a thickness of rock mass under the upper cavity at the height thereof. These distances have been adjusted and verified in each model based on the geometry and the analysis considered.
- -
- The geometry of the caverns modelled present an elliptical cross-section, with horizontal axis 2a, vertical axis 2b, and depth or cover thickness H. Different values for the dimensions a and b have been considered, as well as different slenderness ratios b/a. The cover is shown in relation to the vertical semi-axis: H/b.
- -
- The surface load has been introduced by imposing a uniform vertical movement (simulation by displacement control), equivalent to a rigid foundation, with a width B, and eccentricity E, measured from the axis of the cavern. Different values for the dimensions B and E have been considered. The eccentricity is shown in relation to the horizontal semi-axis: E/a.
- -
- The modelled ground, despite being three-dimensional, includes boundary conditions to simulate the hypotheses of a flat deformation (considered to have a thickness of 1 m). The boundaries in X and Y are established according to the ellipse parameters (a,b), to guarantee that their presence does not affect the results.
- -
- The failure criterion adopted is the modified Hoek–Brown criterion, which is an evolution of the generalised Hoek–Brown criterion incorporated in the Flac3D software [29] and which allows for a more advanced control over the dilation angle and the plastic flow rule. Different values of the geotechnical parameters have been considered (RMRb or GSI, UCS and mi).
With all these hypotheses, the ultimate bearing capacity (qu) is obtained for each case with the combination of the variables described, from a detailed analysis of the vertical load Q (kN/m2) and the vertical movement imposed(mm) curve of the middle point of the surface load.
The obtention of the relative ultimate bearing capacity (qu/qu,H&I) is of particular interest. Its value is the ratio of the ultimate bearing capacity (qu) for each case resulting from the combination of variables to the ultimate bearing capacity without the existence of the cavern (qu,H&I).
Through this methodology, it is possible to evaluate the influence of the presence of an elliptical cavern on the ultimate bearing capacity of a shallow foundation, based on its geometrical characteristics (dimensions and relation between the ellipse axes and vertical/horizontal disposition of the major axis), the cavity cover, and the geotechnical parameters of the rock mass, together with the size and eccentricity of the surface load (Figure 1).
2.3.2. Failure Criterion of the Rock Mass
From all the criteria currently used to analyse failure phenomena, the Hoek–Brown criterion, be it the original [30], modified [31], or generalised [29], is probably the most employed, both in specialised journals and international conferences and symposia.
Here, the generalised Hoek–Brown criterion is adopted [29], which presents the following expression:
where:
- σ′1 and σ′3: maximum and minimum effective principal stresses at failure;
- m, s and a: Hoek–Brown parameters for the rock characterisation according to its type and condition;
- σci: uniaxial compressive strength of the intact rock (UCS).
The data needed for the estimation of the parameters representing the strength of the rock mass are the following:
- The value of the uniaxial compressive strength of the intact rock blocks (UCS).
- The value of the Hoek–Brown constant mi.
- The value of the GSI Index, representative of the quality conditions of the rock mass.
The formulation needed to obtain the parameters m and s is:
where D is a factor dependent on the degree of jointing and disturbance due to blasting and consequent stress relaxation. It ranges from 0 for undisturbed rock masses to 1 for strongly disturbed rock masses due to human impact. Given that the aim of this study is to analyse rock media in their natural state, without any human intervention (except for possible small excavations), the anthropic factor D is considered to be null (D = 0) in this study.
To assess the influence of a cavern, it is first necessary to obtain the ultimate bearing capacity of the rock mass without its presence. Additionally, the results obtained numerically need to be compared to the theoretical values deduced from the method of characteristic lines and the theory of plasticity. Through the parametric formulation of the failure criterion, the aforementioned ultimate bearing capacities are obtained analytically [32], serving to contrast with the procedure employed here.
2.3.3. Description of the Cases Studied
To avoid the analysis of an unaffordable number of cases resulting from all the possible combinations of the variables indicated, six sensitivity analyses have been carried out to examine the influence of relevant aspects, keeping the rest fixed, but considering several cases within each group.
These sensitivity analyses are the following:
- Influence of the load eccentricity (varying the relative eccentricity E/a)
- Influence of the geomechanical parameters:
- 2a.
- Influence of the rock type (varying the parameter mi)
- 2b.
- Influence of the intact rock and rock mass quality (varying the parameters UCS and GSI)
- Influence of the geometric parameters:
- 3a.
- Influence of the cavern depth (varying the relative depth H/b)
- 3b.
- Influence of the scale factor of the footing (varying the parameter B/a)
In Table 3. is shown the sensitivity analyses, describing the cases examined in each one and indicating the fixed parameters and the variable whose influence is studied.

Table 3.
Of the cases studied (IEH, ITR, IGR, IH and IE), with the parameter values in each one, indicating the influence of the variable considered (see Figure 1 for the meaning of a, b, H, B, E).
3. Results
3.1. Influence of the Load Eccentricity
It has been observed that the most influential parameter on the ultimate bearing capacity, relative to the bearing capacity that would be obtained without the existence of the cavity, is the position of the load (of the foundation) with respect to the crown of the cavity. The eccentricity E/a has been varied from zero to a value in which its influence becomes negligible, for three cases with a given cavern depth H, measured from its crown to the ground surface.
The following parameters have been kept constant:
- Intact rock and rock mass quality: UCS = 10 MPa, GSI = 50, mi = 17.
- Cave geometry: 2a = 6 m, 2b = 3 m, b/a = 0.50, B = 4 m
The three cases analysed are the following:
- IEH-1: H = 1.5b = 2.25 m
- IEH-2: H = 3.0b = 4.50 m
- IEH-3: H =4.5b = 6.75 m
Figure 2, Figure 3, Figure 4, Figure 5 and Figure 6 present the graphic results of the selected cases, as a summary. For a specific load eccentricity (E/a), the figures show the values of three datasets, that represent, for all the rock mass points: (1) the vertical movements, (2) the yield points, and (3) the shear deformation, in the form of coloured isoareas. In these figures, the shape and type of the failure mechanism range from direct punching shear failure and vertical cut surfaces under the edges of the footing up to the side walls of the cavern (low E/a values) (Figure 2 and Figure 3), to the classic plastic failure with triangular wedges under the footing and the outline, of the Rankine type, with Prandtl’s transition zones in both sides (high E/a values) (Figure 5 and Figure 6).
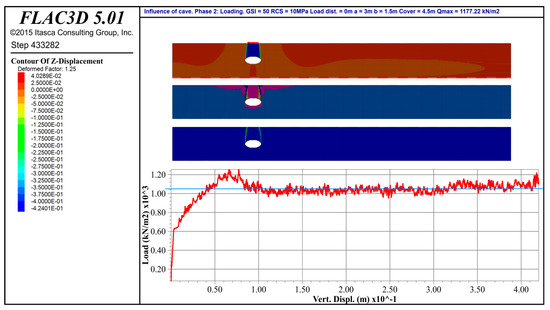
Figure 2.
Case IEH-2. Eccentricity E/a = 0 (direct punching shear failure mechanism and vertical cut surfaces).
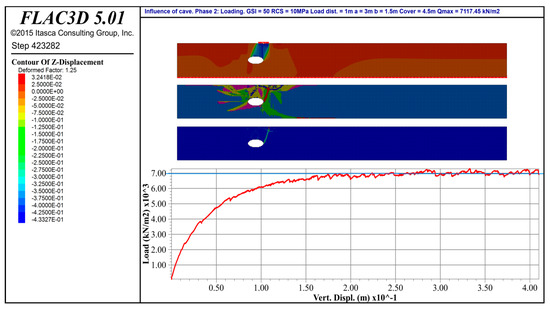
Figure 3.
CaseIEH-2. Eccentricity E/a = 1 (punching shear failure mechanism with nearly vertical cut surfaces).
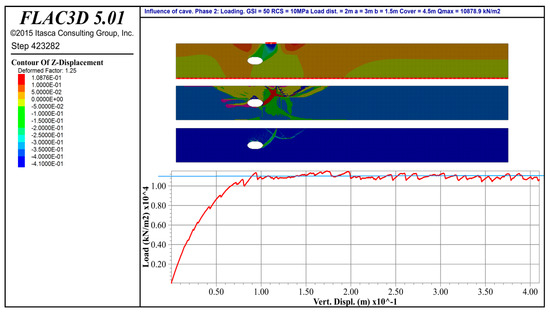
Figure 4.
Case IEH-2. Eccentricity E/a = 2 (mixed failure mechanism, by punching shear with inclined cut surfaces, plus classic plastic failure wedges).
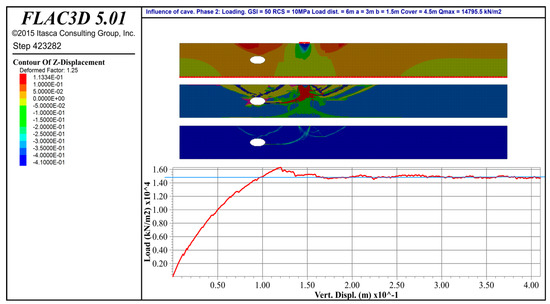
Figure 5.
Case IEH-2. Eccentricity E/a = 6 (still a mixed failure mechanism, but with a clear predominance of classic plastic-failure wedge formation on both sides of the footing. Little influence of the cavern).
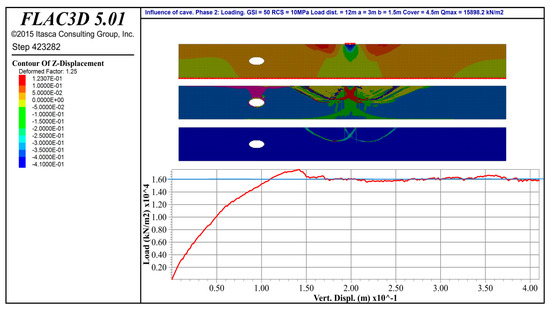
Figure 6.
Case IEH-2. Eccentricity E/a = 12 (classic plastic failure mechanism, with formation of complete yield wedges on both sides of the footing. Minimum influence of the cavern).
Each figure also represents the relation between the load applied (qi) and the vertical displacement of the central point of the load surface, which allows the estimation of the value of the ultimate bearing capacity (qu), as the load value of the horizontal asymptote of the diagram.
Only the figures corresponding to the case IEH-2 are shown.
The values obtained for all the cases analysed are included in Figure 7 and Figure 8. Thus, the influence of the load eccentricity(E/a) on the relative ultimate bearing capacity (qu/quH&I) can be observed.
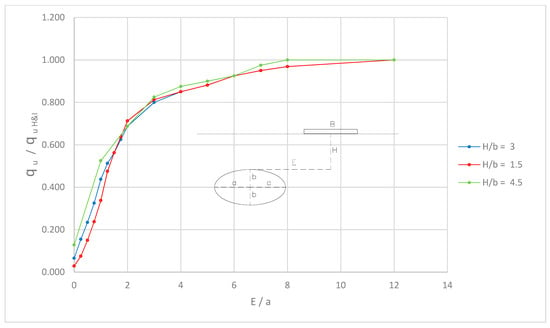
Figure 7.
The load eccentricity on the ultimate bearing capacity for values between E/a = 0 and E/a = 12.
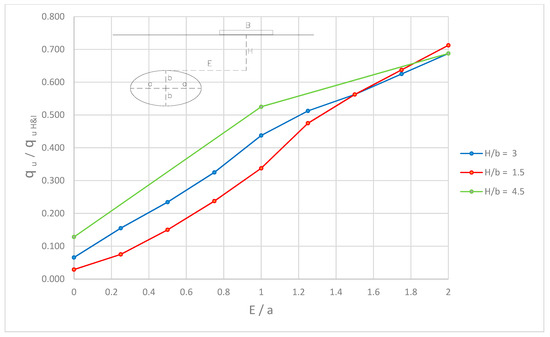
Figure 8.
The load eccentricity on the value of the ultimate bearing capacity. Detail for values between E/a = 0 and E/a = 2.
By analysing the curves of the above figures, the following conclusions can be drawn:
- -
- For all practical purposes, the “reduction” curve obtained for different cover thicknesses H/b is independent of the crown depth, except for the eccentricity range E/a between 0 and 1, in which the influence of the depth entails a difference between 10% and 20%.
- -
- For eccentricity values E > 2a, the relative ultimate bearing capacity is higher than 70% and it varies little with the cover H/b.
- -
- For eccentricity values E < 2a, the relative ultimate bearing capacity increases with the cover H/b, with values that are almost proportional (for the cases studied with B < 2a), as can be observed in Figure 9.
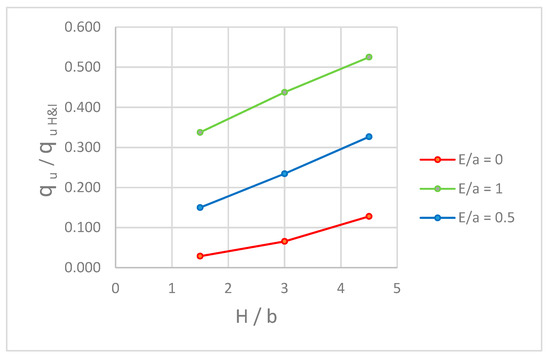 Figure 9. The relative ultimate bearing capacity with the cover H/b for E/a < 2.
3.2. Influence of Geomechanical Parameters
To study the influence of the geomechanical and lithological parameters of the rock mass, a single geometry of the cavity has been used, varying the eccentricity E/a from zero to a value for which its influence becomes negligible.
Regarding the parameters defining the rock lithology and the quality of the rock mass, both have been analysed independently.
3.2.1. Influence of the Rock Type (Parameter mi)
The parameters UCS = 10 MPa and GSI = 50 have been fixed for a specific geometric configuration (2a = 6 m, 2b = 3 m, b/a = 0.50, B = 4 m, H/b = 3) adopting an ample range of rock types (mi = 5 to 30). As previously indicated, the dimensionless load eccentricity E/a has been varied from zero to a value for which its influence becomes negligible.
The values that define the geometry of the cavern, in all the cases, are:
2a = 6 m, 2b = 3 m, b/a = 0.50, B = 4 m, H/b = 3
The three following cases are studied:
- ITR-1: mi = 5
- ITR-2: mi = 17
- ITR-3: mi = 30
The failure mechanisms obtained in each case studied have been omitted; however, they are the same as those shown in Section 3.1, following the same pattern based on the eccentricity E/a.
Figure 10 only represents the influence of the rock type (parameter mi) on the relative ultimate bearing capacity (qu/quH&I) when varying the load eccentricity (E/a).
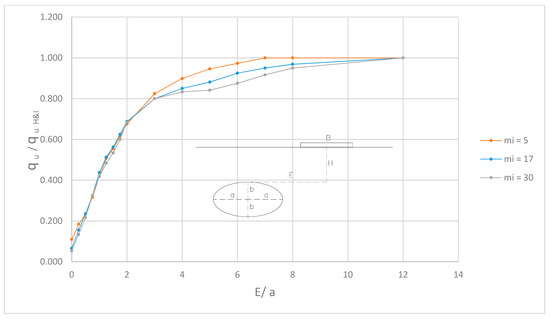
Figure 10.
Influence of rock type (parameter mi) on the ultimate bearing capacity when varying the load eccentricity.
By analysing the curves of the above Figure 10, the following conclusions can be drawn:
As can be observed, for eccentricities E < 3a, the variation in the relative ultimate bearing capacity (qu/quH&I) is negligible (lower than 5%) for all the lithologies analysed. There are only differences ranging between 10% and 17% for eccentricities higher than 4a, for which the value of the relative ultimate bearing capacity is greater than 80%, and, therefore, the influence of the cavern is greatly limited.
In conclusion, it can be stated that the influence of the affected rock type is negligible when the load eccentricity with respect to the cavern axis is limited; therefore, the reduction in the ultimate bearing capacity is substantial (as shown in previous sections) and the existence of the cavern is decisive. However, a greater influence can be observed, with variations between 10% and 17%, when the eccentricity is higher, and consequently, the existence of the cavern is less important.
3.2.2. Influence of the Intact Rock and Rock Mass Quality (Parameters UCS and GSI)
Based on the conclusions previously drawn, the parameter mi has been kept constant at mi = 17 for a specific geometric configuration (2a = 6 m, 2b = 3 m, b/a = 0.50, B = 4 m, H/b = 3), in which the dimensionless load eccentricity E/a has been varied from zero to a value for which its influence is negligible. The ranges of the geomechanical parameters of the intact rock and the rock mass are the following: RCS = 10 to 50 MPa, and GSI = 25 to 75.
The dimensions defining the geometry of the cavity, in all the cases, are:
2a = 6 m 2b = 3 m b/a = 0.50 B = 4 m H/b = 3
The following cases have been studied:
- IGR-1: UCS = 10 MPa, GSI = 50
- IGR-2: UCS = 10 MPa, GSI = 75
- IGR-3: UCS = 50 MPa, GSI = 25
- IGR-4: UCS = 50 MPa, GSI = 50
- IGR-5: UCS = 50 MPa, GSI = 75
The failure mechanisms obtained for each case have been omitted; however, they are the same as those shown in Section 3.1, following the same pattern based on the eccentricity E/a.
Figure 11 and Figure 12 only represent the influence of these geomechanical parameters on the relative ultimate bearing capacity (qu/quH&I) when varying the load eccentricity (E/a).
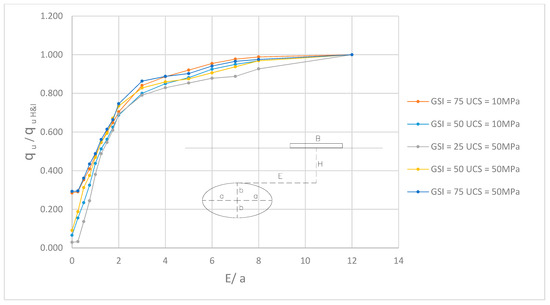
Figure 11.
Influence of the geomechanical parameters of the rock, UCS and GSI, on the ultimate bearing capacity value when varying the load eccentricity.
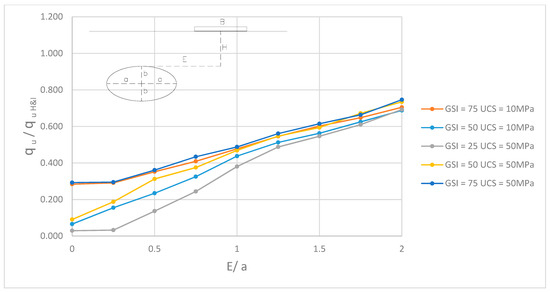
Figure 12.
Influence of the geomechanical parameters of the rock, UCS and GSI, on the ultimate bearing capacity value when varying the load eccentricity. Detail between E/a = 0 and E/a = 2.
By analysing the curves of both figures above, the following conclusions can be inferred:
As can be observed, for eccentricity values E between a and 2a, the variation in the relative ultimate bearing capacity (qu/quH&I) is limited (between 10% and 15%). The most significant differences are shown to be between 15% and 30%for eccentricity values between 0 and a (0 < E < a).
Finally, the difference increases again up to 15%for eccentricities of approximately 7a, for which the existence of the cavern has a very reduced effect.
In conclusion, it can be stated that the influence of the geomechanical parameters of the rock mass is reduced in the cases in which the load eccentricity with respect to the cavern axis is greater than 2a, and therefore, the reduction in the ultimate bearing capacity is negligible, as well as is the existence of the cavern itself. However, a greater influence can be observed with lower values of eccentricity, varying between 10% and 30%, and therefore, the existence of the cavern is very important for this range.
3.3. Influence of Geometric Parameters
3.3.1. Influence of the Cavern Depth (Parameter H/b)
The cavern depth with respect to the ground surface has been considered as a determining parameter, with null eccentricity. In the calculations, the depth H has been varied from a minimum value until its influence is negligible.
The following model parameters are constant in all the cases analysed:
- UCS = 50 MPa, GSI = 50, mi = 17.
- B = 4 m
- E/a = 0 (null eccentricity)
The following cases are studied:
- IH-0: 2a = 2 m 2b = 1 m b/a = 0.50
- IH-1: 2a = 4 m 2b = 2 m b/a = 0.50
- IH-2: 2a = 6 m 2b = 3 m b/a = 0.50
- IH-3: 2a = 10 m 2b = 5 m b/a = 0.50
- IH-4: 2a = 16 m 2b = 8 m b/a = 0.50
The failure mechanisms obtained for each case studied are similar to those shown in the previous sections, although they present some common patterns associated with the relative size between the width of the load (always B = 4 m) and the cavern (2a varies from 2 to 16 m).
Figure 13 and Figure 14 only represent the influence of the cover (both in its relative (H/b) and absolute (H) values, respectively) on the relative (dimensionless) value of the ultimate bearing capacity (qu/quH&I).
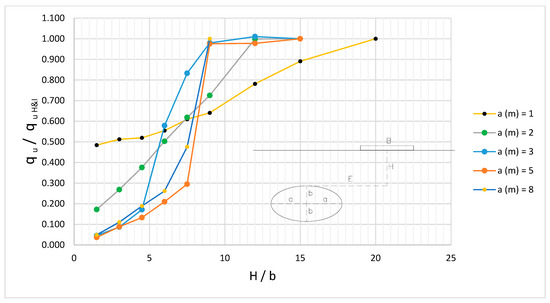
Figure 13.
Influence of the relative depth of the cavern (parameter H/b) on the ultimate bearing capacity value when varying the load eccentricity.
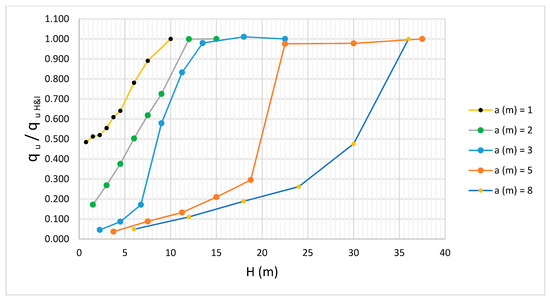
Figure 14.
Influence of cavern depth (H) on the ultimate bearing capacity when varying the load eccentricity.
By analysing the curves of these two figures, the following conclusions can be considered:
The influence of the cover on the variation in the ultimate bearing capacity (qu/quH&I) is linear if the width of cavern and footing are equal (case IH-1, 2a = 4 m), and substantially linear when the footing width is greater than the cavern width (case IH-0, 2a = 2 m), although its slope varies.
When the cavern width is higher than the footing, the variation is also substantially linear but only with covers ranging from H/b = 4.50 to H/b = 7.50, the slope changes abruptly at this point, up to H/b = 9.00, at which point it almost reaches the ultimate bearing capacity value without the cavern.
3.3.2. Influence of the Scale Factor of the Footing (Parameter b/a)
In this case, the quality parameters of the rock mass and the intact rock are fixed at UCS = 10 MPa, GSI = 50, mi = 17, b/a = 0.50
The two following cases have been studied, varying the eccentricity E/a from zero until its influence is negligible:
- IE-1: 2a = 8 m 2b = 4 m = 0.5a H = 4 m = 2b B = 6 m = 1.5a
- IE-2: 2a = 4 m 2b = 2 m = 0.5a H = 4 m = 4b B = 6 m = 3a
The failure mechanisms obtained for each case studied are the same as those shown in Section 3.1, following the same pattern based on the eccentricity E/a.
Figure 15 only represents the influence of the position of the load (with respect to the cavern crown, E/A) on the relative (dimensionless) value of the ultimate bearing capacity (qu/quH&I).
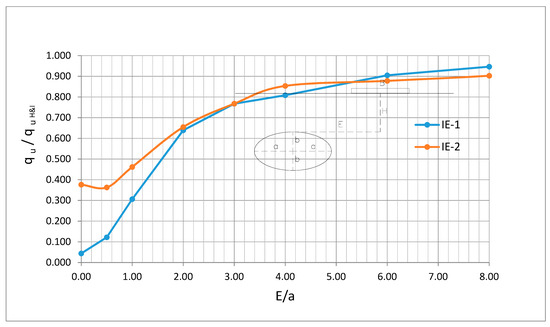
Figure 15.
The load eccentricity on the ultimate bearing capacity value for different geometries with respect to the footing width.
- Case IE-1: 2a = 8 m 2b = 4 m = 0.5a H = 4 m = 2b B = 6 m = 1.5a
- Case IE-2: 2a = 4 m 2b = 2 m = 0.5a H = 4 m = 4b B = 6 m = 3a
By analysing the curves of the above figure, the following conclusions can be drawn:
For eccentricity values E > 2a, the variation in the relative depth H/b, the cavern size (a,b)and the relative width of the load b/a exert little influence on the ultimate bearing capacity (qu/quH&I).
The lower the eccentricity values, the higher the reduction in the ultimate bearing capacity for footings smaller than the cavern width (case IE-1). However, a lower value may be reached, even with higher eccentricities, if the footing is greater than the cavern width (case IE-2).
4. Discussion and Conclusions
The conclusions set out here refer to a stationary situation which the spatial distribution and cavity geometry are assumed to be invariable over time. This is a condition that is not present in reality but can be useful when fulfilled approximately for short times within the life of engineering works, except for the most soluble evaporate rocks (halite, thenardite, and, to a lesser amount, gypsum). For geological scales, the conceptual model can be very different, as it can evolve significantly over time. For example, erosion can bring cavities closer to the surface and even exhume them.
Even contemplating “engineering times”, and in reference to the three rock scenarios contemplated, the evolution over time of the geometry and size of the cavities can affect the mechanical results differently. In limestone and volcanic rocks, dissolution and alteration can be very slow within the life of an engineering work, and in some evaporitic rocks, the high dissolution rate has to be considered. That is, the results will remain valid longer in limestone rocks than they will in highly soluble salt rocks. This evolution and instability of cavities in evaporitic rocks is closely related to water variations, whether natural or anthropic.
Climate plays a key role in the long-term evolution of major exokarstic and endokarstic forms. Not only do the dimensions of the gypsum cavities vary with the climate, but appreciable geomorphological differences are also found in them. This great capacity for dissolution and instability makes them very evolutionary over time, so that most of the gypsum cavities are of recent ages (Holocene, above all), while those of limestones have remained stable even since the Tertiary. However, these long-term considerations go beyond the subject matter of this article.
4.1. General Conclusions
After the geological and morphological analysis of the most frequent cavities in nature, of karstic (in limestones, dolomites, or gypsums) and volcanic origins, nine characteristic forms have been identified as being the most representative of the total and identified with the same number of real cases.
For calculation purposes, the ellipse has been selected as the geometric figure that best represents them.
Depending on the eccentricity of the external load (E), the failure mechanisms produced vary from simple and direct punching shear with vertical cut surfaces under the edges of the footing up to the side walls of the cavern, to the classic generalised plastic failure, with the corresponding Prandtl and Rankine zones (Figure 2, Figure 3, Figure 4, Figure 5 and Figure 6).
The eccentricity of the external load, with respect to the position of the cavern (E/a), is the fundamental parameter that reduces the value of the ultimate bearing capacity of a natural rock mass with caverns (Figure 7 and Figure 8).
This reduction (“reduction curve”) obtained for different covers (H/b) is, for practical purposes, independent of the crown depth, if the results with differences between 10% and 20% are accepted as valid (Figure 7, Figure 8 and Figure 9).
A threshold value for the change in behaviour has been obtained for eccentricity E = 2a. For higher values, the relative ultimate bearing capacity (qu/qu H&I) is greater than 70%. For lower values, the relative ultimate bearing capacity is strongly reduced, with the minimum value obtained at null eccentricity, but increases almost proportionally with the cover H/b, for the range of eccentricity mentioned (Figure 9).
4.2. Influence of the Geomechanical Parameters of the Rock Mass
The influence of the rock type, characterised by Hoek’s parameter mi, is, for practical purposes, negligible in the cases with small load eccentricity with respect to the cavern axis (E < 3a). For eccentricity values (E/a) from 3 to 8, this influence is lower than 10% (Figure 10).
The strength and conditions of the rock mass (parameters UCS and GSI-RMRb) have relatively little influence on the results obtained (Figure 11). By analysing them with greater accuracy, it can be stated that there is a threshold for a change in behaviour for eccentricity E = 2a. For higher values, the relative ultimate bearing capacity is again higher than 70%; therefore, the reduction is, for practical purposes, of minor importance. For lower eccentricity values (E < 2a), the relative ultimate bearing capacity is considerably reduced, and as expected, the minimum value is obtained with the null eccentricity. A significant influence can be observed, with differences in the relative ultimate bearing capacity between 10% and 30%, according to the values of the parameters UCS and GSI, when that eccentricity is lower, and, therefore, the existence of the cavern is determined (Figure 12).
4.3. Influence of Geometric Parameters
The influence of the cover (or cavern depth; parameter H/b) on the variation in the relative ultimate bearing capacity is such that it varies linearly if the footing and the cavern have the same width, and substantially linearly if the cavern width is lower than the footing (Figure 13 and Figure 14).
However, when the cavern width is greater than the footing, the variation in the relative ultimate bearing capacity is also substantially linear, but only for relative cover values (H/b) between 4.5 and 7.5 (Figure 13 and Figure 14).
For eccentricity values E > 2a, the variation in the relative depth H/b, size of the cavern (a·b) and relative width of the footing (B/a) have a small influence on the relative ultimate bearing capacity (Figure 15).
The reduction in the ultimate bearing capacity is greater at lower eccentricity values for footings lower than the cavern width. However, some lower values may be reached, even with higher eccentricity, if the footing is larger than the cavern width.
4.4. Final Conclusions
The study aimed to provide a simple design criteria for universal use, with different geometric configurations and qualities of rock masses that can be used directly without the need for sophisticated calculations by the designer.
The study enables the correlation between the known cavities near a surface foundation, limited by the scope of the geotechnical survey carried out in the subsoil, and a reduction in their sinking load from the different penalty curves obtained, with the necessary risk minimisation that a natural environment requires.
Author Contributions
Conceptualization: J.L.B.O., C.O.M.; Methodology: E.S.P.; Formal Analysis: J.M.R.; Supervision: J.L.B.O.; Project Administration: J.L.B.O.; Validation: J.L.B.O., J.M.R., E.S.P., C.O.M. All authors have read and agreed to the published version of the manuscript.
Funding
No sources of funding of the study.
Conflicts of Interest
The authors declare no conflict of interest.
References
- Soliman, M.H.; Perez, A.L.; Nam, B.H.; Ye, M. Physical and Numerical Analysis on the Mechanical Behavior of Cover-Collapse Sinkholes in Central Florida. In Proceedings of the 15th Sinkhole Conference. National Conservation Training Center 698 Conservation Way, Shepherdstown, WV, USA, 2 April 2018. [Google Scholar]
- Escolano, F.; Mazariegos, A.; del Campo, J.M. Evaluation of the Risk Associated with Karstic Processes in Miocene Gypsum in South-Eastern Madrid (Spain). Acta Carsol. 2015, 44, 251–263. [Google Scholar] [CrossRef]
- Escavy, J.I.; Herrero, M.J.; Arribas, M.E. Gypsum Resources of Spain: Temporal and Spatial Distribution. Ore Geol. Rev. 2012, 49, 72–84. [Google Scholar] [CrossRef]
- Serrano, A.; Perucho, A.; Olalla, C.; Estaire, J. Foundations in Volcanic Zones. In Proceedings of the 14th European Conference on Soil Mechanics and Geotechnical Engineering, Madrid, Spain, 24–27 September 2007; Volume IV. [Google Scholar]
- Cárdenas, A.; Olalla, C.; Serrano, A.; Gonzalo, A. Innovative Aspects in the Execution of the Strengthening and Stabilizing of the Volcanic Cavern of “Los Jameos del Agua”. In Volcanic Rock Mechanics; Olalla, C., Hernandez, L.E., Rodriguez-Losada, J.A., Perucho, A., Gonzalez-Gallego, J., Eds.; CRC Press: Lanzarote, Canary Islands, Spain, 2010; pp. 229–233. [Google Scholar]
- Fazio, N.L.; Perrotti, P.; Lollino, M.; Parise, M.; Vattano, G.; Madonia, C.; Di Maggio, C. A Three-Dimensional Back-Analysis of the Collapse of an Underground Cavity in Soft Rocks. Eng. Geol. 2017, 228, 301–311. [Google Scholar] [CrossRef]
- Li, S.C.; Wu, J.; Xu, Z.H.; Zhou, L.; Zhang, B. A Possible Prediction Method to Determine the Top Concealed Karst Cave Based on Displacement Monitoring during Tunnel Construction. Bull. Eng. Geol. Environ. 2017, 78, 341–355. [Google Scholar] [CrossRef]
- Scotto di Santolo, A.; Forte, G.; Santo, A. Analysis of Sinkhole Triggering Mechanisms in the Hinterland of Naples (Southern Italy). Eng. Geol. 2018, 237, 42–52. [Google Scholar] [CrossRef]
- Xia, K.; Zheng, C.C.; Zhang, Y.; Zhang, H.; Liu, X.; Deng, Y.; Yan, K. Engineering Geology and Ground Collapse Mechanism in the Chengchao Iron Ore Mine in China. Eng. Geol. 2019, 249, 129–147. [Google Scholar] [CrossRef]
- Jianyi, T.; Jian, C. Preliminary Study of Karst Collapse Forecast Method. Endins 1987, 13, 99–104. [Google Scholar]
- Mancebo, J.A. Karstología de Yesos. Algunas Aplicaciones en Ingeniería Civil. Ph.D. Thesis, ETSICCP-UPM, Madrid, Spain, 2008. not published. [Google Scholar]
- Yao, W.Y. Comprehensive Critical Mechanical Model of Covered Karst Collapse under the Effects of Positive and Negative Pressure. Bull. Eng. Geol. Environ. 2018, 77, 177–190. [Google Scholar]
- Jordá-Bordehore, L.; Martín-García, R.; Alonso-Zarza, A.M.; Jordá-Bordehore, R.; Romero-Crespo, P.L. Stability Assessment of Shallow Limestone Caves Through an Empirical Approach: Application of the Stability Graph Method to the Castañar Cave Study Site (Spain). Bull. Eng. Geol. Environ. 2016, 75, 1469–1483. [Google Scholar] [CrossRef]
- Waltham, A.C.; Fookes, P.G. Engineering Classification of Karst Ground Conditions. Q. J. Eng. Geol. Hydrogeol. 2003, 36, 101–118. [Google Scholar] [CrossRef]
- Calvari, S.; Pinkerton, H. Formation of Lava Tubes and Extensive Flow Field during the 1991–1993 Eruption of Mount Etna. J. Geophys. Res. 1998, 103, 27291–27301. [Google Scholar] [CrossRef]
- Greeley, R. Chapter 59. The Role of Lava Tubes in Hawaiian Volcanoes. In Volcanism in Hawaii; U. S. Geological Survey Profesional Paper; Proceedings Chicago 2008; U. S. Geological Survey: Reston, VA, USA, 2008; pp. 1589–1602. [Google Scholar]
- Carracedo, J.E.; Singer, B.; Jicha, B.; Guillou, B.; Rodríguez Badiola, E.; Meco, J.; Pérez Torrado, F.J.; Gimeno, D.; Socorro, S.; Láinez, A. La Erupción y el Tubo Volcánico del Volcán Corona (Lanzarote, Islas Canarias). Estud. Geol. 2003, 59, 277–302. [Google Scholar] [CrossRef]
- Socorro, S. Cavidades volcánicas de Canarias Tipos y génesis. In Volcanes: Mensajeros del Fuego, Creadores de Vida, Forjadores del Paisaje; Actas V Semana Científica Telesforo Bravo (celebrada en nov/2009, Puerto de la Cruz, Tenerife); Instituto de Estudios Hispánicos de Canarias: Puerto de la Cruz, Tenerife, Spain, 2010. [Google Scholar]
- Jouves, J.; Viseur, S.; Arfib, B.; Baudement, C.; Camus, H. Speleogenesis, Geometry and Topology of Caves: A Quantitative Study of 3D Karst Conduits. Geomorphology 2017, 298, 86–106. [Google Scholar] [CrossRef]
- Llopìs, N. Fundamentos de Hidrogeología Cárstica; Blume: Madrid, Spain, 1970; p. 269. [Google Scholar]
- White, W.B. Geomorphology and Hydrology of Karst Terrains; Oxford Univ. Press: New York, NY, USA, 1988. [Google Scholar]
- Ford, D.; Williams, P. Karst Geomorphology and Hydrology; Unwin Hyman: London, UK, 1989. [Google Scholar]
- Puch, C. Grandes Cuevas y Simas de España; Espeleo Club de Gracia: Barcelona, Spain, 1998; p. 998. [Google Scholar]
- Calaforra, J.M. Karstología de Yesos; Universidad de Almería: Almería, Spain, 1998. [Google Scholar]
- Brown, E.T. Rock Characterization, Testing and Monitoring: ISRM Suggested Methods; Pergamos Press: Oxford, UK, 1981. [Google Scholar]
- Hoek, E. Strength of Rock and Rock Masses. ISRM New J. 1994, 2, 4–16. [Google Scholar]
- Bieniawski, Z.T. Engineering Rock Mass Classification: A Complete Manual for Engineers and Geologists in Mining, Civil and Petroleum Engineering; Wiley-Interscience: New York, NY, USA, 1989; pp. 40–47. [Google Scholar]
- Itasca Consulting Group, Inc. FLAC, Fast Lagrangian Analysis of Continua; Version 5.01; Fluid-Mechanical Interaction: Minneapolis, MN, USA, 2005. [Google Scholar]
- Hoek, E.; Carranza-Torres, C.; Corkum, B. Hoek-Brown Failure Criterion—2002 edition. Proc. NARMS-Tac 2002, 1, 267–273. [Google Scholar]
- Hoek, E.; Brown, T. Empirical Strength Criterion for Rock Masses. J. Geotech. Eng. Div. ASCE 1980, 106, 1013–1035. [Google Scholar]
- Hoek, E.; Wood, D.; Shah, S. A Modified Hoek-Brown Criterion for Jointed Rock Masses. In Proceedings of the Rock Characterization Symposium of ISRM. Eurock 92; Hudson, J.A., Ed.; British Geotechnical Society: London, UK, 1992; pp. 209–214. [Google Scholar]
- Serrano, A.; Olalla, C.; Gonzalez, J. Ultimate Bearing Capacity of Rock Masses Based on the Modified Hoek and Brown Criterion. Int. J. Rock Mech. Min. Sci. 2000, 37, 1013–1018. [Google Scholar] [CrossRef]
© 2020 by the authors. Licensee MDPI, Basel, Switzerland. This article is an open access article distributed under the terms and conditions of the Creative Commons Attribution (CC BY) license (http://creativecommons.org/licenses/by/4.0/).