Article

Students’ Acceptance and Tracking of a New Container-Based Virtual Laboratory

1
Department of Control and Communication Systems, Computer Science Engineering Faculty, Spanish National University for Distance Education (UNED), 28040 Madrid, Spain
2
Faculty of Law, San Pablo CEU University, 28003 Madrid, Spain
*
Author to whom correspondence should be addressed.
Appl. Sci. 2020, 10(3), 1091; https://doi.org/10.3390/app10031091
Submission received: 11 January 2020 / Revised: 29 January 2020 / Accepted: 2 February 2020 / Published: 6 February 2020
(This article belongs to the Special Issue Smart Learning)

Abstract

:
Presently, the ever-increasing use of new technologies helps people to acquire additional skills for developing an applied critical thinking in many contexts of our society. When it comes to education, and more particularly in any Engineering subject, practical learning scenarios are key to achieve a set of competencies and applied skills. In our particular case, the cybersecurity topic with a distance education methodology is considered and a new remote virtual laboratory based on containers will be presented and evaluated in this work. The laboratory is based on the Linux Docker virtualization technology, which allows us to create consistent realistic scenarios with lower configuration requirements for the students. The laboratory is comparatively evaluated with our previous environment, LoT@UNED, from both the points of view of the students’ acceptance with a set of UTAUT models, and their behavior regarding evaluation items, time distribution, and content resources. All data was obtained from students’ surveys and platform registers. The main conclusion of this work is that the proposed laboratory obtains a very high acceptance from the students, in terms of several different indicators (perceived usefulness, estimated effort, social influence, attitude, ease of access, and intention of use). Neither the use of the virtual platform nor the distance methodology employed affect the intention to use the technology proposed in this work.

1. Introduction

The emergence of new technologies with different capabilities to access and employ Internet resources as services is becoming of great interest these days [1]. These technologies allow systems to increment their efficiency and adaptation to different environments.
The learning process of these relevant technologies is especially interesting within the context of a distance education methodology, such as the one employed in the National University for Distance Education (UNED) in Spain. In this institution, there are not face-to-face lectures in the learning/teaching process. Hence, a key part of its methodology is the development of new tools and techniques for the students to benefit from them during this process. When it comes to Engineering, practical activities within the subjects are usually especially helpful for the students to acquire the expected skills and competences.
Among various drawbacks because of the fact of the digitization of society, cybersecurity is presently a particularly interesting issue. Companies need cybersecurity trained staff [2]. Therefore, Engineering professionals must learn about these topics and, even, more important with a lot of practice to develop their critical thinking [3]. For this purpose, appropriate equipment, both physical and remote, must be provided to the students, in order to ease their professional training and the acquisition of the main skills related to it. This equipment is also important for evaluating the performance of the students during their learning process. In this context, it is clear that infrastructures such as virtual and remote laboratories, which are being widely used presently, must be analyzed for determining their pros and cons regarding those objectives. Besides those technologies, various successful tools aimed at promoting meaningful learning in the field of cybersecurity can be found in the literature [4,5,6].
Additionally, virtual laboratories are presently contributing to the sustainability of higher education, even more when the learning methodology is on distance [7]. This is the particular case of UNED, in which the number of students enrolled in the virtual platform of a subject may become very high. This way, the technologies provided to students during their learning process must be able to support all of them in the development of the practical exercises related to a subject, in terms of scalability, resource allocation, and so on. It is very important to keep a good quality of the learning design of virtual courses, in a similar way to the face-to-face classroom. To achieve this, the proposed technologies for virtual courses (in our case, a virtual laboratory based on containers) must be tested with students in terms of their acceptance ad behavior, since they are resources focused on improving the quality of virtual courses [8].
Consequently, this paper proposes and evaluates a container-based virtual laboratory (CVL), using Linux Docker virtualization technology [9]. This kind of technology allows for the creation of consistent, realistic, and light virtual laboratory environments. The developed laboratory has been used in a real scenario with students, in the context of a “Cybersecurity” subject with an education methodology on distance. The subject is into the “Computer Science Engineering” degree at the Computer Science Engineering Faculty at UNED. The obtained results will be comparatively analyzed with the students’ experience in a previous academic year, studying the students’ acceptance [10,11] of the CVL technology, and their interactions with the virtual platform in the evaluation, forum, and content items.
Therefore, the main contributions of this work are: (1) A complete virtualized network based on containers is locally available for each student with independent access, by taking the role of a junior security technician for a company. The proposed experience can give students a great immersion in a story, which helps their improvement of the learning process; and (2) the obtained results are better for the academic year, when comparing the new laboratory introduced here with respect to the previous one. In particular, our proposed CVL achieves a high grade of acceptance by students, in terms of usefulness, estimated effort, social influence, attitude, ease of access, and intention of use. The students’ behavior when interacting with the virtual platform is very similar for both academic years analyzed.
This work is organized as follows. A background on remote virtual laboratories and a summary of user acceptance models existing in the literature, in addition to our study design, is presented in Section 2. Then, the methodology of this work, developments, and the proposed hypotheses are described in Section 3. Section 4 details and discusses the obtained results of the experiences. Finally, some conclusions are presented in Section 5.

2. Background

2.1. Virtualization of Remote Laboratories

Multiple examples of laboratories can be found in the literature, related to different fields of application [12,13,14]. The study of renewable energies such as wind and solar appears to be a field in which the use of low-cost remote laboratories is particularly handy [15]. In these studies, the concept of Laboratory as a Service (LaaS), representing resources as sets of services, is studied. Flexible configurations of remote can be performed [16,17]. Laboratories can be easily developed using this technique within a virtual course. The LaaS paradigm allows the versatile creation of experiments on demand, using laboratory services. Each component is used as a web service, which can be hardware or software.
In this sense, the MUREE project [18,19,20] applied the LaaS paradigm and represents a case example. The project addressed the necessity of Jordanian Institutions to update the learning of concepts renewable energy. In particular, it was concluded that the impact is positive from educational, research and socio-economic points of view, when using remote laboratories during the learning/teaching process of students. Other works related to this topic are [21,22].
On the other hand, the concept of virtual laboratory is also very relevant for our purpose: creating dynamic scenarios of practical learning and training. These laboratories must be based on virtualization and cloud computing paradigms. With these approaches, there is no need to provide students with hardware components. Only an Internet connection is needed to access the virtual laboratory. Several examples which use virtualization and/or cloud computing technologies can be found in [16,23,24,25,26,27].
In addition to this, an e-learning platform called Tele-Lab was proposed in [28]. This environment is thought to train students in the topic of cybersecurity in a practical way. In this case, the scenarios are built by Virtual Machines (VMs) and virtual network devices. This approach had several drawbacks, such as resource allocation, availability and scalability, which could be solved with the use of Docker containers. The authors worked toward migration to containers to improve their platform Tele-Lab.
In [29] the evolution of learning scenarios is described, and the employment of cloud remote virtual labs for teaching Computer Science Engineering, such as distributed computing and cybersecurity, is also presented. The main objectives were to improve grades and engagement of students, and to increment their interest in subjects. The employed laboratories are also focused on the Internet of Things (IoT) paradigm.
In addition to this, a recent work [30] addresses the implementation of remote virtual laboratories for the cybersecurity topic. In particular, authors present a new approach for creating scenarios to be used on the cloud. The developed platform is based on Emulated Virtual Environment-Next Generation (EVE-NG) [31]. Therefore, the virtualization and cloud computing paradigms are together employed to provide useful work environments to students.
This system uses virtualization technologies to provide students with a work environment in the cloud, in which practical skills in Engineering can be acquired. For this reason, new challenges appear in the management of laboratories. Cloud computing, among other technologies, introduces a significant change in the way Information Technology (IT) services are consumed and managed. This evolution also affects the way in which educative institutions manage IT infrastructures to become smart campuses and universities [32].
Therefore, this work proposes and evaluates a virtual laboratory with containers, CVL, using the Linux Docker [9]. This way, it is possible to define and deploy dynamic virtual scenarios [33], in our case, in the topic of cybersecurity. A set of technical details will be described along this work. Additionally, an abstraction layer composed of Linux containers is provided to the students. Hence, they can manage their container-based scenario with a total sense of freedom, without any conflict of access regarding the available resources. Only the requirement of using a machine that supports the Docker technology must be met, since no other software and hardware configurations are needed. Currently, the most typical Operating Systems (Windows 7/10, Linux, and Mac) support the Docker technology.
The principal advantages of Docker containers [9] are the following:
  • File-system isolation. Containers can be started-up and characterized with file-system configurations to start a practical activity in the virtual laboratory.
  • Resource isolation. Specific resources for each container, such as CPU and memory, are booked.
  • Network isolation. Each container is like a virtual machine inside a network structure.
  • Copy on write. This optimization policy allows processes to share resources in an efficient manner, which implies that the container-based laboratory deployment is very fast and with a low cost of memory.
  • Change management. Already stores images can be reused to create new containers.
  • Interactive interface. This fact allows lecturers to propose sets of practical activities by using shell commands and web-interfaces, as in the case of the proposed activity.
These features can increment the acceptance of laboratories with respect to students. Hence, it is essential to analyze both the students’ opinions and learning experiences, and the data generated along the use of the laboratory. To achieve this objective, learning analytic techniques [34] will be employed. This way, the learning process can be studied deeper and, also, optimized according to the context where the learning process is applied.

2.2. User Acceptance Models

When integrating new technologies into the learning processes of students (in this case, our CVL in the context of cybersecurity), a set of factors that affect the acceptance of technology arise, such as attitude, social needs, resistance to its use, and so on. Many works can be found in the literature that address this fact considering different contexts [35]. A well-known model for defining and validating the user acceptance of a novel educational technology is the Technology Acceptance Model (TAM) [10,36]. This model can be used to measure users’ attitudes over a new technology, so determining their intention to use it in a particular context [37].
However, this model does not take into account a diversity of indicators that influence each situation. In this sense, TAM is sometimes updated to fulfill the needs of each specific study.
On the other hand, there are many research works that apply other models, being one of the most popular the Unified Theory of Acceptance and Use of Technology (UTAUT) [11,38]. A recent study [39] extends the UTAUT model to determine the indicators that influence the intention to use mobile training from the perspective of consumers: enjoyment, efficacy, satisfaction, confidence, and risk. The authors conclude that their findings fit the UTAUT model for institutions which use mobile learning.
In [40], the indicators which affect the use of mobile electronic records in the healthcare context are studied and confirmed with both the UTAUT and TAM models. Also, a comparison of TAM and UTAUT is given. A new UTAUT model built with three TAM variables that influence the intention of use of the proposed technology is presented. Those variables are the perceived usefulness (or performance expectancy), the perceived ease of use (or effort expectancy), and the attitude. This new model also makes use of social influence and facilitating conditions.
Factors that influence students’ acceptance are also studied for the proposed virtual laboratory in [30], by concluding the positive impact of employing virtual laboratories for practical activities of cybersecurity. The exploratory study for the students’ acceptance is based on the UTAUT model, and it is similar to the initial results shown in this work. The data available in the activity records of the virtual laboratories is also analyzed from the students’ interactions with the virtual platform [33], as detailed in Section 4.

3. Methods

In this Section, aspects determining the students’ acceptance to use our laboratories in the context of Engineering (and specifically, Cybersecurity) are first detected and checked. These factors affect the adoption and impact of the proposed technology. Secondly, a deep analysis of the learning platform interactions (evaluations, forums, and contents) is performed, as a complementary source of information, from the point of view of accesses, sessions, and time. The study compares the particular technology employed in two different academic years.

3.1. Procedure

The practical activity proposed to the students consists of solving a cybersecurity issue that occurs in a fictional enterprise in the field of Engineering. The infrastructure provided for its resolution is a container-based virtual laboratory (CVL). This laboratory is basically a network of containers or lightweight virtual machines, which can be seen as a set of services. The particular technology employed for the development of this structure is Linux Docker.
The scenario proposed to the students can be solved by configuring several access policies within the firewall of the fictional enterprise. This firewall represents the first cybersecurity control to be deployed by any company. Choosing suitable access policies is then a crucial step during the design and implementation of firewalls, since they determine, usually via ranges of addresses representing machines, applications, protocols or contents, which network traffic is allowed and which is denied through the firewall.
In our particular case, the main objectives to be accomplished by the students are as follows:
  • Management of security incidents.
  • Design of an access policy for a firewall, within a practical context.
  • Implementation of the access policy designed.
  • Checking the requirements of the practical activity.
Regarding technical requirements for the configuration of the firewall, the practical assessment for academic years 2017–2018 and 2018–2019 had the same base; however, a change of technology was performed in academic year 2018–2019 for exploring the use of the proposed CVL laboratory. As previously mentioned, a set of containers structured as a network (see Figure 1 for its topology), developed with Linux Docker virtualization [9], was made available for students, as well as the communication configuration and API services needed.
On the other hand, in the previous 2017-2018 academic year, practical assessments were developed through the use of the LoT@UNED platform, which involves the use of IoT devices through a collaborative learning environment in the cloud [29]. However, synchronization issues usually arise when this technology is used by a large number of students at the same time, forcing them to book future sessions in the lab for performing their work. CVL technology represents an important improvement regarding this issue, since it does not rely on a limited number of IoT devices sharing the infrastructure.

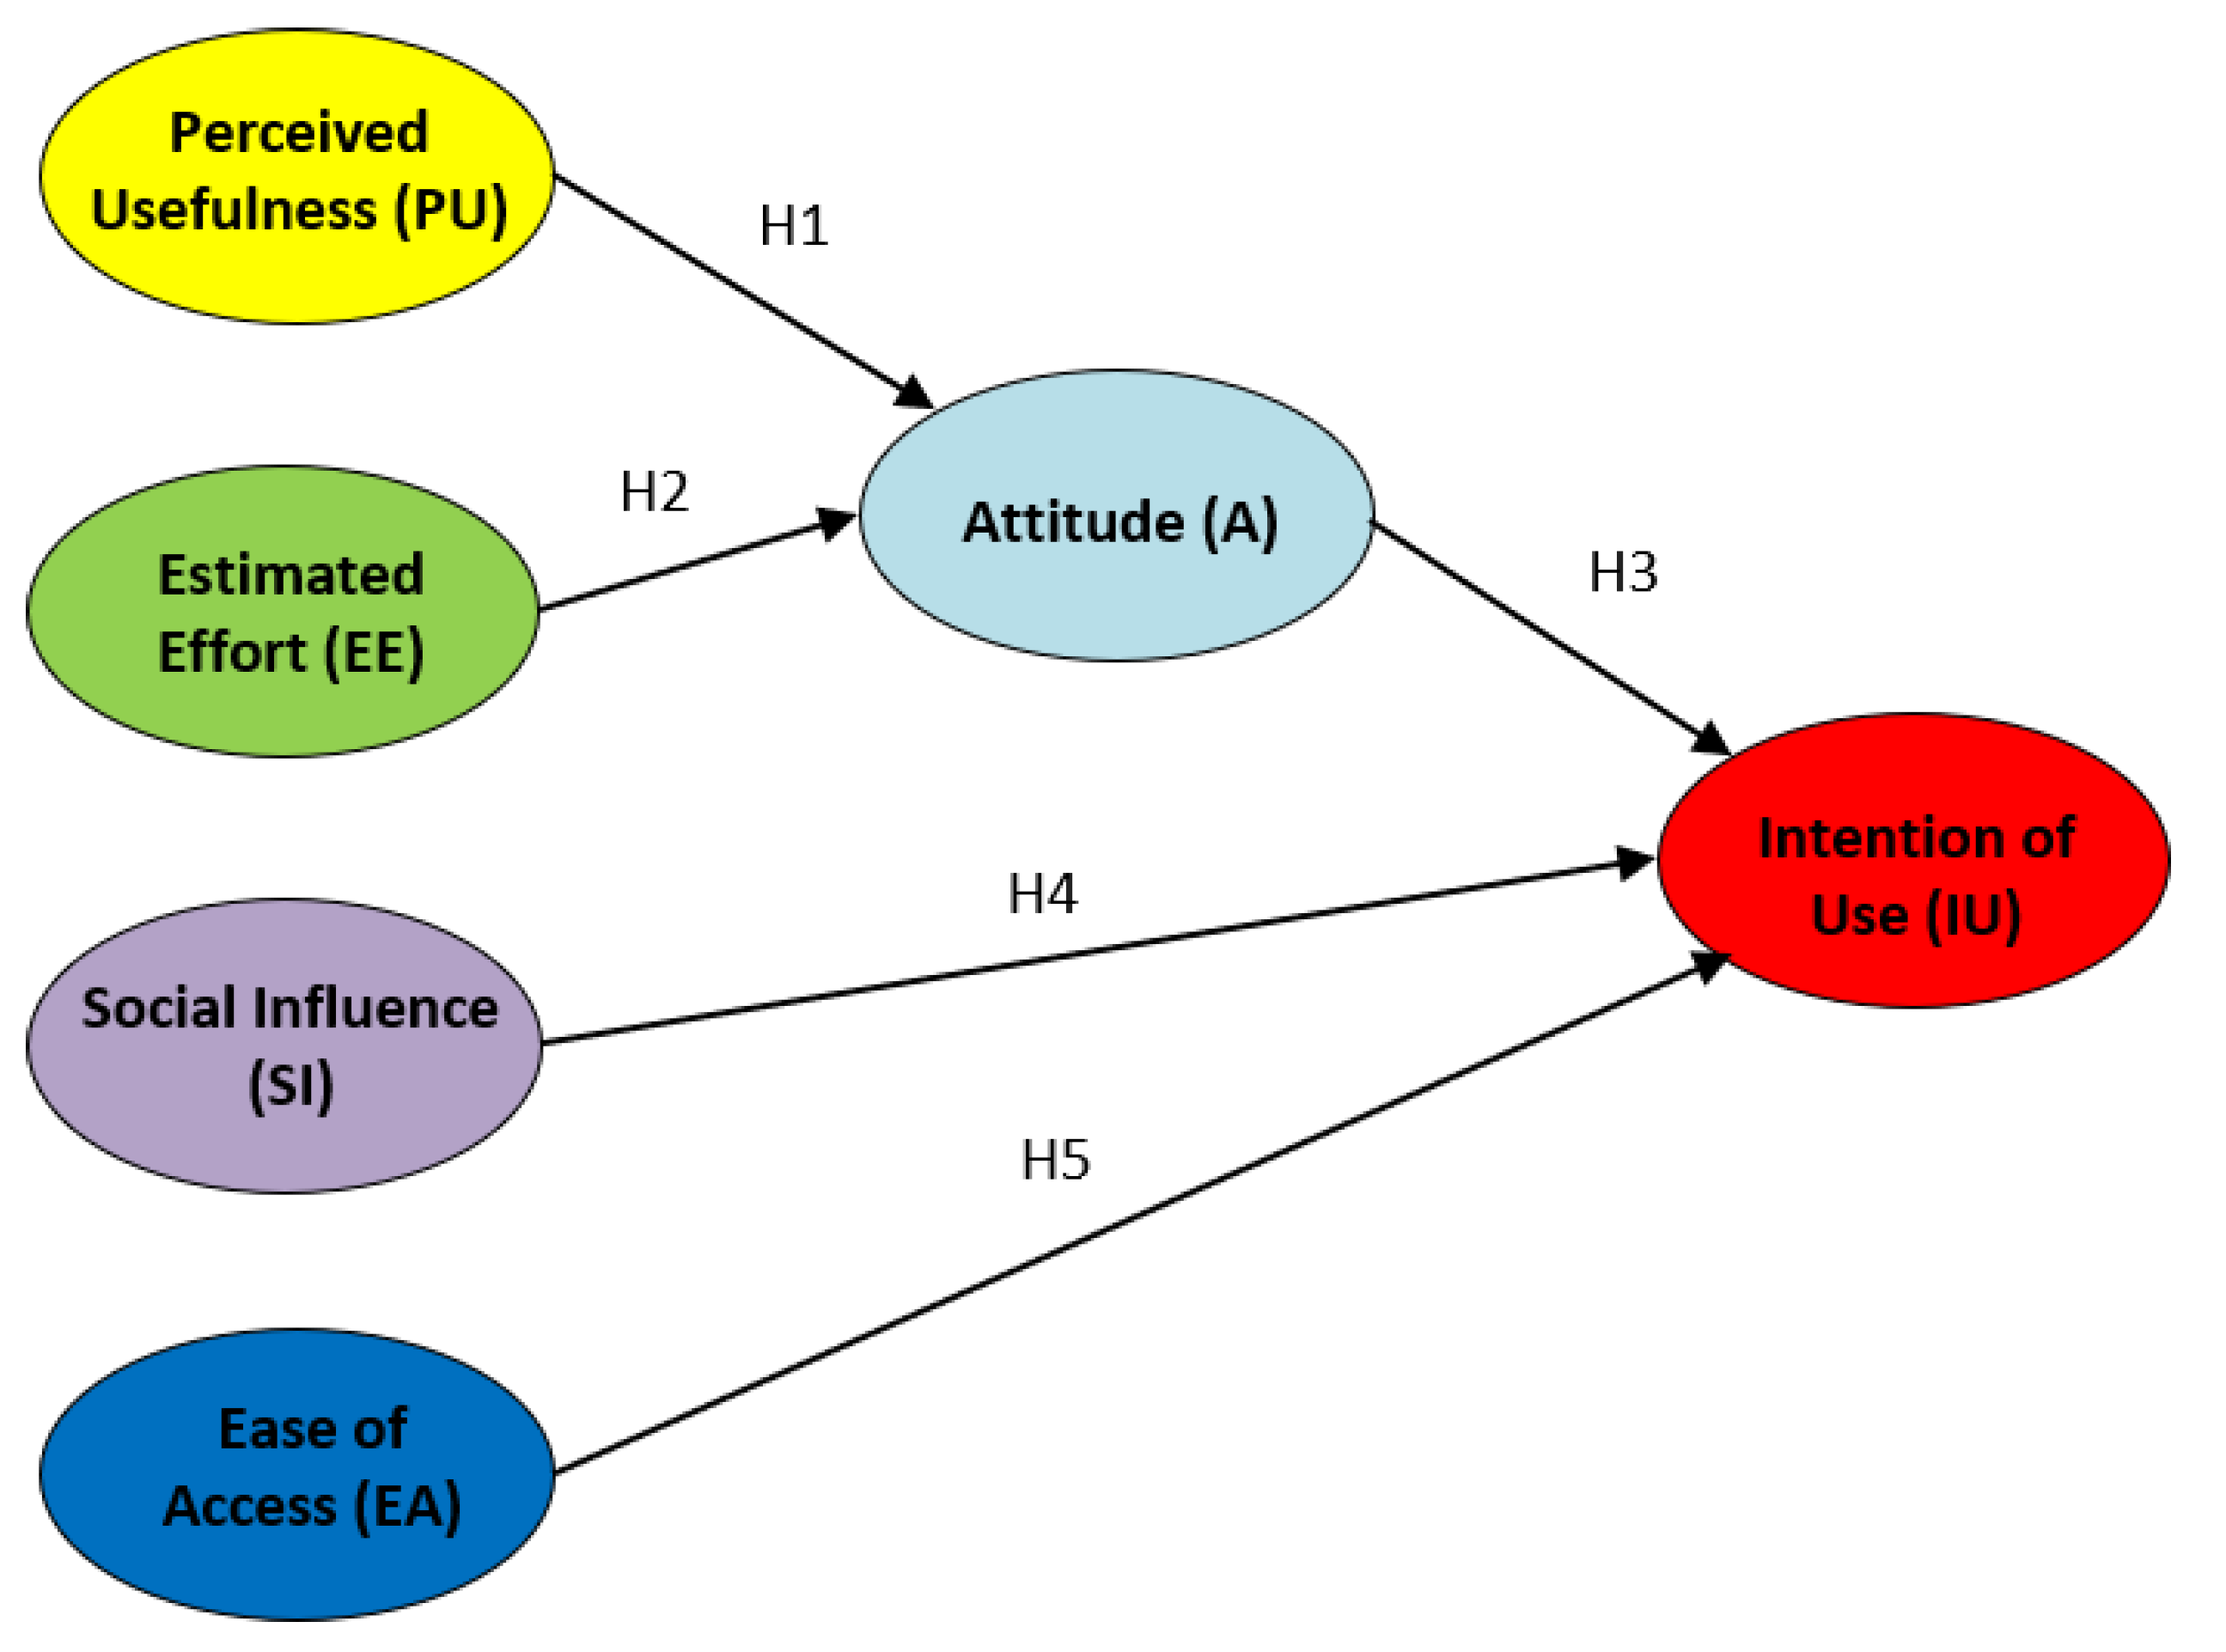
3.2. Proposed Hypotheses

This study aims to analyze the theoretical factors/indicators/variables that influence students in their learning process. To perform this analysis, a Structural Equation Modeling (SEM) is proposed. These models are a general multivariate analysis technique, which hypothesizes and tests causal relationships among factors with a linear equation system [41,42]. In addition to this, we have studied the results related to the students’ interaction from several resources of the virtual platform (evaluation items, contents and forums).
Causal models can involve either manifest variables, latent variables, or both. A manifest variable is a specific statement of the opinion survey, whereas a latent variable is a factor or indicator that groups a set of statements (in particular, 3 to 4 statements, in our case). The behavior of a latent variable can only be computed through their influences over manifest variables. In particular, a SEM model is visually represented as a directed graph where nodes are factors and directed edges (arrows) label the correlation among them. Our proposed model is shown in Figure 2.
The factors/indicators (or latent variables) defined in this work are based on the UTAUT model defined in [40]. These factors are the following ones:
  • Perceived Usefulness (PU). Usefulness perceived by the student when using the laboratories based on containers.
  • Estimated Effort (EE). Ease of use (or effort) perceived by the student when using the laboratories based on containers.
  • Attitude (A). Students’ resistance of using the proposed technology, and the benefits of using it for the practical activities.
  • Social Influence (SI). Students’ mind perceived from colleagues and lecturers about the practical experience with the laboratories.
  • Ease of Access (EA). Perceived availability about educative resources by students.
  • Intention of Use (IU). Possibility of using this type of technology for other experiences in the future.
Therefore, next hypotheses are defined for our SEM model:
  • H1. The PU factor using the CVL technology will positively influence the A factor.
  • H2. The EE factor using the CVL technology will positively influence the A factor.
  • H3. The A factor using the CVL technology will positively influence the IU factor.
  • H4. The SI factor using the CVL technology will positively influence the IU factor.
  • H5. The EA factor using the CVL technology will positively influence the IU factor.
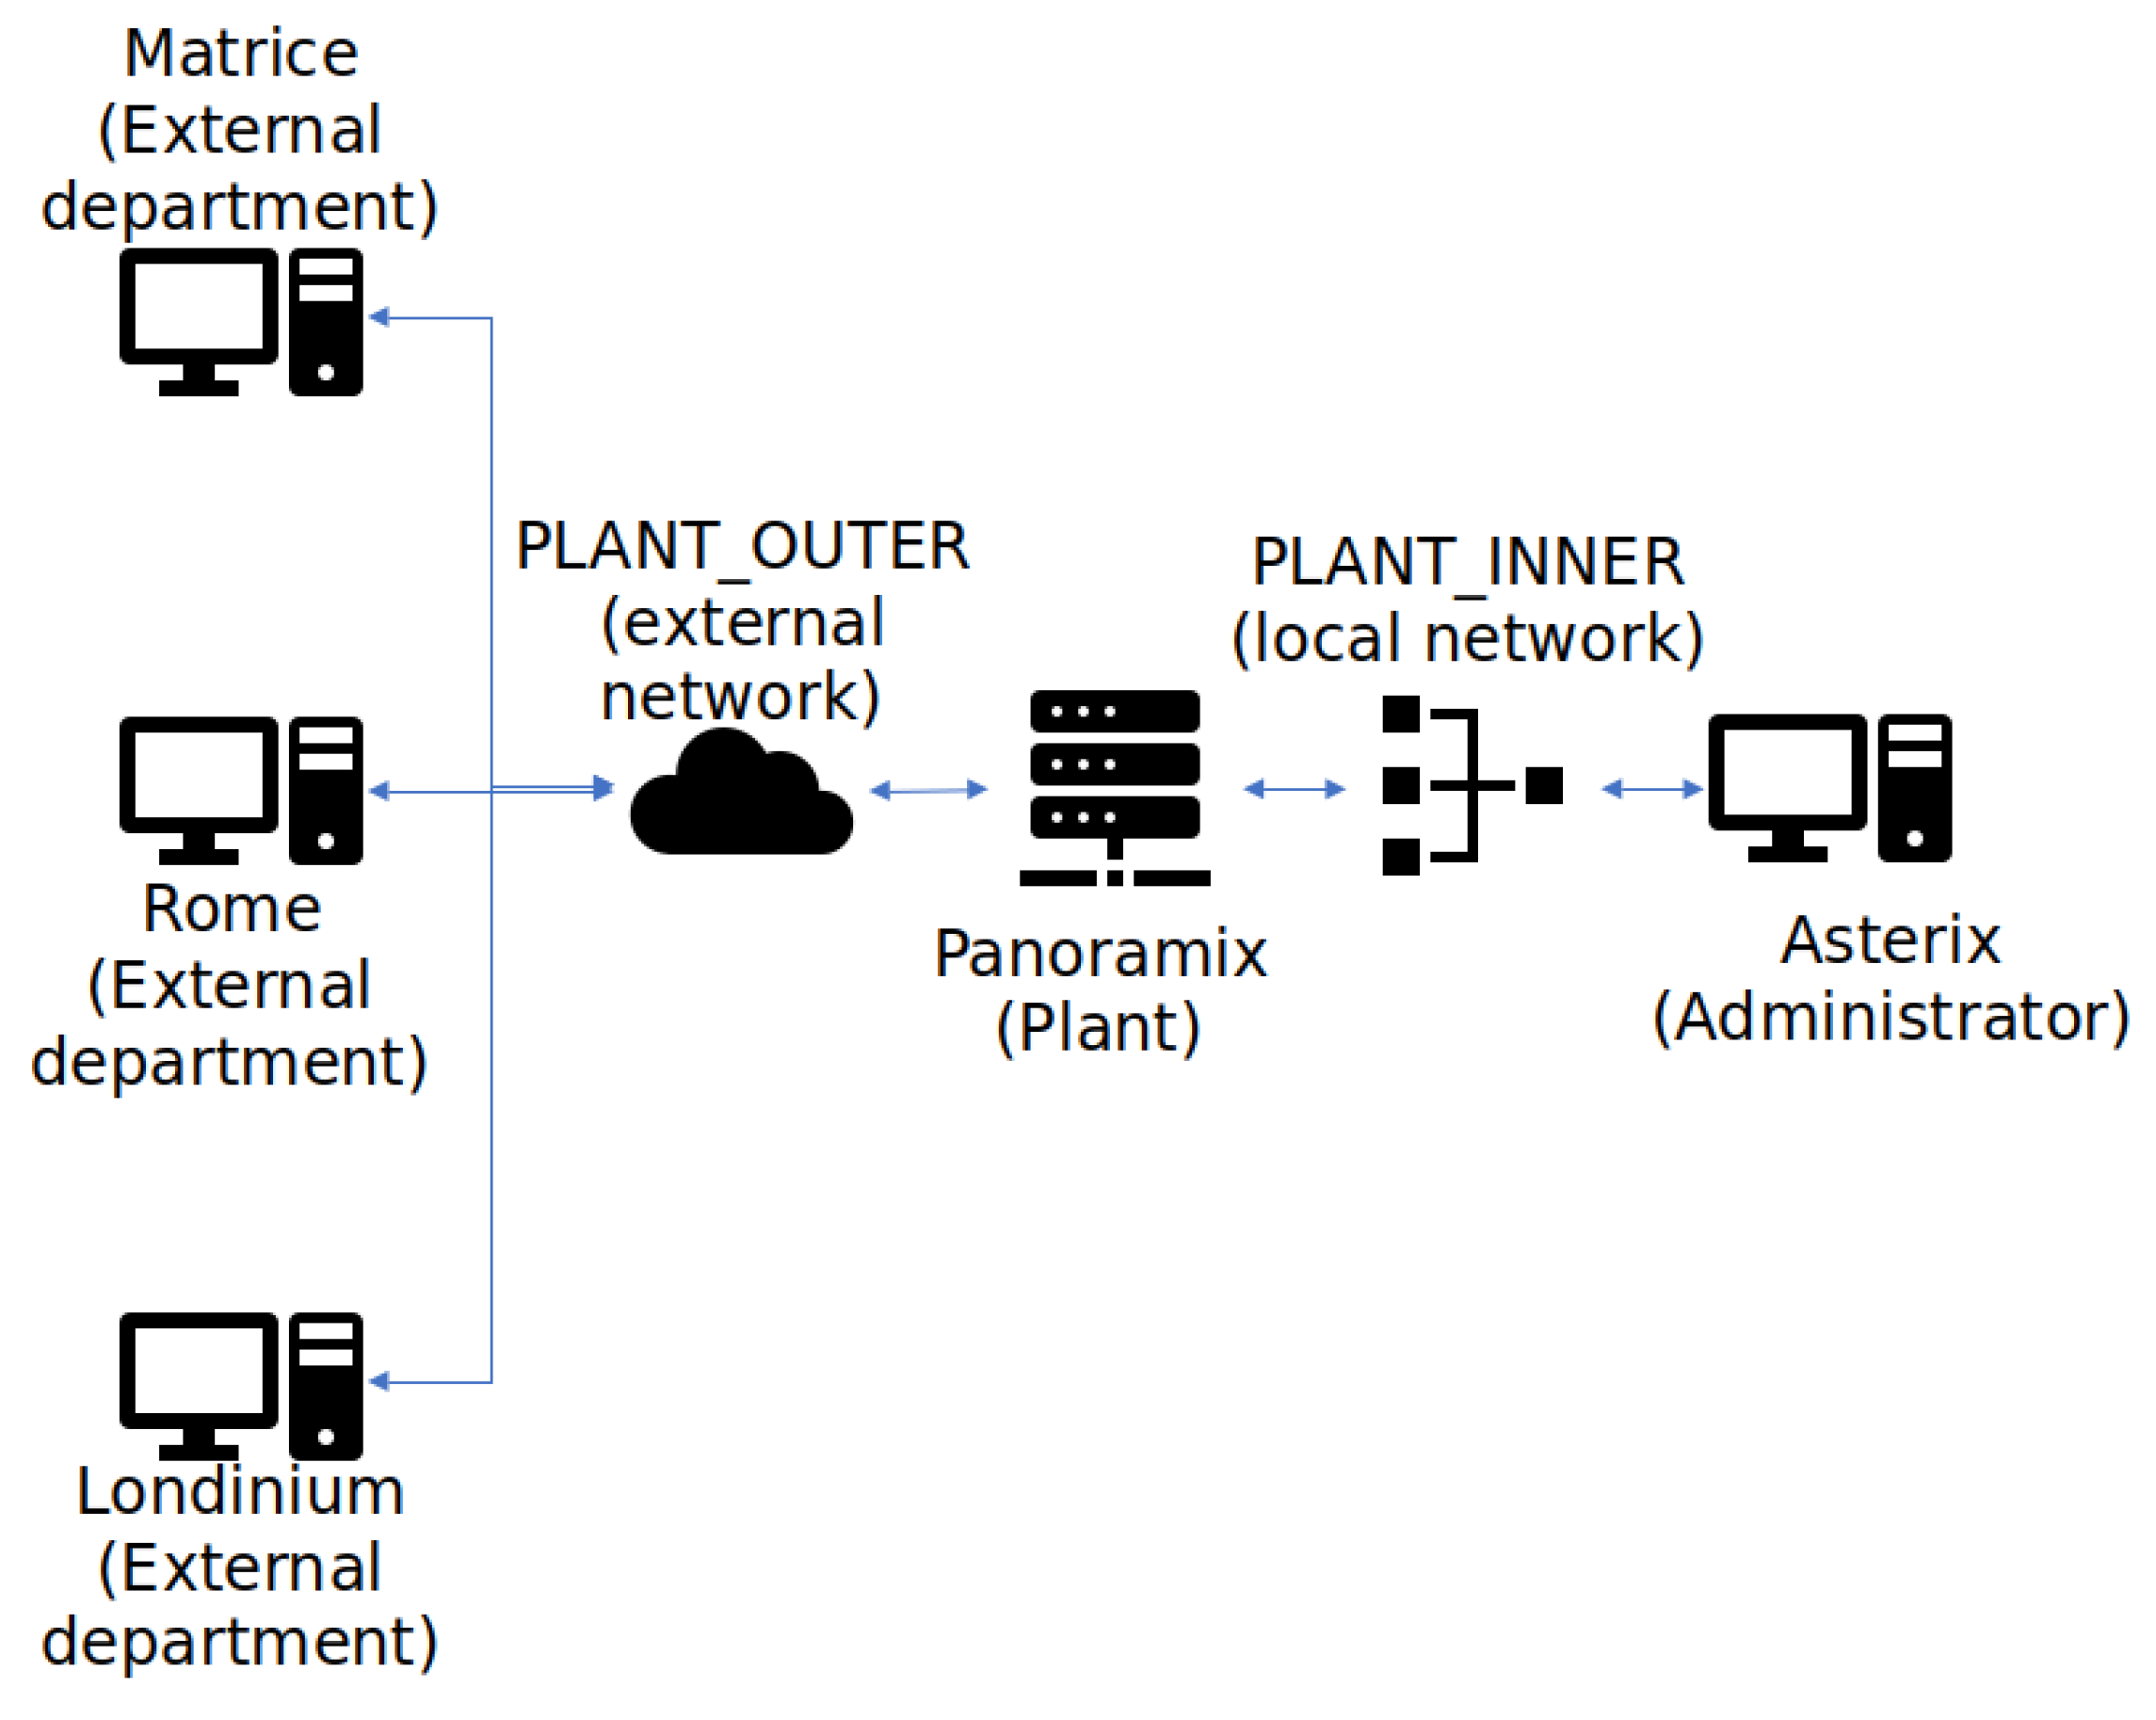
3.3. Case of Study

As previously stated, the practical assessment is designed by presenting a fictional enterprise to the students and asking them to adopt the role of a new security technician. The fictional enterprise is called Panoramix Pharma, and its main activity is the production of magical potions. However, some security problems have been encountered recently in the production plant, and the new technician is required by the company to solve those issues.
The production plant is composed of three elements:
  • Entry, from which the ingredients of the secret potion reach the production chain.
  • Kitchen, where the recipe of the potion is prepared.
  • Bottling, where the potion is bottled for its distribution.
Each of these elements has a controller. A monitoring system has been created on each controller, whose interface consists of a series of RESTful services for allowing the information exchange. These services are developed for checking the controller status, switching it on/off, and establishing ingredient values (in Entry), temperature and time (in Kitchen), and quantity and closing pressure (in Bottling).
The development of the network architecture has been gradual, according of the needs at each moment. For this reason, it is fundamental to correctly monitor the operation of the plant. This is done through an administrator dashboard designed to allow the configuration of the plant and to check the operating logs. Figure 3 shows the appearance of this panel. An explanatory video with the steps involved in solving the practical assessment has been published in: https://youtu.be/vJg6gqxo6Ss (in Spanish).

3.4. Design and Functionality

This section details some technical details of the practical activity, and how it relates to the virtualization technology describes in the previous section, in terms of design and functionality. In addition to this, the principal steps students should take for solving the activity are detailed.
Figure 1 represents both the inner and the outer plants of the company. The administrator panel is connected directly to the internal network; however, as different departments of the company need to have access to production information in order to operate correctly, an external network is also present in this structure. This network structure, communication configuration, API services, and so on, are provided to students with several containers. Their control is transferred to the students to ease its role as a technician of the company (see Figure 4).
The main objective behind the design of the CVL presented in this work is the creation of consistent yet realistic virtual laboratory environments. Following this objective, we consider that the Linux Docker [9] virtualization technology is the best option for fulfilling our needs. This technology provides an ideal abstraction layer composed of Linux containers which in our case represent the virtual laboratory. This way, the laboratory designer can determine appropriate execution environments, defining the installed software, emulated hardware, library versions and configuration settings. As mentioned in Section 2.1, the features offered by Linux Docker may eventually lead the students to a greater sense of freedom and control over the resources, as well as to a lesser sense of constraint due to the availability of those resources. Hence, we hypothesize that the use of this technology should entail a higher general acceptance of the laboratories.
Configuration files such as the one shown in Figure 5 are essential for the deployment of Linux Docker containers. In our case, CVL parameters regarding available containers, associated ports, and characteristics of the internal and external networks of the company are specified in this file. Parameters such as unique identifiers for each container in the network can be also automatically set for each particular student, this way minimizing plagiarism.
The only technical requirement regarding the use of the proposed CVL is that the host supports Linux Docker (regardless of specific versions or configurations). By fulfilling this requirement, the student can manage his/her environment with total freedom and avoiding access conflicts with other students. The Operative System running in the host will not affect the execution environment of the student’s platform. The students’ grade of acceptance of the technology is therefore expected to be increased by these facts.
As an example, Figure 6 shows the corresponding commands to start and stop the network of containers belong to the plant. These are the ones viewed in Figure 4. It is necessary to use the specific command to compose a set of specific containers with a set of parameters, such as name, configuration file, among others.
The main advantages provided by container-based virtualization of laboratories [9] are: (1) the use of start-up configurations allows the designers to effectively provision and package the virtual laboratories with all the configuration files needed; (2) each process container is allocated with all its necessary resources in a separated way; (3) each process container presents its own network name-spaces, thanks to the use of virtual interfaces and an IP address of its own; and (4) it is possible to both modify the containers and use images to create new containers.
Regarding the functionality of the CVL, the practical activity is presented to the students as a sequence of events that must be solved in order. The main steps students should take for solving the activity are as follows:
  • Finding out the characteristics of the current security service of the company (if any). Checking the existence of already existing access policies. Implementation of a security policy (given that the student will verify that no policy exists).
  • Forbidding any access to the plant. Dealing with a set of issues that will arise, since the students does not have administrator access to the control panel. Allowing access among nodes of the internal network.
  • Analyzing the suitability of the applied policy (for instance, configuration of the external accesses). Dealing with the fact that all external accesses are forbidden. Detection of strange traffic behaviors after solving the previous issue.
  • Providing the internal network with the most suitable policy access, using Uncomplicated Firewall (UFW) [43] rules. These actions will lead to a better control of the network access. In particular, Figure 7 shows an example of use, in which the student establishes a set of firewall rules, such as denying a set of TCP ports, allowing specific TCP and UDP ports, and checking the status of the firewall. All these actions are performed in the container which supports the firewall.
  • Providing the external network with the most suitable policy access, also using firewall rules. These actions will lead to a better control of the network access.
  • Monitoring the network log, blocking all strange IP connections and malicious traffic, and analyzing them. Figure 8 shows an example of checking the network configuration of a particular container. More advanced actions can be performed, since each container owns all the features described along the paper.
  • Finding network elements (machines) that spread malicious orders, using TCPFlow [44]. Detecting their origin and associated connections. Point-to-point connections are established to destination machines, using ports of the network containers (an example of the available ports can be seen in Figure 4).
  • Refining the access policy as a final step from the perspective of the HTTP application layer (malicious communications detection, analysis and filtering). After fulfilling all these tasks, the access policy will have been redesigned and the whole network effectively secured.

4. Results

4.1. Instruments and Data Collection

The use of a CVL in the context of cybersecurity subjects and methodologies based on distance education is presented in this work. In particular, the name of the subject used for this research is “Cybersecurity”, composed of 6 ECTS (European Credit Transfer System) credits. The subject belongs to the “Computer Science Engineering” undergraduate degree at UNED. There are more than 72 Associated Centers belonging to UNED, where students can optionally attend face-to-face classes, so the UNED methodology is blended in some cases. Since these classes are not mandatory at UNED, and are only available for subjects with a massive attendance, the instructional design of subjects cannot consider these face-to-face classes for the curriculum.
“Cybersecurity” in this degree is a mainly practical subject which addresses Information Security leaving a little aside the physical and electronic aspects of security. The teaching/learning process follows the European Higher Education Area (EHEA) guidelines, implying a greater amount of interaction with and between the students, as well as an increase on the frequency of virtual attendance, when compared to traditional teaching/learning processes. Due to distance learning methodology and the high number of students, all these characteristics fit particularly well with the philosophy at UNED.
A total of 204 students enrolled in the subject in the 2018–2019 academic year (second semester), compared to 246 in the previous year. In the academic year 2018–2019, 101 of those students were active, and 38 of them (34 male and 4 female) participated in the opinion survey conducted after the subject was over, since it was not mandatory. Regarding the academic year 2017–2018, 129 students (115 and 14 female) both completed the practical assessment of the subject, and participated in the questionnaire, which was mandatory in that academic year.
Table 1 shows demographic data regarding the enrolled students for both academic years 2017–2018 and 2018–2019. Demographic data has been normalized and divided into gender, age group, and students’ familiarity with the topic of cybersecurity. Statistics are similar when comparing these indicators for both academic years 2017–2018 and 2018–2019. In order to validate the suitability of the demographic data for the population of both academic years, a Shapiro–Wilk test [45] was employed, effectively proving that both groups follow a normal distribution and they belong to the same population.
Since this validation was successful, a t-test analysis can be subsequently performed to verify their comparability. A t-test for each indicator has been performed individually to check that students from both academic years belong to the same population. T-tests can be used when two independent samples from the same or different populations are considered. This test measures whether the average value differs significantly across samples. Since all p-values are greater than 0.05, we cannot discard the null hypothesis of identical average scores, i.e., both groups represent similar individuals and they are comparable. Therefore, both groups belong to the same population.
The particular obtained values from our demographic indicators are the following:
  • Gender (t = 0.295; p-value = 0.768).
  • Age Group (t = −0.208; p-value = 0.835).
  • Familiarity with Cybersecurity (t = −0.139; p-value = 0.900).
On the other hand, two data are included in the study performed in this work:
  • Students’ acceptance. Students were encouraged to answer an opinion questionnaire to check and validate their acceptance with respect to the technology used in each academic year. The survey is based on the UTAUT methodology [11,40]. UTAUT is a very suitable model to analyze the intention to use technology, remote virtual laboratories in our case, and their benefits. The learning outcomes by analyzing the data gathered from the study is analyzed and compared using the factors that influenced the intention of use of the laboratory.
  • Students’ interactions. This data includes information about the evaluation, forums and contents, using the number of accesses, sessions, and time. A set of visualization techniques are required to analyze new technologies and virtual platforms in the education field [46]. These can allow faculties to improve the learning/teaching strategies and interactions to be employed in virtual courses. It may also allow researchers to make predictions about the students’ behavior during their process of learning, such as preventing dropouts in courses [47].
An initial analysis of the available data was presented in [33]. This first results in terms of students’ acceptance and interactions were also compared to the previous 2017–2018 academic year. This analysis is exhaustively extended here, by including results and conclusions about the number of accesses, sessions, and time in the virtual platform (within forums, and evaluation and contents resources).

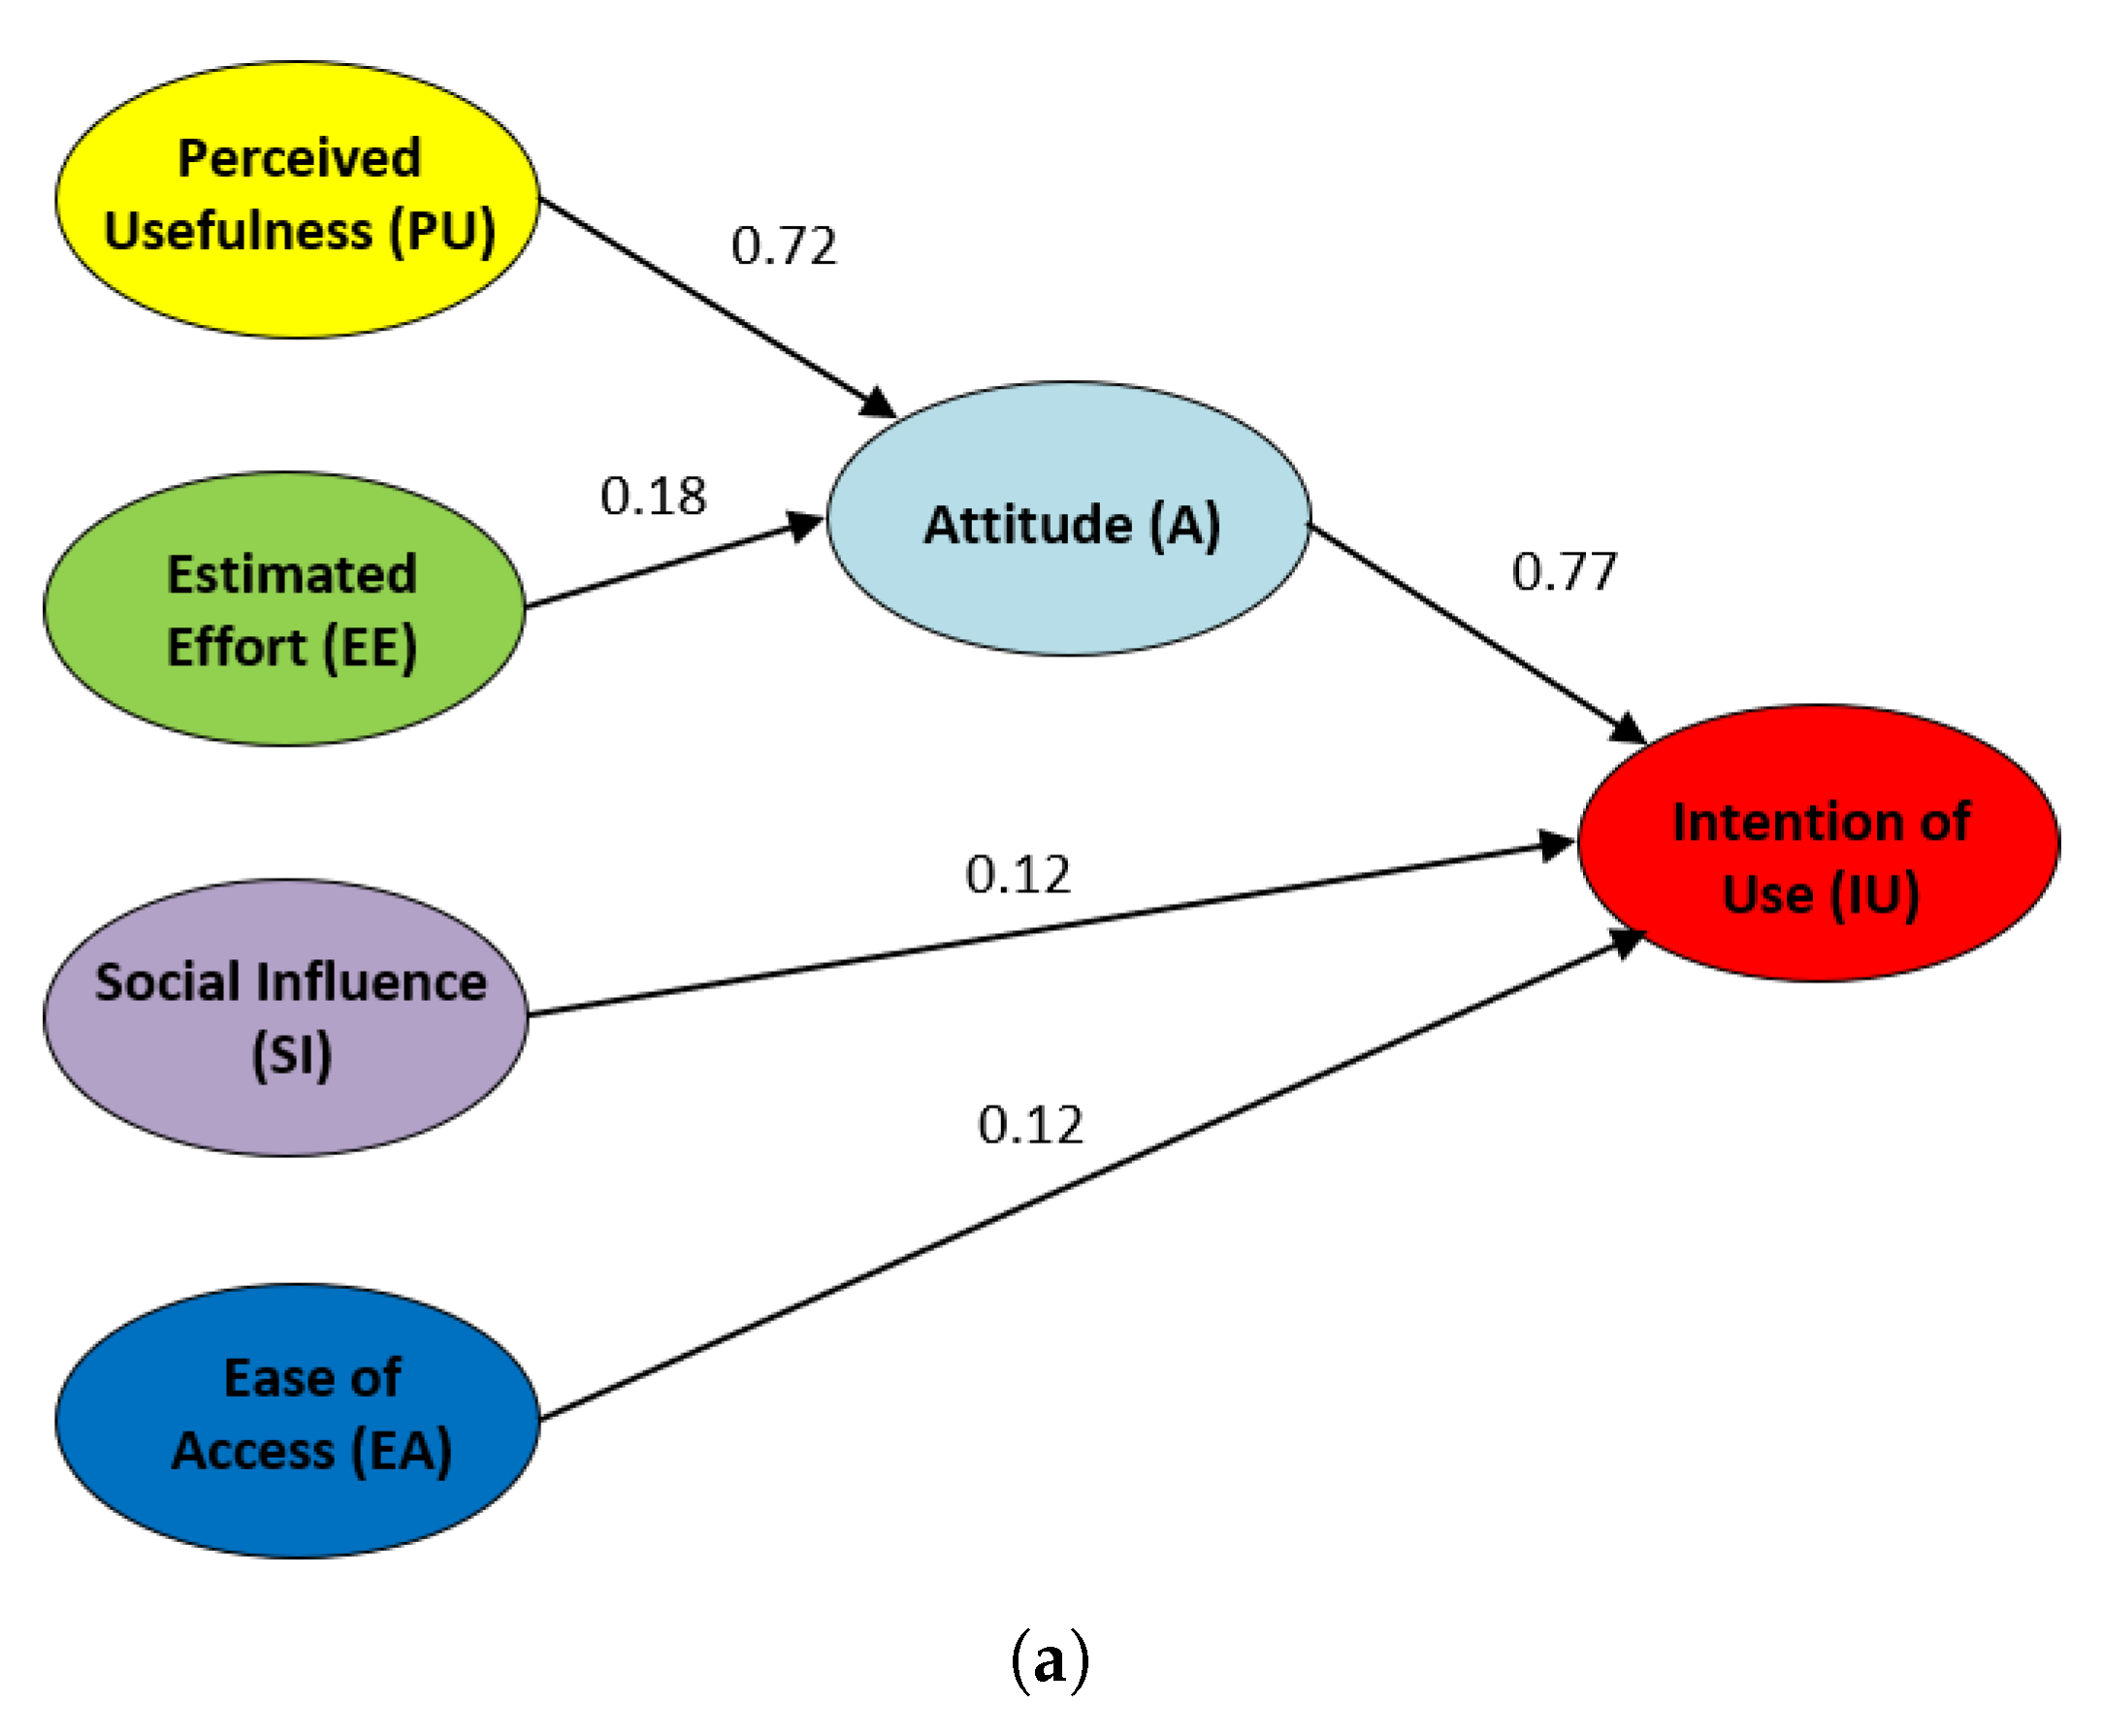
4.2. Students’ Acceptance

As for acceptance evaluation, students were surveyed with respect to the virtual laboratory based on containers, CVL. Each question must be answered with a five-point liker-type scale, ranging from (1) strongly disagree to (5) strongly agree. These are based on the presented factors for this work (PU, EE, A, SI, EA, IU), already detailed in Section 3.2). All statements are detailed in Appendix A.
Figure 9 is a radar chart that shows the values for factors from the survey, regarding the experiences inside the academic years 2017–2018 and 2018–2019. A radar chart is a graph made up of a sequence of equi-angular spokes, named radii, each of them representing one of the factors. The size of each spoke depends on the corresponding value of the factor depending on both the maximum and minimum possible values. A line is drawn connecting the values for each factor spoke. The resulting graph is like a blue star for the experience presented in this work, and a red star for the previous experience with the LoT@UNED platform in the 2017–2018 academic year [29]. Values are also shown in Table 2. Additionally, this dis-aggregated results are presented in Table 3 and Table 4, for both academic years 2017–2018 and 2018–2019.
Differences between the employed indicators regarding academic years 2017–2018 and 2018–2019 are quite clear: “perceived usefulness” achieves 4.45 out of 5 in the academic year 2018–2019, as opposed to 3.93 out of 5 in the previous year, while the “estimated effort” decreases from one year to the following (from 4.13 to 3.89), probably due to the additional effort of learning some concepts regarding the Linux Docker technology. Regarding “attitude”, the score increases from the academic year 2017-2018 (4.11 points) to 2018–2019 (4.51 points). The perceived “ease of access”, which considers both the virtual laboratory and associated resources, also increases from 3.40 to 4.03, as well as the “social influence” (3.89 versus 3.67). Students consider more probable to use the virtual laboratory in the future, according to the score of the indicator “intention of use”, which increases from 4.04 in the academic year 2017–2018 to 4.37 in the following one. Standard deviation ranges from 0.49 to 0.85 considering all indicators of academic year 2018–2019.
Table 3 and Table 4 compare the detailed results regarding the opinion survey between the academic years 2017–2018 and 2018–2019. In general, the main results show a small improvement from the first year to the second one. 95% of the students consider the experience to be useful or strongly useful for their learning, and 80% seen the platform as easy to use (agreeing or strongly agreeing with it), hence useful for improving their performance on the assessment. The students’ opinion is also influenced by a social factor (65% of agreement), and they also show high scores in “attitude” and “ease of access”. Finally, the “intention of use” of the laboratory in the future is high for 85% of the students, regarding Engineering subjects.

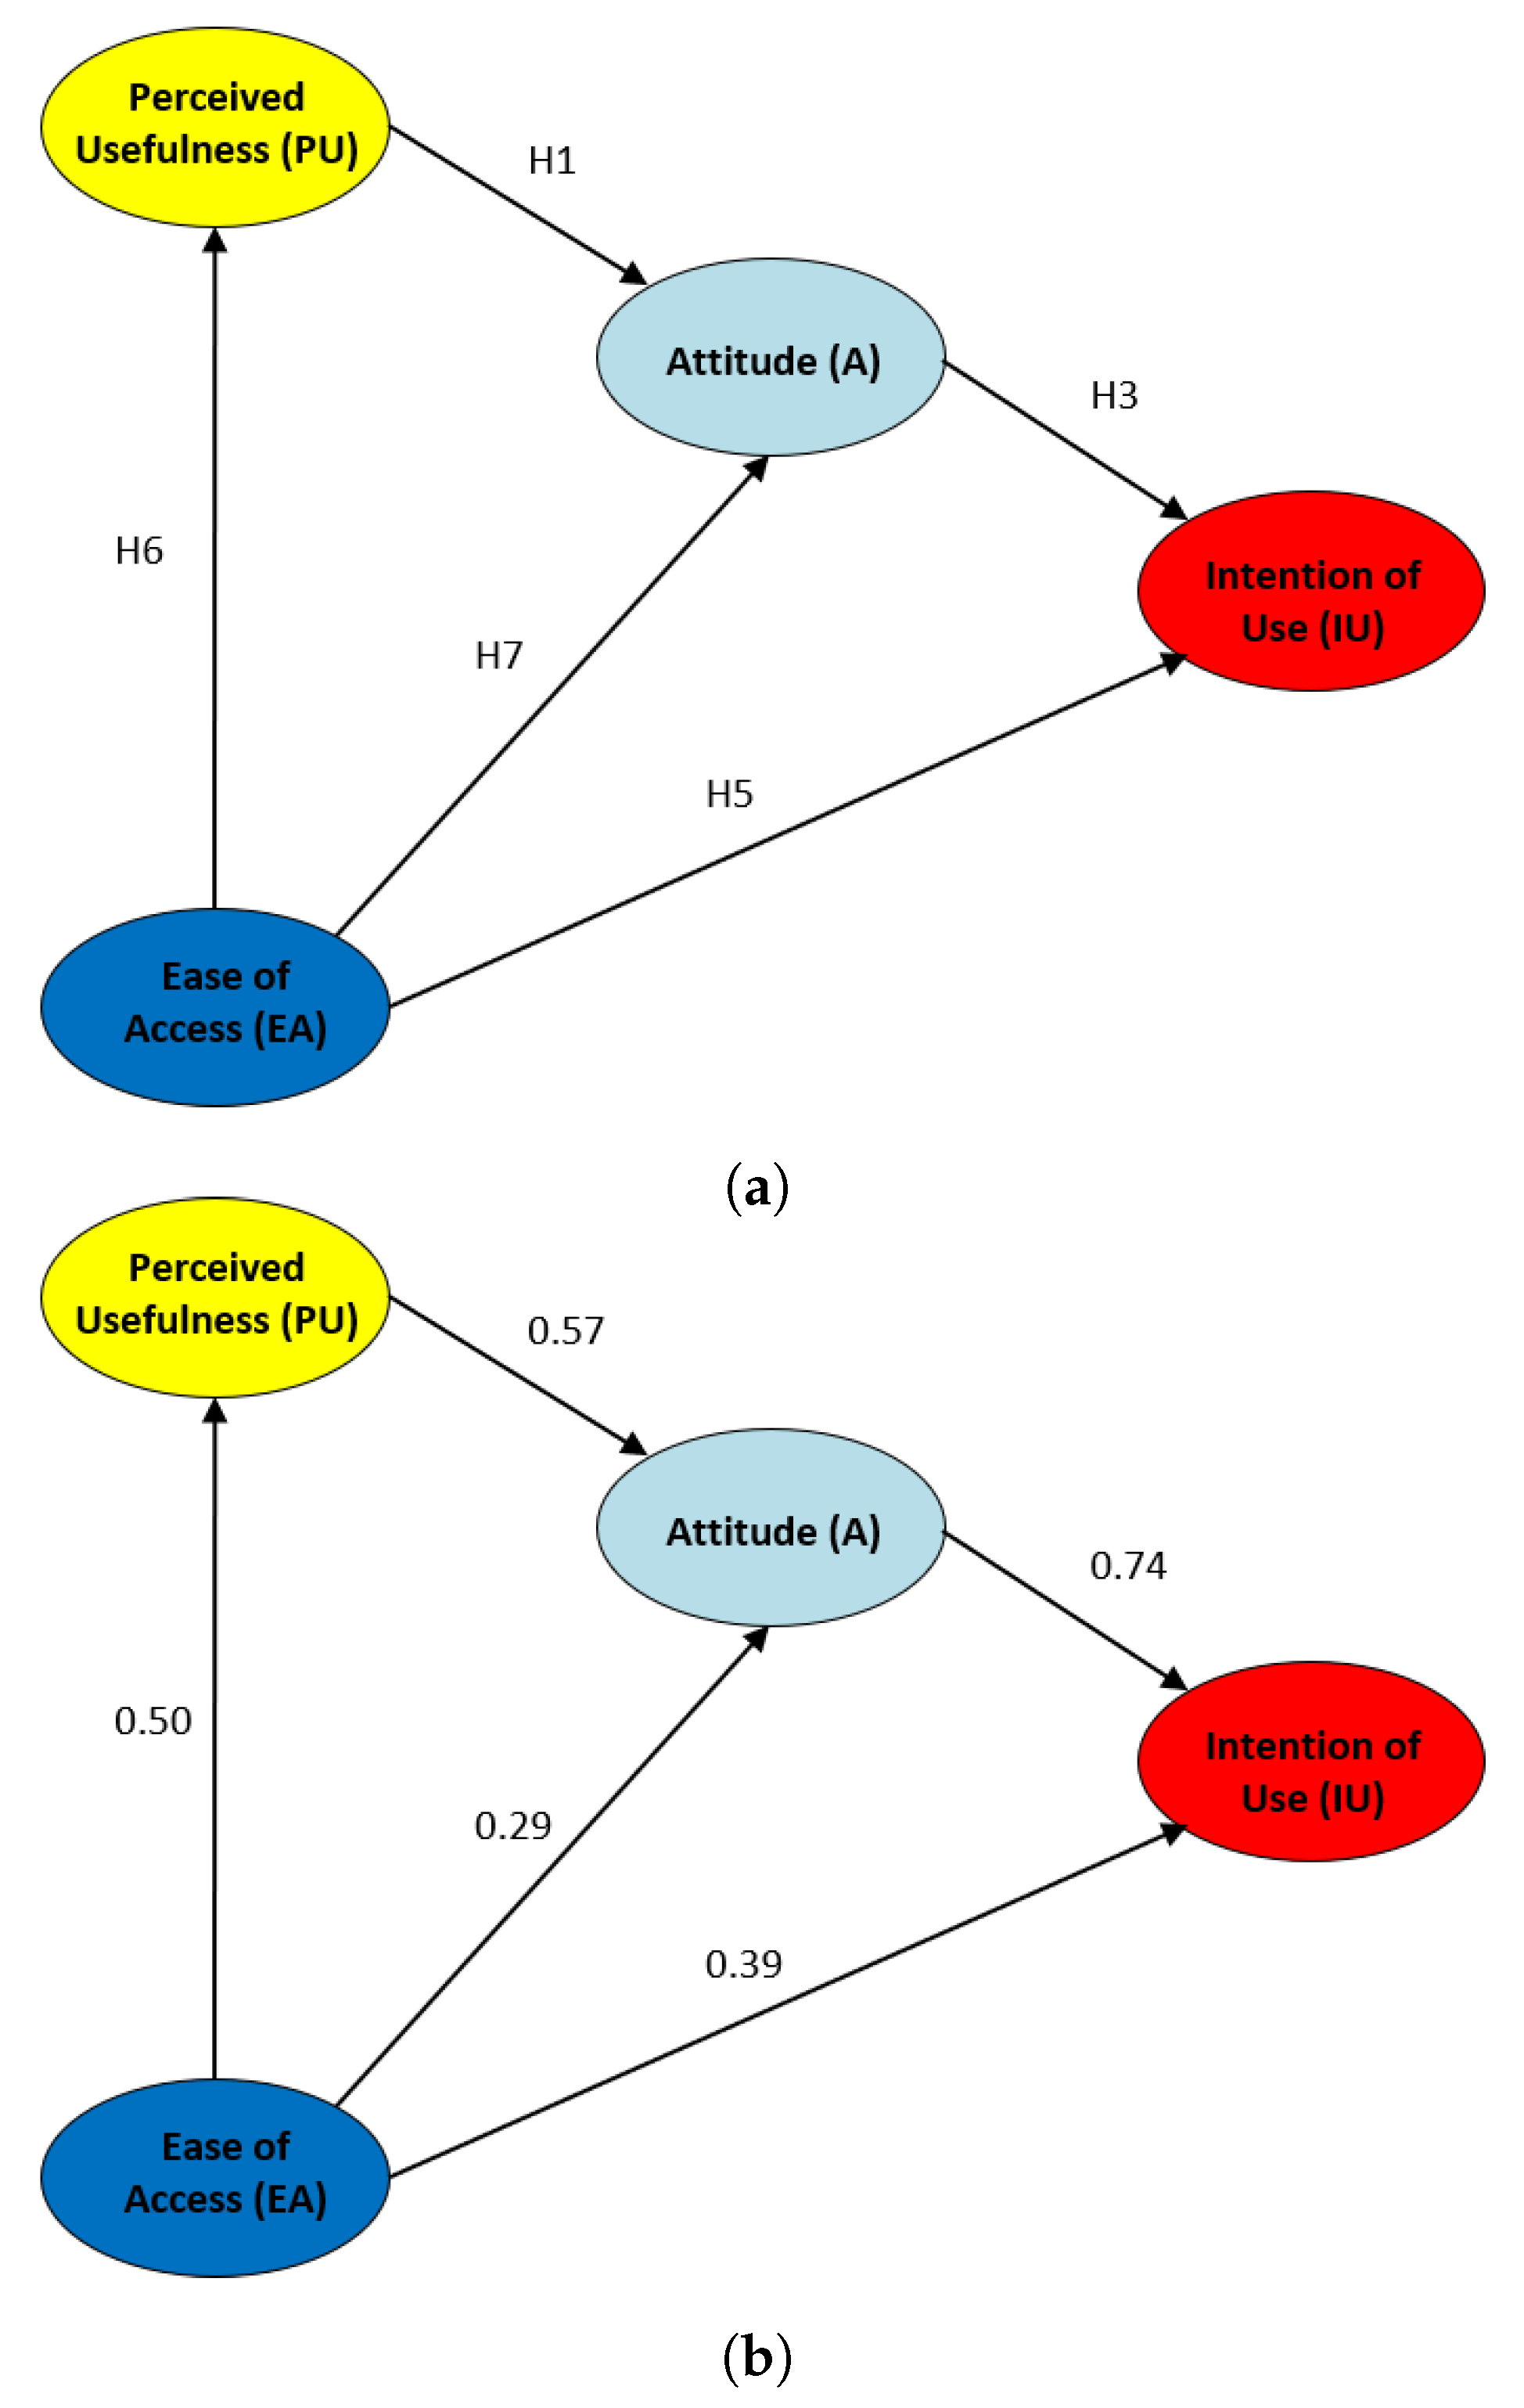
Validating Hypotheses of the Proposed SEM Models

After performing a confirmatory analysis to the defined SEM model, Figure 10 shows the suitability the proposed initial hypotheses (H1 …H5) regarding the obtained results. The influence of the hypotheses when using LoT@UNED, in academic year 2017–2018, is represented in Figure 10a, whereas this influence regarding the CVL technology used in academic year 2018–2019 is represented in Figure 10b. In both, each arrow is labeled with the reliable influence value for each hypothesis. The higher this value, the stronger the influence of the origin node over the sink node. Hypotheses with influence values over 0.4 are considered to be very reliable [42,48].
The study of the calculated results for the SEM model with LoT@UNED details that the perceived usefulness does influence the students’ attitude (H1 = 0.72), and the future intention of use this technology in an indirect way (H3 = 0.77). However, the estimated effort (or ease of use of the platform) does not affect the students’ attitude (H2 = 0.18) to use the LoT@UNED technology in virtual courses. In addition to this, neither the social influence among students (H4 = 0.12) nor the ease of access to the LoT@UNED platform (H4 = 0.12) affect the intention to use it in other subjects.
Results for the SEM model with CVL are very similar for hypotheses H1, H2, and H3, i.e., the perceived usefulness of the CVL technology influences the students’ attitude in a strong way (H1 = 0.67) and, as a consequence, the intention of use this technology is also affected (H3 = 0.71). In contrast to this, the estimated effort hardly affects the students’ attitude (H2 = 0.16) to use the LoT@UNED technology in our courses. Even less impact has the social influence among students (H4 = 0.06) when using the CVL technology for practical activities in the context of cybersecurity. A main difference with respect to the LoT@UNED approach is that the ease of access does have a much stronger influence (H5 = 0.38) over the intention of using the CVL technology in other subjects.
Therefore, we can confirm that it is more difficult for students to start using the CVL technology than the previously proposed LoT@UNED technology in the context of cybersecurity. Once they have configured the system, they are even more independent. The perceived usefulness and attitude are relevant with respect to the intention to use the platform in both cases, and the estimated effort it is not very relevant, since both technologies are easy to use.
As a second part of this study, focusing on the SEM model of the CVL technology presented in this work, we propose an improved model more suitable for this technology. In this new model, H2 and H4 hypotheses have been discarded, and a new two hypotheses are included:
  • H6. The EA factor using the CVL technology will positively influence the PU factor.
  • H7. The EA factor using the CVL technology will positively influence the A factor.
As for the improved SEM model (see Figure 11), the perceived usefulness of the CVL technology also influences the students’ attitude (H1 = 0.57), and hence the intention of use regarding this technology is also affected (H3 = 0.74). In addition to this, the ease of access affects in a strong way the perceived usefulness (H7 = 0.50), and slightly the students’ attitude (H6 = 0.29). Finally, the intention of use is affected by the ease of access with the same intensity (H5 = 0.39) as in the initial model for the CVL technology.
We can conclude that our validated SEM model is good and with a high reliability, because next indices are optimal [48,49]. First, the relation X2/DF (Chi-square/Degree Freedom) is 1.2, which is lower than 3.0, and the chi-square higher than 0.5 (with a value of 1). The GFI (Goodness of Fit Index) and CFI (Comparative Fit Index) indicators are great (with a value of 0.984), since these values are higher than 0.9. Finally, the RMSEA (Root Mean Square Error of Approximation) value is 0.08. For this reason, the gathered data fits the proposed SEM, and all hypotheses are tested satisfactorily in our improved model.

4.3. Students’ Tracking

As a second part of the evaluation, apart from those indicators related to students’ acceptance, it is also very relevant to analyze the students’ interactions to study their behavior in virtual courses. In [50], authors analyze the students’ performance through procrastination behavior. Lower procrastination tendencies usually achieve better than those with higher procrastination. In our case, the interaction of students with a set of elements of the virtual course (evaluation resources, contents, and forums) is analyzed. This way, the students’ behavior is tested in a comparative way for both academic years 2017–2018 and 2018–2019.
The distribution of grades for both academic years 2017–2018 and 2018–2019 was already analyzed in [33]. The conclusion was that the students’ final qualifications were higher for academic year 2018–2019, when evaluating the practical activity related to firewalls. To sum up, the mean grade for academic year 2017–2018 was 8.40, and the standard deviation was 0.71. However, the mean grade for academic year 2018–2019 was 9.00, and the standard deviation was 1.17. There is a difference of 0.60 points in a favor of the last academic year, and the variation of qualifications is higher.
For the gathered quantitative results, a test of normality distribution was performed. The results obtained with a t-test were t = −4,49, p-value = 0.000012, which indicates the existence of a statistically significant difference between grades for both academic years. As an initial conclusion, these results imply that students improved their comprehension of how a firewall works. All t-tests (paired or 2-sample) carried out in these experiments are performed considering an alpha level value of 0.05.
In [33], authors only described a set of results about the number of accesses to forums and contents, in order to compare the students’ behavior of academic year 2018-2019 compared to academic year 2018–2019. A deeper study is performed in this work, and more particularly in the second part of this section, in order to analyze the students’ behavior also in forums and contents, in terms of time and sessions. In this work, the new element “Evaluation Resources” is analyzed from scratch,. This way, number of accesses, time, and sessions recorded at the learning platform are taken into account for the study.
Histograms representing accesses to evaluation resources are shown in Figure 12, for both academic years 2017–2018 and 2018–2019. The frequency of students inside the bin is considered in the vertical axis, and the amount of accesses in the horizontal axis. The obtained values are (Mean = 14.65, Standard Deviation = 13.40) and (Mean = 14.94, Standard Deviation = 10.61), for each academic year, respectively. The t-test (t = 0.22, p-value = 0.83) points out that the distribution of students’ accesses to the evaluation items in the virtual platform for both academic years is very similar. The performed t-test verifies statistically that there is not a significant difference among the results obtained. In particular, the amount of accesses are slightly lower in the academic year 2018–2019.
In addition to this, histograms for the number of sessions using evaluation resources are depicted in Figure 13, for both academic years 2017–2018 and 2018–2019. The frequency of students inside the bin lays in the vertical axis, and the number of sessions in the horizontal axis. The obtained values are (Mean = 6.73, Standard Deviation = 5.32) and (Mean = 6.93, Standard Deviation = 4.21), for each academic year, respectively. The t-test (t = 0.40, p-value = 0.69) indicates that the distribution of students’ sessions for both academic years are comparable. The performed t-test verifies that there is not a statistically significant difference among the obtained results. In particular, the number of sessions are slightly greater in the 2018-2019 academic year, whereas the session distribution is mildly different.
Next, histograms for the time spent in the evaluation resources are shown in Figure 14, for both academic years 2017–2018 and 2018–2019. The frequency of students inside the bin is represented in the vertical axis, and the time spent in the horizontal axis. The obtained values are (Mean = 7.40, Standard Deviation = 8.31) and (Mean = 7.07, Standard Deviation = 8.35), for each academic year, respectively. The t-test (t = 0.36, p-value = 0.72) points out that the time distribution for both academic years is very similar. The performed t-test indicates that there is not a statistically significant difference among the results obtained. In particular, this value is slightly lower in the 2018–2019 academic year.
From the obtained results for the evaluation resources, it can be concluded that they are comparable in terms of accesses, sessions, and time distribution. This is possible because of the fact all t-test calculations are in charge of normality, and there is not a significant difference among the studied indicators for both academic years. Results related to the use of forums and contents will also be presented in the next paragraphs. In particular, histograms about the number of sessions and time will be shown. The students’ interactions in terms of the frequency of accesses in forums and contents were detailed in [33], as part of the prior study.
Regarding the use of the forums, histograms for the number of sessions are shown in Figure 15, for both academic years 2017–2018 and 2018–2019. The frequency of students inside the bin lays in the vertical axis, and the amount of sessions in forums in the horizontal axis. The obtained values are (Mean = 19.86, Standard Deviation = 39.88) and (Mean = 14.96, Standard Deviation = 18.11), for each academic year, respectively. The t-test (t = 1.37, p-value = 0.17) indicates that the number of students’ sessions in the forum for both academic years is very similar (slightly lower in the academic year 2018–2019). The performed t-test hence verifies that there is not a statistically significant difference among the results obtained.
Histograms for the time distribution in the forum are represented in Figure 16, for both academic years 2017–2018 and 2018–2019. The frequency of students inside the bin is considered in the vertical axis, and the time spent in forums in the horizontal axis. The obtained values are (Mean = 37.29, Standard Deviation = 52.93) and (Mean = 28.78, Standard Deviation = 37.83), for each academic year, respectively. The t-test (t = 1.64, p-value = 0.10) points out that the time distribution in the forum for both academic years is very similar, being this value slightly lower in the academic year 2018–2019. The performed t-test indicates that no statistically significant difference can be found among the results obtained.
Additionally, histograms are built with the distribution of the number of sessions registered, related to the navigation/viewing of available contents in the virtual platform. These histograms are shown in Figure 17, for both academic years 2017–2018 and 2018–2019. The frequency of students inside the bin is represented in the vertical axis, and the amount of sessions in the horizontal axis. The obtained values are (Mean = 7.63, Standard Deviation = 6.79) and (Mean = 9.02, Standard Deviation = 8.57), for each academic year, respectively. The t-test (t = 1.72, p-value = 0.09) points out that the number of sessions to the viewed contents for both academic years is very similar. These results indicate that no statistically significant difference can be found among the results obtained.
Finally, histograms are used for presenting the distribution of time spent navigating/viewing the available contents of the virtual platform. These histograms are shown in Figure 18, for both academic years 2017–2018 and 2018–2019. The frequency of students inside the bin lays in the vertical axis, and the time spent in contents in the horizontal axis. The obtained scores are (Mean = 68, Standard Deviation = 103) and (Mean = 28, Standard Deviation = 40), for each academic year, respectively. The t-test (t = 4.68, p-value = 4.16) indicates that the time spent in the viewed contents for both academic years is very similar (slightly lower in the academic year 2018–2019). The performed t-test indicates that there is not a statistically significant difference among the results obtained.
The students’ interactions with the virtual platform have been studied in terms of frequency versus evaluation resources, contents, and forums for both academic years 2017–2018 and 2018–2019. The analyzed indicators for each of those interactions have been the number of accesses and sessions, and the time spent in them in a comparative way. In most of the cases, the students’ behavior has been similar and comparable among academic years 2017–2018 and 2018–2019. All t-tests also indicate so from a statistical point of view.
Therefore, we can conclude that neither the use of the virtual platform nor the elements more related to the distance methodology employed during the teaching/learning process affect the intention of using the proposed technologies (LoT@UNED and CVL) during academic years 2017–2018 and 2018–2019. The other option would be that those elements are affected by the technology employed, but always at the same level and hence no differences can be found between the two academic years analyzed. These results enforce the analysis performed about the students’ acceptance, in terms of perceived usefulness, estimated effort, attitude, social influence, or ease of access, since the studied populations are similar and comparable in both academic years (as indicated in Section 4.1. This represents an added value regarding the hypothesized and validated SEM models in this work.

5. Conclusions

This work presents the design and practical application of a container-based virtual laboratory (CVL) within the context of a subject related to cybersecurity, studying how the technology could be extended to other Engineering topics and subjects. Technical requirements for the practical development of the proposed laboratory are described as a case of study. In addition to this, an analysis of the factors and indicators which influence the learning process of students involved in the practical case is presented, together with a comparative study regarding the previous academic year. Firewall technical configurations are similar for the basic infrastructure used in both academic years. However, the number of tasks has been extended in academic year 2018–2019, as well as the students’ guidance through hints. The use of Docker containers for developing the CVL becomes simple and consistent, and low-cost deployments are possible with assessment support, which are beneficial characteristics for both lecturers and students.
The main improvements derived from the implementation of the proposed virtual laboratory can be summarized as follows: (1) Students have independent access (with respect to other students) with a story, in this case, the student has had the role of a junior security technician for a company. This factor helps the improvement of the learning process, and the whole process can be analyzed using it; and (2) the gathered results show better performance, in general, when comparing the new laboratory introduced in this work and the previous one, in terms of students’ acceptance and behavior.
The influence among the evaluated factors or constructors is first analyzed in an exploratory way, in order to compare the principal advantages and drawbacks between them. Therefore, it is possible to analyze the students’ satisfaction regarding both the LoT@UNED and CVL technologies. Additionally, an initial SEM model, which is based on a TAM/UTAUT model, has been hypothesized and compared with data gathered from both the LoT@UNED and CVL technologies. The grade of influence among the indicators for both can be clearly observed. The estimated effort does not influence very much the students’ attitude over both technologies (H2). The social influence does not affect the intention of use the technology for both cases (H4), and the ease of access only affects the intention of use (H5) in the case of the CVL technology. An improved TAM/UTAUT model for the CVL technology has also been hypothesized and validated in a confirmatory way, by using our conclusions about the initial SEM model for the technology proposed in this work.
From the statistical data calculated from experiments, it can be concluded that the use of the CVL improves the intention of use in virtual courses for the context of cybersecurity. From the analysis of our improved SEM model for the CVL technology, some of the initial hypotheses defined (H1, H3, and H5) are fulfilled with a reliable influence, as well as two additional hypotheses (H6 and H7). H2 and H4 hypotheses were discarded. The final indicators of our improved SEM are Perceived Usefulness, Ease of Access, Attitude, and Intention of Use. From these factors, several hypotheses were defined to discover: (1) how the perceived usefulness of students about the CVL technology can influence their attitude for this technology; (2) how the students’ attitude may have an impact on their intention of using the CVL technology (and their usefulness in an indirect way); and (3) how the ease of access to the CVL laboratories could influence the perceived students’ usefulness, their attitude, and their intention of use.
As a final part of the study, the students’ interactions with the learning/teaching virtual platform were analyzed, in terms of the amount of accesses, sessions, and time distribution. In particular, these indicators were examined in terms of evaluation resources, usage of forums, and viewed contents from the virtual platform. Interactions performed by the students with these items are somehow lower than before; however, the overall behavior of students is similar. As a consequence, we conclude that neither the use of the platform nor the distance methodology employed during the teaching/learning process affect the intention to use the technology proposed for each academic year, in which two different approaches have been employed.

Author Contributions

All authors were involved in the foundation items. All authors wrote the paper and read and approved the final manuscript.

Funding

This work is a part of the eNMoLabs research project, funded by the Universidad Nacional de Educación a Distancia (UNED).

Acknowledgments

The authors would like to acknowledge the support of the eNMoLabs research project for the period 2019–2020 from UNED; our teaching innovation group, CyberGID, started at UNED in 2018 and its associated CyberScratch PID project for 2020; another project for the period 2017–2018 from the Computer Science Engineering Faculty (ETSI Informática) in UNED; and the Region of Madrid for the support of E-Madrid-CM Network of Excellence (S2018/TCS-4307). The authors also acknowledge the support of SNOLA, officially recognized Thematic Network of Excellence (RED2018-102725-T) by the Spanish Ministry of Science, Innovation and Universities.

Conflicts of Interest

The authors declare no conflict of interest.

Appendix A. Statements about the Indicators of the Proposed Model

This appendix shows the statements of the opinion survey presented to the students (see Table A1). On the first column the identifier of each statement (Manifest variable) is presented. The specific statement is described on the second column. It is important to remind that the factors/indicators (or latent variables) are Perceived Usefulness (PU), Estimated Effort (EE), Attitude (A), Social Influence (SI), Ease of Access (EA), and Intention of Use (IU). Each factor is made up of 3 or 4 statements related to this topic. Students must grade each statement using a five-point liker-type scale. The ranges are from (1) strongly disagree to (5) strongly agree.
Table A1. Survey Employed for building the UTAUT/TAM Models.
IdentifierQuestion
PU 1I find that the proposed system very useful for learning.
PU 2Using the system allows me to do the laboratory activities in a more efficient way.
PU 3Using the system increases the productivity of my learning.
PU 4If I use the system, I think that my chances of passing are increased.
EE 1My interaction with the system has been clear and understandable.
EE 2I think it’s easy to learn how to use the system.
EE 3I find the system easy to use.
A 1I think using the system is a good idea.
A 2The system increases my interest in the proposed contents.
A 3Using the system is enjoyable.
A 4I liked using the system.
SI 1My classmates think that it is a good idea to use the system.
SI 2My instructors think it’s a good idea to use the system.
SI 3In general, all participants in the subject have sustained the use of the system.
EA 1I have been able to access all the resources that I needed to use the system.
EA 2I have learned everything necessary to be able to use the system.
EA 3The proposed system is not compatible with other learning tools.
EA 4I usually find support about the system in the subject’s forums.
IU 1I would like to reuse the system in other laboratory activities.
IU 2I would like to access the system to reinforce my learning in a freeway.
IU 3I would like to reuse the system in other subjects.

References

  1. Duan, Y. Value Modeling and Calculation for Everything as a Service (XaaS) Based on Reuse. In Proceedings of the 13th International Conference on Software Engineering, Artificial Intelligence, Networking and Parallel/Distributed Computing (SNPD), Kyoto, Japan, 8–10 August 2012. [Google Scholar]
  2. ISACA Survey. State of Cybersecurity. Implications for 2016. Available online: https://www.isaca.org/cyber/Documents/state-of-cybersecurity_res_eng_0316.pdf (accessed on 11 January 2020).
  3. Martini, B.; Choo, K.K.R. Building the Next Generation of Cyber Security Professionals. In Proceedings of the 22nd European Conference on Information Systems (ECIS 2014), Tel Aviv, Israel, 9–11 June 2014. [Google Scholar]
  4. Hamari, J.; Koivisto, J.; Sarsa, H. Does Gamification Work?—A Literature Review of Empirical Studies on Gamification. In Proceedings of the 47th Hawaii International Conference on System Sciences, Waikoloa, Hawaii, 6–9 January 2014; pp. 3025–3034. [Google Scholar] [CrossRef]
  5. Cano, J.; Hernández, R.; Ros, S. Bringing an engineering lab into social sciences: Didactic approach and an experiential evaluation. IEEE Commun. Mag. 2014, 52, 101–107. [Google Scholar] [CrossRef]
  6. Cano, J.; Hernández, R.; Ros, S.; Tobarra, L. A distributed laboratory architecture for game based learning in cybersecurity and critical infrastructures. In Proceedings of the 13th International Conference on Remote Engineering and Virtual Instrumentation (REV), Madrid, Spain, 24–26 February 2016; pp. 183–185. [Google Scholar] [CrossRef]
  7. Salmerón-Manzano, E.; Manzano-Agugliaro, F. The Higher Education Sustainability through Virtual Laboratories: The Spanish University as Case of Study. Sustainability 2018, 10, 4040. [Google Scholar] [CrossRef] [Green Version]
  8. Servidio, R.; Cronin, M. PerLE: An “Open Source”, ELearning Moodle-Based, Platform. A Study of University Undergraduates’ Acceptance. Behav. Sci. 2018, 8, 63. [Google Scholar] [CrossRef] [PubMed] [Green Version]
  9. Irvine, C.; Thompson, M.; Khosalim, J. Labtainers: A Framework for Parameterized Cybersecurity Labs Using Containers; Dudley Knox Library: Monterey, CA, USA, 2017. [Google Scholar]
  10. Holden, R.; Karsh, B.T. The Technology Acceptance Model: Its Past and Its Future in Health Care. J. Biomed. Inform. 2010, 43, 159–172. [Google Scholar] [CrossRef] [PubMed] [Green Version]
  11. Venkatesh, V.; Morris, M.G.; Davis, G.B.; Davis, F.D. User Acceptance of Information Technology: Toward a Unified View. MIS Q. 2003, 27, 425–478. [Google Scholar] [CrossRef] [Green Version]
  12. Gomes, L.; Bogosyan, S. Current Trends in Remote Laboratories. IEEE Trans. Ind. Electron. 2009, 56, 4744–4756. [Google Scholar] [CrossRef]
  13. Gravier, C.; Fayolle, J.; Bayard, B.; Ates, M.; Lardon, J. State of the Art About Remote Laboratories Paradigms—Foundations of Ongoing Mutations. Int. J. Online Eng. 2008, 4, 19–25. [Google Scholar]
  14. Tawfik, M.; Sancristobal, E.; Martin, S.; Diaz, G.; Castro, M. State-of-the-art remote laboratories for industrial electronics applications. Technol. Appl. Electron. Teach. 2012, 2012, 359–364. [Google Scholar] [CrossRef]
  15. Tobarra, L.; Ros, S.; Hernández, R.; Pastor, R.; Robles-Gómez, A.; Caminero, A.C.; Castro, M. Low-Cost Remote Laboratories for Renewable Energy in Distance Education. In Proceedings of the 11th International Conference on Remote Engineering and Virtual Instrumentation (REV 2014), Porto, Portugal, 26–28 February 2014. [Google Scholar]
  16. Pastor, R.; Caminero, A.C.; Rama, D.S.; Hernández, R.; Ros, S.; Robles-Gómez, A.; Tobarra, L. Laboratories as a Service (LaaS): Using Cloud Technologies in the Field of Education. J. UCS 2013, 19, 2112–2126. [Google Scholar]
  17. Tobarra, L.; Ros, S.; Hernández, R.; Marcos-Barreiro, A.; Robles-Gómez, A.; Caminero, A.C.; Pastor, R.; Castro, M. Creation of Customized Remote Laboratories Using Deconstruction. IEEE-RITA 2015, 10, 69–76. [Google Scholar] [CrossRef]
  18. Al-Zoubi, A.; Hammad, B.; Ros, S.; Tobarra, L.; Hernández, R.; Pastor, R.; Castro, M. Remote Laboratories for Renewable Energy Courses at Jordan Universities; IEEE: Piscataway, NJ, USA, 2014; pp. 1–4. [Google Scholar]
  19. Tobarra, L.; Ros, S.; Hernández, R.; Pastor, R.; Castro, M.; Al-Zoubi, A.Y.; Hammad, B.; Dmour, M.; Robles-Gómez, A.; Caminero, A.C. Analysis of Integration of Remote Laboratories for Renewable Energy Courses at Jordan Universities; IEEE Computer Society: Piscataway, NJ, USA, 2015; pp. 1–5. [Google Scholar]
  20. Tobarra, L.; Pastor, R.; Robles-Gómez, A.; Cano, J.; Hammad, B.; Al-Zoubi, A.; Hernández, R.; Castro, M. Impact of Online Education in Jordan: Results from the MUREE Project. In Proceedings of the 2019 IEEE Global Engineering Education Conference (EDUCON), Dubai, UAE, 9–11 April 2019; pp. 306–313. [Google Scholar] [CrossRef]
  21. Shankar, B.; Sarithlal, M.; Vijayan, V.; Freeman, J.; Achuthan, K. Remote Triggered Solar Thermal Energy Parabolic Trough laboratory: Effective implementation and future possibilities for Virtual Labs. In Proceedings of the 2013 IEEE International Conference on Control Applications (CCA), Hyderabad, India, 28–30 August 2013; pp. 472–476. [Google Scholar] [CrossRef]
  22. Rao, P.; Dinesh, P.; Ilango, G.; Nagamani, C. Laboratory course on solar photovoltaic systems based on low cost equipment. In Proceedings of the 2013 IEEE International Conference in MOOC Innovation and Technology in Education (MITE), Jaipur, India, 20–22 December 2013; pp. 146–151. [Google Scholar] [CrossRef]
  23. Ros, S.; Robles-Gómez, A.; Hernández, R.; Caminero, A.C.; Pastor, R. Using Virtualization and Automatic Evaluation: Adapting Network Services Management Courses to the EHEA. IEEE Trans. Educ. 2012, 55, 196–202. [Google Scholar] [CrossRef]
  24. Bora, U.J.; Ahmed, M. E-learning using Cloud Computing. Intl. J. Sci. Mod. Eng. 2013, 1, 9–13. [Google Scholar]
  25. IBM Corporation. Cloud Computing Saves Time, Money and Shortens Production Cycle. Available online: http://www-935.ibm.com/services/in/cio/pdf/dic03001usen.pdf (accessed on 11 January 2020).
  26. Selviandro, N.; Hasibuan, Z. Cloud-Based E-Learning: A Proposed Model and Benefits by Using E-Learning Based on Cloud Computing for Educational Institution. In Information and Communication Technology; Lecture Notes in Computer Science; Springer: Berlin, Germany, 2013; Volume 7804. [Google Scholar]
  27. Caminero, A.C.; Ros, S.; Hernández, R.; Robles-Gómez, A.; Tobarra, L.; Granjo, P.J.T. VirTUal remoTe labORatories Management System (TUTORES): Using Cloud Computing to Acquire University Practical Skills. IEEE Trans. Learn. Technol. 2016, 9, 133–145. [Google Scholar] [CrossRef]
  28. Sianipar, J.H.; Willems, C.; Meinel, C. A Container-Based Virtual Laboratory for Internet Security e-Learning. Int. J. Learn. Teach. 2016, 2. [Google Scholar] [CrossRef] [Green Version]
  29. Tobarra, L.; Robles-Gómez, A.; Pastor, R.; Hernández, R.; Cano, J.; López, D. Web of Things Platforms for Distance Learning Scenarios in Computer Science Disciplines: A Practical Approach. Technologies 2019, 7, 17. [Google Scholar] [CrossRef] [Green Version]
  30. Tobarra, L.; Robles-Gómez, A.; Pastor, R.; Hernández, R.; Duque, A.; Cano, J. A Cybersecurity Experience with Cloud Virtual-Remote Laboratories. Proceedings 2019, 31, 1003. [Google Scholar] [CrossRef] [Green Version]
  31. EVE-ND, Emulated Virtual Environment—Next Generation. Available online: http://www.eve-ng.net/index.php/downloads/eve-ng (accessed on 11 January 2020).
  32. Fernández-Caramés, T.M.; Fraga-Lamas, P. Towards Next Generation Teaching, Learning, and Context-Aware Applications for Higher Education: A Review on Blockchain, IoT, Fog and Edge Computing Enabled Smart Campuses and Universities. Appl. Sci. 2019, 9, 4479. [Google Scholar] [CrossRef] [Green Version]
  33. Robles-Gómez, A.; Tobarra, L.; Pastor, R.; Hernández, R.; Duque, A.; Cano, J. Analyzing the Students’ Learning Within a Container-based Virtual Laboratory for Cybersecurity. In Proceedings of the Seventh International Conference on Technological Ecosystems for Enhancing Multiculturality, León, Spain, 16–18 October 2019; pp. 275–283. [Google Scholar] [CrossRef]
  34. Scheffel, M.; Drachsler, H.; Stoyanov, S.; Specht, M. Quality Indicators for Learning Analytics. Educ. Technol. Soc. 2014, 17, 117–132. [Google Scholar]
  35. Cruz-Benito, J.; Sánchez-Prieto, J.C.; Therón, R.; García-Peñalvo, F.J. Measuring Students’ Acceptance to AI-Driven Assessment in eLearning: Proposing a First TAM-Based Research Model. In Learning and Collaboration Technologies. Designing Learning Experiences; Zaphiris, P., Ioannou, A., Eds.; Springer International Publishing: Cham, Switzerland, 2019; pp. 15–25. [Google Scholar]
  36. Scherer, R.; Siddiq, F.; Tondeur, J. The technology acceptance model (TAM): A meta-analytic structural equation modeling approach to explaining teachers’ adoption of digital technology in education. Comput. Educ. 2019, 128, 13–35. [Google Scholar] [CrossRef]
  37. Davis, F.D. Perceived Usefulness, Perceived Ease of Use, and User Acceptance of Information Technology. MIS Q. 1989, 13, 319–340. [Google Scholar] [CrossRef] [Green Version]
  38. Halili, S.H.; Sulaiman, H. Factors influencing the rural students’ acceptance of using ICT for educational purposes. Kasetsart J. Soc. Sci. 2018. [Google Scholar] [CrossRef]
  39. Chao, C.M. Factors Determining the Behavioral Intention to Use Mobile Learning: An Application and Extension of the UTAUT Model. Front. Psychol. 2019, 10, 1652. [Google Scholar] [CrossRef] [PubMed] [Green Version]
  40. Kim, S.; Lee, K.H.; Hwang, H.; Yoo, S. Analysis of the factors influencing healthcare professionals’ adoption of mobile electronic medical record (EMR) using the unified theory of acceptance and use of technology (UTAUT) in a tertiary hospital. BMC Med. Inform. Decis. Mak. 2016, 16, 12. [Google Scholar] [CrossRef] [Green Version]
  41. Bielby, W.T.; Hauser, R.M. Structural Equation Models. Annu. Rev. Sociol. 1977, 3, 137–161. [Google Scholar] [CrossRef]
  42. Liu, I.F.; Chen, M.C.; Sun, Y.S.; Wible, D.; Kuo, C.H. Extending the TAM model to explore the factors that affect Intention to Use an Online Learning Community. Comput. Educ. 2010, 54, 600–610. [Google Scholar] [CrossRef]
  43. UFW—Uncomplicated Firewall. Available online: https://help.ubuntu.com/community/UFW (accessed on 11 January 2020).
  44. TCPFlow. Available online: https://github.com/simsong/tcpflow (accessed on 11 January 2020).
  45. Shapiro, S.S.; Wilk, M.B. An Analysis of Variance Test for Normality (Complete Samples). Biometrika 1965, 52, 591–611. [Google Scholar] [CrossRef]
  46. Saura, J.R.; Reyes-Menendez, A.; Bennett, D.R. How to Extract Meaningful Insights from UGC: A Knowledge-Based Method Applied to Education. Appl. Sci. 2019, 9, 4603. [Google Scholar] [CrossRef] [Green Version]
  47. Lee, S.; Chung, J.Y. The Machine Learning-Based Dropout Early Warning System for Improving the Performance of Dropout Prediction. Appl. Sci. 2019, 9, 3093. [Google Scholar] [CrossRef] [Green Version]
  48. Ros, S.; Hernández, R.; Caminero, A.; Robles, A.; Barbero, I.; Maciá, A.; Holgado, F.P. On the use of extended TAM to assess students’ acceptance and intent to use third-generation learning management systems. Br. J. Educ. Technol. 2015, 46, 1250–1271. [Google Scholar] [CrossRef]
  49. León, J.A.M.; Cantisano, G.T.; Mangin, J.P.L. Leadership in Nonprofit Organizations of Nicaragua and El Salvador: A Study from the Social Identity Theory. Span. J. Psychol. 2009, 12, 667–676. [Google Scholar] [CrossRef]
  50. Hooshyar, D.; Pedaste, M.; Yang, Y. Mining Educational Data to Predict Students’ Performance through Procrastination Behavior. Entropy 2019, 22, 12. [Google Scholar] [CrossRef] [Green Version]
Figure 1. Network Structure.
Applsci 10 01091 g001
Figure 2. UTAUT structural model and hypotheses (H1, H2, H3, H4, H5).
Applsci 10 01091 g002
Figure 3. Website of the Plant.
Applsci 10 01091 g003
Figure 4. Network Containers Deployed with Docker (corresponding to the Network Structure Represented in Figure 1).
Applsci 10 01091 g004
Figure 5. Docker Configuration File for the Network Structure (corresponding to the Network Structure Represented in Figure 1).
Applsci 10 01091 g005
Figure 6. Starting/Stopping the Network of Containers.
Applsci 10 01091 g006
Figure 7. Working with the Firewall.
Applsci 10 01091 g007
Figure 8. Checking the Network Configuration.
Applsci 10 01091 g008
Figure 9. Indicators’ Values for both Academic Years 2017-2018 and 2018-2019.
Applsci 10 01091 g009
Figure 10. SEMs for the LoT@UNED and CVL Technologies with the UTAUT model. (a) Influence of Hypotheses with LoT@UNED (Academic Year 2017–2018) (b) Influence of Hypotheses with CVL (Academic Year 2018–2019).
Applsci 10 01091 g010aApplsci 10 01091 g010b
Figure 11. Proposed improved UTAUT model for the CVL Technology. (a) Hypotheses (H1, H3, H5, H6, H7) (b) Influence among Factors.
Applsci 10 01091 g011
Figure 12. Histogram Graphs for the Number of Accesses to the Evaluation Resources. (a) 2017–2018 (b) 2018–2019
Applsci 10 01091 g012
Figure 13. Histogram Graphs for the Number of Sessions using the Evaluation Resources. (a) 2017–2018 (b) 2018–2019.
Applsci 10 01091 g013
Figure 14. Histogram Graphs for the Time Spent in the Evaluation Resources. (a) 2017–2018 (b) 2018–2019.
Applsci 10 01091 g014
Figure 15. Histogram Graphs for the Number of Sessions using the Forum. (a) 2017–2018 (b) 2018–2019.
Applsci 10 01091 g015
Figure 16. Histogram Graphs for the Time spent in the Forum. (a) 2017–2018 (b) 2018–2019.
Applsci 10 01091 g016
Figure 17. Histogram Graphs for the Number of Sessions in the Contents related to the Activity. (a) 2017–2018 (b) 2018–2019.
Applsci 10 01091 g017
Figure 18. Histogram Graphs for the Time spent in the Contents related to the Activity. (a) 2017–2018 (b) 2018–2019.
Applsci 10 01091 g018
Table 1. Summary of Demographic Data.
Demographic 2017–2018 (%)2018–2019 (%)
GenderMale89.15%89.47%
Female10.85%10.53%
Age Group≤30 years30.23%18.43%
30–40 years42.64%36.84%
40–50 years24.03%36.84%
≥50 years3.10%7.89%
FamiliarityVery unfamiliar28.68%18.42%
withUnfamiliar18.60%15.79%
CybersecurityNeutral24.03%28.95%
Familiar12.41%23.68%
Very Familiar16.28%13.16%
Table 2. Obtained values for both Academic Years 2017–2018 and 2018–2019.
Academic YearPUEEASIEAIU
2017–20183.934.134.113.673.404.04
2018–20194.453.894.513.894.034.37
Table 3. Results with a Five-Point Liker-Type Scale from the Survey for Academic Year 2017–2018  [29].
IndicatorStrongly AgreeAgreeNeutralDisagreeStrongly Disagree
PU33.33%44.96%15.50%5.43%0.78%
EE47.29%28.68%16.28%6.98%0.78%
A47.29%31.01%16.28%4.65%0.78%
SI17.05%35.66%42.64%4.65%0.00%
EA5.43%48.84%38.76%6.98%0.00%
IU47.29%26.36%14.73%10.08%1.55%
Table 4. Results with a Five-Point Liker-Type Scale from the Survey for Academic Year 2018–2019.
IndicatorStrongly AgreeAgreeNeutralDisagreeStrongly Disagree
PU57.9%39.5%2.6%0.0%0.0%
EE26.3%52.6%13.2%5.3%2.6%
A68.4%23.7%7.9%0.0%0.0%
SI21.2%44.9%31.2%2.7%0.0%
EA31.3%58.0%8.0%2.7%0.0%
IU55.1%28.8%13.4%2.7%0.0%

