1. Introduction
Learning Analytics (LA) is defined in [
1] as the measurement, collection, analysis, and reporting of data about learners and their contexts in order to understand and optimize the learning process and its environments. The use of LA provides many advantages such as carrying out data mining in education and also helping lecturers to optimize their teaching as they obtain current and actual feedback of each student’s learning process. Therefore, by analyzing data from both Student Institutional System (SISs) or Learning Management System (LMSs), information about the students’ interaction is gathered. Such data allow lecturers to identify patterns that point out if a resource is adequate or if the learning outcomes can be achieved.
According to recent literature, LA research is widely applied to estimate academic results. In particular, in [
2], the students’ probability to pass or fail a course was determined. By employing predictive analytics, those students whose chances to pass a subject were lower could be identified, so an intervention could be adapted in order to mitigate the academic failure. In other words, the impact on education was truly positive. However, these methods depend on the field where they are applied, the sample features, or the data source [
3], as well as what has an influence on the obtained accuracy. In existing methodologies that use learning algorithms, the quality data are an essential requirement; such a drawback avoids detecting the influence of different features on academic success, as well as designing a ready-to-use tool that can be applied in general.
On the contrary, the Module Evaluator (MoEv) tool presented in [
4,
5] handled these problems by evaluating different parametric and non-parametric learning algorithms, automatically identifying the more accurate one for a specific problem. MoEv follows the methodology proposed in [
6], but it appends a crucial step so as to generalize models: the feature extraction is done automatically by choosing the most discriminant variables. In order to design a general tool that makes it possible to analyze any data source, the first stage is to identify the most valuable information for the model. Usually, predictive models on education consider data sources such as SISs [
7], the trace data recorded by LMSs and other learning environments [
8], or hybrid data sources formed by a combination of them [
9].
On the other hand, the use of a Version Control System (VCS) is an indispensable skill for Information and Communications Technology (ICT) professionals and demanded by companies [
10]. Thus, it is widely used by lecturers during practical assignments so as to provide a meaningful learning experience.
In order to facilitate software development, there are specific tools that manage the code changing named version control [
11]. In this field, a version means how the product is at a certain time. Moreover, these tools usually provide version management since it is a hard task if it is done manually. Not only a VCS has to provide storage for the source code, images, or documentation, but also they can be editable, keeping a record of every performed action so as to revert changes at any time in case this is needed. This last feature is very important since it makes it possible to return an element to its previous state, which is quite common in programming. Some examples of popular VCSs are CVS, Subversion [
12], or Git [
13].
The authors aim to estimate students’ academic achievements by supervising their daily performance with VCSs. In order to do so, there are two issues with which to deal. The first one is if academic success is related to the considered variables that are computed from the students’ interaction with VCSs. The second is if it is possible to design a model that analyses those features in order to estimate the students’ success automatically.
Preliminary results of this approach were presented in [
4,
5,
14]. A proof of concept about using the features extracted from the interaction with VCSs to predict academic success was presented in [
14]. To build the prediction models, a single dataset gathered data from the Operating Systems Extension Subject of the degree in Computer Science at the University of León. Specifically, the dataset contained data from the 2016-2017 course. In [
4,
5], in order to build more accurate predictions models, the authors used two different datasets also gathering data from the Operating Systems Extension Subject. The first dataset, which contained data from the 2016-2017 course, was used to fit and test the models. The second one, which contained data from the 2017-2018 course, was used to evaluate that such models ensured an optimal generalization. This subject was selected because students are required to complete a practical assignment, which implies developing software solutions so as to pass the course. In the required practical assignments of this subject, a VCS was employed to store both source code and documentation. Regarding the first issue described before, both works demonstrated that some variables related to students’ interaction with VCSs were discriminant. Relating to the second one mentioned earlier, both works presented models that allowed the prediction of students’ success by analyzing such variables. The main difference between [
4] and [
5] had to do with the contents of the datasets. In [
4], the dataset contained not only variables related to the interaction with VCSs, but also some additional variables, which increased model accuracy. In [
5], only variables related to the interaction with VCSs were used. The accuracy of the models described in [
4] was higher, but the authors considered the models presented in [
5] more interesting since they may be used to build a general and ready-to-use tool.
To ensure an optimal generalization of prediction models, the use of a much bigger dataset was proposed in [
15]. A new dataset was built not only gathering data from the Operating Systems Extension subject, but also from Computer Programming I and Computer Organization subjects. These subjects also belong to the degree in Computer Science at the University of León. As in Operating Systems Extension, students had to develop software solutions using a VCS to store both source code and documentation.
Besides the data related to the interaction with VCSs, the work in [
15] proposed including some additional variables in the dataset extracted from the source code. These were the total number of source code lines of the software solution, the number of used subroutines, or the number of variables or objects, among others. The authors considered that these variables may be used to analyze the quality of the source code and, thus, study the evolution of students’ programming skills.
In this work, the authors built new prediction models by using the dataset presented in [
15]. The new models presented a higher accuracy than the ones described in [
5] and a similar accuracy to the models in [
4]. It is important to point out that the optimized models proposed here, contrary to the models presented in [
4], ensured an optimal generalization since they just used variables related to the interaction with VCSs and their contents.
The organization of this paper is as follows:
Section 2 includes a description of the empirical evaluation of the considered classification algorithms, the experience details, the materials, and methods used;
Section 3 shows the obtained results; the discussion of the results is presented in
Section 4;
Section 5 gathers the conclusions and future work.
2. Materials and Methods
This section includes a description of all the elements used to design and evaluate models to estimate students’ academic success through their interaction with a VCSs. First, a dataset was built by gathering data from several practical assignments from subjects of the degree in Computer Science at the University of León. In order to do so, a commercial VCS was used. Then, MoEv was employed to get an optimized model. Each element is further outlined below.
2.1. Version Control System
All the considered practical assignments required the use of a VCS; in particular, a Git repository. Git follows a distributed scheme where each copy of the repository also encloses the whole change history, unlike other systems that follow the client-server models [
16]. As the repositories were public, the GitHub Classroom platform was considered so as to use the organizing functionalities that it presents and also to offer private repositories for students [
17]. GitHub is a website and service that uses the Git revision control system facilitating the development of software projects. Otherwise, GitHub Classroom provides different useful functionalities for lecturers such as task assignments for students or groups of students all in the same hosting service.
2.2. Input Data
In this paper, the considered data were extracted from the practical assignments proposed in different subjects of the Computer Science Degree at the University of León. In particular, the subjects that participated in this experience were Operating Systems Extension, Computer Programming I, and Computer Organization.
There were two subjects for first-year students: Computer Programming I and Computer Organization. In the case of Computer Programming I, it deals with the fundamentals of software programming, that is design, implementation, and testing. Therefore, students acquire the competence of designing at a certain abstract level for different algorithms and patterns. In addition to this, students learn to design and code test cases.
Computer Organization is also a first-year course, and its objectives are related to the fundamentals of computers such as datapath, control unit, memory, or input/output. In the practical lessons, students learn how to program in both C and assembler languages.
Finally, the Operating Systems Extension is a second-year course where students deal with operating systems. More specifically, students acquire knowledge about how the main memory works (volatile) and how the file system is managed (non-volatile). This subject also addresses security issues in operating systems.
The reason to select the previously mentioned subjects was that all of them involve practical assignments where students have to develop a program in a certain language. Moreover, the use of a Git repository is mandatory in order to store both source code and documentation.
Table 1 shows the number of samples for each subject.
Regarding the feature extraction, the dataset was formed as follows. Considering the practical assignments developed by students and its activity on the repository, different variables were considered:
An identifier to make students anonymous (id): it provided differentiation among the samples.
Commits counter (commits): it represented the number of commit operations made by a given student.
Number of days where at least one commit was done (days).
Average number of commit operations per day (commits/day).
Number of additional lines appended to the source code during the assignment development (additions).
Number of deleted lines removed from the source code during the assignment development (deletions).
Number of issues opened (issues-opened) during the assignment.
Number of issues closed (issues-closed) during the assignment.
In [
15], the authors proposed to collect some additional variables extracted from the source code: the total number of source code lines, the number of subroutines, the number of variables or objects, the number of classes, the number of loops, the cyclomatic complexity, the number of files, some object-oriented programming related features (i.e., inheritance and polymorphism usage), the number of README files, dependencies, etc. They also considered variables computed by the measure of the interaction with VCS. These data may be later used to analyze the quality of the source code and, thus, study the evolution of students’ programming skills. Specifically, in this work, the following additional variables were considered: the number of source code files written in C (including header files), Java, and the assembler; as well as the number of source code lines in each file.
2.3. Models Design and Evaluation
In this work, the MoEv tool was employed in order to achieve the model that performed the best prediction. The followed methodology was presented in [
4,
5].
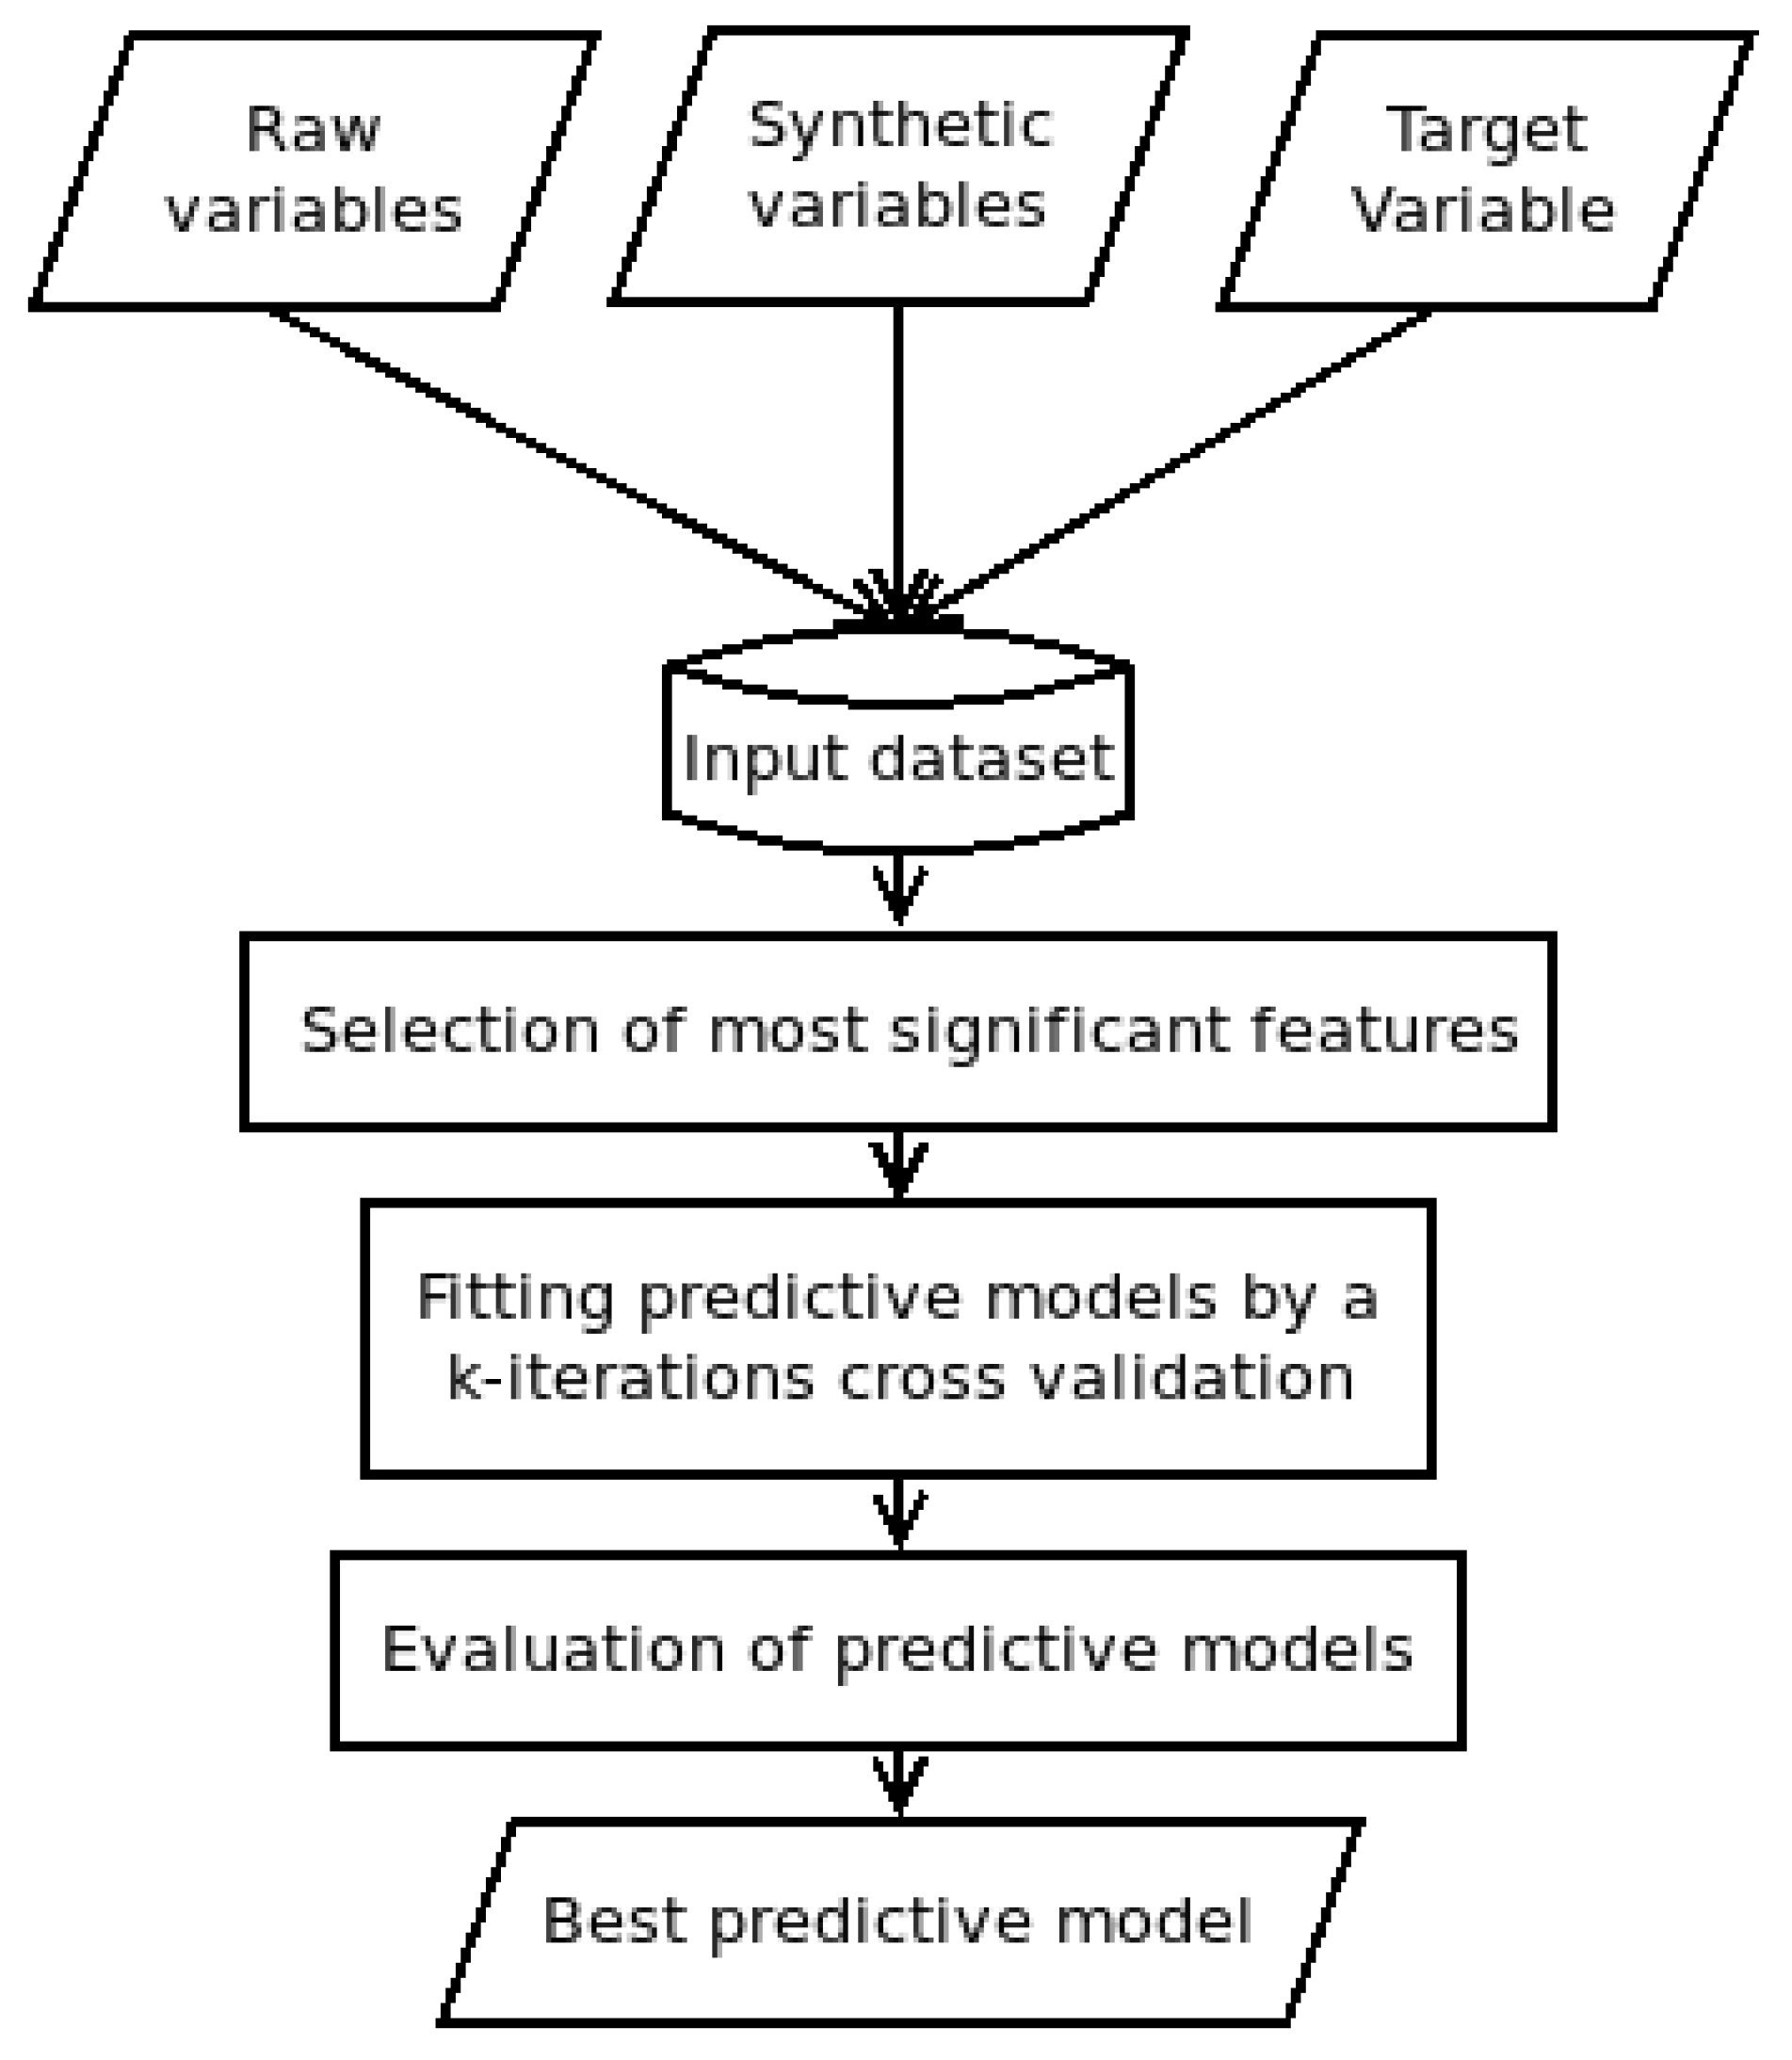
Figure 1 shows a scheme of the applied methodology.
The feature vector of each sample was formed by two kinds of variables. One type was those variables extracted from raw data given by an SIS or an LMS directly. In this work, the feature vector had the following raw data elements: id, commits, additions, deletions, issues-opened, and issues-closed. In addition to this, source code metrics also are considered as raw data. Besides raw data, there were synthetic data represented by the following variables: days (number of days with at least a commit operation) and commits/day (average commit operations per day).
Once the feature vector was built, a target variable (class) was included. That was a component that determined the class to which a certain feature vector belonged. This class element allowed the model to train and test the supervised learning procedure. The considered target was a binary variable with a Pvalue if a given student will pass the course and a Fvalue if a given student will fail.
Following the methodology shown in
Figure 1, after collecting the data step, those features that were more significant had to be identified so as to obtain a classification model that assessed the target variable. This stage, named feature selection, was a procedure that determined the contribution of each feature, identifying the higher influences when a classification or prediction was done. By performing a feature selection before building the model, the overfitting was reduced, improving the accuracy and, therefore, the training time.
According to the scores presented in [
14], the tree-base algorithm achieved good rates for the database considered in this paper. Thus, the feature selection was computed by employing an extremely randomized tree [
18]. The decision criterion to select a feature was based on the value of the Gini coefficient (
) computed for each feature; if
was higher than a certain threshold, the feature was then significant; in this paper, the threshold value was fixed to 0.1, obtained empirically.
After the feature selection, several prediction models were fitted. We used 80% of the input data to train the models and 20% to test them. The following Machine Learning (ML) algorithms were considered since they are well-known in this field:
Adaptive Boosting (AB). Ensemble methods are techniques that combine different basic classifiers turning a weak learner into a more accurate method. Boosting is one of the most successful types of ensemble methods and AB one of the most popular boosting algorithms.
Classification And Regression Tree (CART). A decision tree is a method that predicts the label associated with an instance by traveling from a root node of a tree to a leaf [
19]. It is a non-parametric method in which the trees are grown in an iterative, top-down process.
K-Nearest Neighbors (KNN). Although the nearest neighbor concept is the foundation of many other learning methods, notably unsupervised, supervised neighbor-based learning is also available to classify data with discrete labels. It is a non-parametric technique that classifies new observations based on the distance to the observation in the training set. A good presentation of the analysis was given in [
20,
21].
Linear Discriminant Analysis (LDA). This is a parametric method that assumes that distributions of the data are multivariate Gaussian [
21]. Furthermore, LDA assumes knowledge of population parameters. In another case, the maximum likelihood estimator can be used. LDA uses Bayesian approaches to select the category, which maximizes the conditional probability; see [
22,
23,
24].
Logistic Regression (LR). Linear methods are intended for regressions in which the target value is expected to be a linear combination of the input variables. LR, despite its name, is a linear model for classification rather than regression. In this model, the probabilities describing the possible outcomes of a single trial are modeled using a logistic function.
Multi-Layer Perceptron (MLP). An artificial neural network is a model inspired by the structure of the brain. Neural networks are used when the type of relationship between inputs and outputs is not known. The network is organized into layers of nodes (an input layer, an output layer, and one or more hidden layers). These layers are organized in a directed graph so that each layer is fully connected to the next one. An MLP is a modification of the standard linear perceptron whose best characteristic is that it is able to distinguish data that are not linearly separable. An MLP uses back-propagation for training the network; see [
25,
26].
Naive Bayes (NB). This method is based on applying Bayes’ theorem with the “naive” assumption of independence between every pair of features; see [
21,
27].
Random Forest (RF). This is a classifier consisting of a collection of decision trees, in which each tree is constructed by applying an algorithm to the training set and an additional random vector that is sampled via bootstrap re-sampling [
28].
Finally, experiments were carried out with the MoEv tool that supports k-iteration cross-validation so as to identify the prediction algorithm more appropriate for a given problem. To perform it, MoEv calculated a set of well-known Key Performance Indicator (KPIs). Each model performance was measured by considering the accuracy of classification (see Equation (
1)):
being the number of students who pass the course and the model predicts so (true positives) and the number of students who do not pass the course and the model predicts so (true negatives).
The three models with the highest accuracy classification score were pre-selected for in-depth evaluation by considering the following KPIs: Precision (P), Recall (R), and F1-score obtained through the confusion matrix.
The Precision (P) is computed as follows (Equation (
2)):
being the number of students who do not pass the course and the model says they pass (false positives).
The Recall (R) is defined in Equation (
3), where
is the number of students who pass the course and the model says they fail (false negatives):
The
-score relates those metrics since it is the harmonic mean of precision and recall, as shown in Equation (
4).
4. Discussion
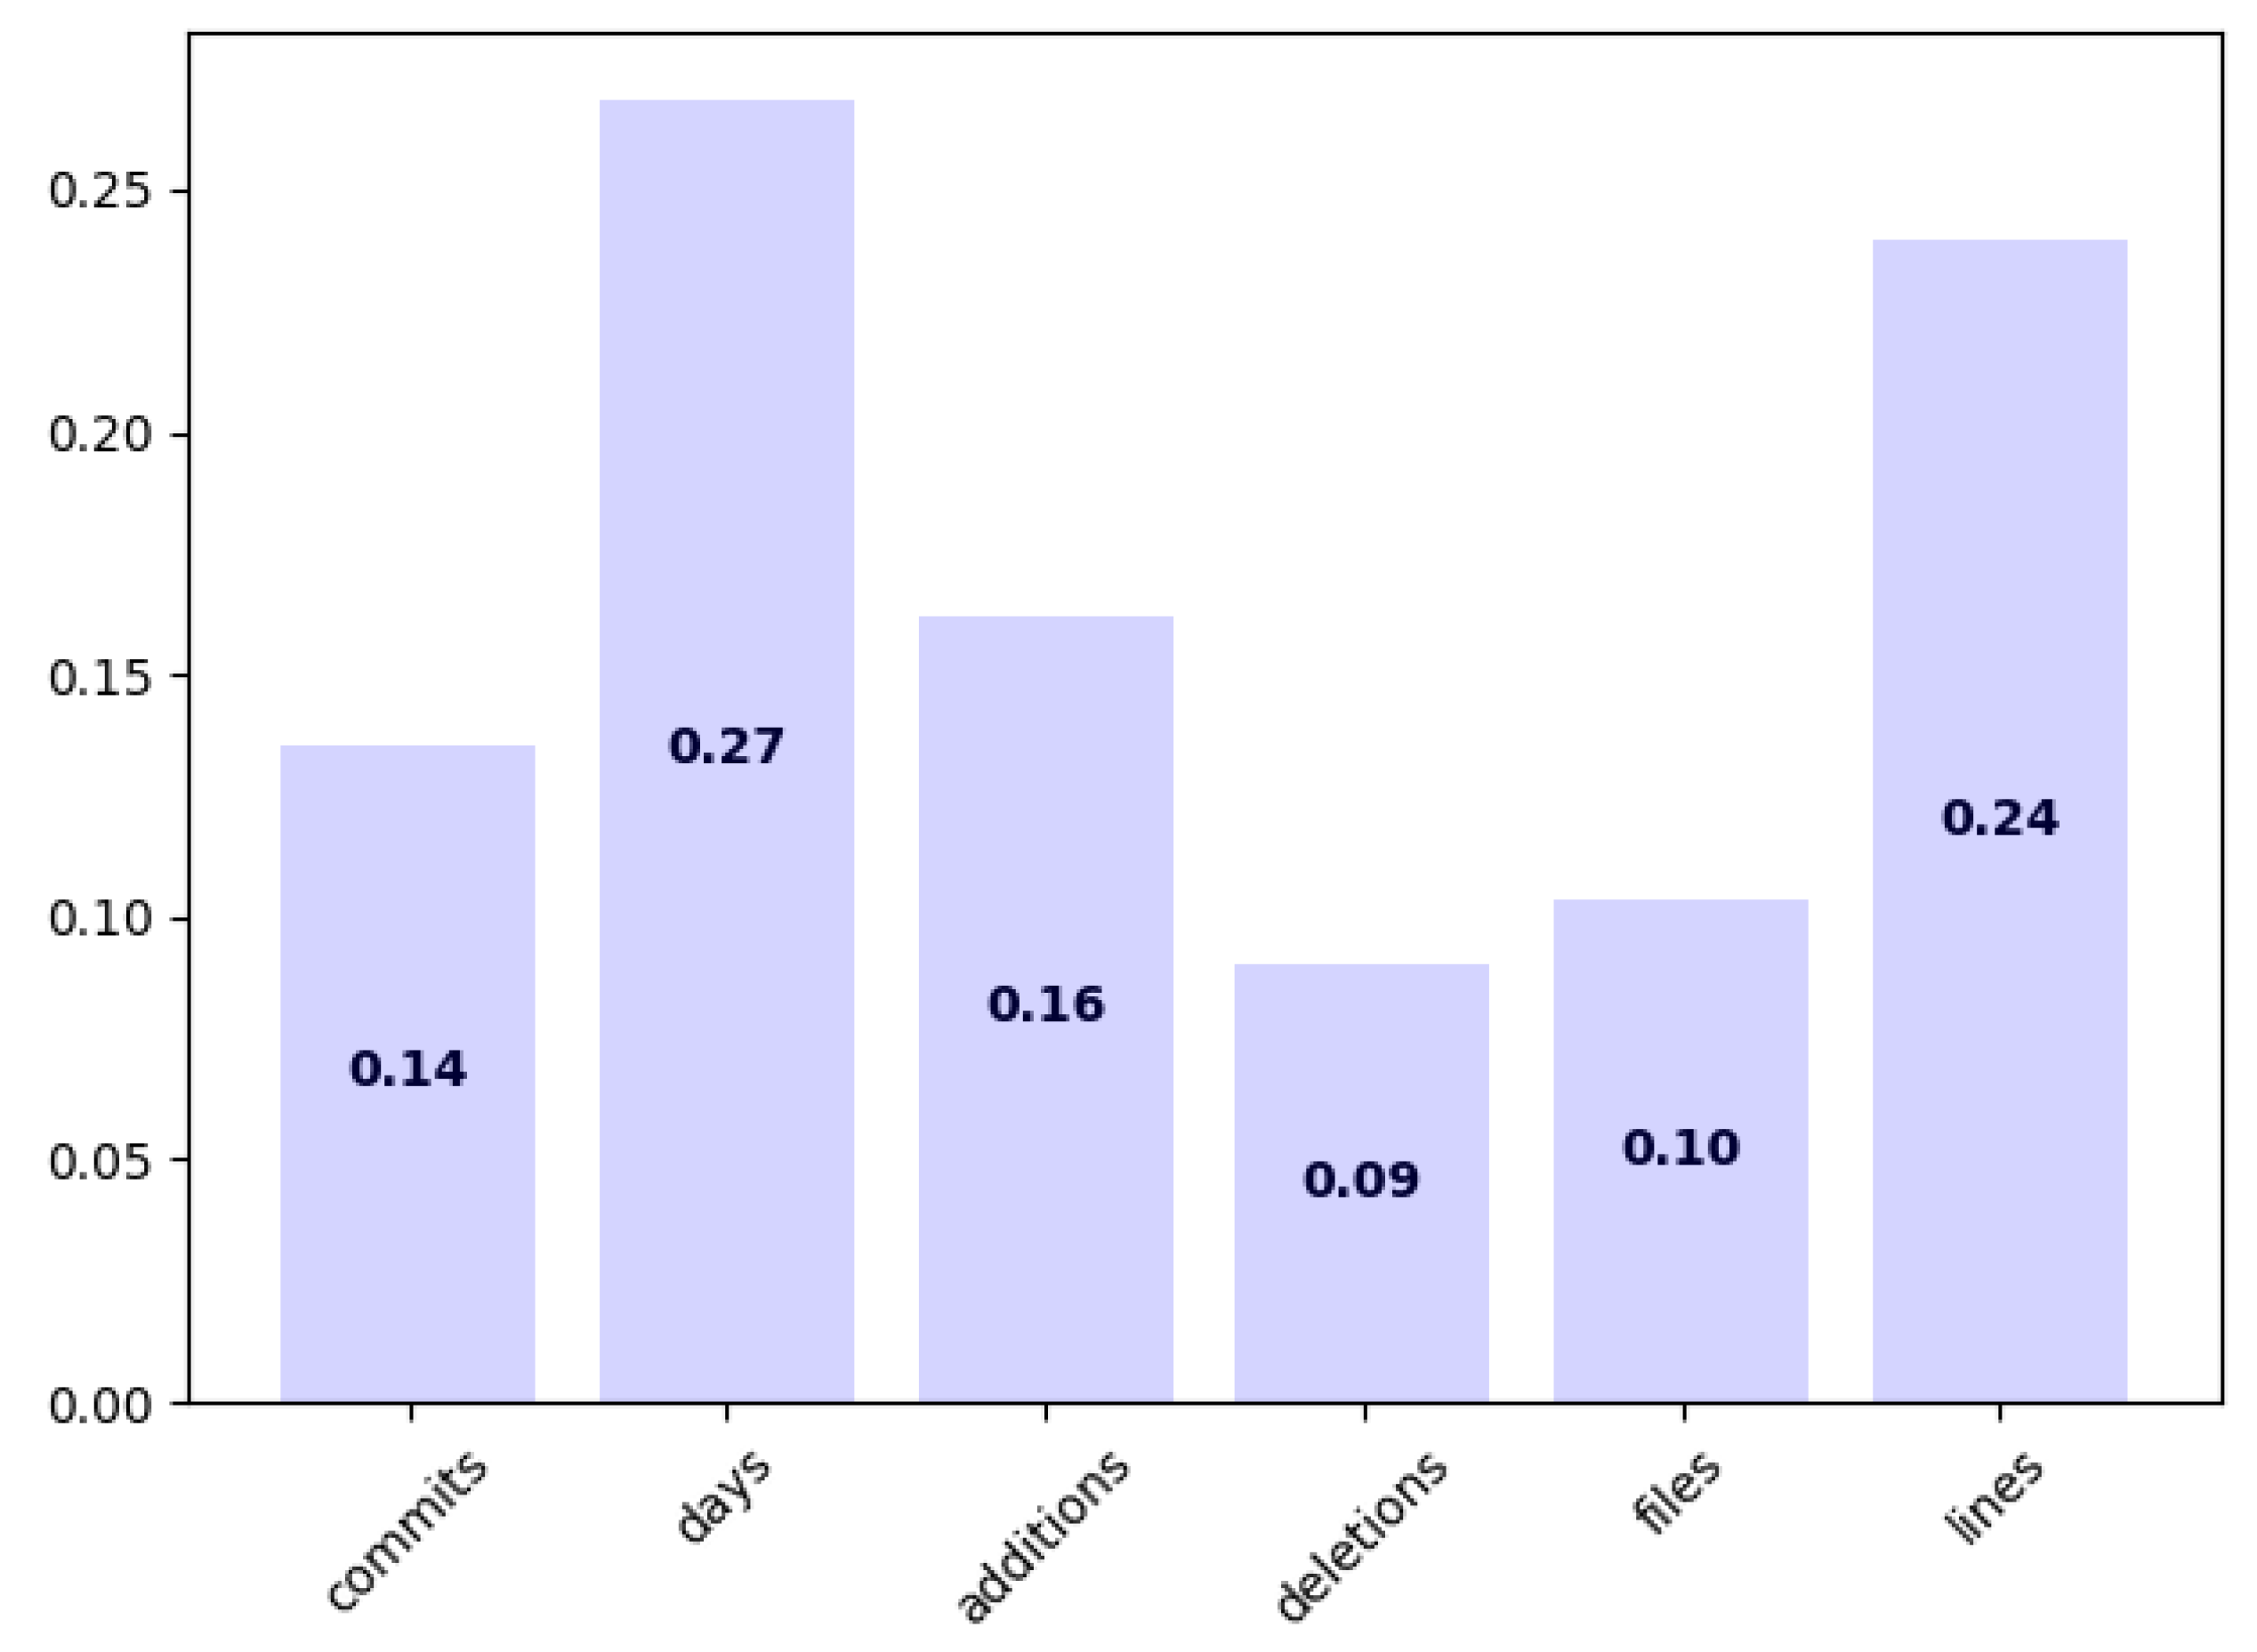
Feature importance in
Figure 2 showed that the number of days with at least one commit operation (days) was the most discriminant feature (
). This is logical since working in a software solution usually implies different phases and milestones. A low value in this feature points out that the student had not achieved the expected milestones. In addition to this, the number of days with at least one commit operation had higher importance than the number of commit operations itself; this had to do with the fact that several milestones usually cannot be achieved the same day. Having multiple commit operations the same day usually means that students are using several commit operations for a single milestone. This may happen if there are unexpected errors due to untested software or even that the students are trying to cheat the model.
The next discriminant feature was the number of source code lines (
). This allowed us to assert that the contents of a repository may be quite useful to predict academic success. Including more additional features such as the ones proposed in [
15] in addition to the number of files and lines may result in higher accuracy. However, it is important to point out that this requires a static analysis of the source code. This analysis is different for each programming language, so it complicates considerably the data collection, although programming paradigms are quite common between languages. This is an important drawback since data collection is actually quite complicated and time demanding. However, the number of programming languages that are used during the Computer Science degree is not so high, so the method presented in this paper can be easily adapted to other subjects.
Regarding the models’ accuracy, RF, KNN, and AB had the highest scores, as shown in
Table 2. RF was also the model with the highest accuracy score in [
5].
Table 4 shows the complete comparison between the accuracy scores obtained in this work shown in
Table 2 and the accuracy scores obtained in [
5]. The first line at
Table 4 shows the accuracy score obtained in this work. The second line shows the accuracy scores obtained in [
5]. It is important to point out that all models increased their accuracy scores. This was due to the fact that in this work, the training dataset was much bigger and complete (since it included data from several subjects) compared to the dataset used in [
5]. In addition, considering additional significant features also implied an accuracy improvement.
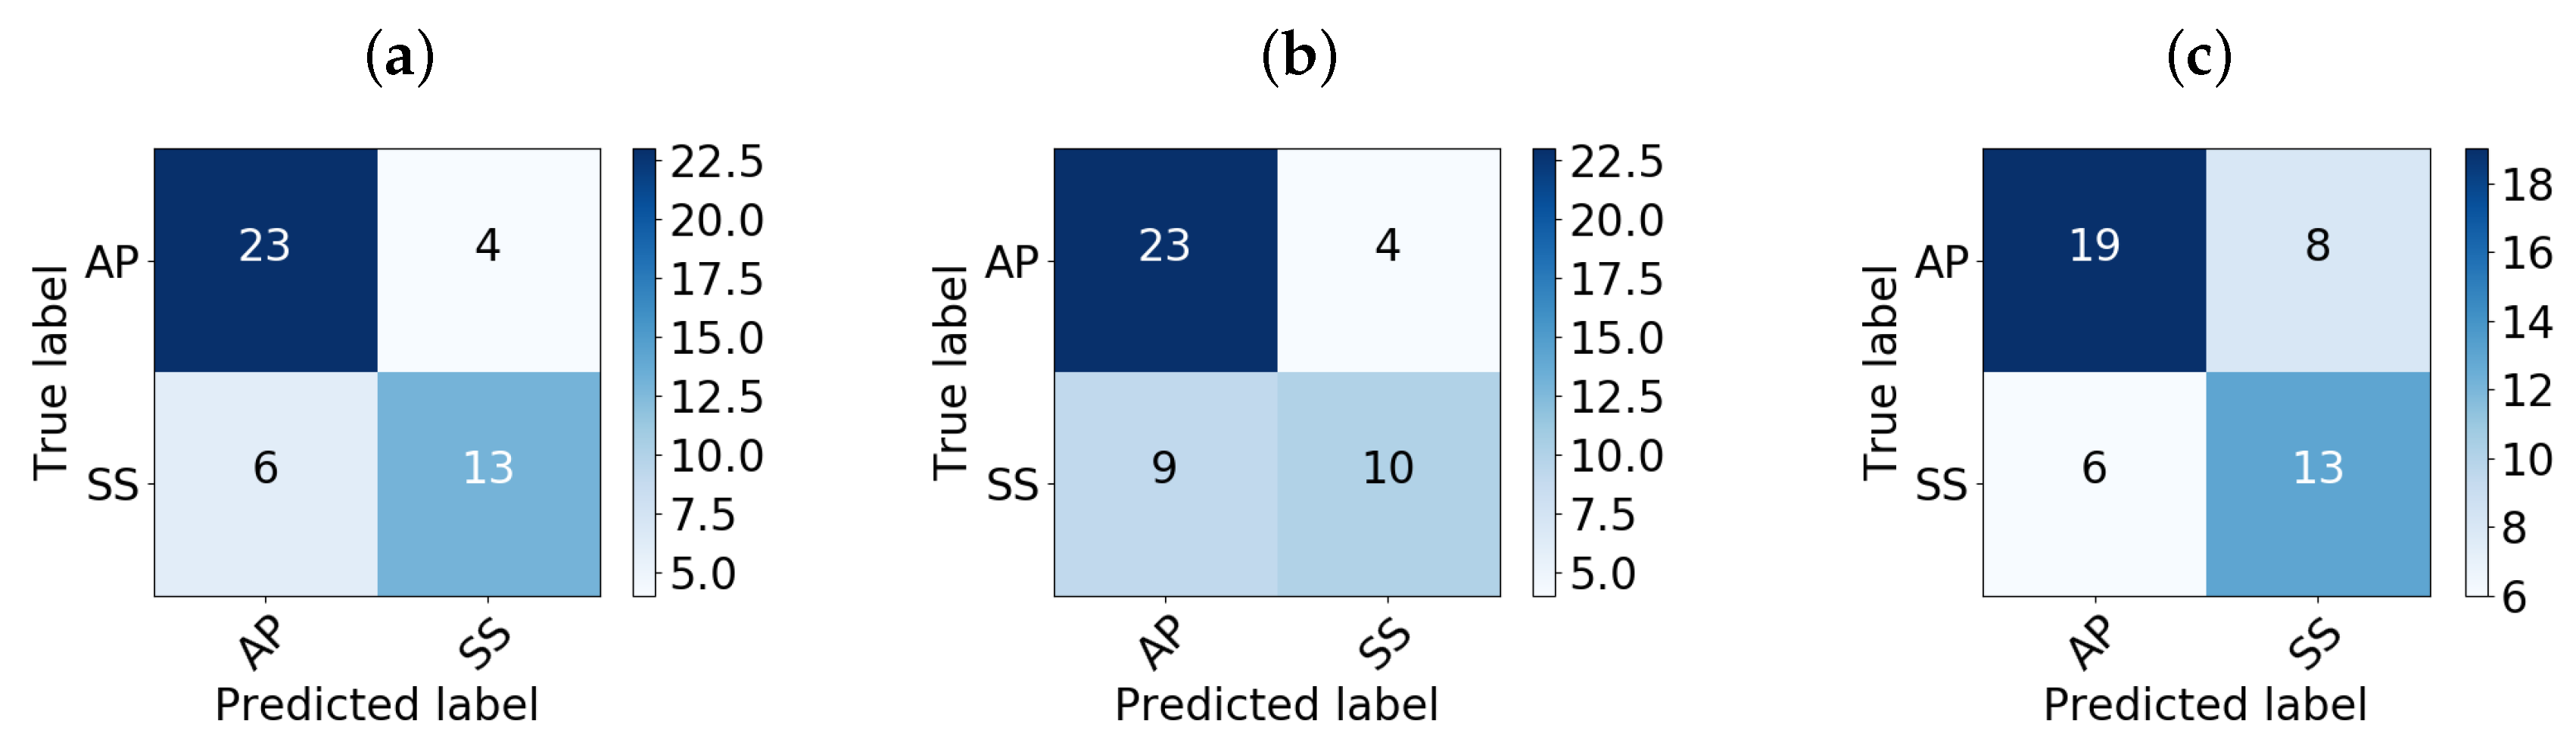
Finally, considering the most accurate models, i.e., RF, KNN, and AB, a deeper analysis through their confusion matrices was given in order to analyze their sensitivity for detecting Ps: i.e., the rate of true Ps that the model classified incorrectly.
Figure 3 and
Table 3 show that the RF classifier obtained better values for precision (P), recall (R), and
-score than KNN and AB in both the test and validation stages.
5. Conclusions
The methodology presented in this paper allowed lecturers to predict the results students achieved by supervising their daily performance using a VCS. The employed models were fitted by using a dataset that gathered data from different subjects of the Computer Science degree at the University of León. All the considered subjects had two common items: all of them required students to develop software solutions and to use a VCS for storing source code and documentation.
The dataset included variables from the students’ interaction with VCSs such as the number of commit operations, source code lines added and deleted, etc. In addition, the dataset included data related to the contents of students’ repositories such as the number of source code files and lines. These additional variables, although not coming from the interaction with VCS, were source code features; thus, the models ensured an optimal generalization.
The results presented in
Section 3 and discussed in
Section 4 demonstrated that the models’ accuracy scores increased by using a bigger dataset, not only including additional variables, but also much more samples. The accuracy was also similar to the results obtained with models trained with datasets containing specific features, and thus, and contrary to these models, the ones proposed in this paper ensured an optimal generalization.
Further works should face the usage of additional features collected within the source code itself to analyze the quality of the source code and, thus, study the evolution of students’ programming skills.

 ,
, 


