1. Introduction
Durability is one of the main requirements for building structures [
1,
2,
3,
4,
5]. In the steel and reinforced concrete structures, the steel corrosion is a direct factor that affects durability of concrete [
2,
3,
4,
5,
6,
7]. While in steel structures, corrosion protective coatings are usually visible, and the corrosion process itself is relatively easy to notice and evaluate, in reinforced concrete structures, the corrosion of the reinforcement will be undetected on the surface of concrete for many years, thus causing significant destruction and making corrosion assessment more difficult. However, there is a group of non-destructive methods that allow, in probabilistic terms, diagnosing the process of reinforcement corrosion in a structural element [
6,
7,
8,
9,
10,
11,
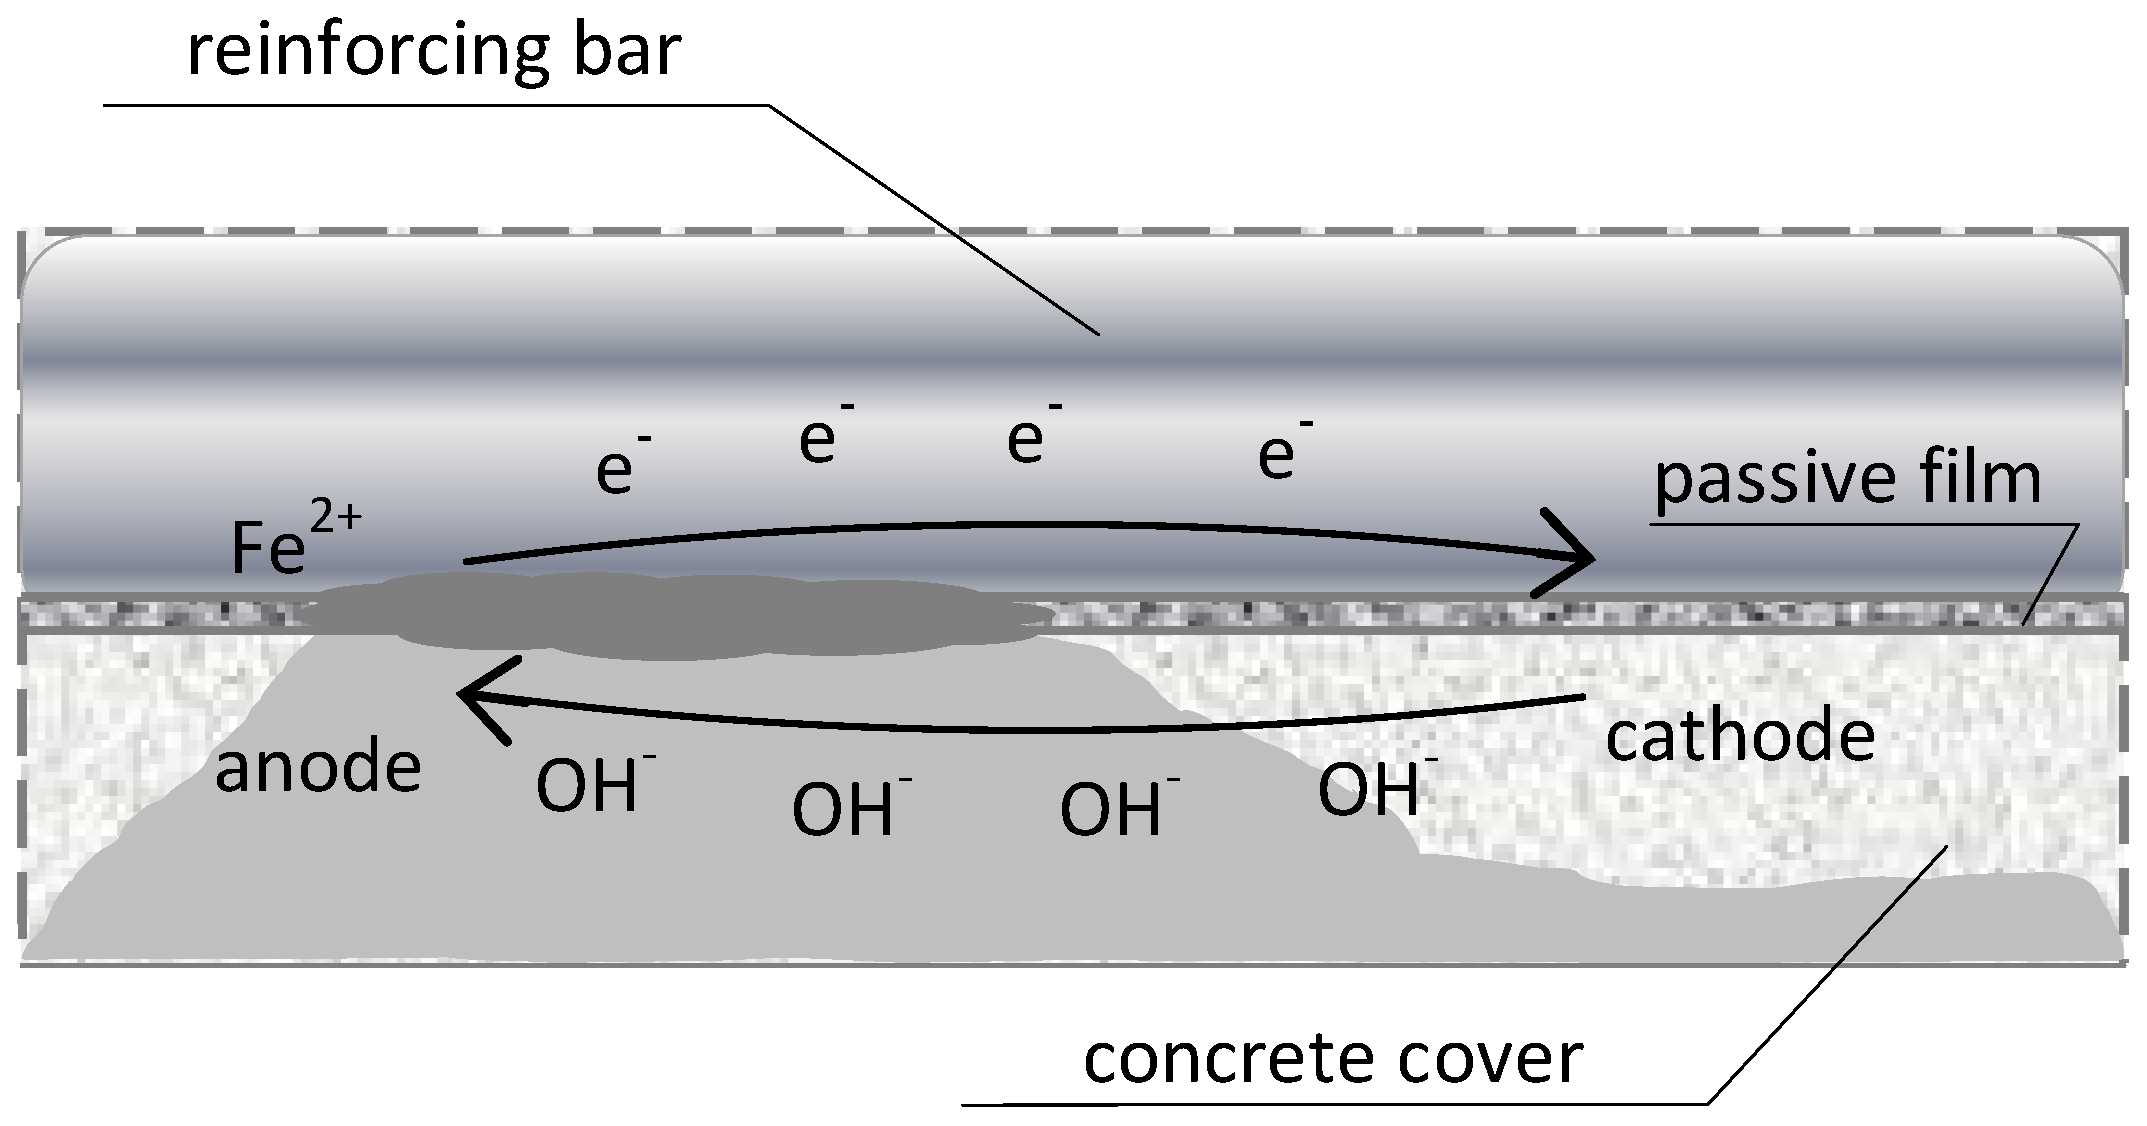
12]. These are electrochemical methods that utilize the physico-chemical properties of concrete and steel. Small gel pores, larger capillary pores, and macro-pores form the porous structure of concrete, which form a system of interconnected channels that are filled with ion-carrying liquid. Steel reinforcing bars, on the other hand, are electron carriers. The flow of electrons between the existing local anode and cathode microcells (resulting from microdefects in steel) on the bar surface and the ion flow in the liquid filling the pores of concrete produce a kind of galvanic cell. The alkaline liquid in the pores is an electrolyte and the reinforcing bar is an electrode [
6,
13,
14,
15]. Reinforcement corrosion begins in favourable conditions, when the passive layer protecting the bar surface is damaged (usually as a result of concrete carbonation or action of chlorides), the pores are filled with liquid, and oxygen is available. The iron oxidation process occurs at the anode:
and the reduction process occurs at the cathode:
Figure 1 schematically this.
In the course of the corrosion process, iron ions react with OH
−; ions, forming iron hydroxide:
and then in the presence of oxygen:
As a result of the process, iron hydroxide is formed Fe(OH)
3 and iron oxide Fe
2O
3 are produced. The corrosion product, rust, is a mixture of Fe(OH)
3, Fe
2O
3, Fe
2O
3, H
2O, and magnetite [
2,
6,
13,
14]. The degree of reinforcing bar corrosion can be determined from Equation (1) by calculating the corrosion loss that is based on Faraday’s law:
where:
Δm–loss of weight [g],
K–electrochemical equivalent [g/A × s]
i–corrosive current strength [A], and
t–current flow time [s].
The corrosive current can be determined from Equation (2):
where:
ΔE–anode and cathode potential difference,
RK, RA–cathode and anode polarization resistance, and
RO, RZ–internal and external circuit resistance.
Equation (2) indicates that the moisture level-dependent internal resistance that inhibits ion transport is important. The diffusion is practically stopped at the moisture content below 75%.
The temperature of the tested element also affects the ion diffusion coefficient [
2,
13]. The diffusion coefficient increases with the increase in temperature (the increase rate depends on the concrete composition), as shown by the Arrhenius equation:
where:
D–diffusion coefficient at temperature T [cm2/s],
D0–diffusion coefficient at temperature T = 0,
E–activation energy of the diffusion process [kJ/mol] (dependent on w/c and type of cement),
R–gas constant (R = 8.3144598(48) [J/mol × K]), and
T–absolute temperature [K].
As a result of the electrochemical process of reinforcement corrosion in concrete, certain electrical quantities change. Stationary potential, concrete resistivity, or corrosion current density can be measured and used for the estimation of the extent of reinforcement corrosion. Measurements are made while using specialized devices and the results are analyzed against the criteria values pre-determined for a given device [
6,
12,
16,
17,
18,
19,
20,
21,
22,
23,
24,
25,
26,
27,
28,
29,
30,
31,
32]
The galvanostatic pulse method (GPM) is one of the methods used for this purpose [
21,
22,
23,
24,
25,
26,
27,
28,
29,
30,
31,
32]. It is a non-destructive polarization technique that allows for measurements of the reinforcement stationary potential on the concrete surface (E
st), concrete cover resistivity (Θ), and corrosion current density (i
cor). The measurements of the reinforcement stationary potential and the concrete cover resistivity are called basic measurements. It should be noted that the values of the reinforcement stationary potential and the concrete cover resistivity are only estimates of the probability of reinforcement corrosion risk in the investigated areas, and the measurement results are not meaningful. Corrosive current density data, on the other hand, allow for the estimation of corrosion activity in the reinforcement and prediction of its rate over time. The dynamic equilibrium on the electrode (reinforcing bar) immersed in the electrolyte (alkaline liquid filling the pores) has to be disturbed (polarization of the reinforcement) to conduct the measurements. In the case of the galvanostatic pulse method, a current of certain intensity generates such a disturbance.
External factors, including electrolyte temperature, have some influence on the intensity of the process due to the fact that ions flow as a result of diffusion in the pore liquid, and thus also on the measured electrical values. As reported by Neville [
2], the diffusion coefficient (D) increases as the electrolyte temperature increases (3), which is directly related to the ion flow rate in the electrolyte and the measurement of this flow. In addition, the increase in temperature accelerates depolarization, which is important when galvanostatic pulse measurements are used. Although the galvanostatic pulse method has been used for several years [
21,
22,
23,
24,
25,
26,
27,
28,
29,
30,
31], few authors have evaluated the impact of temperature on the measurement results [
20,
23,
25,
28,
30,
31]. Most research has been devoted to the impact of environmental conditions, i.e., both temperature and moisture content. Little or no information regarding the possible correlation between the temperature of the tested element and the obtained measurement results can be found in the literature, which suggests that it is not taken into account.
The authors’ previous research [
21,
25,
28] prompted the thesis that the temperature of the tested element has a significant impact on the values of the measured parameters, which is also indicated by the physico-chemical nature of the reinforcement corrosion process in concrete. The results of measurements that were made on the same laboratory specimen, both outdoors in winter (in temperature of about 0 °C) and indoors at room temperature (about 23 °C), varied noticeably [
25,
28]. Similar observations of differences in the corrosion rates between September 2000 and April 2001 were reported in [
23]. For this reason, tests were carried out on a larger number of samples under gradually changed thermal conditions. The purpose of the work was to determine an influence of the temperature of the tested element on the measurement results of three parameters: the corrosion current density, the reinforcement stationary potential, and the concrete cover resistivity. The influence of temperature on the results of potential and resistivity measurements may result in incorrect marking of areas for advanced measurements and, as a consequence, disturb corrosion risk assessment, although measurements of stationary reinforcement potential and concrete cover resistivity are less important than measurements of corrosive current density in general GPM tests. Analysis of the values of these parameters allows for the estimation of actual steel reinforcement corrosion degree.
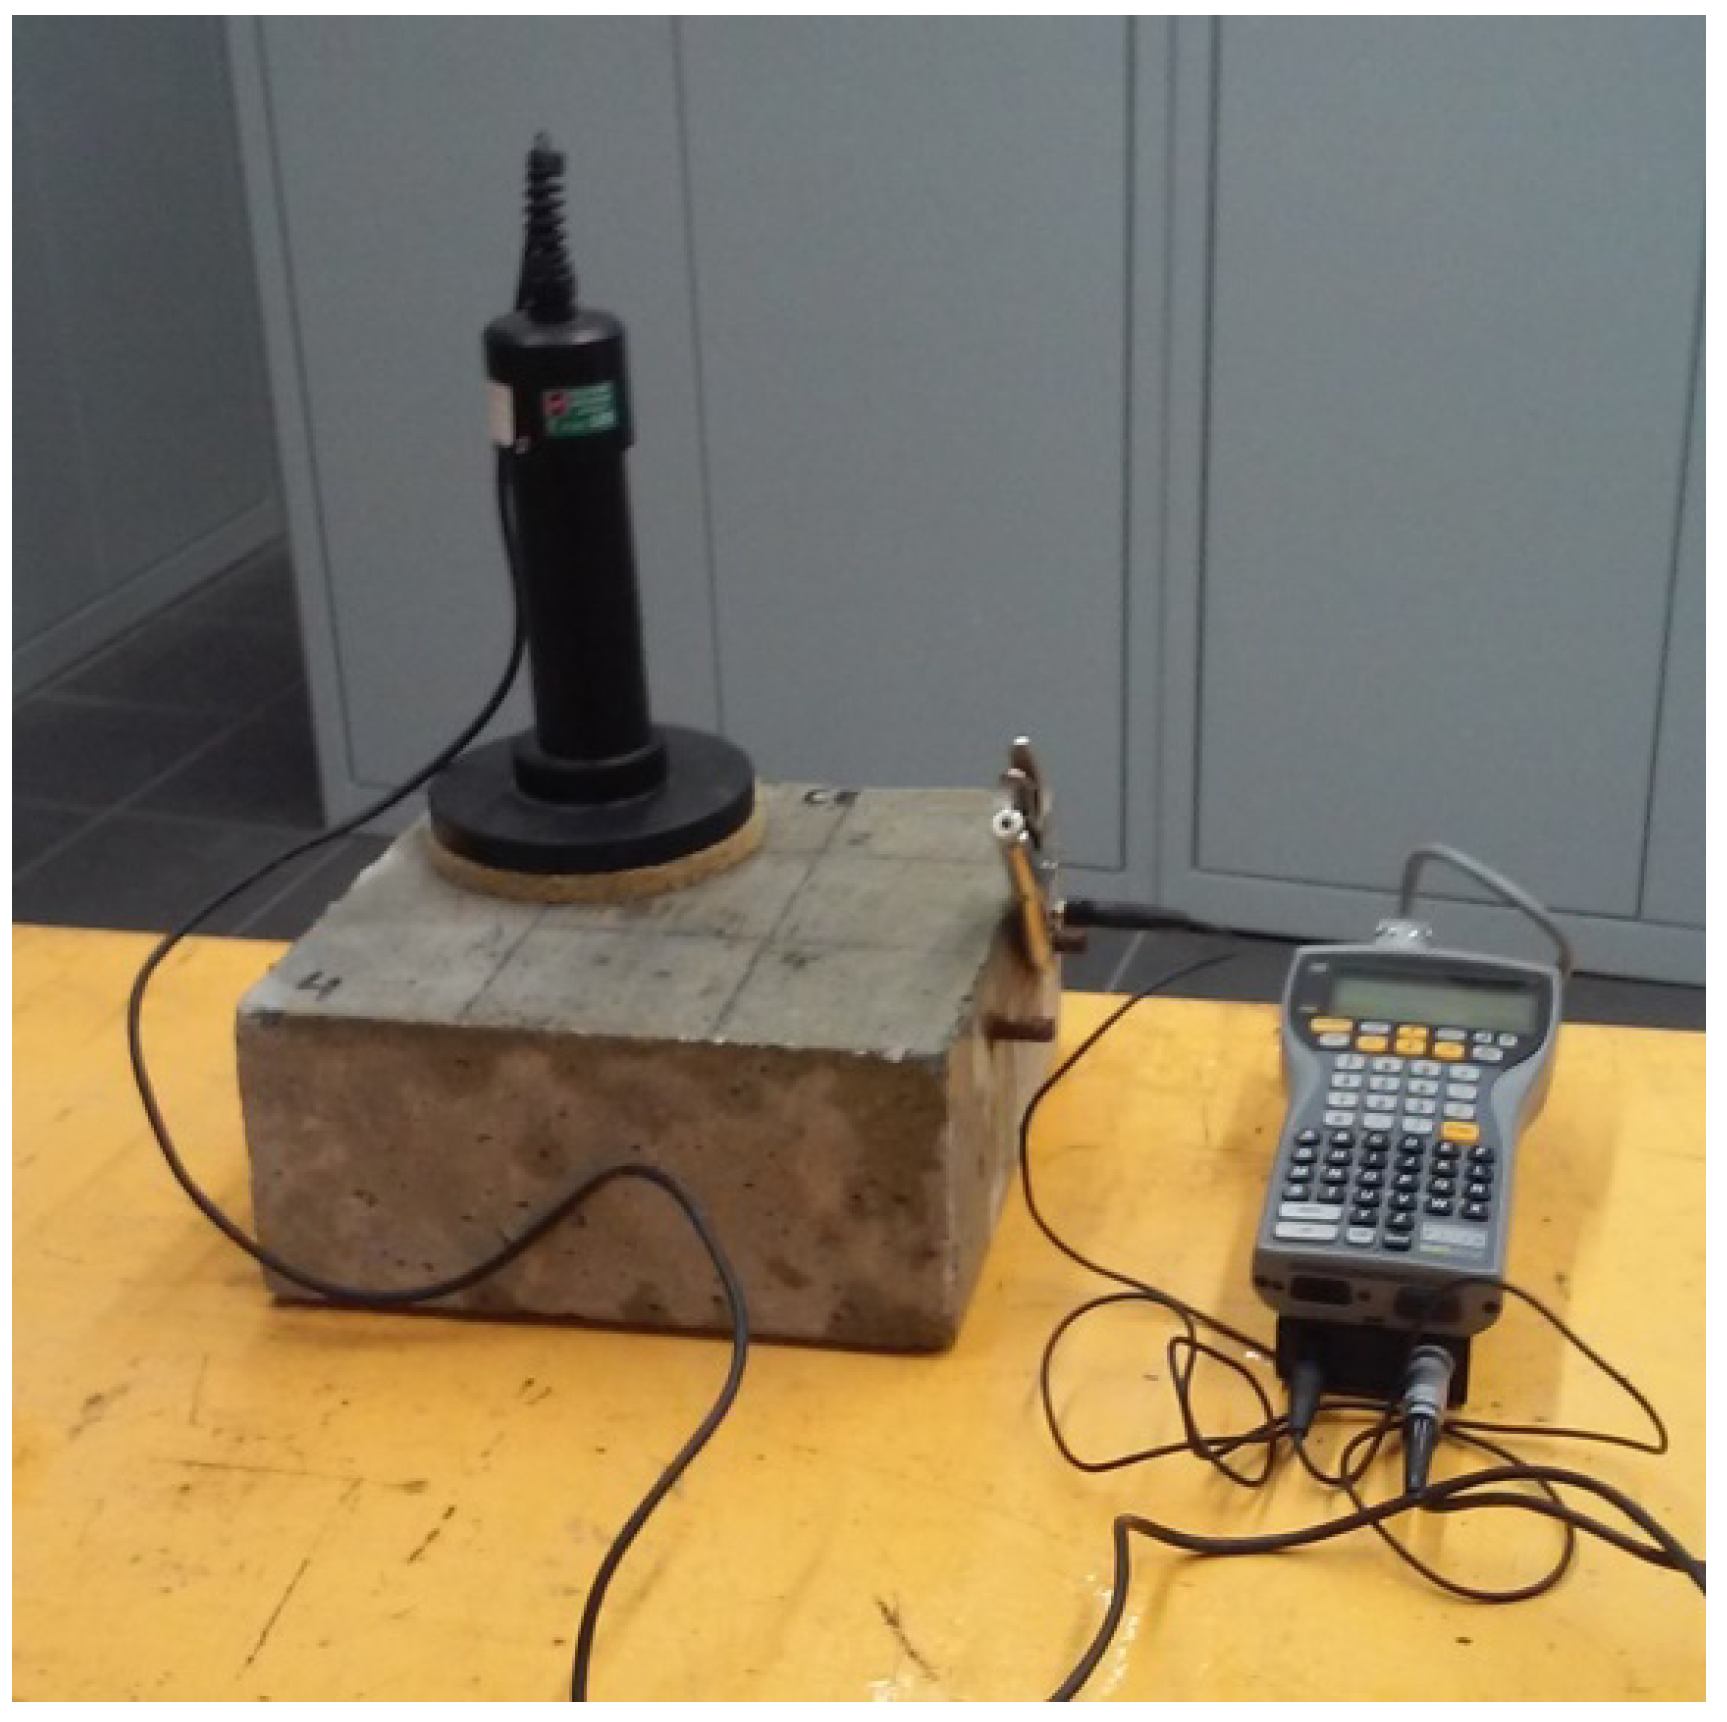
2. Measuring Device
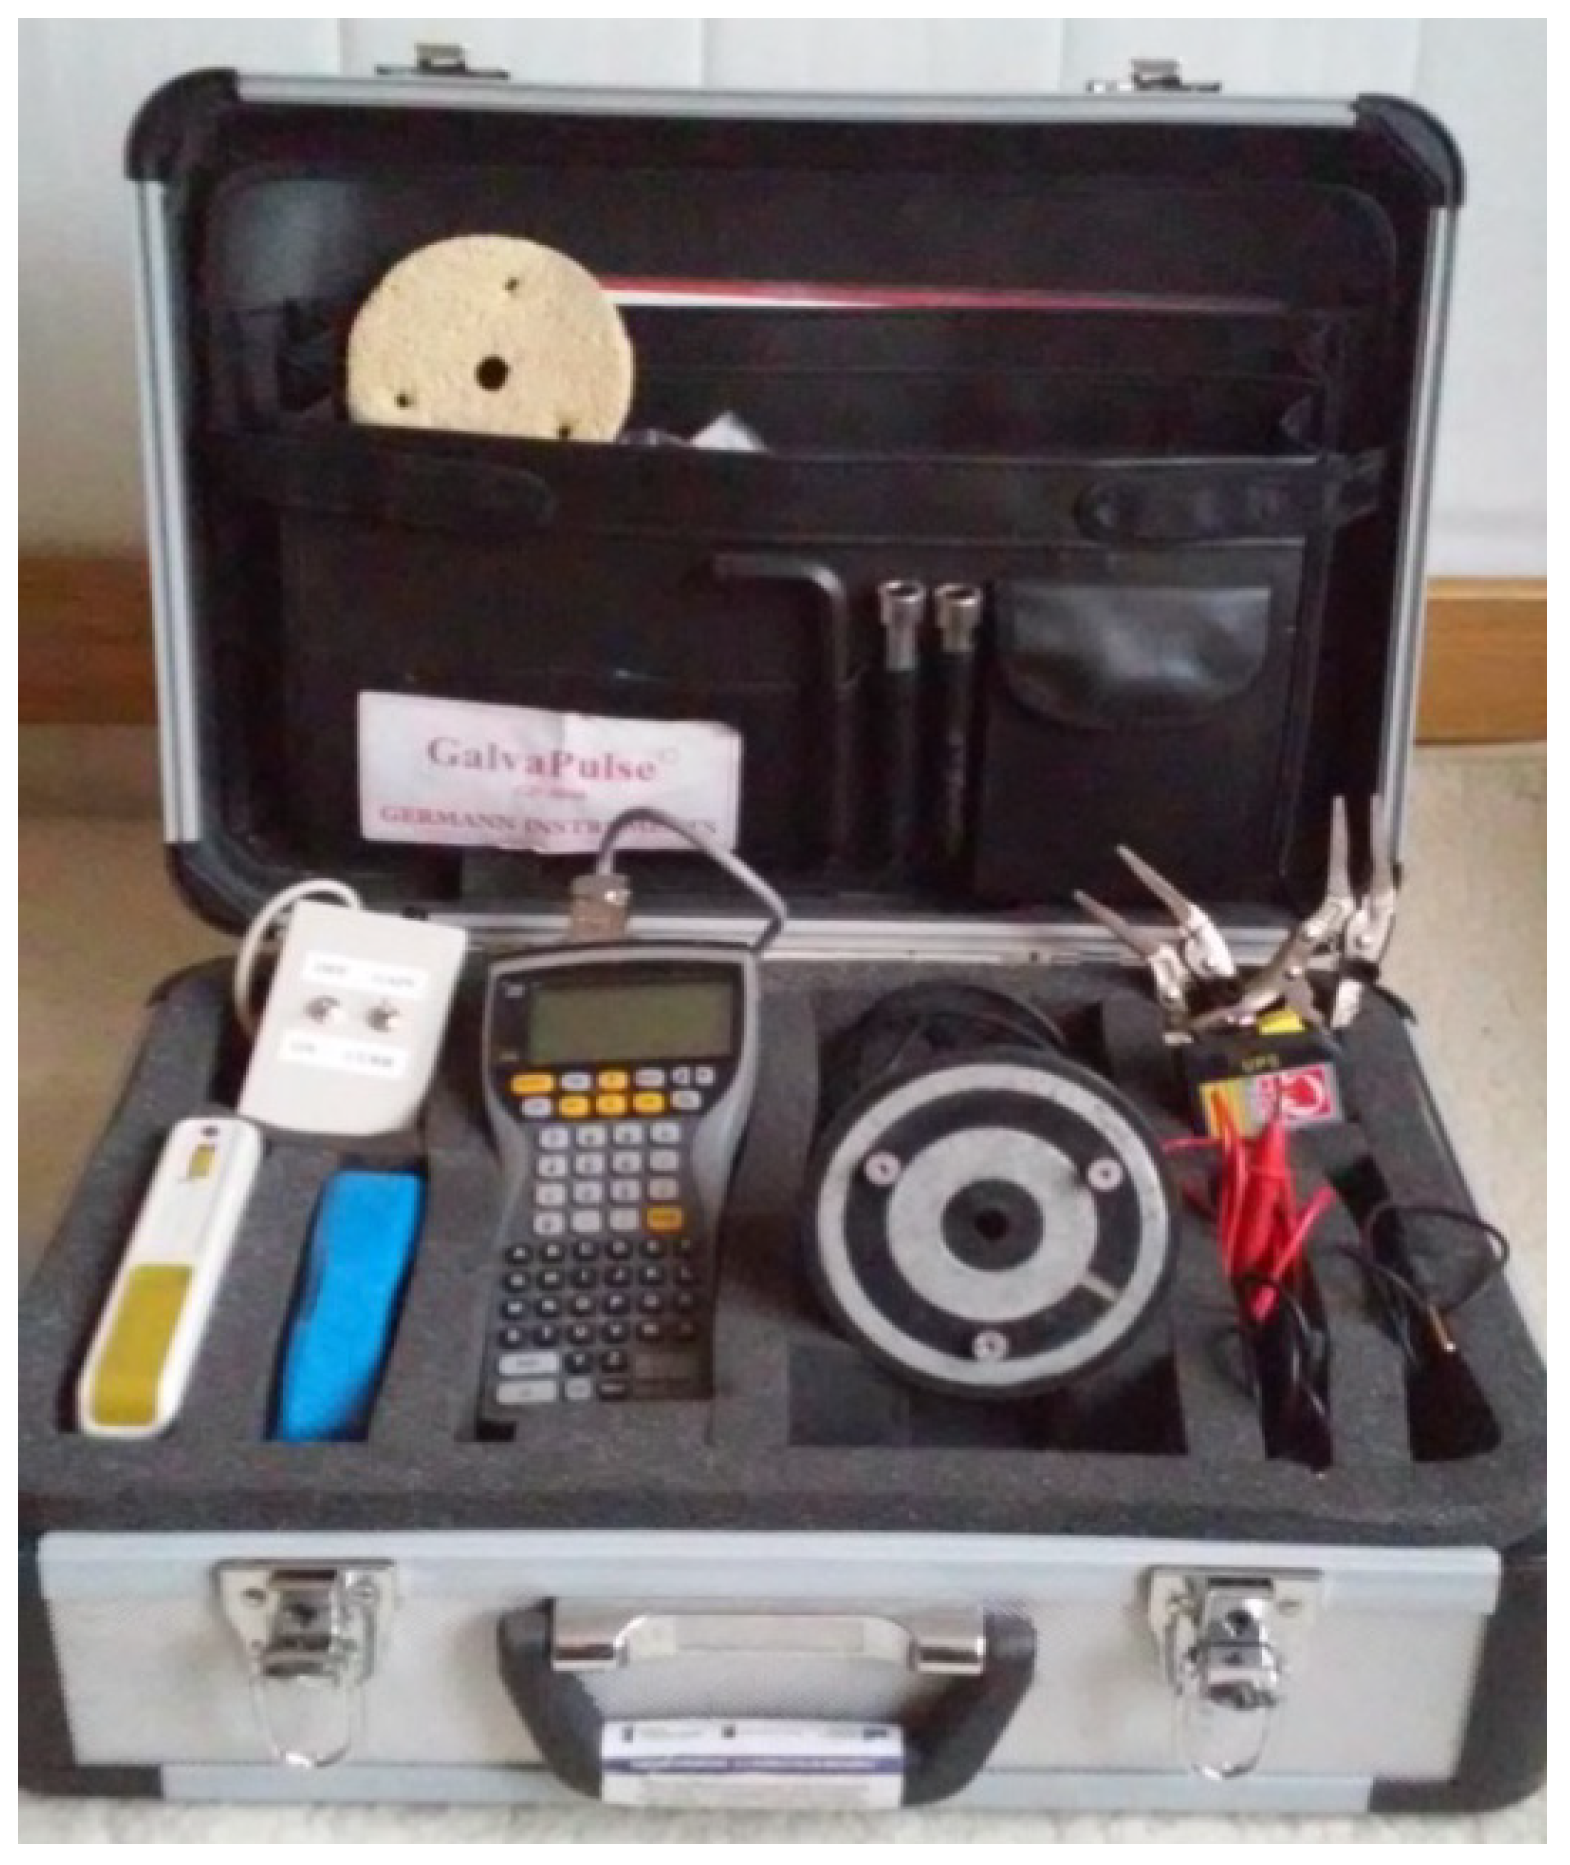
The GP-5000 GalvaPulse
TM set is one of the devices designed to measure stationary reinforcement potential and concrete cover resistivity (basic measurements) or, additionally, corrosion current density (advanced measurements) whileusing the polarization method [
32]. The half-cell potential is measured to an accuracy of ± 5 mV with the Ag/AgCl electrode. The electrical resistance is estimated to be measured with an accuracy of ± 5% [
32]. The main elements of the set include the control and recording device (PSION minicomputer), silver-chloride reference electrode (Ag/AgCl), and calibration device (
Figure 2).
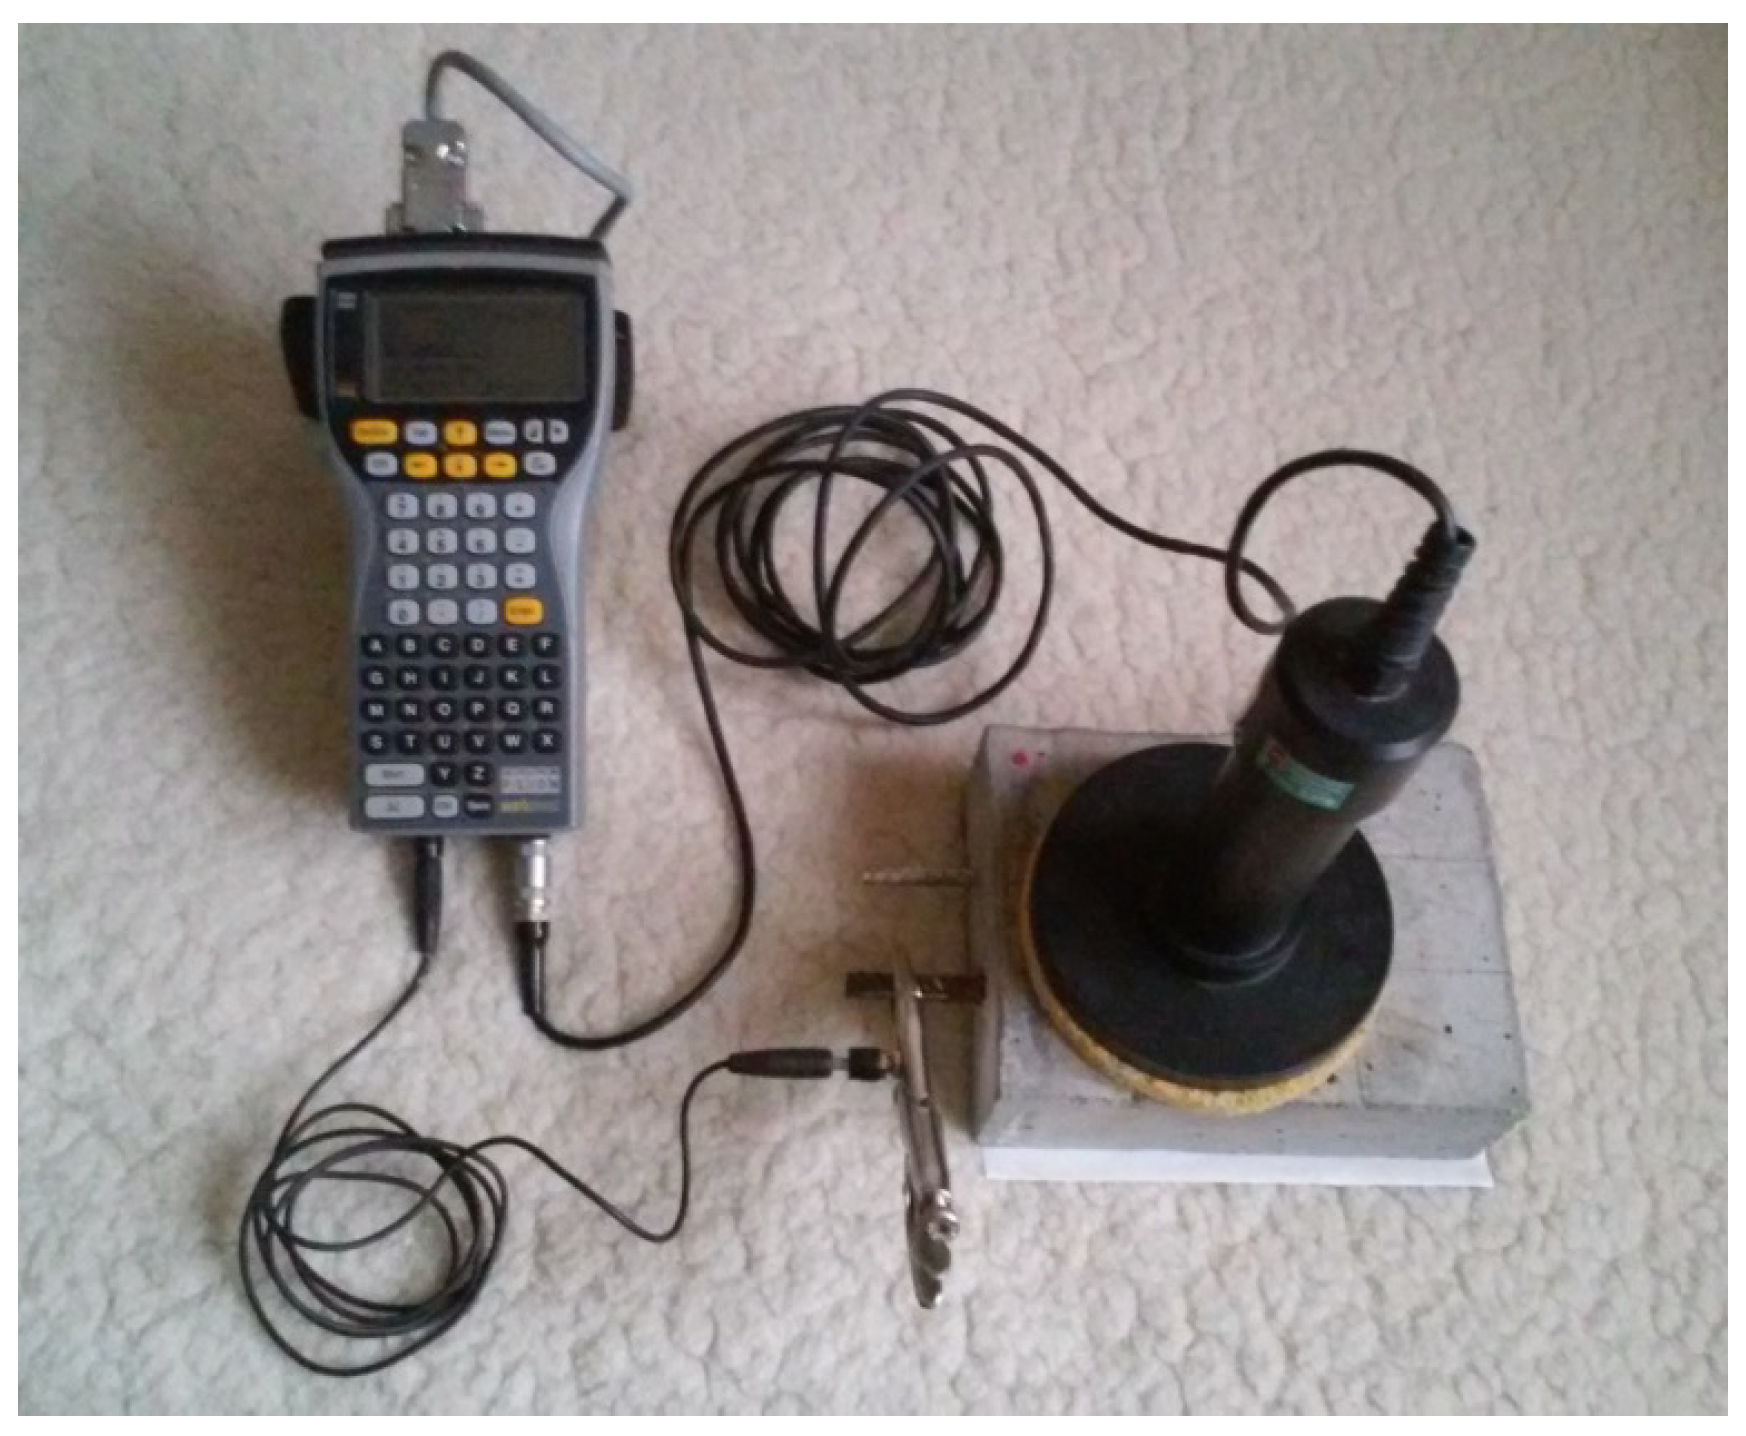
The GP-5000 GalvaPulseTM can be used in both laboratory and field conditions. Measurements are made on the surface of the element at the points evenly distributed above the reinforcement. This allows for creating graphical maps of the distribution of measured parameters and facilitates further comprehensive analysis of the results, especially for large-size elements. For the measurements, the reinforcing bar (local hole is required) is connected with the calibrated control and recording device (PSION minicomputer) and with the reference electrode.
Before the measurements, the location of the tested bar is determined and its continuity along the tested section is checked. Where the electrode is applied, the concrete surface must be properly cleaned and wetted. The recommended concrete resistivity should be no more than 50 kΩ∙cm. Changes in the moisture content in concrete result in resistivity changes, which, at a given constant current strength, could lead to incorrect measurements of the reinforcement stationary potential. Therefore, the moisture concentration on the tested surface should be maintained as constant throughout the measurement period.
Figure 3 shows the connection scheme of the GP-5000 GalvaPulse
TM set with the tested reinforcement.
The measuring device must be properly calibrated by entering the coordinates of the measurement points on the test surface, pulse duration (5 ÷ 20 s), current strength (5 ÷ 400 μA; a higher value is expected for bigger quantity of corrosion products), reinforcing bar parameters (diameter, length, surface area), and by activating (if necessary) the ring that limits the electrode area of operation.
Information on the criteria for the interpretation of the test results is attached to the apparatus (
Table 1). It is possible to infer about the probability of reinforcement corrosion in the examined area, and the corrosion process rate can be estimated based on the value of the corrosion current density, depending on the obtained values of the reinforcement stationary potential and the concrete cover resistivity.
Table 1 summarizes the appropriate criteria for measurements performed while using a GP-5000 GalvaPulse
TM set. The reference values should not be compared with the measurements that were obtained with other devices [
6,
32].
3. Research Methodology and Material
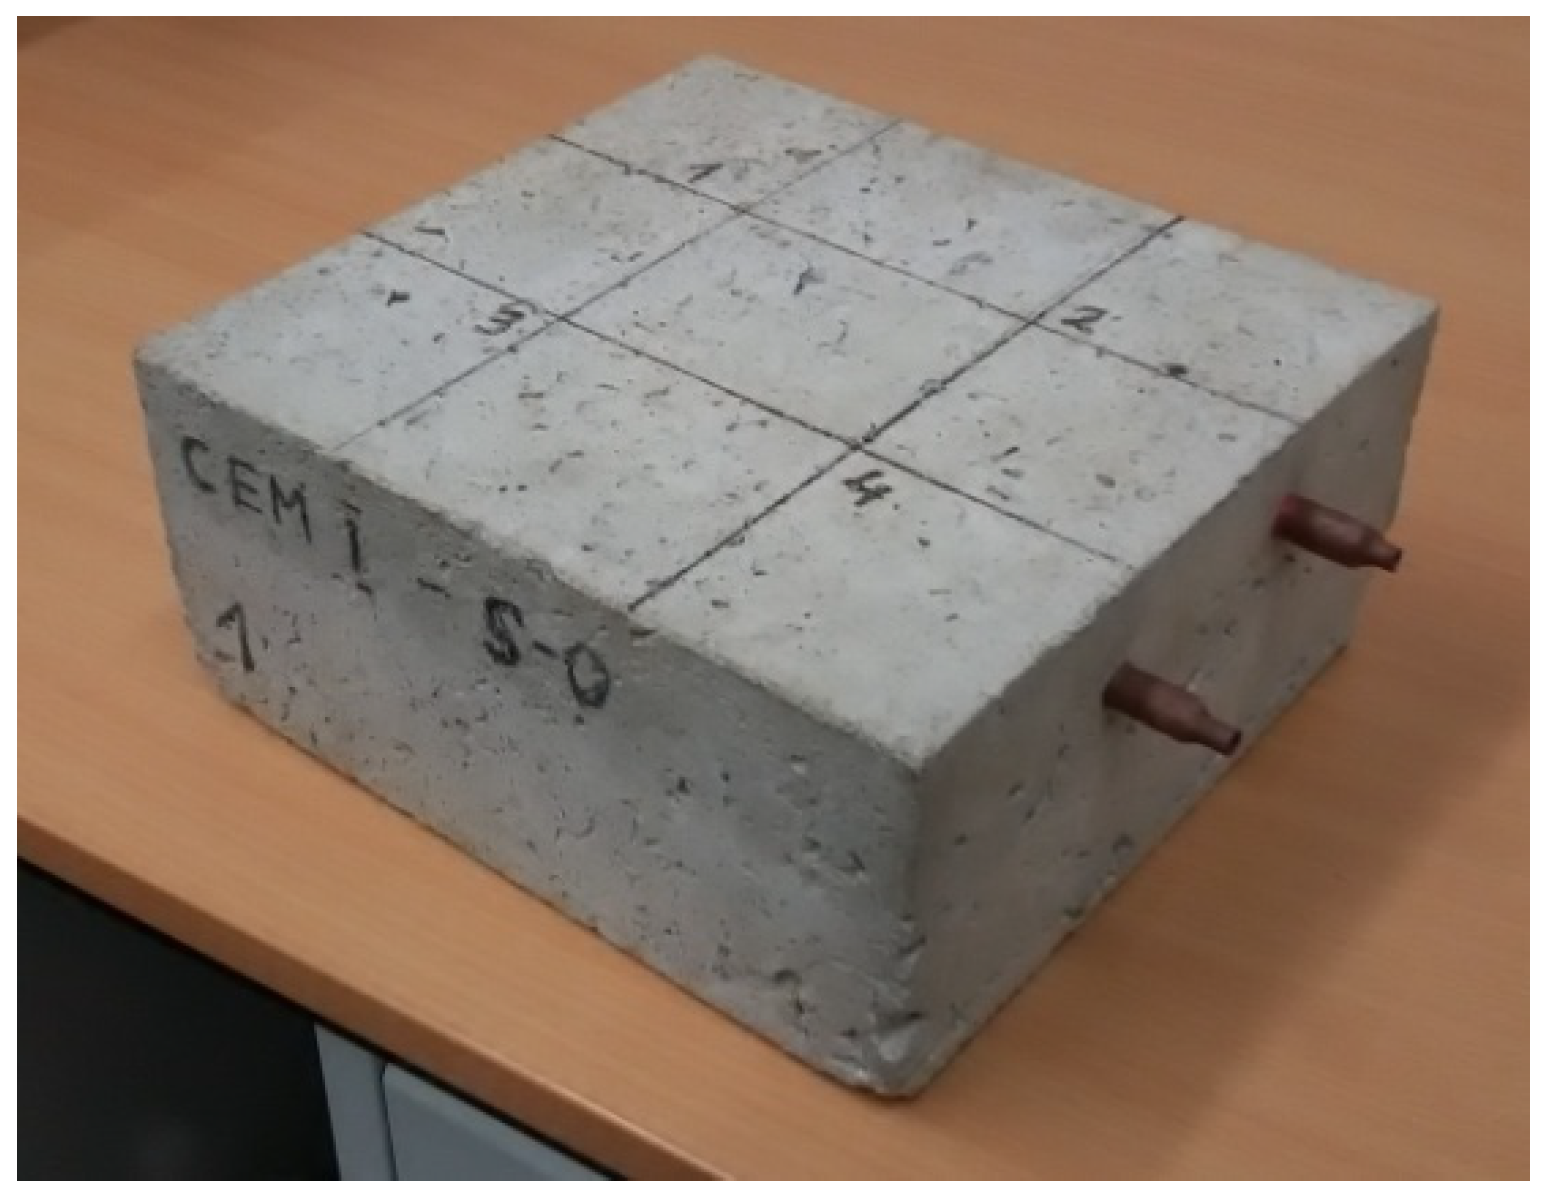
Seven rectangular specimens with dimensions 210 × 228 × 100 mm were cast. The specimens were made from the same concrete mixture (C40/45) under identical laboratory conditions. The following quantities of constituents were assumed for 1 m
3 of the mixture: cement (CEM I 52.5) – 390 kg, sand – 660 kg, aggregate 2 ÷ 8 – 617 kg, aggregate 8 ÷ 16 – 694 kg, water – 155 L, plasticizer (1.84 g), and air-entraining admixture (0.47 g). Two parallel ribbed bars with a diameter of 8 mm that were made of BST 500 steel were placed in each specimen 70 mm from the side edges and 25 mm from the upper specimen surface – the cover (
Figure 4). The specimens were stored at a temperature of 20 °C ± 2 °C, and relative humidity of 50% ± 5%.
An orthogonal grid of four measuring points was established for measurement purposes, being spaced evenly every 70 mm on each specimen (two points above each bar) in which reinforcement stationary potential, concrete cover resistivity and corrosion current density were measured (
Figure 5). The measurements were carried out in accordance with the requirements of the GP-5000 GalvaPulse
TM use. The obtained results were archived in the created database.
The test temperatures were varied and they included 1 °C, 5 °C, 8 °C, 10 °C, 15 °C, 18 °C, and 21 °C. The choice of temperature range resulted from the intention to reflect the real conditions in which in-situ research is usually carried out. Measurements were not possible at minus temperatures due to the specifics of the measurement technique, i.e., the use of the electrolysis process and the need for strong hydration of the concrete surface in the studied area. The temperature of specimen surface was measured every time at three points while using a non-contact infrared thermometer with a range of − 50°C ÷ 380 °C and tolerance of +/−0.5 °C.
4. Research Results and the Analysis
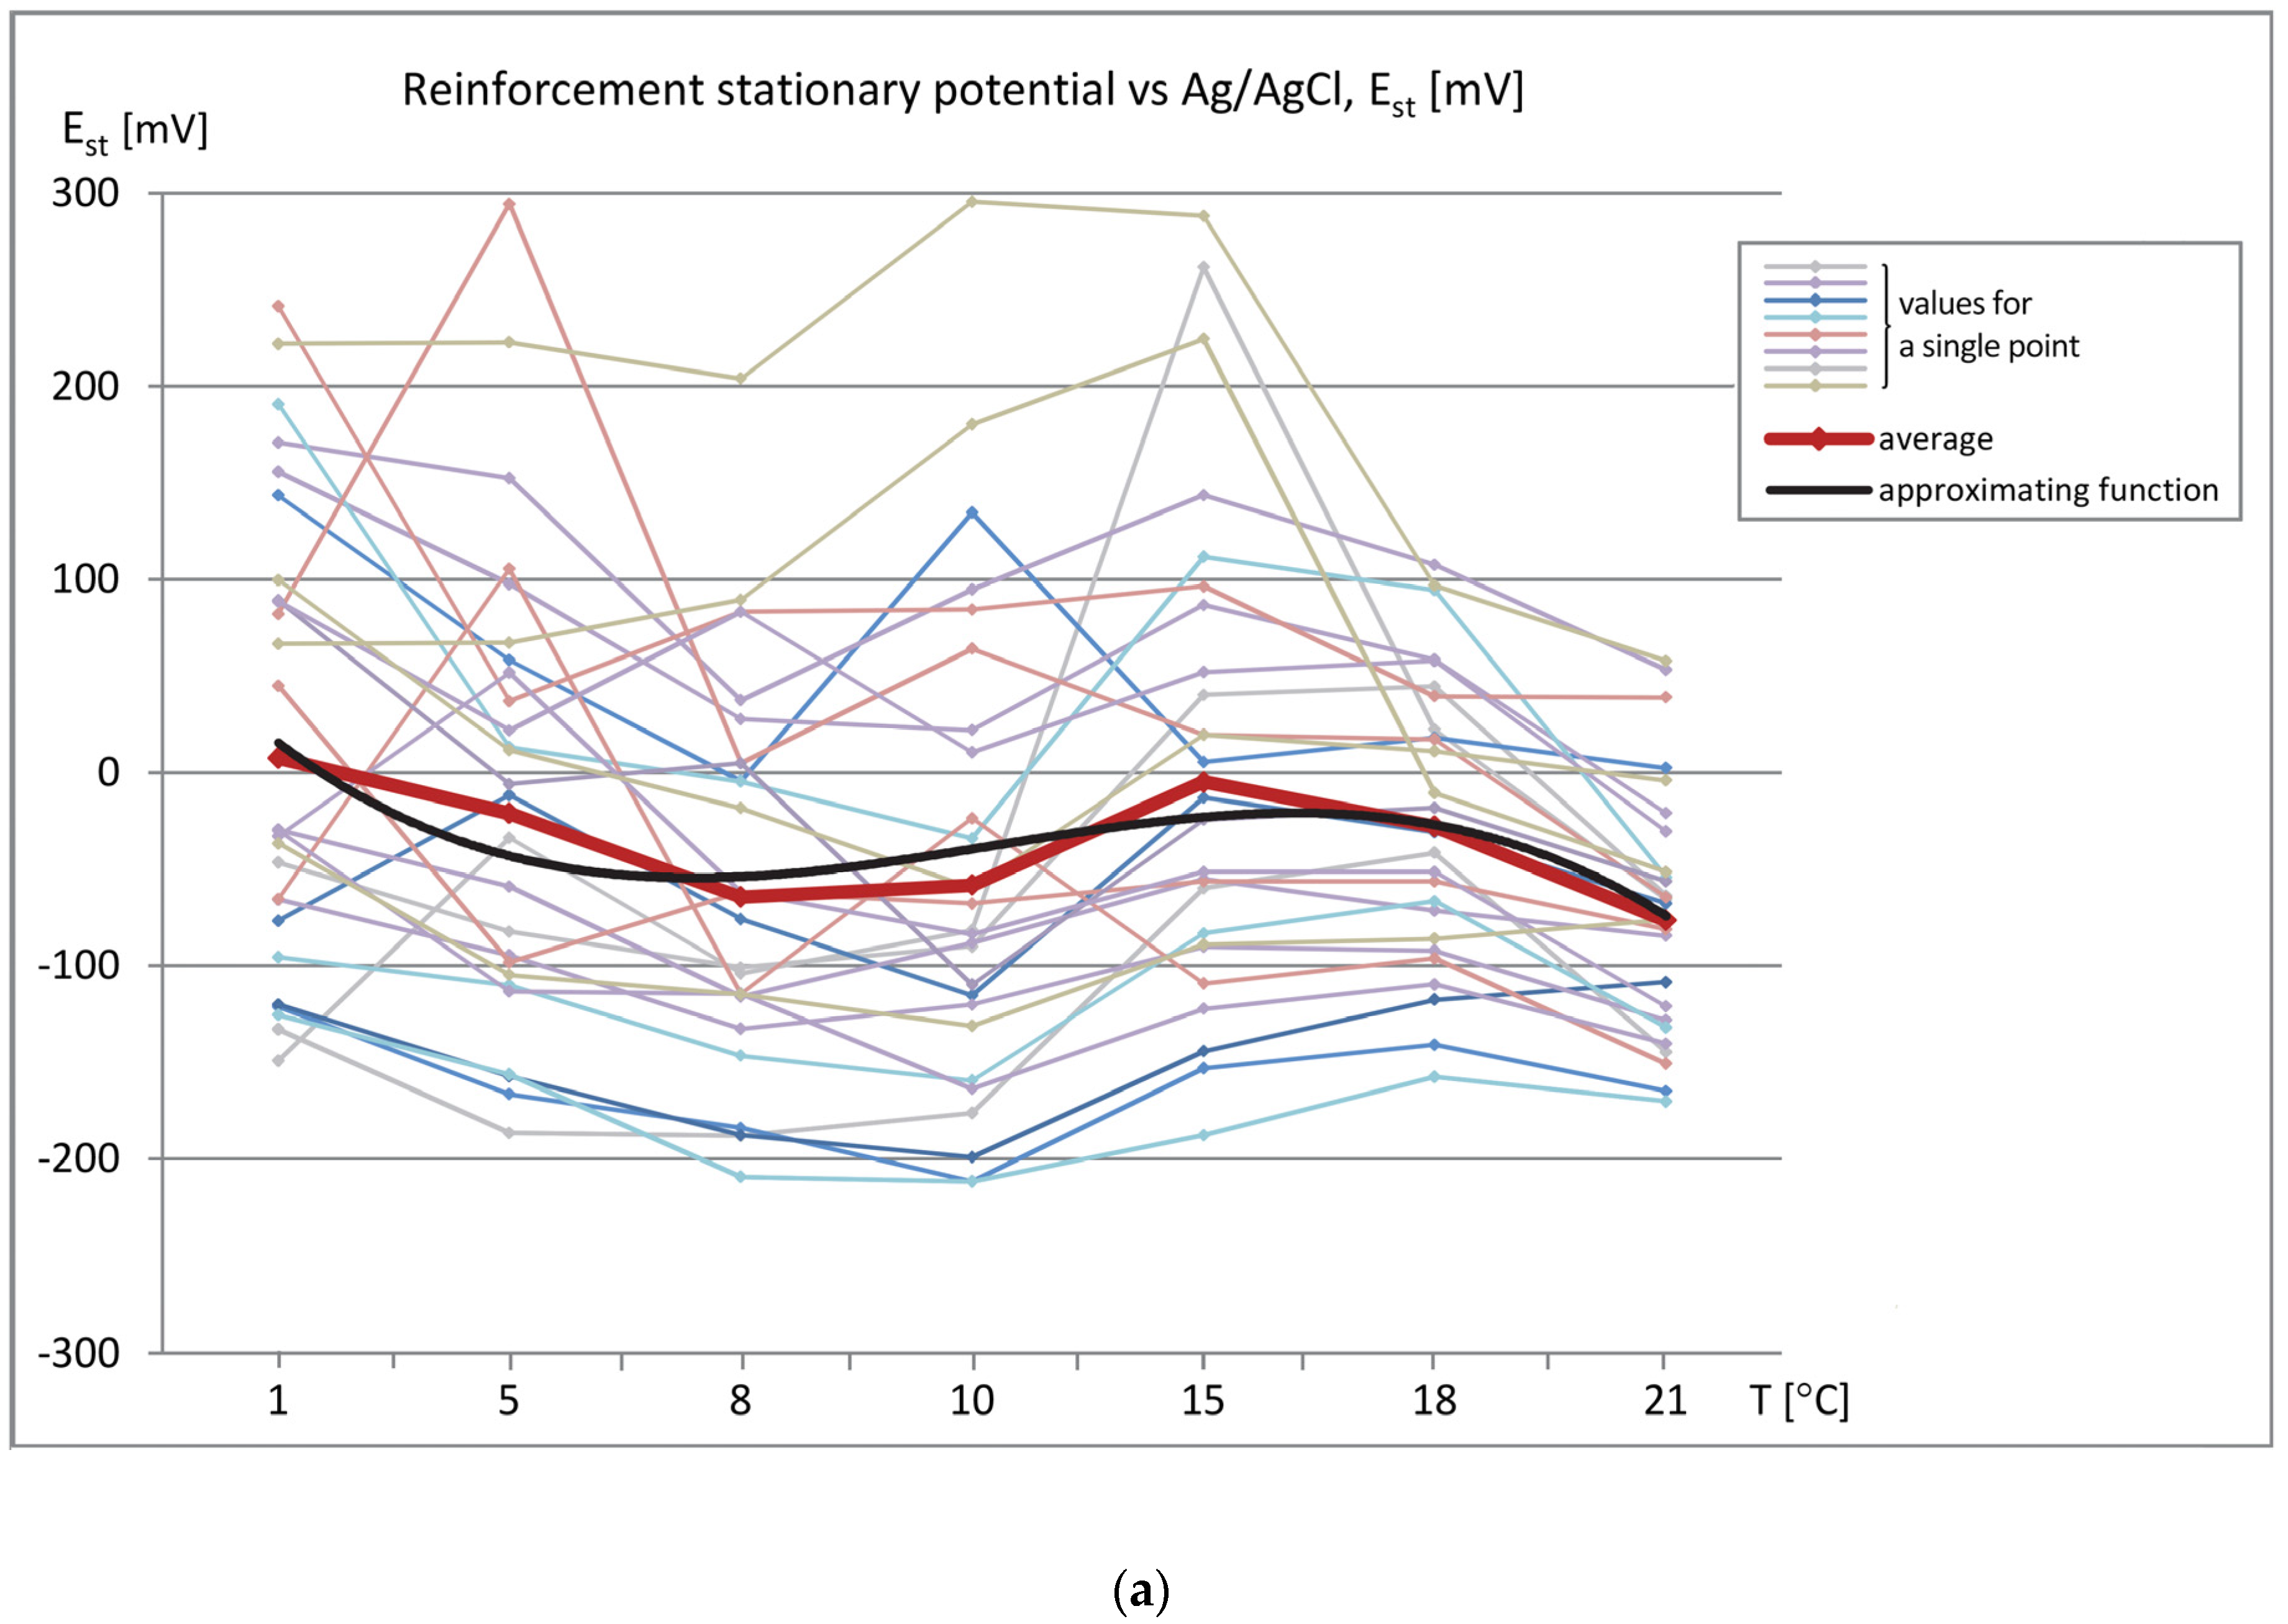
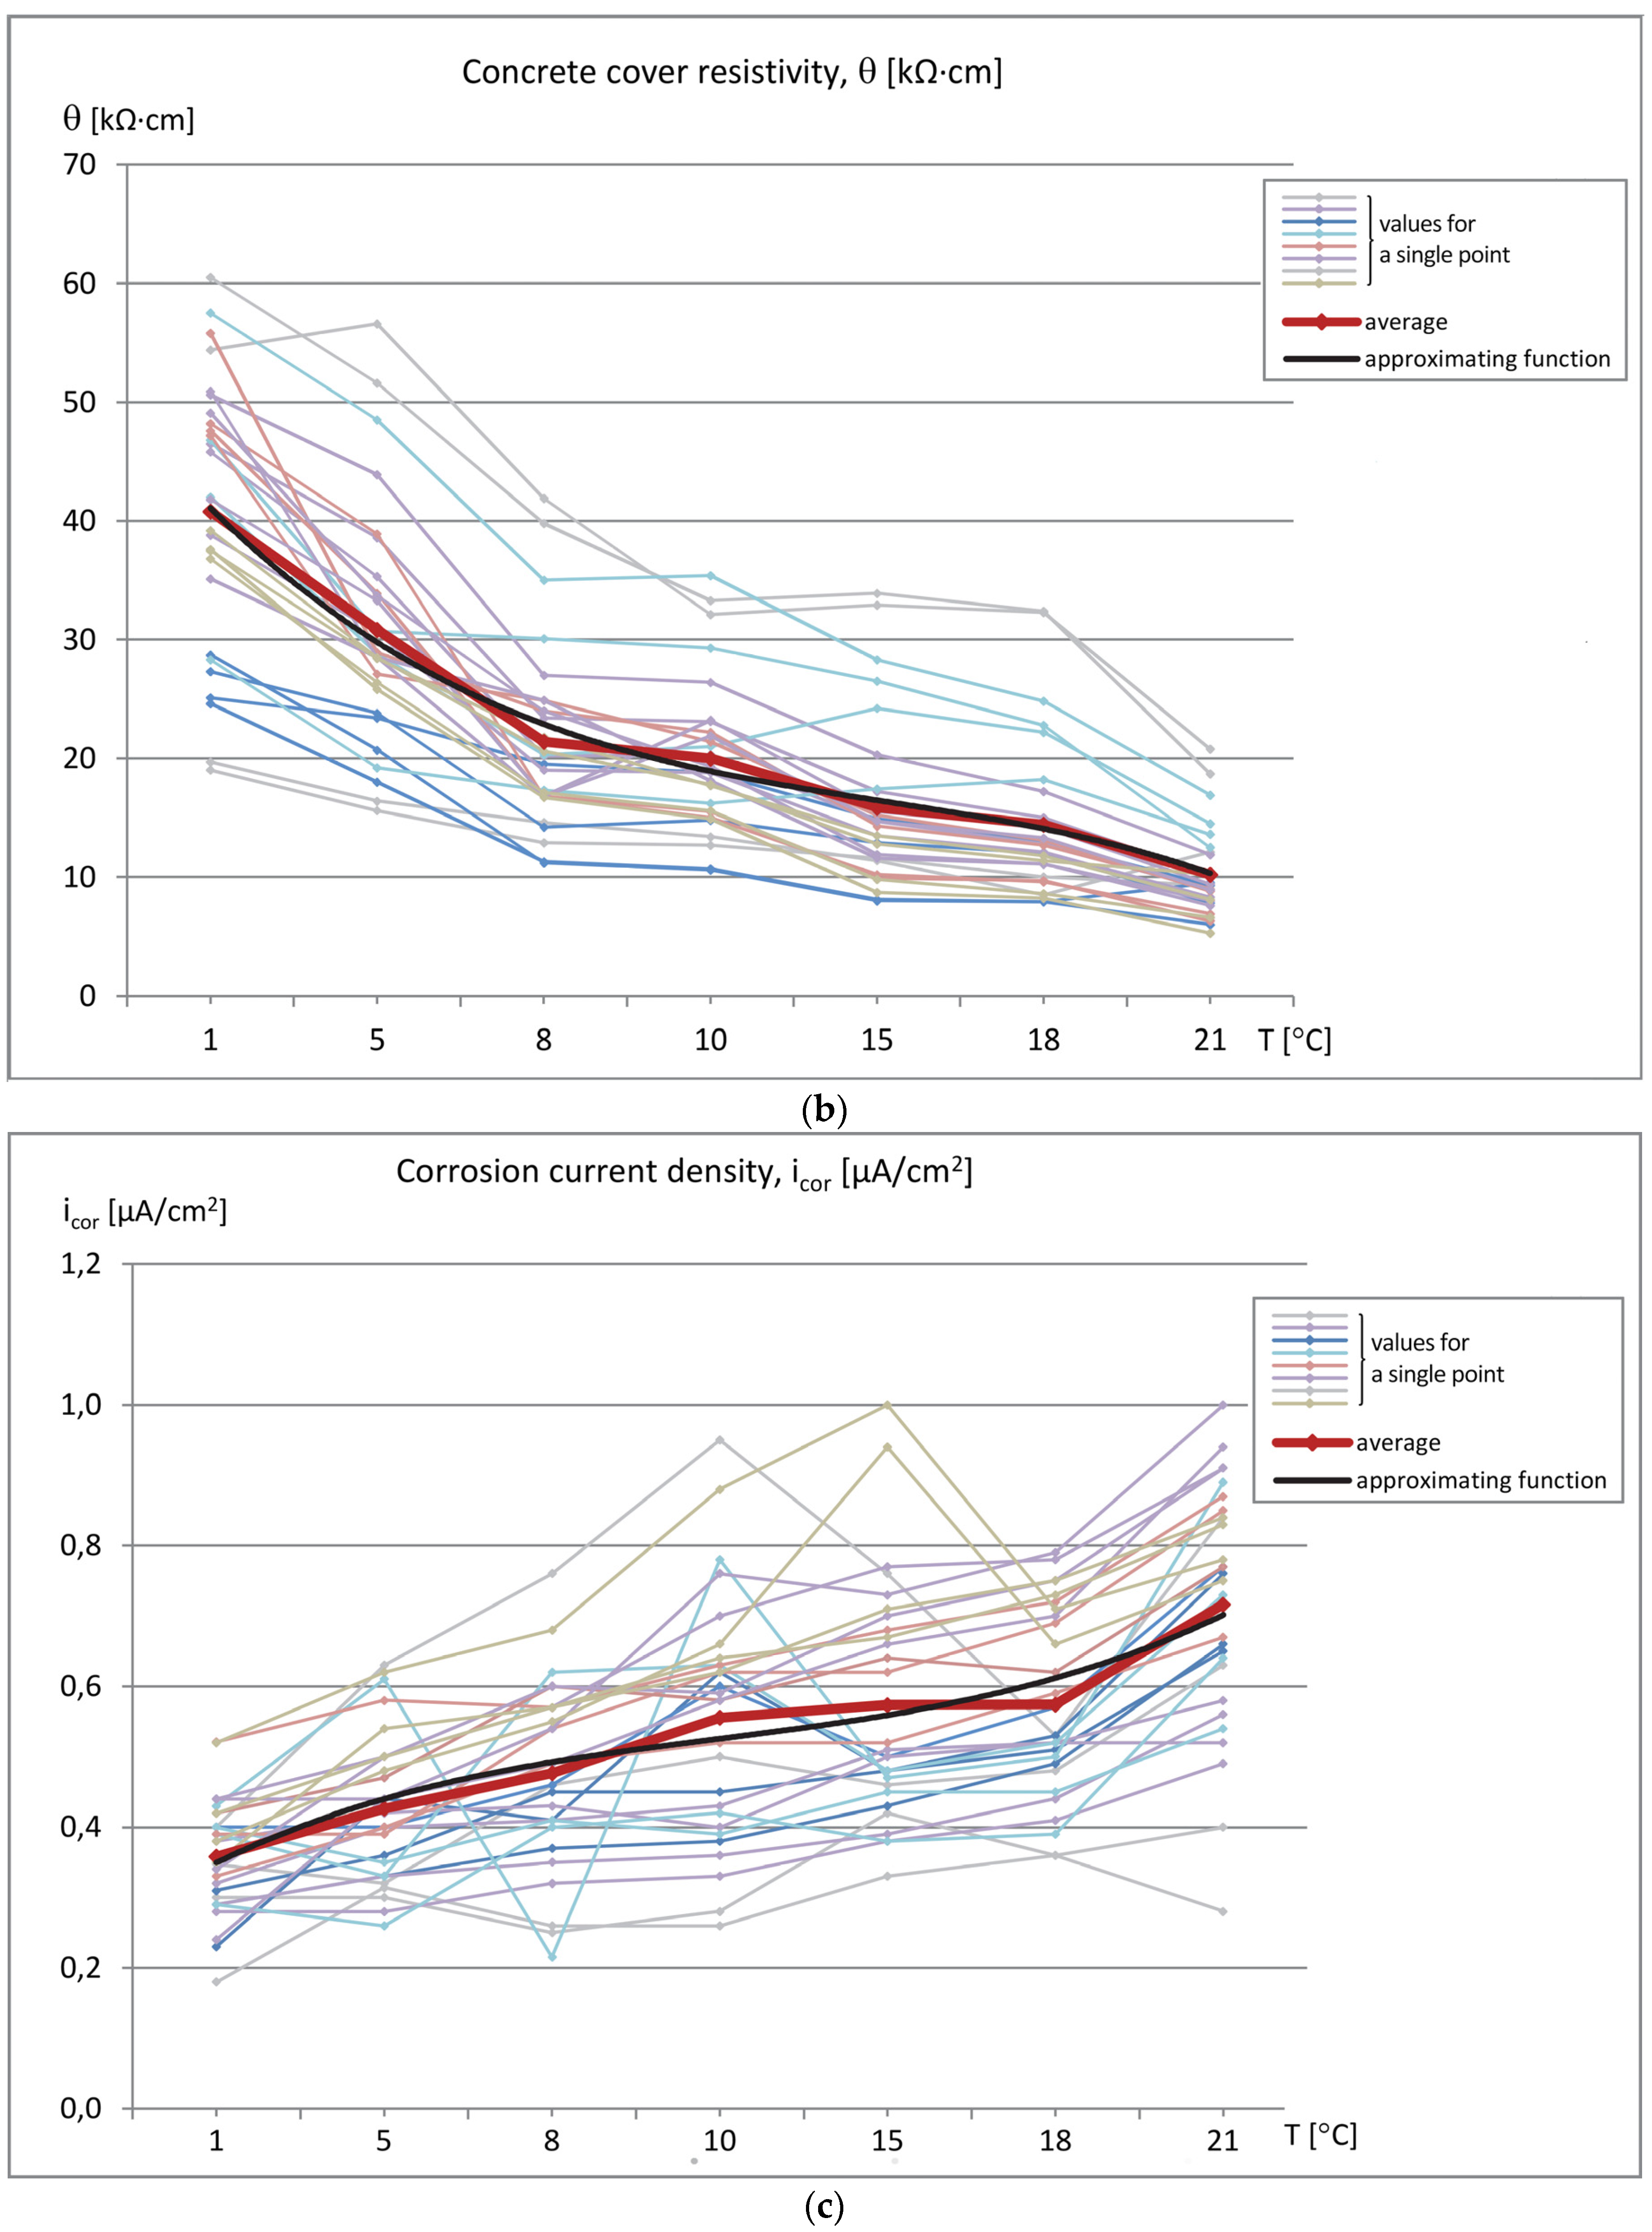
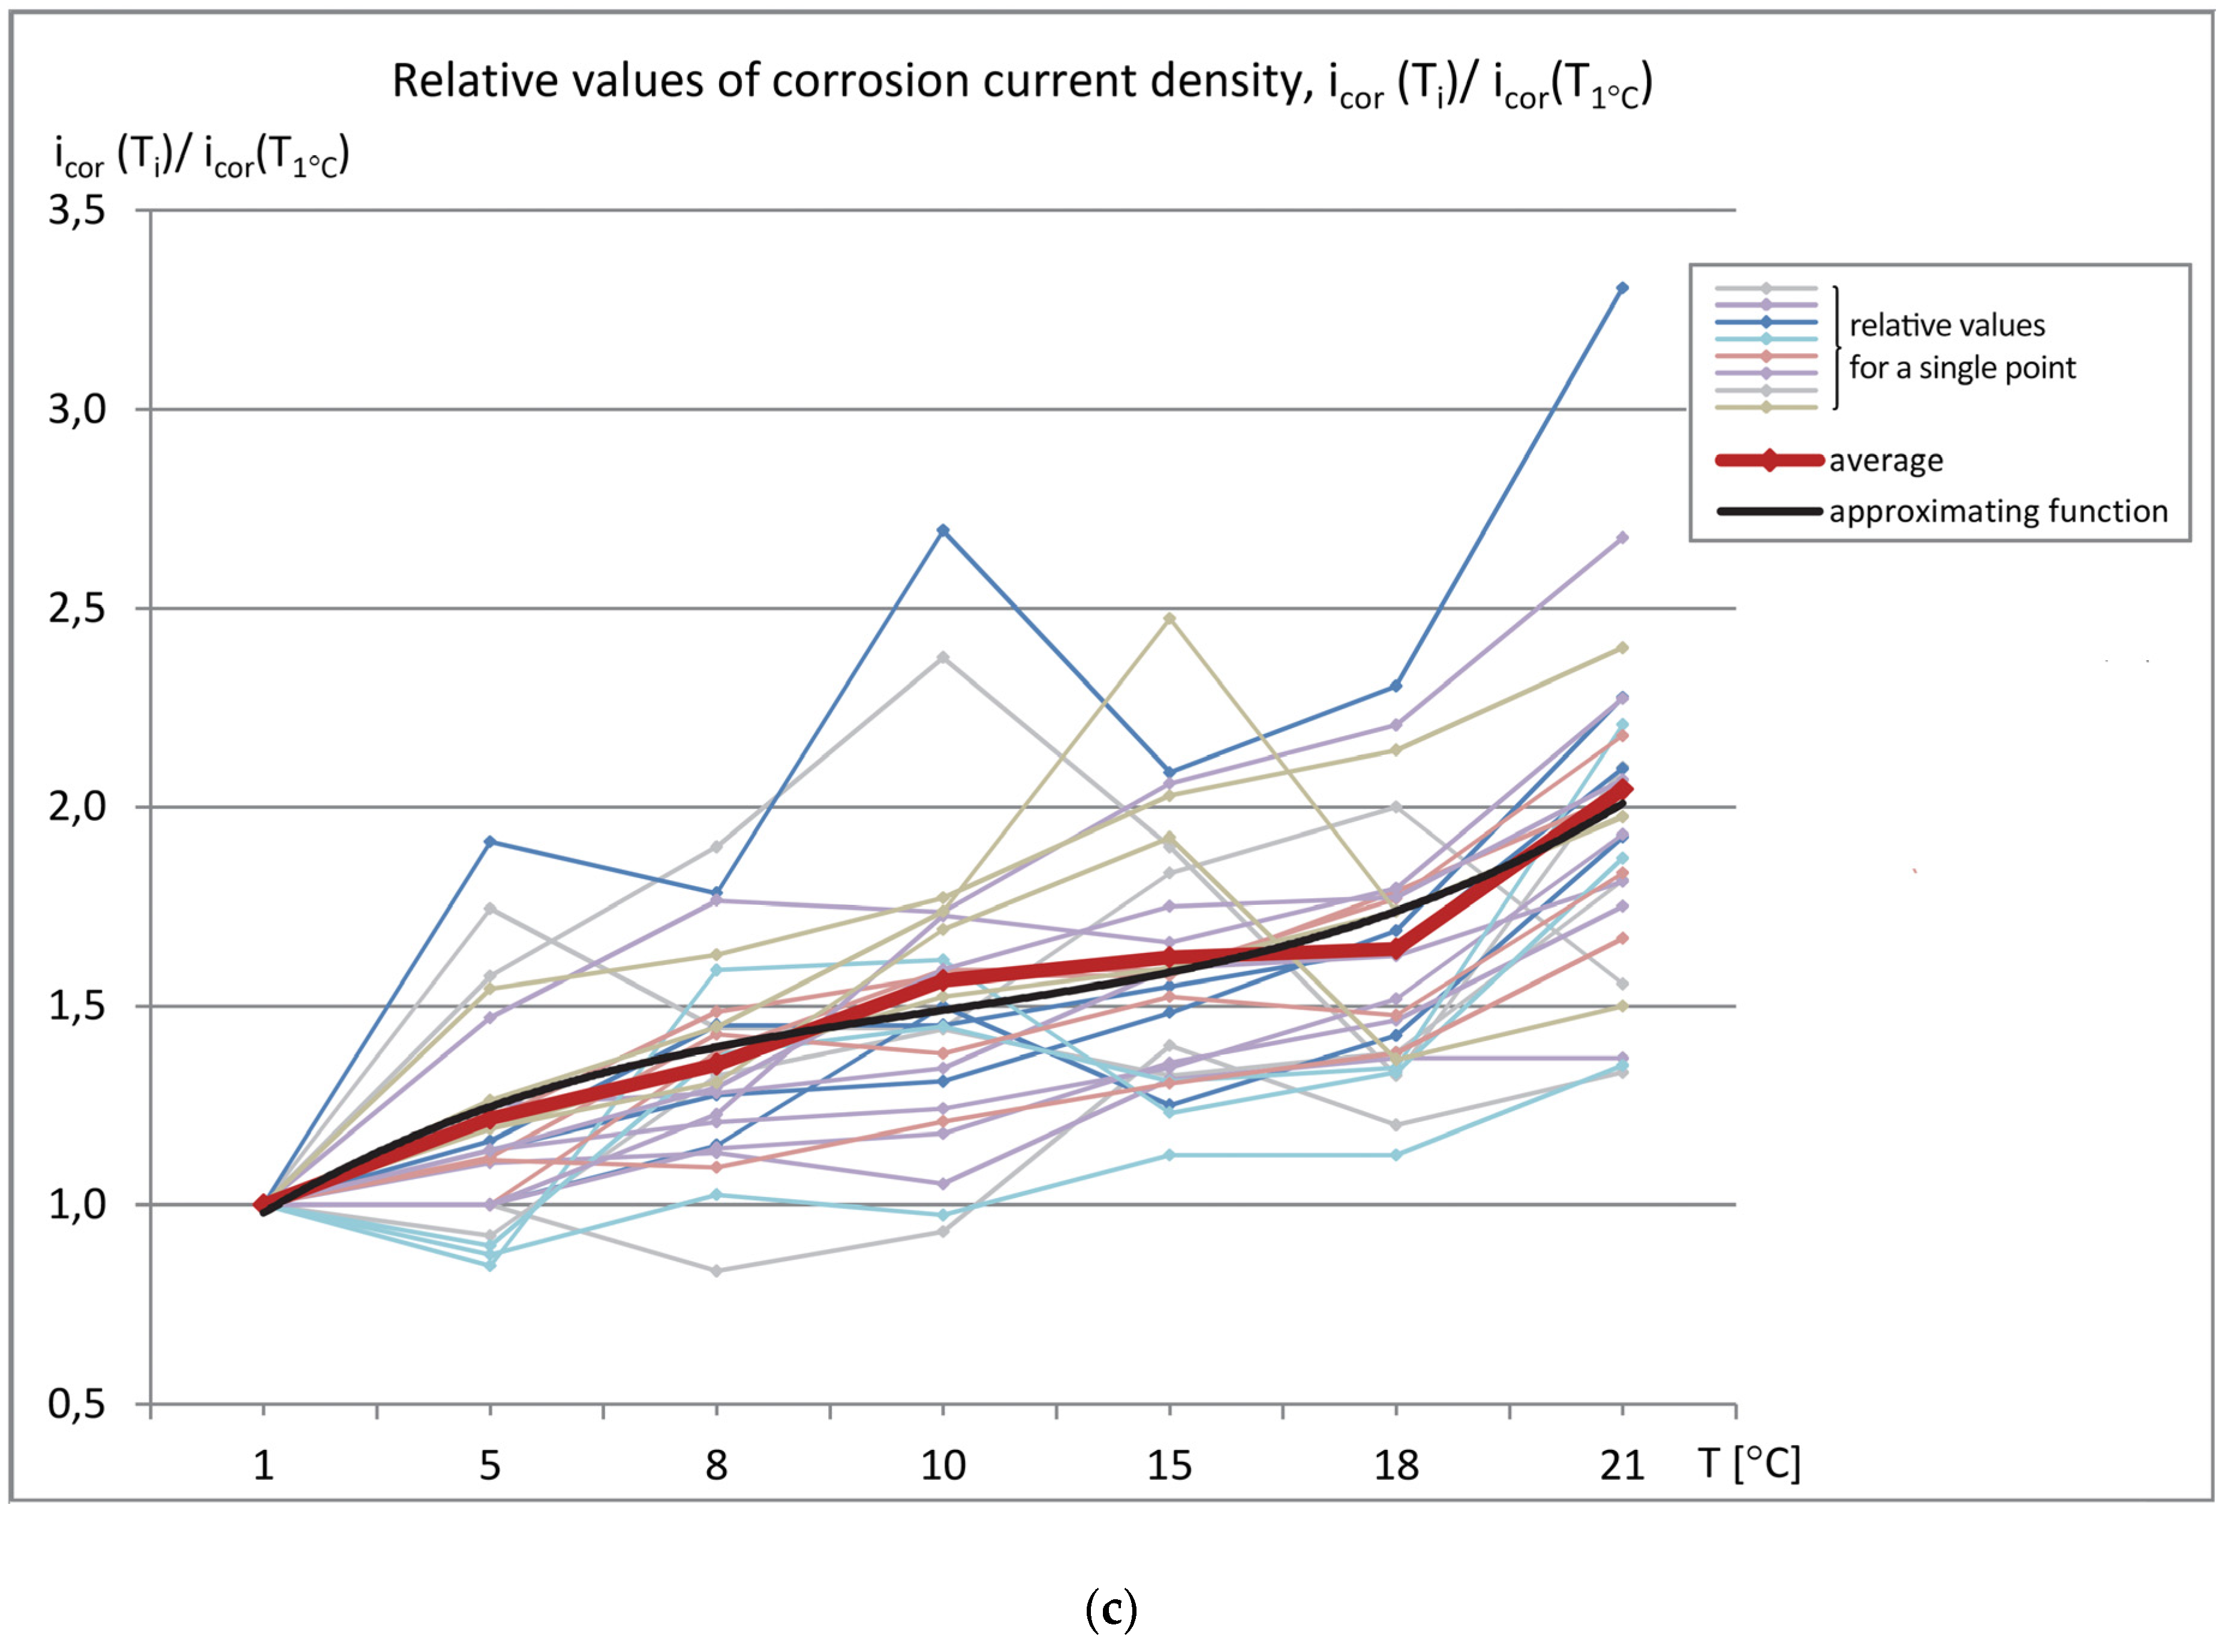
The data sets of the measured parameters (reinforcement stationary potential-Est, concrete cover resistivity-Θ, and corrosion current density-i
cor) as a function of temperature were produced, as shown in
Figure 6 (measured values) and
Figure 7 (relative values referred to the values measured at T = 1 °C). The graphs show the relation between the obtained results and the specimen temperature.
Analysis of the values of parameters determining the probability of reinforcement corrosion in the examined region, i.e., reinforcement stationary potential (Est) and concrete cover resistivity (Θ), showed that the obtained values were in the ranges: Est = −212 ÷ 295 mV and Θ = 5.3 ÷ 57.5 kΩ⋅cm. As described earlier, the measurements were made on the same specimens at the same measuring points, but at varied temperature values. While the values of reinforcement stationary potential at almost all assumed temperatures were less than −200 mV, which indicated the same 5% probability of reinforcement corrosion in the tested region (although with a wide spread of results), the values of concrete cover resistivity exhibited relatively high variability and, thus, led to significantly different conclusions about the corrosion probability-from low to high. Thus the temperature of the concrete cover has a large impact on its resistivity. The results of the third measured parameter, i.e., corrosion current density, were in the range of irrelevant corrosion activity, icor = 0.18 ÷ 1.0 μA/cm2, which corresponded to the real condition of the tested specimens.
In addition, at a given measurement point for a given parameter, the changes in its value versus temperature were quite similar. This indicates a constant (though not equally significant) effect of specimen temperature on the obtained values of the measured parameter. The values were averaged in order to discover the global trend of changes in the value of each parameter, as shown in
Figure 6. The plot of average values is marked with a red thick line, whereas the black thin line denotes the approximating function in the form of a three-degree polynomial.
The average value of the reinforcement stationary potential noticeably dropped with the increase in temperature of the tested specimen. The plot of the absolute value changes ranged from E
st ≈ 0 mV at T = 1 °C to E
st ≈ −77 mV at T = 21 °C. These changes are not strictly monotonic and they are in the range of insignificant values (
Figure 6a).
The changes in the concrete cover resistivity values were more explicit and unidirectional. The average value decreased from Θ ≈ 41 kΩ⋅cm at T = 1 °C to Θ ≈ 10 kΩ⋅cm at T = 21 °C. The graph does not differ significantly from the linear one (
Figure 6b).
Changes in the average corrosion current density values were also proportional to changes in specimen temperature and ranged from icor ≈ 0.36 μA/cm2 at T = 1 °C to icor ≈ 0.72 μA/cm2 at T = 21 °C.
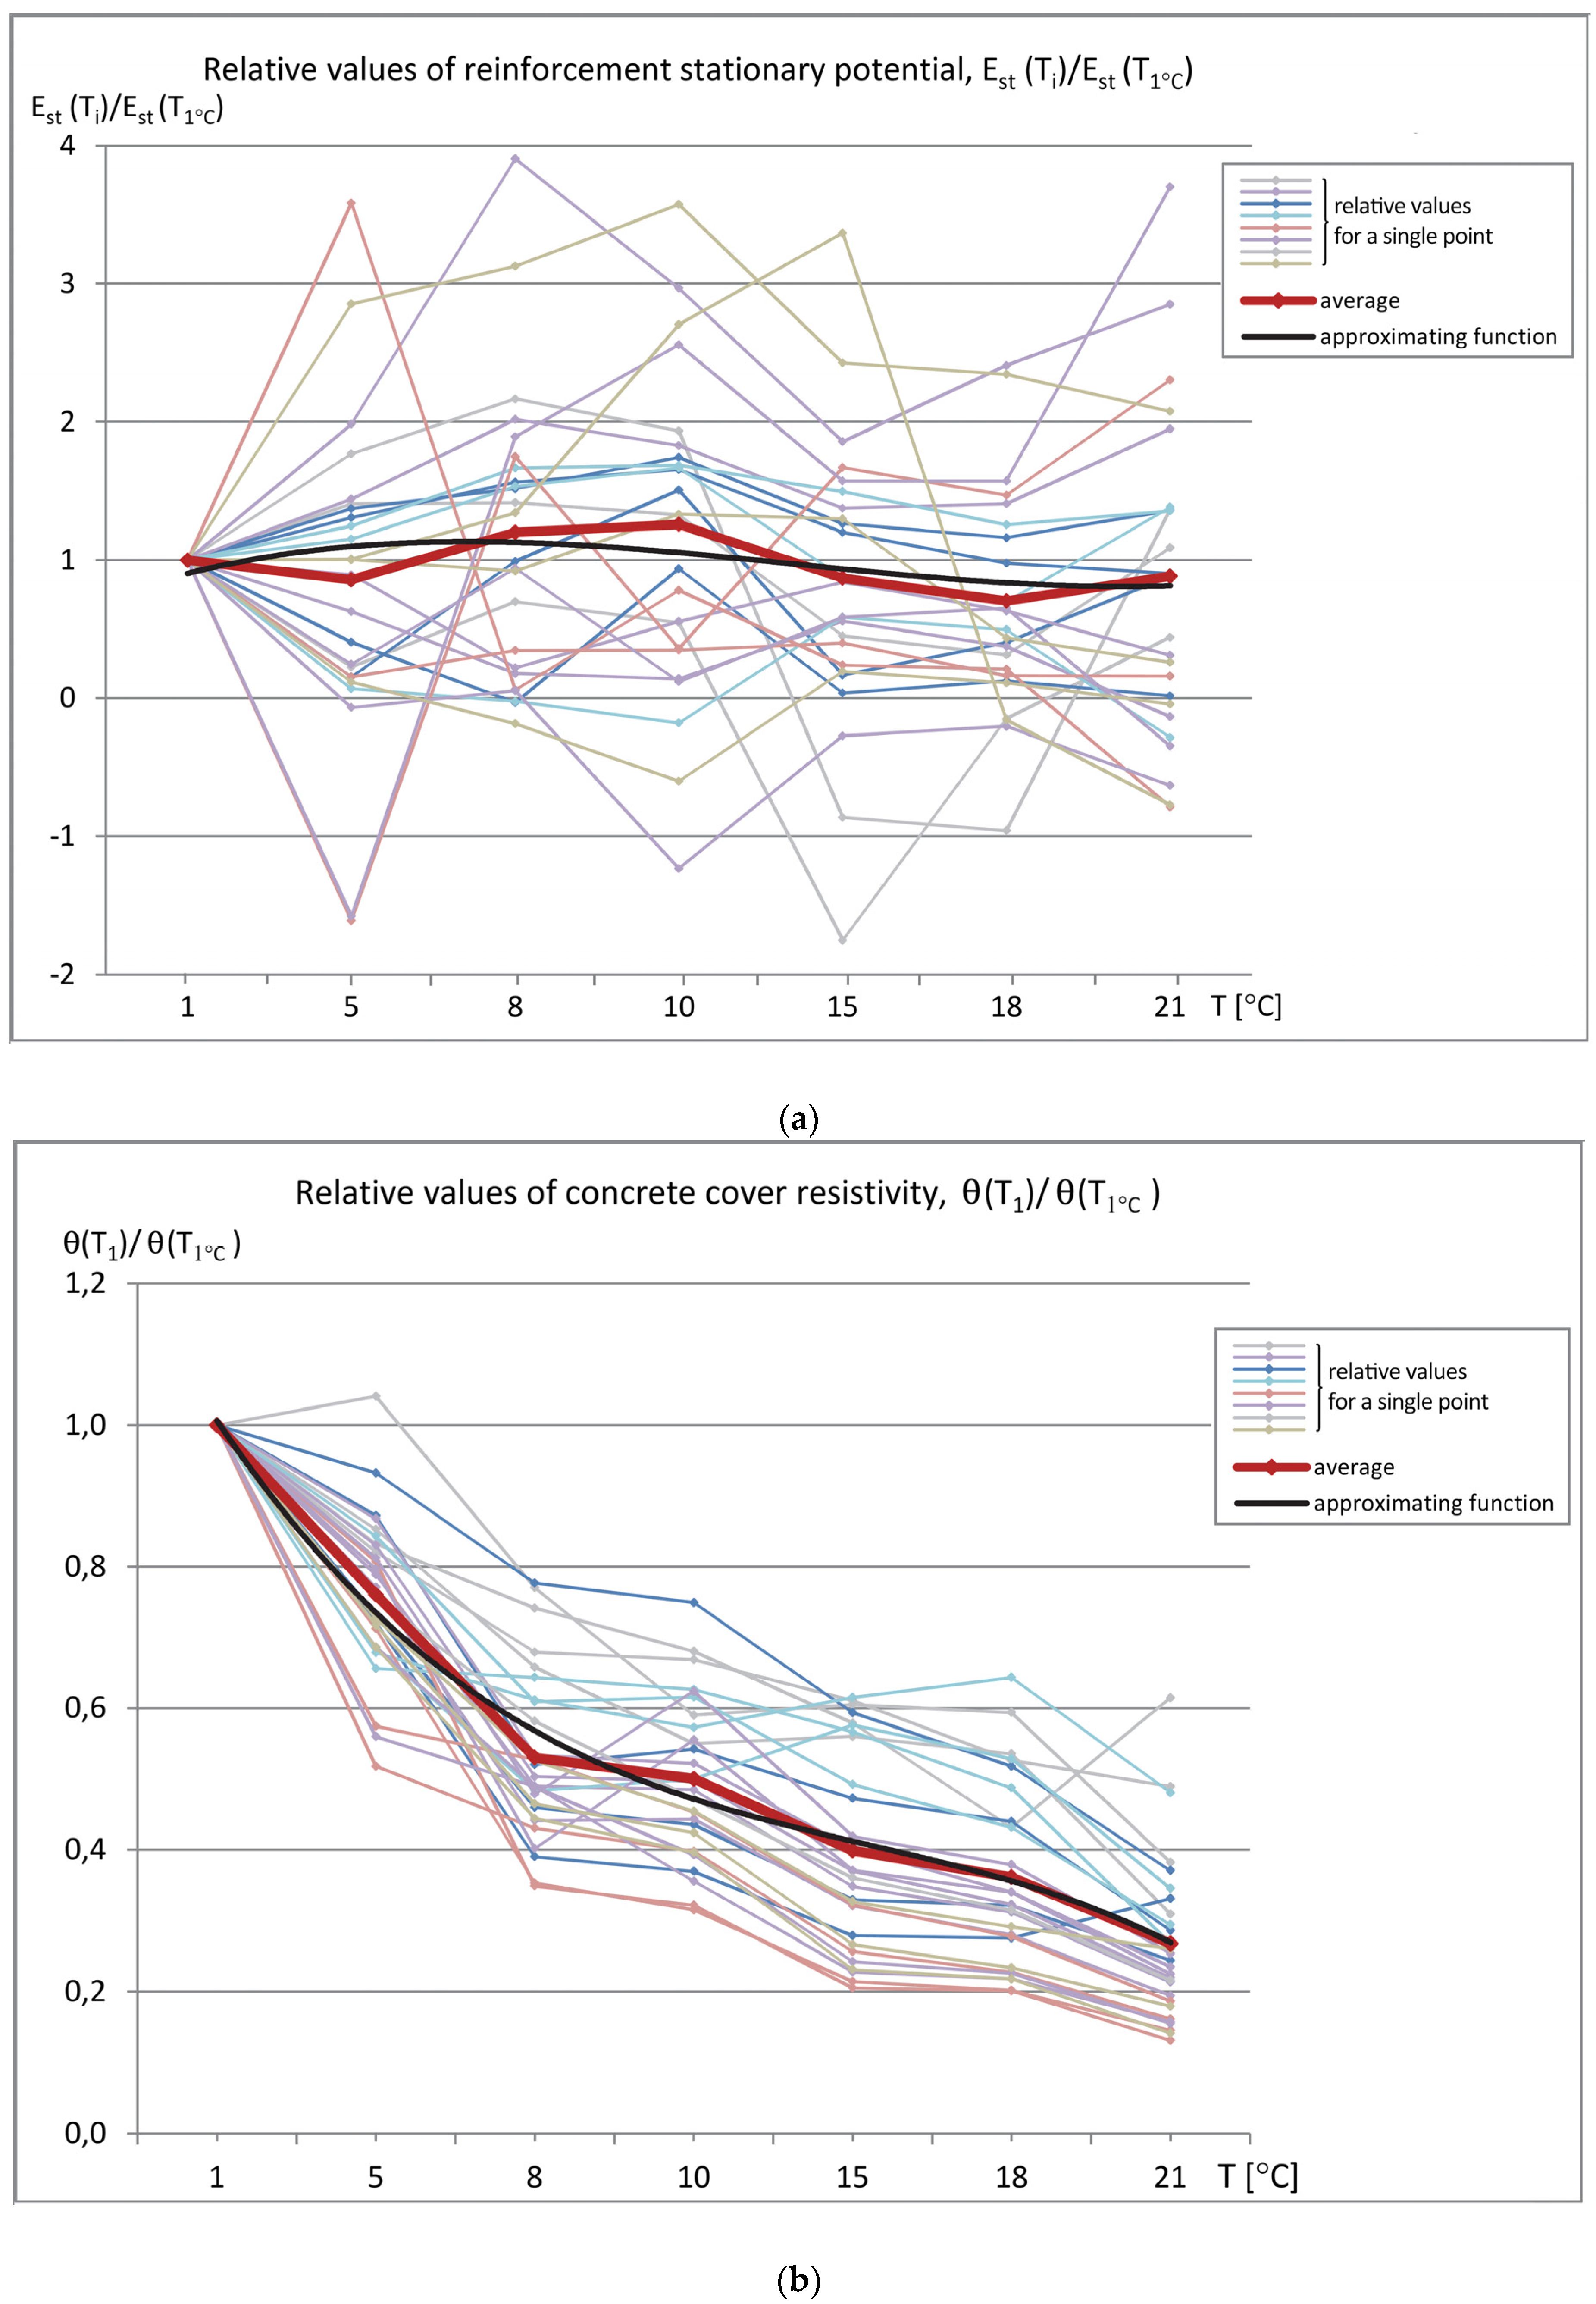
To assess changes in the values of the measured parameters (Est, icor, Θ) obtained at different temperatures, the plots of relative values were prepared. All of the values were referred to those that were obtained at T = 1 °C chosen in this case as the reference temperature. This approach gives the possibility to correct the results in the case of need to compare them with the results that were obtained during measurements performed in different conditions, e.g., in different seasons.
The observed relatively small changes in the average relative values of the reinforcement stationary potential E
st are visible in
Figure 7a. The positive and negative values of this parameter disturb general analysis of the relative values. It should be remembered that, in in-situ studies, only negative values represent a reliable and significant range of results. Values that are greater than E
st = −200 mV indicate very low corrosion probability. Therefore, the trend of changes as a function of temperature was verified on specimens with advanced reinforcement corrosion and presented in a separate publication.
The average value of the concrete cover resistivity (Θ) at higher temperatures clearly decreases down to 25% of the value at T = 1 °C. As the changes are significant, the inference about the corrosion risk of the tested element will be different.
The most important factor enabling the determination of the reinforcement corrosion activity, i.e., the corrosion current density (icor) changed by ~100% at the temperature T = 21 °C in relation to the reference temperature (i.e., T = 1 °C). While the absolute values, regardless of the temperature, were insignificant and indicated low reinforcement corrosion activity, the observed relative changes of the icor values in relation to those that were measured at the reference temperature are considerable. Therefore, the prediction of the reinforcement corrosion activity requires taking into account the temperature of the element being tested. Otherwise, the measurement will be inaccurate.
There were extreme differences in the relative values of the measured parameters at individual points in relation to the average values at these points: the reinforcement stationary potential - Est ± 200 ÷ 500 %, the concrete cover resistivity - Θ ± 40 ÷ 85%, and the corrosion current density - icor ± 25 ÷ 300%.


