Article

Applicability of a Design Assessment and Management for the Current Ammunition Depots in Taiwan

Department of Civil Engineering, R.O.C. Military Academy, No.1, Wei-Wu Rd., Fengshan Dist, Kaohsiung City 83059, Taiwan
Appl. Sci. 2020, 10(3), 1041; https://doi.org/10.3390/app10031041
Submission received: 12 January 2020 / Revised: 1 February 2020 / Accepted: 2 February 2020 / Published: 4 February 2020
(This article belongs to the Section Civil Engineering)

Abstract

:

Featured Application

Integrate a scale experiment and computer simulation to reduce costs and risks. Verify the applicability of the ammunition depot design. Reduce damage to equipment and life through design and management mechanisms.

Abstract

In Taiwan, many ammunition depots have become outdated after having been in service for a long period of time, and if they are not properly managed, then accidental explosions might erupt inside. Leakage pressure after an explosion is closely related to the opening of the structure and the thickness of the wall. In order to reduce the risk of implosion, it is necessary to design a new structure or strengthen the existing ammunition libraries for the storage of ammunition required for combat. In order to evaluate the applicability of an existing ammunition depot design, making management simpler and safer, this study integrates the scale model experiment of an ammunition depot with computer simulation, the arbitrary Lagrangian–Eulerian (ALE) algorithm in ANSYS/LS-DYNA software, and it compares the results with the UFC3-340-02 specification in order to verify its applicability. The results show that computer simulation can verify that the data related to an implosion of an ammunition depot is similar to the specification. Therefore, the design results of the ammunition depot optimized by computer simulation can be used as a reference for the construction or strengthening of ammunition depots.

1. Introduction

This study poses the risk of accidental blast in the case of improper management of an ammunition depot. In case of an internal blast, blast pressure will leak through the vent openings of the ammunition depot or blast through the fragile walls; thus, flying debris and objects are hazardous to surrounding buildings, personnel, and equipment. A relatively conservative design is adopted in the current design criteria of ammunition depots of Taiwan [1]. Therefore, difficulties are created during site selection for an ammunition depot in consideration of the increased safety range regarding the threat of leakage pressure. In addition, the impact of the thickness and strength of walls of an ammunition depot on leakage pressure requires further study [2,3,4,5]. Foreign researches on ammunition depots are mainly based on large-scale blast tests [6,7,8]. However, in Taiwan, subject to test site restrictions, the impact of an internal blast on the blast pressure of structures can be discussed only through small-scale blast tests, in conjunction with computer numerical simulation [9,10,11,12]. The purpose of this study is mainly to discuss the impact of vent opening and fragile walls on leakage pressure subsequent to an accidental blast of an ammunition depot. The Fluid–Structure Interaction (arbitrary Lagrangian–Eulerian, ALE) algorithm of ANSYS/LS-DYNA software [13,14,15,16] was used to simulate the impact of the size and location of the vent opening of an ammunition depot on leakage pressure in the case of an internal blast due to the improper management of the ammunition depot, in order to mitigate the risk by enhancing management practices with the simulation results, as based on the existing ammunition depot, and in consideration of the impact of the thickness and strength of concrete walls. In the simulation, air and charge were set as Eulerian Mesh and fragile wall was set as Lagrangian Mesh, which together form a numerical model of Fluid–Structure Interaction, in order to discuss the impact of the size and location of the vent opening and the thickness and strength of fragile walls on leakage pressure. Simulation results are compared with the UFC3-340-02 Specification in order to understand the applicability of the current assessment method.
The rest of this article is organized as follows. In Section 2, this paper reviews the literature on the power of internal blast. In Section 3, this paper introduces numerical simulation methods and material parameters in numerical simulation. In Section 4, this paper compares the results of numerical simulations and experiments to verify the effectiveness of the method used. Finally, in Section 5, this paper provides conclusions and future work.

2. The Power of Internal Blast

The current design of ammunition depots can be implemented with reference to the technical handbooks of the US Army, i.e., UFC3-340-01[4] and UFC3-340-02[5]. However, different assessment methods are specified in the two handbooks regarding blast pressure, meaning the leakage pressure at the vent opening and the blast resistance of walls in case of an internal blast in an ammunition depot. Only a conservative design can be implemented with maximum values. In respect of this topic, in 1975 [6], Keenan and Tancreto conducted a study on leakage pressure under various types of vent openings in the internal blast in an ammunition depot, and the results showed that the size and location of a vent opening had a tremendous impact on the leakage pressure. Hokanson studied the blast pressure of an internal blast in an ammunition depot in 1982 [7] and found that the location and shape of the charge had little impact on the gas pressure generated by the internal blast; instead, the size of the vent opening and internal volume were the main influencing factors. Keenan and Tancreto proposed an empirical equation regarding the gas pressure generated by an internal blast and the blast resistance of walls by integrating historical test results in 1982 [2]. Wager proposed a design equation regarding the blast resistance of walls with a vent opening based on Yield Line Theory in 1994 [3]. Tancreto and Zehrt Jr. established the correlation between the gas pressure generated by an internal blast, as well as the vent opening size and internal volume, by integrating historical achievements in 1998 [8]. With the increasingly mature computer simulation technology of Fluid–Structure Interaction, relevant researches on the complicated issue of the interaction between blasts and structures have become available. In Taiwan, Chen [9] discussed the applicability of Fluid–Structure Interaction in the numerical simulation of an internal blast in an ammunition depot in 2008, and validated that the Fluid–Structure Interaction (ALE) algorithm of ANSYS/LS-DYNA was applicable to the numerical simulation of an internal blast in an ammunition depot. In 2011, Chung [10] conducted a blast pressure test in an ammunition depot, where the simulation was based on the Fluid–Structure Interaction (ALE) algorithm of ANSYS/LS-DYNA. While the test results showed that the error in the blast pressure value from the numerical simulation was great due to the restriction of mesh size, the behaviors of blast pressure were similar to the test. In 2012 [11], in order to address the restriction of mesh size, Hung utilized the latest Mapping Technique and used smaller mesh to simulate the high blast pressure of an explosion, which was gradually mapped into a bigger mesh of an ammunition depot, and the error between blast pressure and test value was reduced to less than 50%. In 2015 [12], Pi also utilized the Mapping Technique of ANSYS /LS-DYNA to simulate the impact of different types of channels and vent openings on blast pressure and validated the blast test results. The results showed that the Mapping Technique of ANSYS/LS-DYNA can be applied to simulate the transmission phenomenon of blast pressure in trajectories and vent openings in an ammunition depot, and the error between the simulated blast pressure value and test value was reduced to less than 50%.
The assessment methods of the power of an internal blast in the current specifications are described as follows.

2.1. Shock Pressure

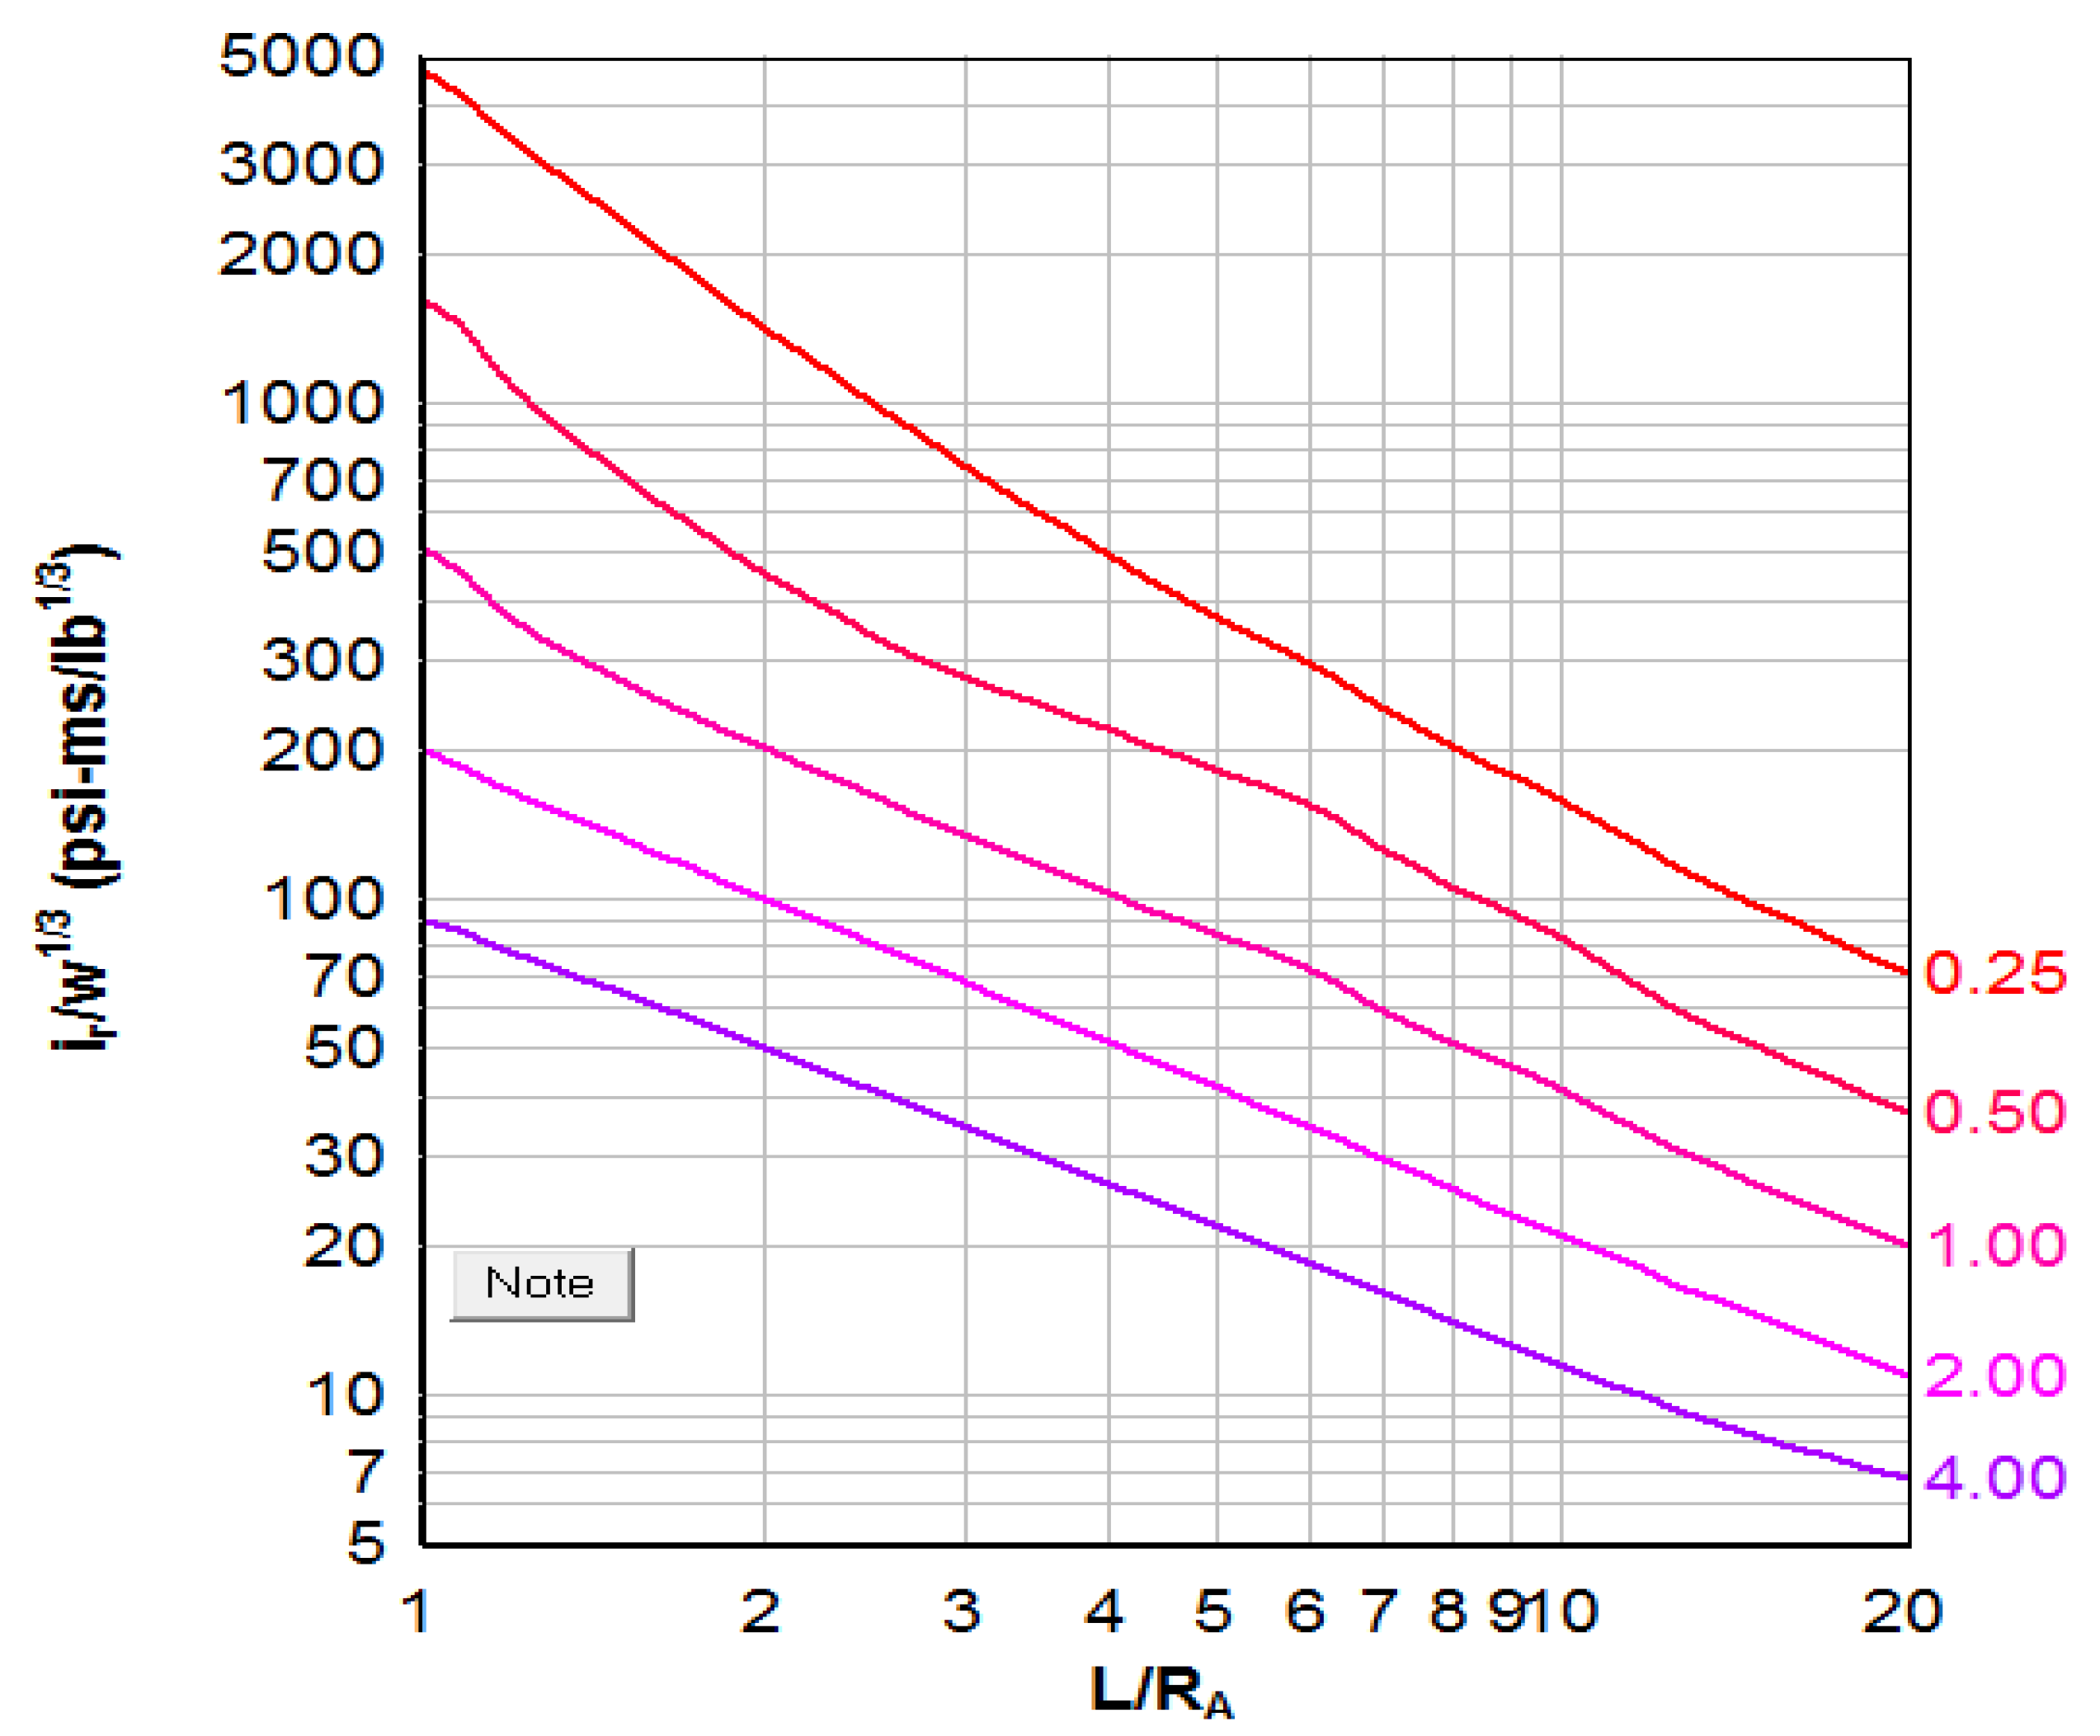
It is assumed in UFC 3-340-01 that the duration of the pressure applied on walls is of vertical incidence. The initial reflected pressure Pr and Ir, (Mpa) can be obtained by referring to Figure 1 regarding a blast in free air with the value of R/W1/3, where R denotes the distance between the blast point and the wall (m), and W denotes the weight of the charge (kg).
In UFC 3-340-02, there are different distances and angles of incidence from the blast point to the wall; thus, the uneven distribution of blast pressure and impulse are considered. To this end, equivalent and evenly distributed blast pressure and impulse on walls are directly calculated.
First, the value of N, and the corresponding values of h/H and l/L, are determined based on the resistant condition of the structure, as shown in Figure 2 and Table 1. Taking the resistant four sides and the resistant roof as an example, N = 4, the height from the blast point to the ground is h, the height of wall is H, the width of wall is L, and the distance between the blast point and the wall is l. h/H = 0.1, and l/L = 0.1. Evenly distributed blast pressure and impulse can be obtained by referring to UFC3-340-02, respectively as shown in Figure 3 and Figure 4.

2.2. Gas Pressure

Gas pressure is formed by internal blast pressure, which is subject to the confinement of the walls. Quasi-Static Pressure (Pqs) is obtained by directly referring to Figure 5. In UFC3-340-01 with the value of W/V, W denotes the weight of an equivalent TNT charge (kg) and V denotes the internal volume of the structure (m3).
However, no assessment method has been provided for gas pressure impulse and delay. The empirical equation regarding impulse (Ig, psi-ms) and delay (tb, ms) of CONWEP software [4] is recommended, as follows (British system).
For A / V 2 / 3 0.1
t g W 1 3 = 2.26 × ( A V 2 3 ) 0.86 × ( W V ) 0.29 l g W 1 3 = a × ( A V 2 3 ) 0.77 × ( W V ) b
For A / V 2 / 3 > 0.1
t g W 1 3 = ( W V ) 0.29 × e x p ( 1.0 0.01237 × log 10 ( A V 2 3 ) 0.09825 ) + 10.6864 t g W 1 3 = a × ( W V ) b × e x p ( 1.0 0.0206 × log 10 ( A V 2 3 ) 0.11614 ) + c
where
  • tg = duration of gas pressure
  • lg = total gas pressure impulse
  • W = charge weight in pounds
  • V = internal volume, cubic feet
  • A = vent area, square feet
  • a, b, c = constants (see below)
abc
W/V < 0.01518550.3615.41135
0.015 < W/V < 0.15409013.89943
W/V > 0.156430.2414.35186
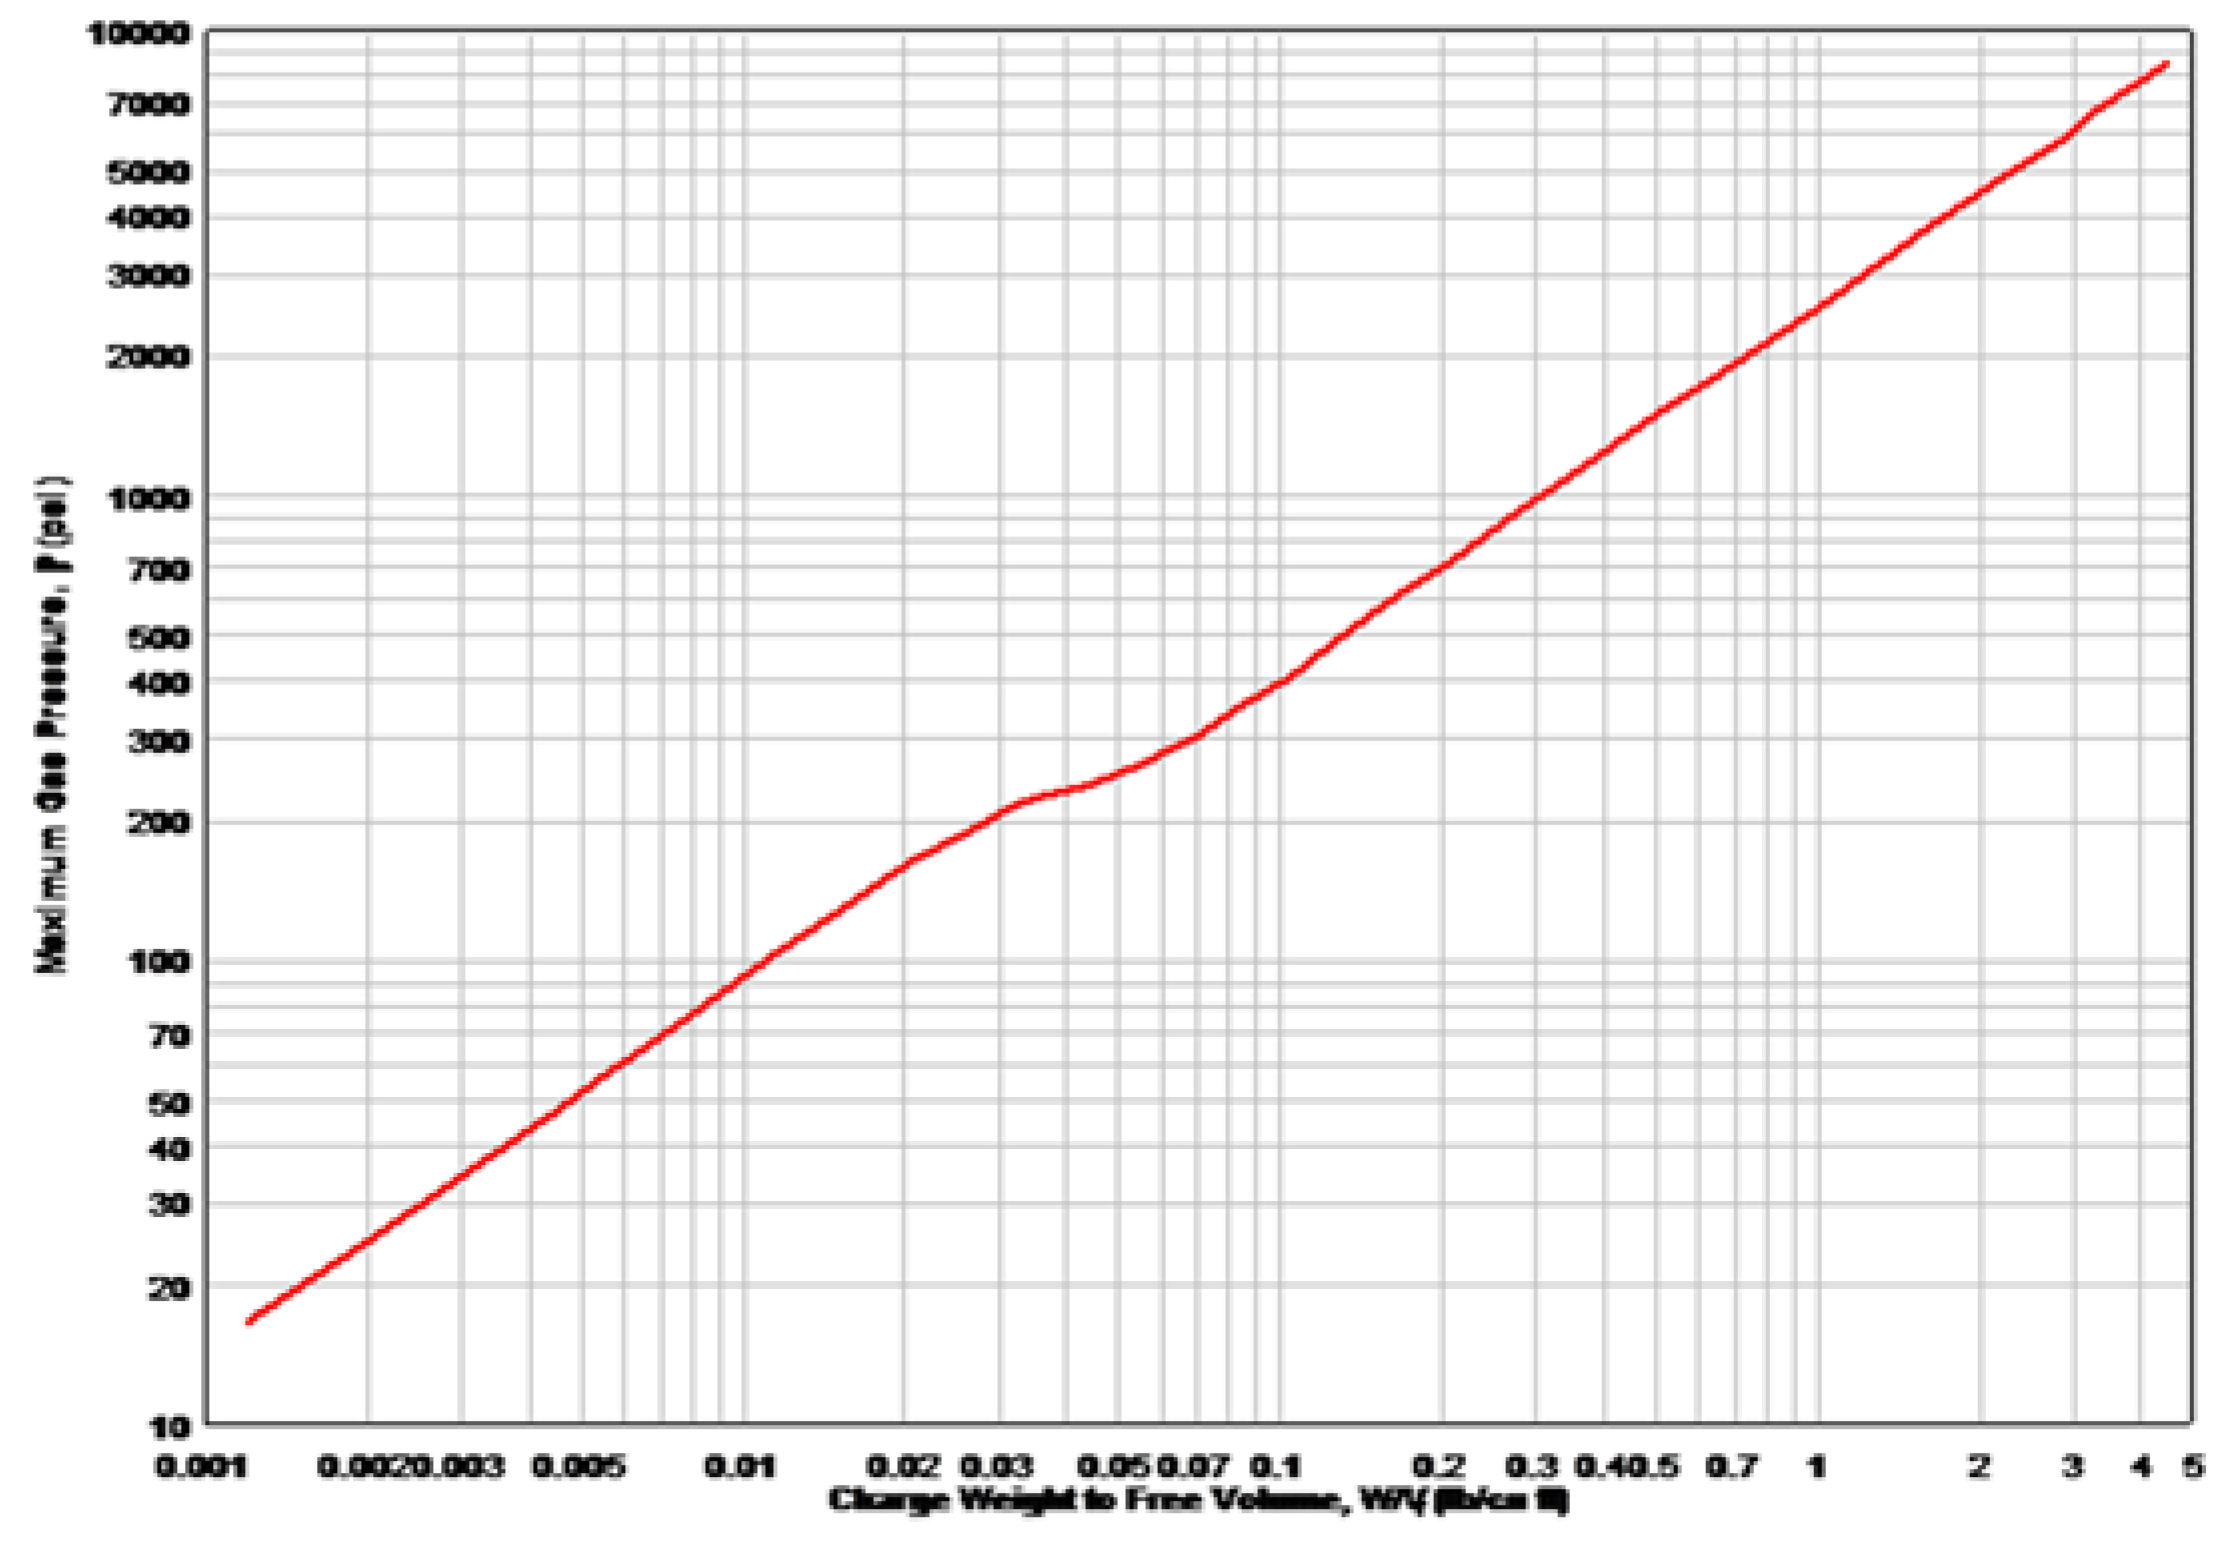
In UFC 3-340-02, Quasi-Static Pressure (Pqs) is obtained by referring to Figure 6, where W denotes the weight of an equivalent TNT charge (kg) and Vf denotes the Free Volume of the structure (m3).
Gas pressure impulse is obtained by referring to UFC3-340-02, with vent area, the ratio of the charge weight to the Free Volume of the structure, the weight of the materials of the vent surface, and shock pressure on the load-bearing wall is shown in Figure 7.
Blast pressure undertaken by the overall structure can be calculated by referring to tables according to the empirical equation, where the value is the sum of shock pressure and gas pressure, as shown in Figure 8.

2.3. Leakage Pressure

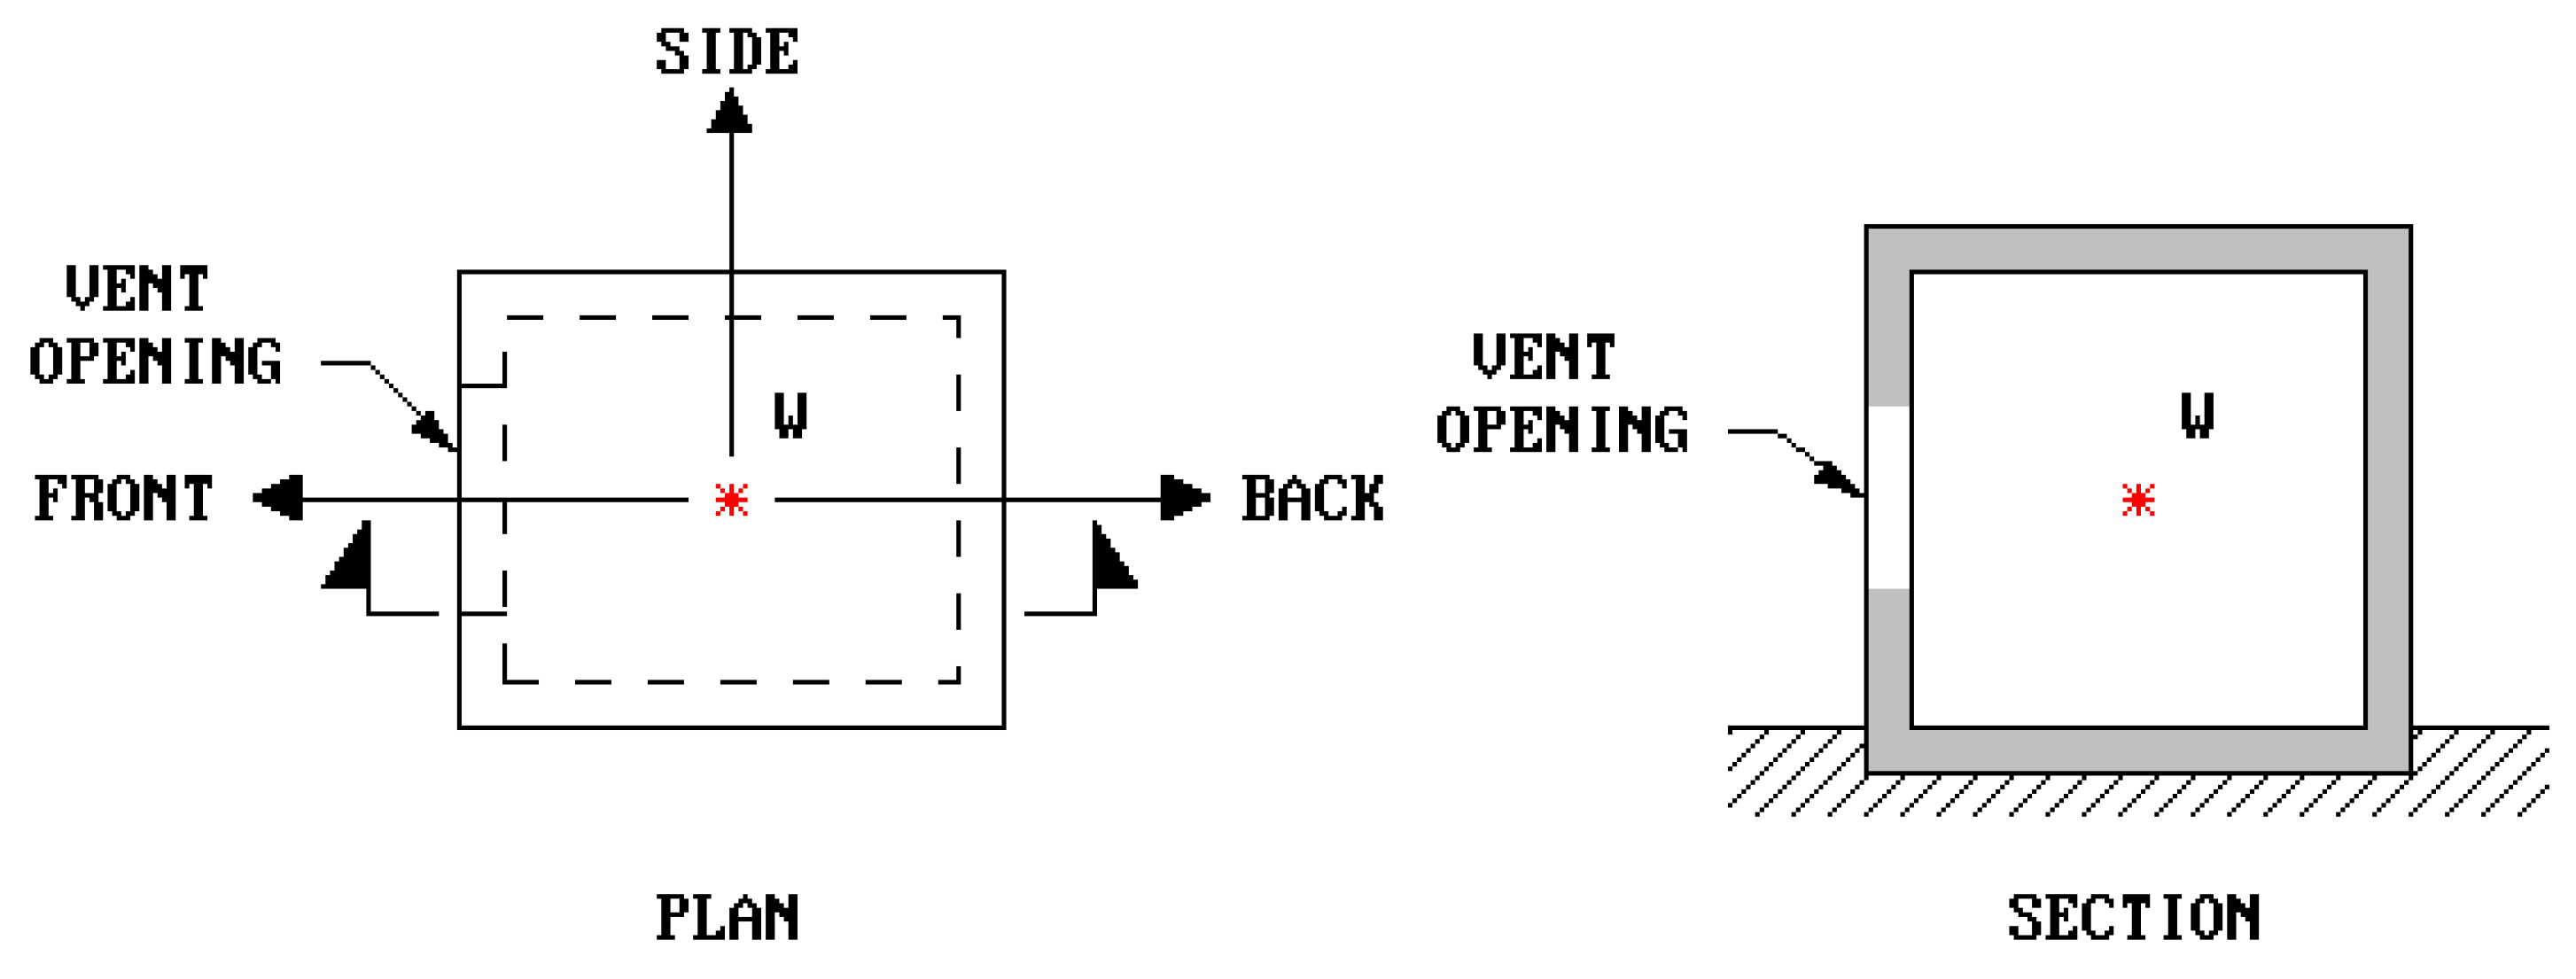
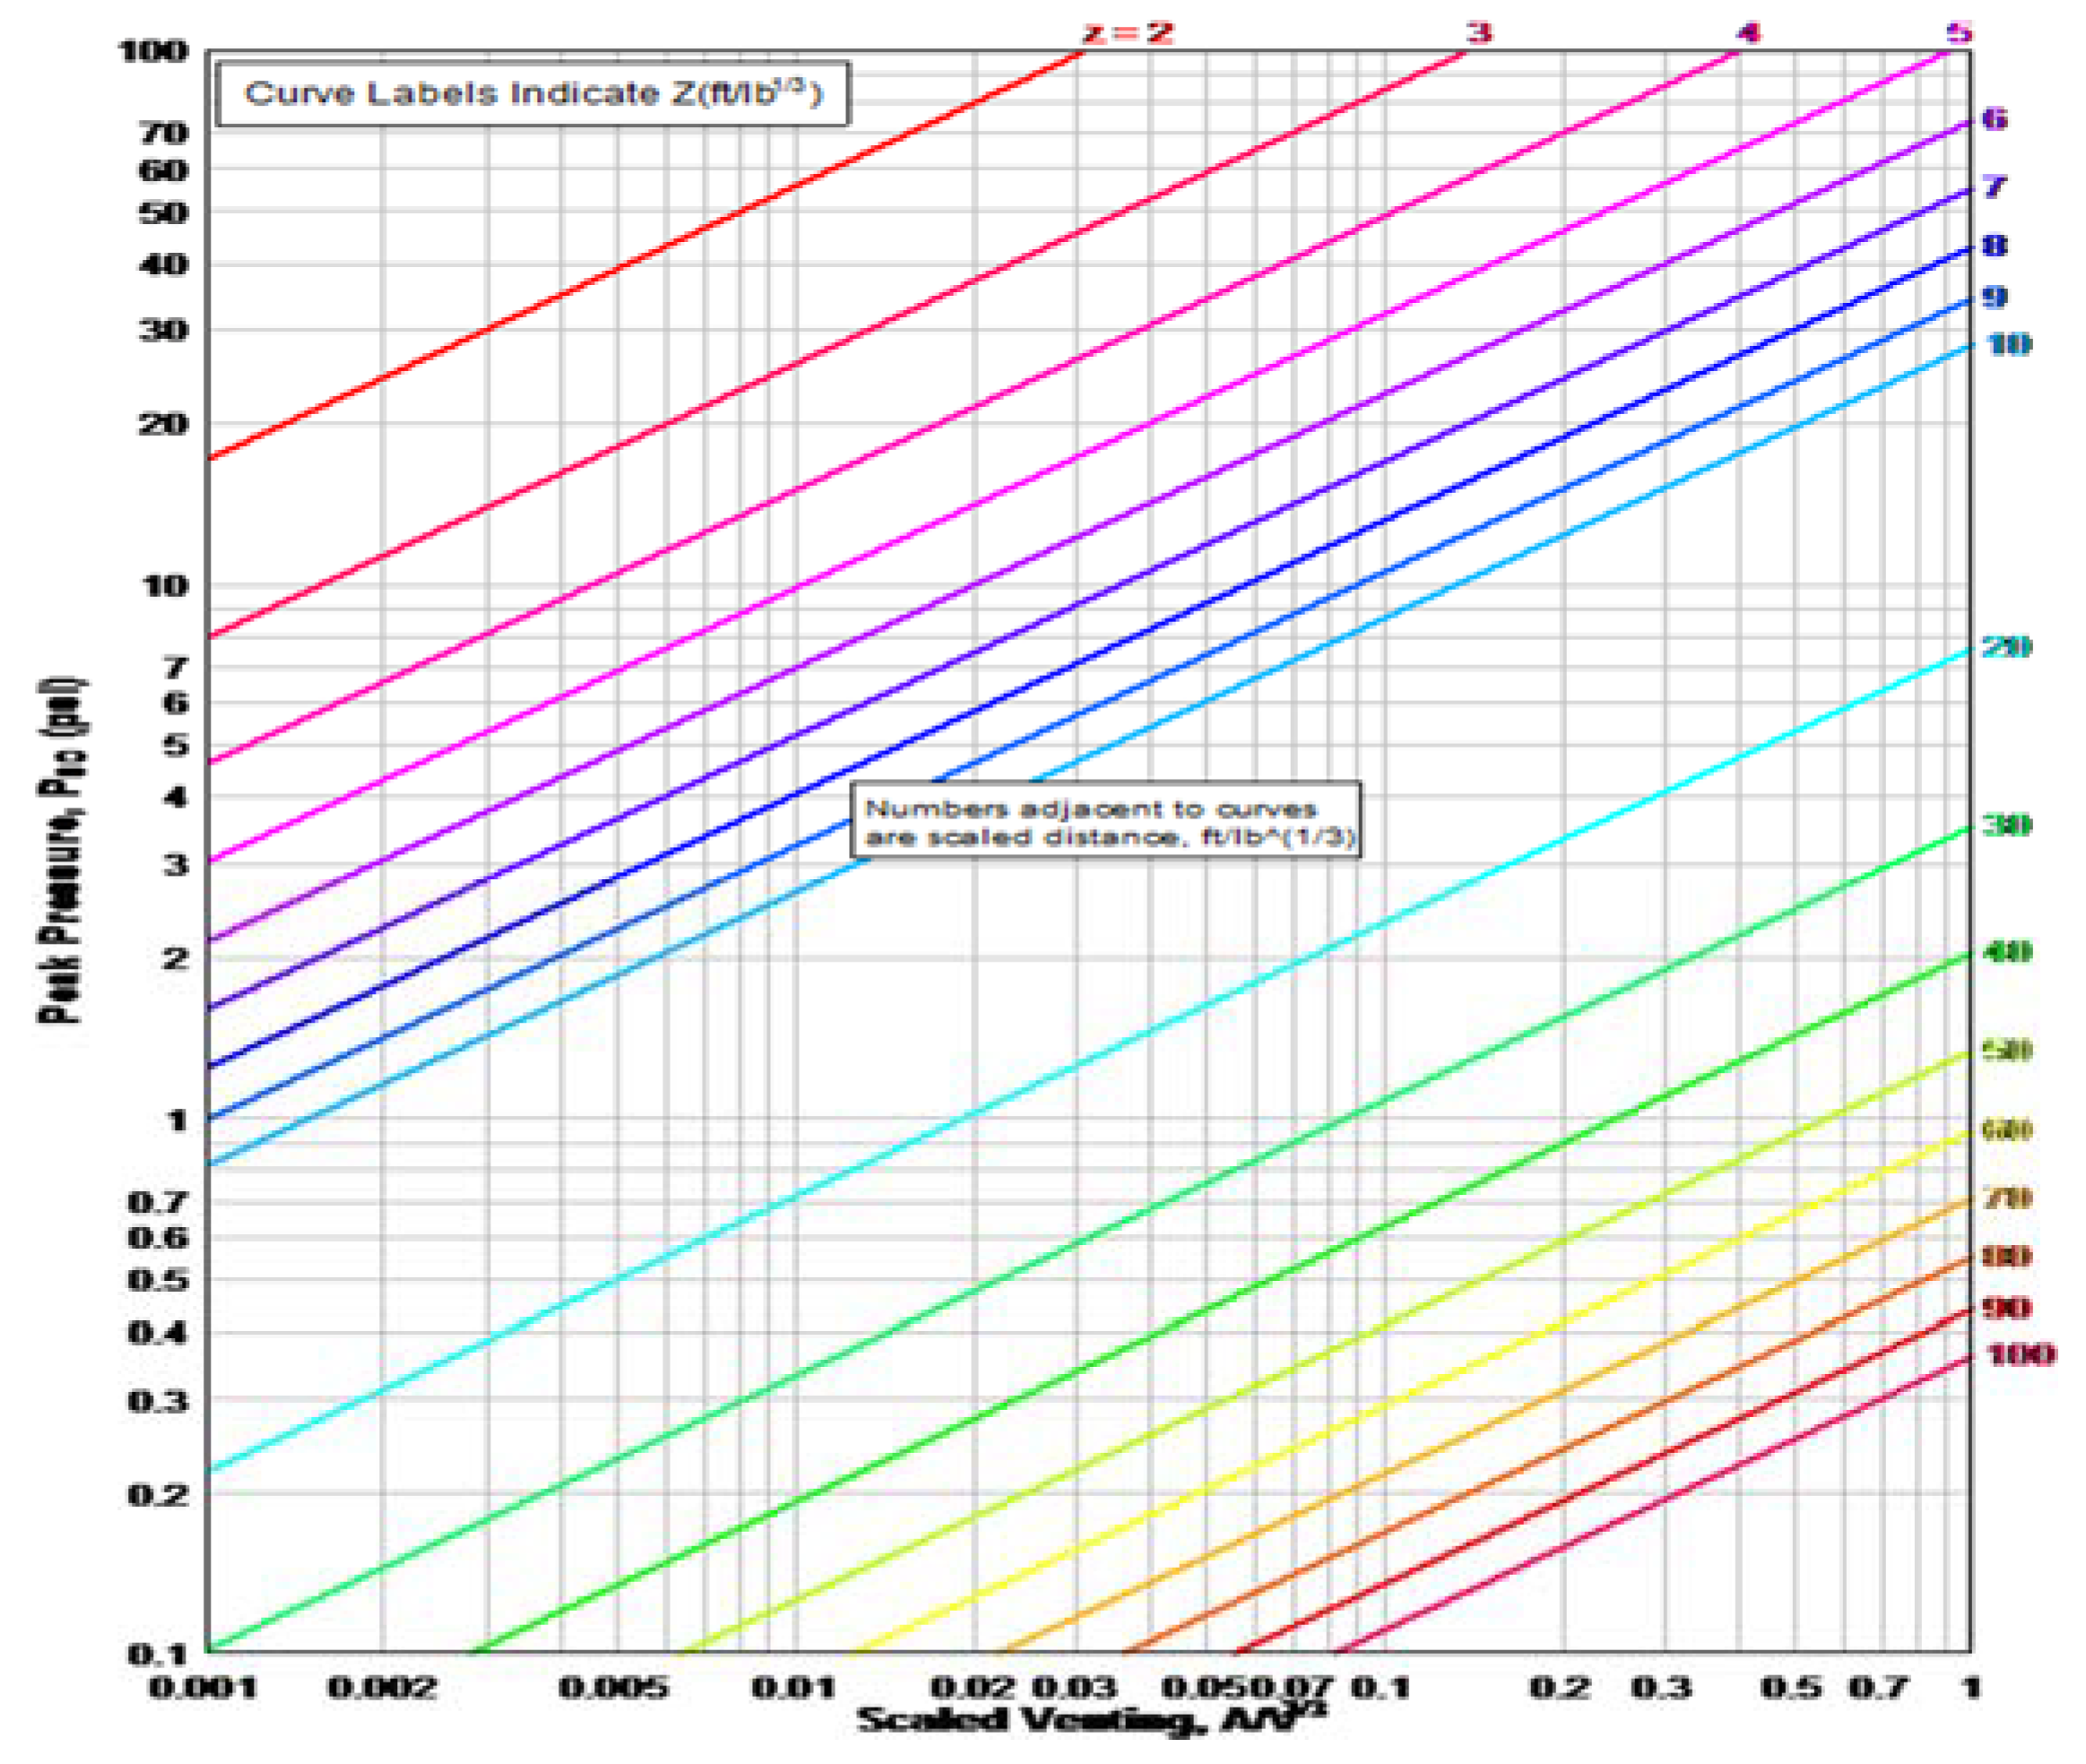
While no explicit assessment method is proposed in UFC3-340-01, the assessment methods regarding the restraint condition, vent opening location, and the area of the structure are proposed in UFC3-340-02. Taking the resistant four sides and resistant roof as an example, the vent opening is located on the wall, as shown in Figure 9. The blast pressure at the front of the vent opening location is obtained by referring to UFC3-340-02 as shown in Figure 10. The leakage pressure can be used as a reference for determining the safety range of an ammunition depot.

3. Numerical Simulation

In 1976, the Lawrence Livermore National Laboratory (LLNL) National Institute, USA, under the leadership of Dr. Hallquist, jointly developed the ANSYS/LS-DYNA numerical simulation software [13]; among which, the ALE Fluid–Structure Interaction algorithm and the Mapping Technique algorithm [14,15,16] can be applied in the computation of a blast in ALE 3D free air. The computation results can be respectively mapped into relevant blast models for computation. Such computation and Mapping Technique can ensure the accuracy of shock pressure and compare simulation results with the tests and empirical equations found in literature to validate the applicability of the models.
In numerical simulation, air and charge are set as Eulerian Mesh and the fragile wall is set as Lagrangian Mesh by applying the ALE Fluid–Structure Interaction algorithm, which together form a numerical model of fluid–structure interaction. Subsequently, an ammunition depot is assumed as a rigid body to discuss the impact of the size and location of the vent opening on leakage pressure. Then, the ammunition depot is assumed with plastic behavior to discuss the impact of the thickness and strength of fragile walls on leakage pressure. The empirical equation of a blast in a free space, as set forth in the UF3-340-01 Handbook [4] of the US Army, is used for comparison with numerical simulation in order to confirm the accuracy of shock pressure in mapping. In addition, the empirical equations regarding an internal blast, as set forth in the UFC3-340-01 and UFC 3-340-02 Handbooks [4,5], are used to validate and compare with the computation result of numerical simulation.

3.1. ALE Fluid–Structure Interaction Algorithm

The strength of the ANSYS/LS-DYNA procedure [13] lies in its capability of dealing with the nonlinear and large deformations of three-dimensional structures, and it is particularly applicable to solve high velocity impact, blast, and other issues of three-dimensional nonlinear structures. The descriptive methods of its mesh are mainly divided into Lagrangian Description (Material Description), Eulerian Description (Space Description), ALE Description, and SPH Description (Smoothed Particle Hydrodynamics). The first three descriptions are used in this study as materials for computation, which are detailed as follows:

3.1.1. Lagrangian Description

The Lagrangian Description is applicable to the stress–strain analysis of solid structures. Meshes are overlapped with material nodes, and in computation, all meshes move along with the material nodes. While the deformation of structures is consistent with the deformation of meshes, other substances will not flow among the meshes. The main contribution of the description is to accurately describe the movement at the boundary of the structures and track the interfaces between the free surface and different materials. However, the weakness of the description is the severe distortion of the meshes in the case of significant deformation of the structures, which will lead to difficulties and interruption of the numeric computation. Thus, meshes must be reorganized or hourglass control is required to address the issue and continue the computation. Regarding the transient nonlinear dynamic issue of a blast, the discussion of the damage type caused by the movement of materials and stress in the instant of a blast is recommended.
In the numerical simulation analysis of a blast, the use of the Lagrangian Description will contribute to more accurate analysis. If the change in the shape of the analyzed object is exactly consistent with the change in the finite element mesh (element mesh nodes are material points), the materials will not flow among the elements, but they will result in a negative volume of the meshes, which is caused by severe distortion, and computation will be terminated. Computation can be continued if the element erosion condition is incorporated.

3.1.2. Eulerian Description

The definition of the Element Mesh is based on space coordinates, and it is fixed herein. While the Computation Mesh is fixed, the Element Mesh and the object to be analyzed are independent of each other; thus, only material points will move within the meshes when the object moves or deforms. The main contribution of the description is to easily address the issue of significant deformation, while the weakness of the description lies in the necessity of planning a larger flow space, in order to include all description substances for analysis, as well as the relatively longer time required for such analysis and computation. This description is often applied for analysis regarding fluid and gas, such as the analysis of blast pressure in blast simulation.

3.1.3. ALE Description

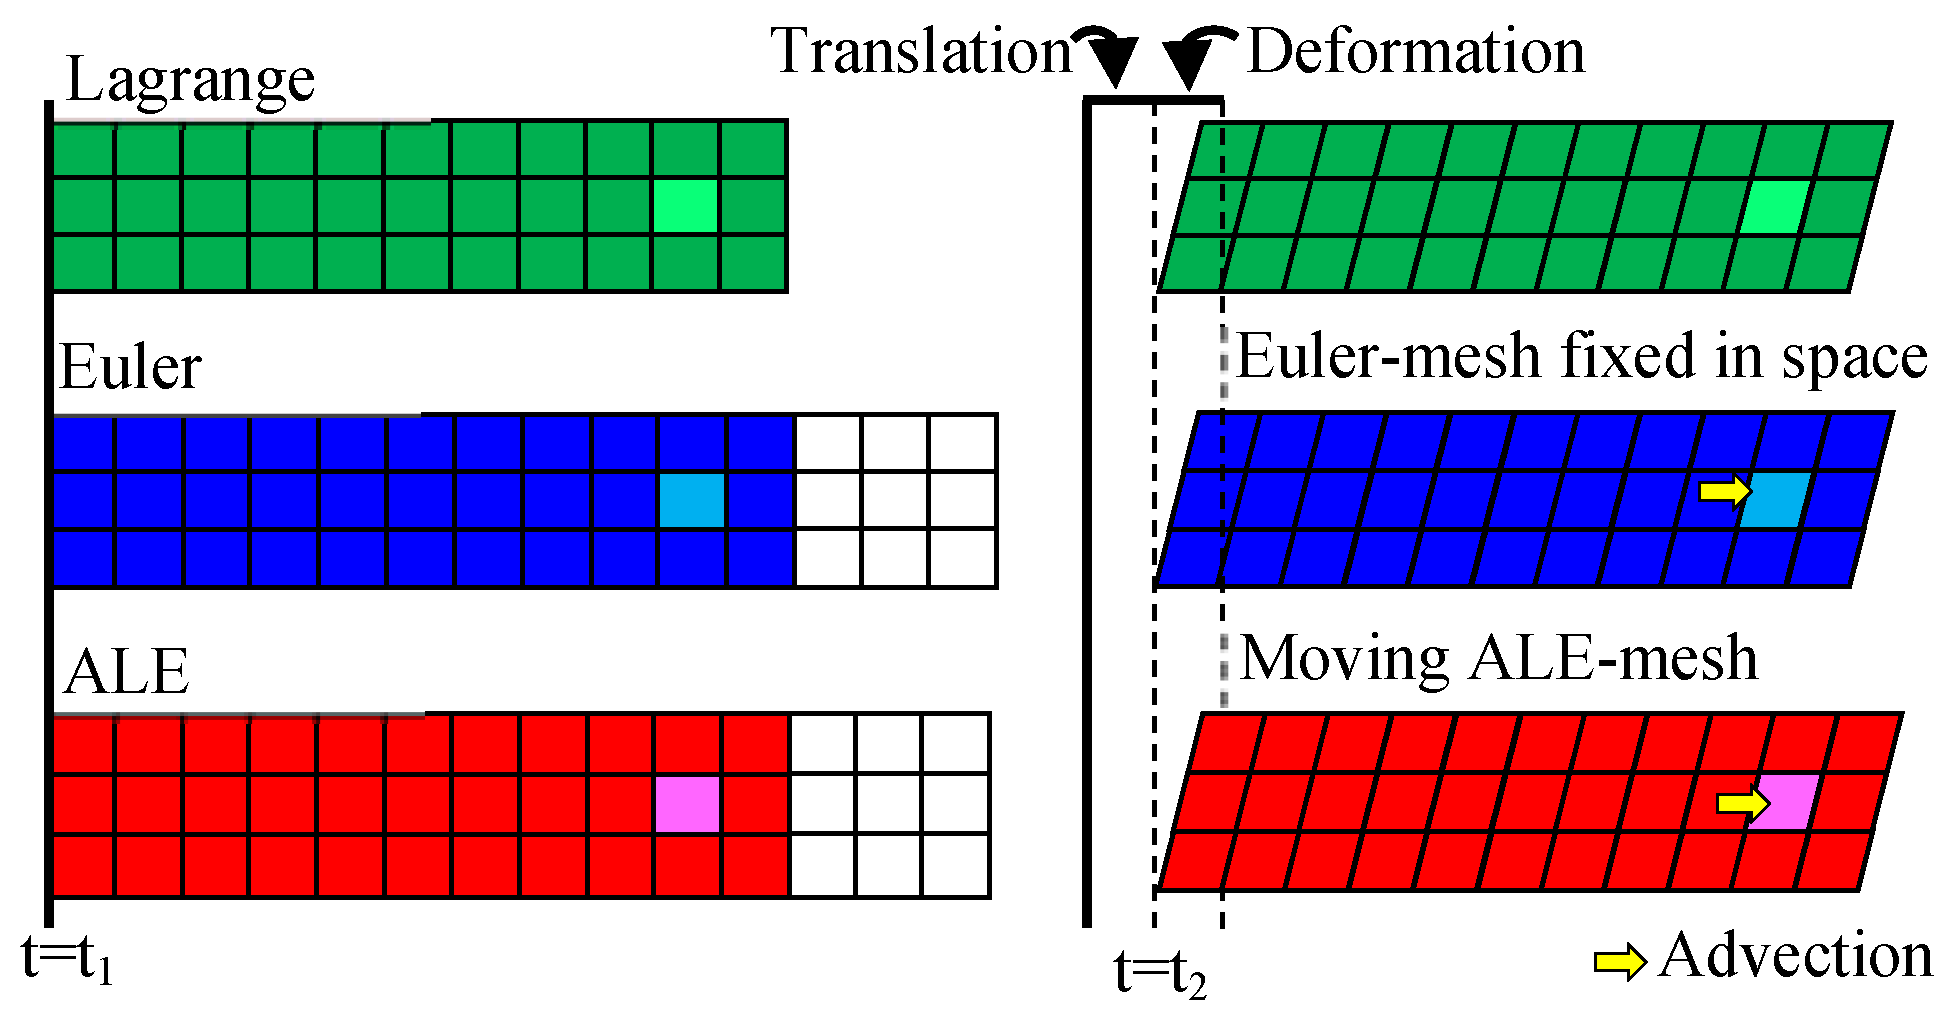
In terms of computation, the ALE Description integrates the features of Lagrangian Description and Eulerian Description, where the incorporated features of the Lagrangian Description deal with the movement at the boundary of the structures, in order to effectively analyze the movement at the boundary of structures. Regarding air and charge, the features of the Eulerian Description in terms of computation have been used to enable the Element Mesh to be independent from the material substance to be analyzed. In the ALE Description, the Space Mesh can be adjusted by moving any nodes in the process of finding a solution, as based on the defined parameters, to prevent the mesh from severe deformation. Moreover, substances can flow among the meshes, which is very beneficial in analyzing the issue of significant deformation. Such an algorithm can be used to overcome computation failure, as resulted from the severe deformation of the mesh, and avail the dynamic analysis of Fluid–Structure Interaction; i.e., the Eulerian Description is used for fluids, while the Lagrangian Description is used for solids, as shown in Figure 11. It can be seen from Figure 11 that the material points move along with the continuous deformation of the object. In computation, the computation of the time step of one or more Lagrangian meshes will be initially executed by the ALE Description. At this moment, the mesh units will be deformed along with the flow of materials, and computation of the ALE time step is subsequently executed; its computation modes can be divided into a Smooth Step and Advection Step. The Smooth Step reorganizes the meshes internally in order to maintain the boundary conditions of the object after deformation; thus, the mesh extension relation will remain unchanged. The Advection Step inputs the unit variables (density, energy, stress tensor, etc.) of the deformed meshes and node velocities into reorganized meshes.
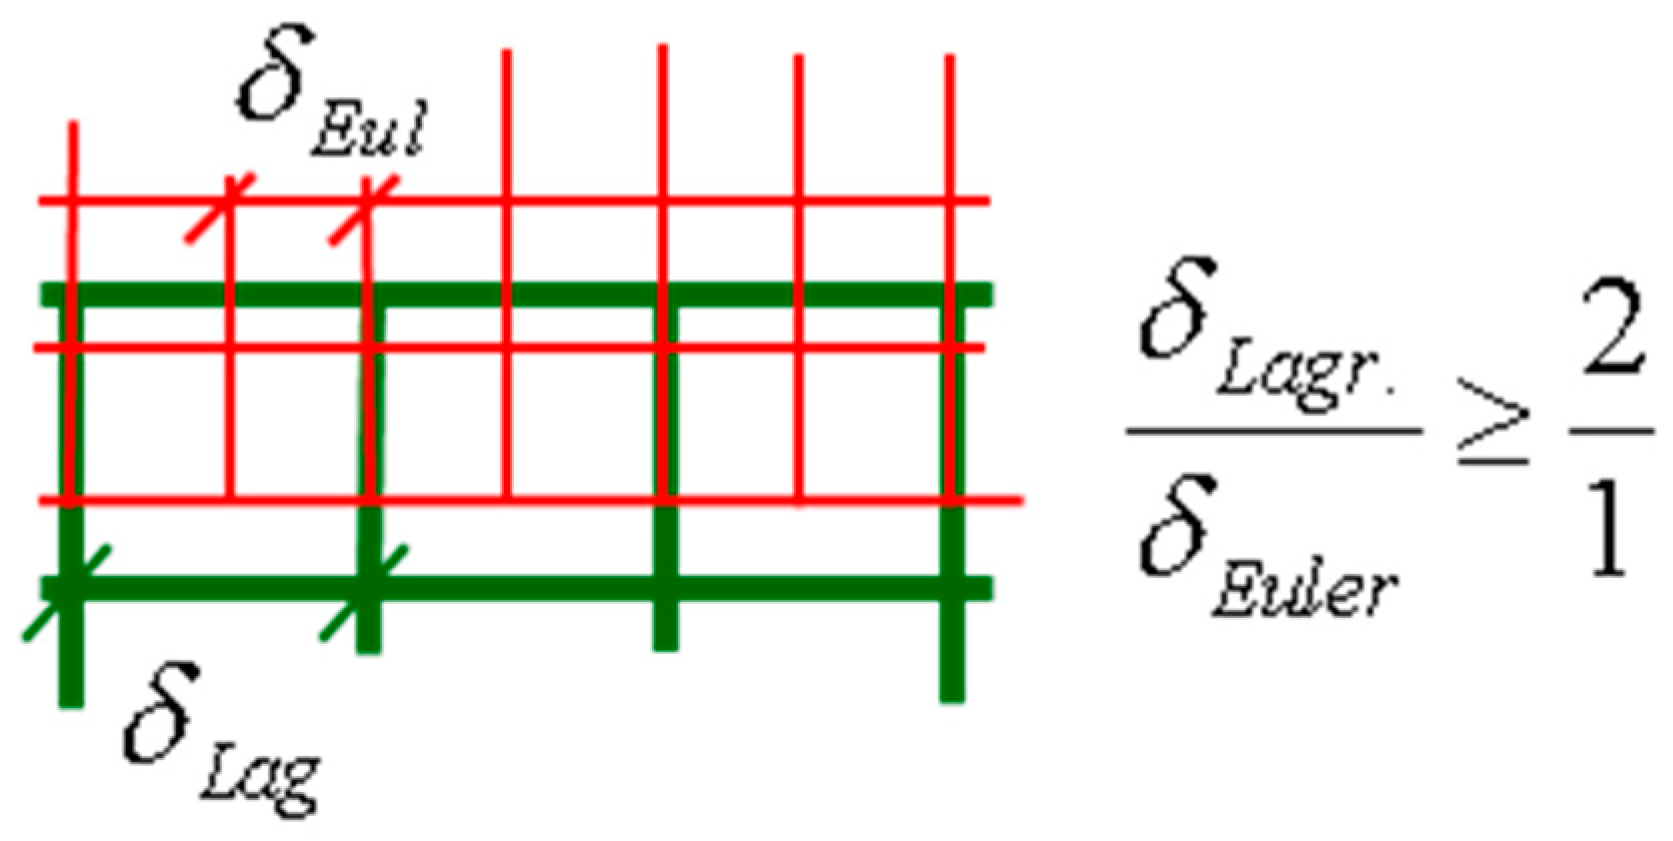
The Fluid–Structure Interaction analysis of a blast meets the features of ALE computation, which consider the method of liquid description and are able to complete the dynamic analysis of Fluid–Structure Interaction. Therefore, in this study, charge and air materials are set as ALE meshes, while the walls, ground, and other materials are set as Lagrangian meshes, in order to facilitate the dynamic analysis of Fluid–Structure Interaction. Regarding the establishment of analysis meshes, liquid meshes and solid meshes are established by overlaying the meshes, where the number of solid meshes shall be at least two times as many as the fluid meshes, as shown in Figure 12.

3.2. Law of Material Composition

Materials required for numerical simulation are divided into four categories: air, charge, concrete, and rigid body. The constitutive laws of the materials are set out below.

3.2.1. Air

Regarding air material, this study used the No.9 MAT_Null material model of ANSYS/LS-DYNA. The state equation was also used in conjunction with the material model due to the great volumetric change of air material in a blast reaction. Set out below is the state equation:
P = C 0 + C 1 μ + C 2 μ 2 + C 3 μ 3 + ( C 4 + C 5 μ + C 6 μ 2 ) E 0
E 0 = ρ i n i t i a l C v T
where P denotes air pressure, E 0 denotes initial internal energy per unit reference specific volume, μ = ρ c u r r e n t ρ i n i t i a l 1 , C i ( i = 0 ~ 6 ) denotes the control coefficient, ρ i n i t i a l denotes the initial density of air, and ρ c u r r e n t denotes the current density of air.
The above state equation is used for describing the air as the ideal gas, where control coefficients C 1 , C 2 , C 3 , and C 6 must be set at 0, and C 4 = C 5 equals γ 1 , air γ = 1.4 ; γ denotes the ratio of specific heats; C ν denotes the specific heat at a constant volume of air (0.7165 k J k g K ); and T denotes the initial temperature of air. Equation (5) can be further simplified as follows:
P = ( γ 1 ) ρ c u r r e n t ρ i n i t i a l E 0 + C 0 .
When the scope of the initial temperature of air is assumed from 273.15 to 3000 k, the initial internal energy of air E 0 and C 0 parameters are set, as shown in Table 2. In this study, the actual temperature of air material was 288.15 K (15 ℃).
The input parameters required for air material include the Mass Density (Ro), Pressure Cutoff (Pc), Dynamic Viscosity Coefficient (Mu), Relative Volume (Terod, Cerod), Young’s Modulus (Ym), and Poisson’s Ratio (Pr) of the material. The setting values of the parameters are shown in Table 3. The Dynamic Viscosity Coefficient is obtained through the Sutherland equation, as shown in Equation (6)
Mu = 0.68 × 10 2 T + 122 ( T 273 ) 3 2   ( Pa s )

3.2.2. Charge

Regarding the charge material, the No.8 MAT_High_Explosive_Burn material model of ANSYS/LS-DYNA was used to simulate a high-explosive charge. For example, the parameters of the TNT charge were set with reference to the setting values in the LLNL Explosives Handbook [16]. Parameters to be set include the Mass Density (Ro), Detonation Velocity (Dv), Chapman–Jouget pressure (Pcj), Beta Burn Flag (Beta), Bulk Modulus (K), Shear Modulus (G), and Yield Stress (Sigy). The setting values of the parameters are shown in Table 4, which are in conjunction with the Eos_Jwl state equation.
P = A ( 1 ω R 1 V r ) e R 1 V r + B ( 1 ω R 2 V r ) e R 2 V r + ω E 0 V r
where parameters A , B , R 1 , R 2 , ω , etc. are equation coefficients, P denotes pressure, V r denotes the initial relative volume, and E 0 denotes the initial internal energy per unit reference specific volume.

3.2.3. Concrete

In the simulation of a non-contact blast in concrete, the No.72R3 MAT_Concrete_Damage_Rel3 material model was used. Such material was developed based on No. MAT_16 and mainly consists of pure concrete material. Three shear failure surfaces are used as the failure criteria of the materials, i.e., the three failure curves include the maximum shear failure surface, initial yield surface, and residual failure surface, as shown in Figure 13. In setting the parameters, only the compressive strength of concrete is required to be input, while other parameter values are automatically generated by the system. The required input parameters include the Mass Density (Ro), Poisson’s Ratio (Pr), compressive strength of concrete ( f C , A0), length unit conversion factor (Rsize), and pressure unit conversion factor (Ucf), as shown in Table 5. Such a material model can be used in conjunction with strain rates and dynamic amplification coefficients for computation. The input values are shown in Table 6.

3.2.4. Rigid Body

Regarding the numerical simulation of the ground, the No.20 MAT_Rigid material model was used, where the required input parameters include Mass Density (Ro), Young’s Modulus (E), and Poisson’s Ratio (Pr), as shown in Table 7.

3.3. Application of Simulation Technique

In order to improve the accuracy of numerical simulation regarding blast pressure in a close-range blast, fine mesh size and ALE Fluid–Structure Interaction are commonly used. However, with the increasing number of meshes, various issues, such as restrictions on the analysis model and mesh size, have been derived therefrom. In order to address this issue, in this study, the ANSYS/LSDYNA Mapping Technique was used for numerical simulation in testing to overcome the limit and increase the accuracy of numerical simulation computation.
In this study, due to a large-sized ammunition depot, a large-scale numerical model was required, which led to long computation time; therefore, the ANSYS/LSDYNA Mapping Technique was utilized. A small model was first utilized for the blast simulation; then, the simulation was gradually mapped to a large model. Finally, blast pressure was applied to the vent opening and walls of the ammunition depot to save computation time. Element erosion conditions were incorporated to remove elements subject to severe distortion due to the termination of computation, which was a result of a negative volume of wall meshes due to severe distortion.
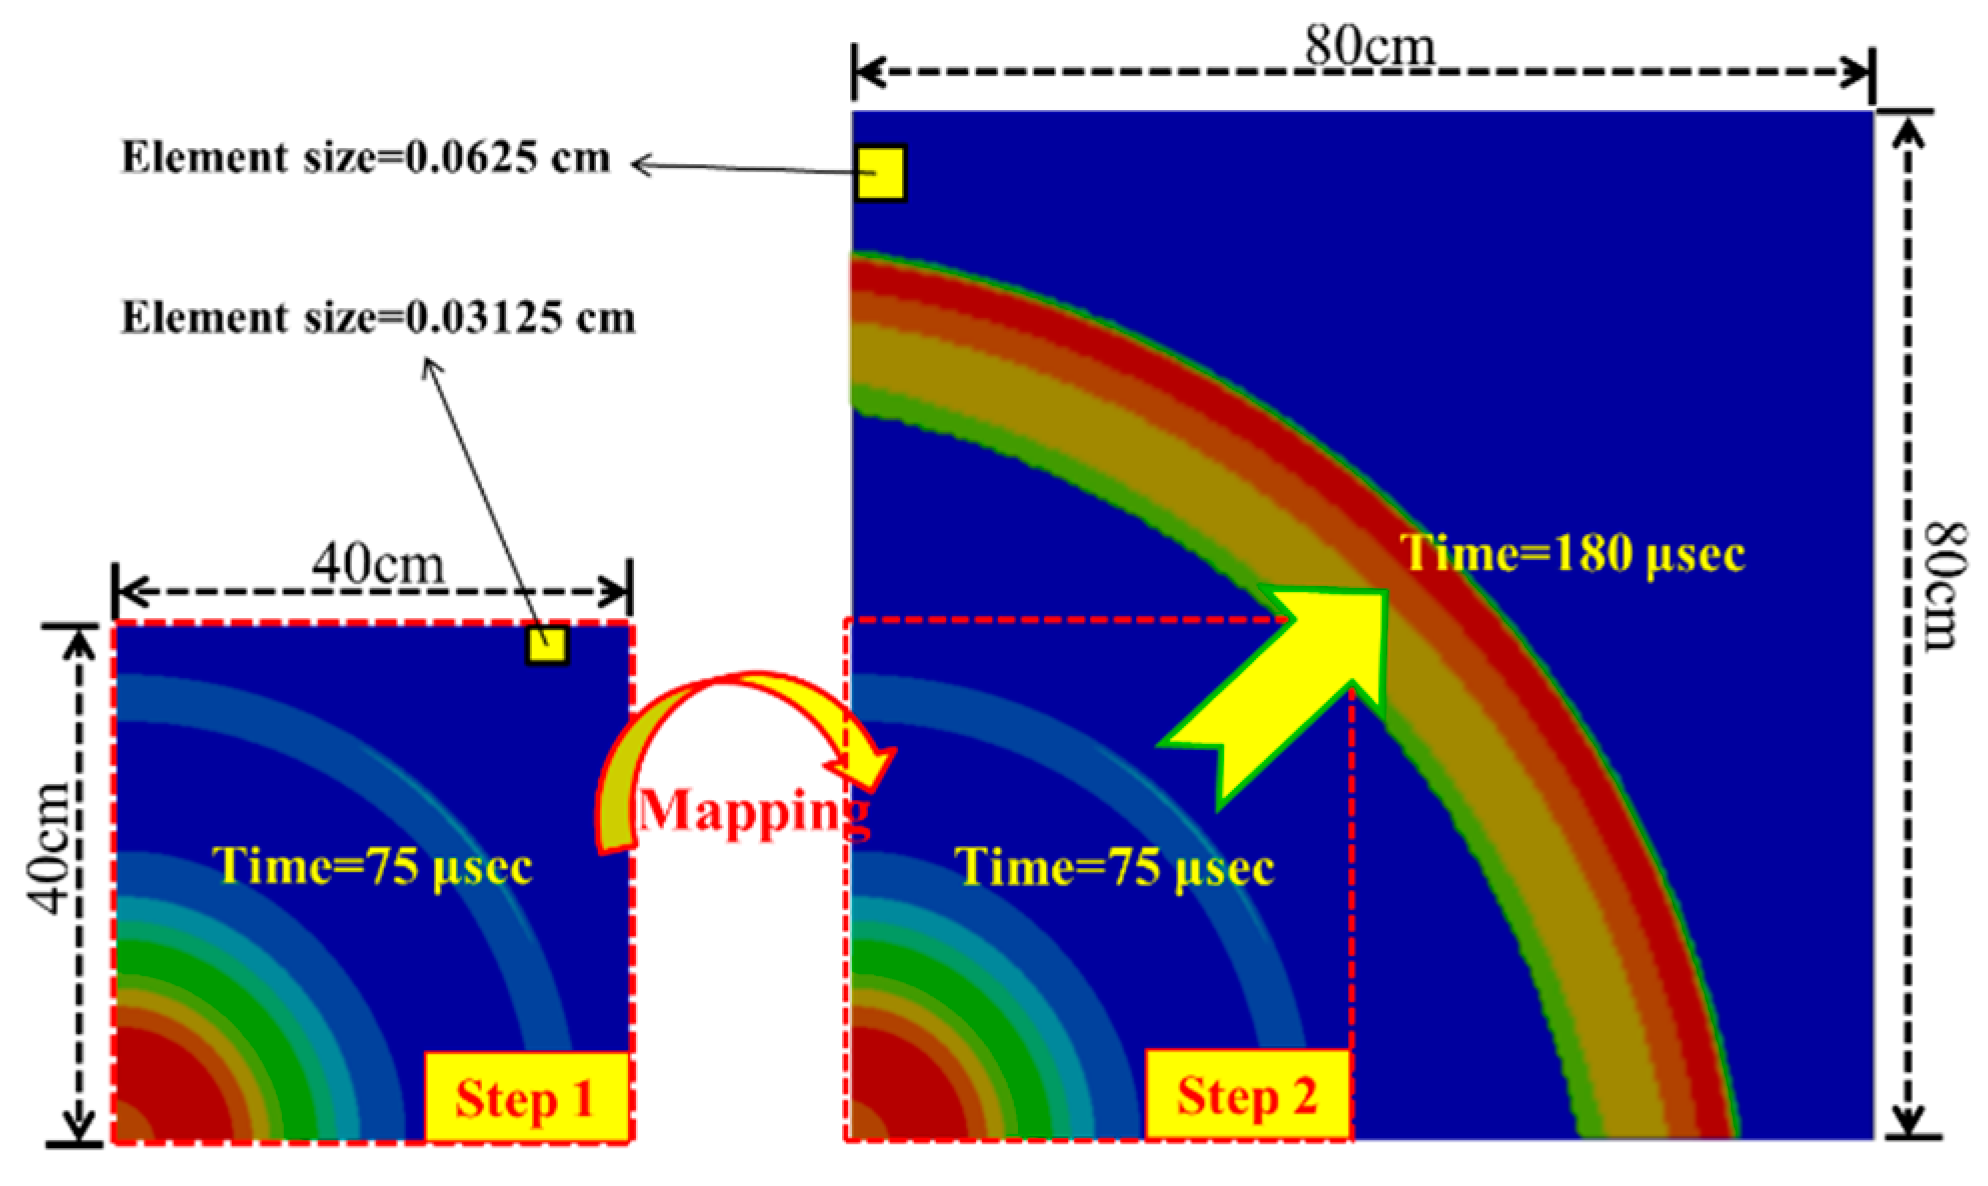
Regarding the application of the Mapping Technique in a blast in free air with an 80×80 cm computation model; for example, the side length of the element was set at 0.03125 cm and the model was divided into more than 6 million elements, in order to increase the accuracy of simulation. Such a huge number of elements will lead to time-consuming computation. If the side length of the element was set at 0.0625 cm, and the number of elements was more than 1 million, while computation efficiency was improved, the computation accuracy was ignored. In order to maintain both the accuracy and efficiency of computation, the Mapping Technique was used to address this issue, and its computation steps are shown in Figure 14. Step 1, meaning the side length of the element, was set at 0.03125 cm, the boundary size of the model was set as a 40×40 cm model of a blast in free air, and simulation computation was ceased upon the arrival of blast pressure at the boundary. Step 2 implemented numerical imaging, where the size of the elements (0.0625 cm) and boundary (80 × 80 cm) of the model were scaled up two times; the blast pressure computation result from the 40 × 40 cm model was taken as the initial value for the 80 × 80 cm model, and then, computation was continued.
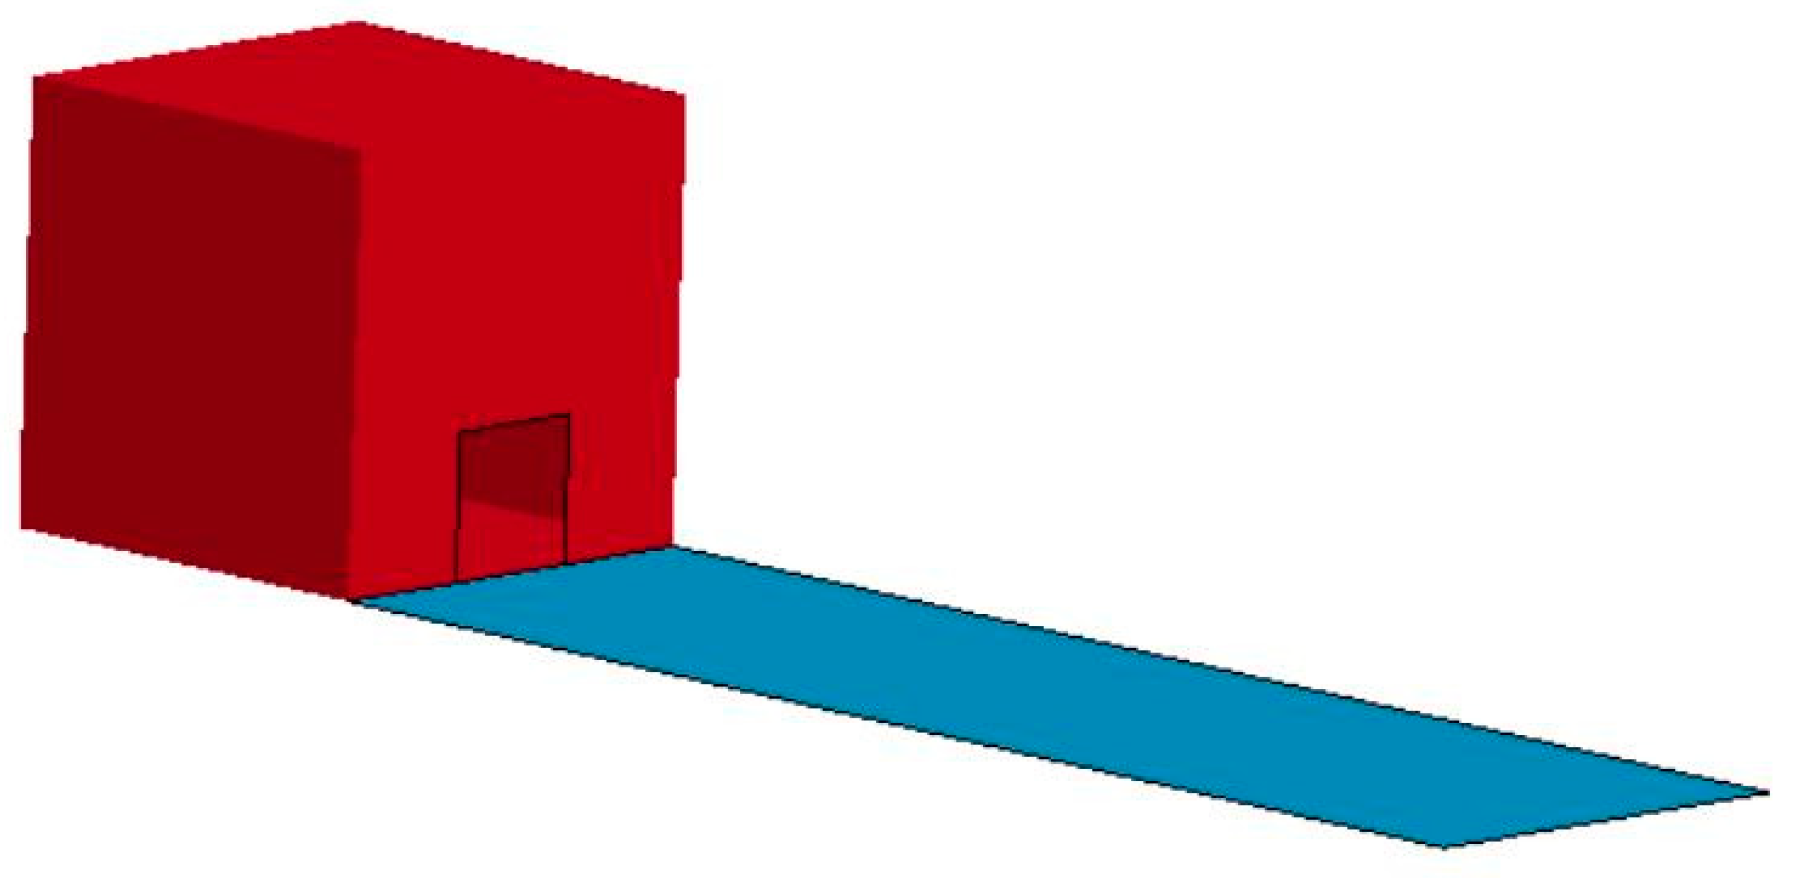
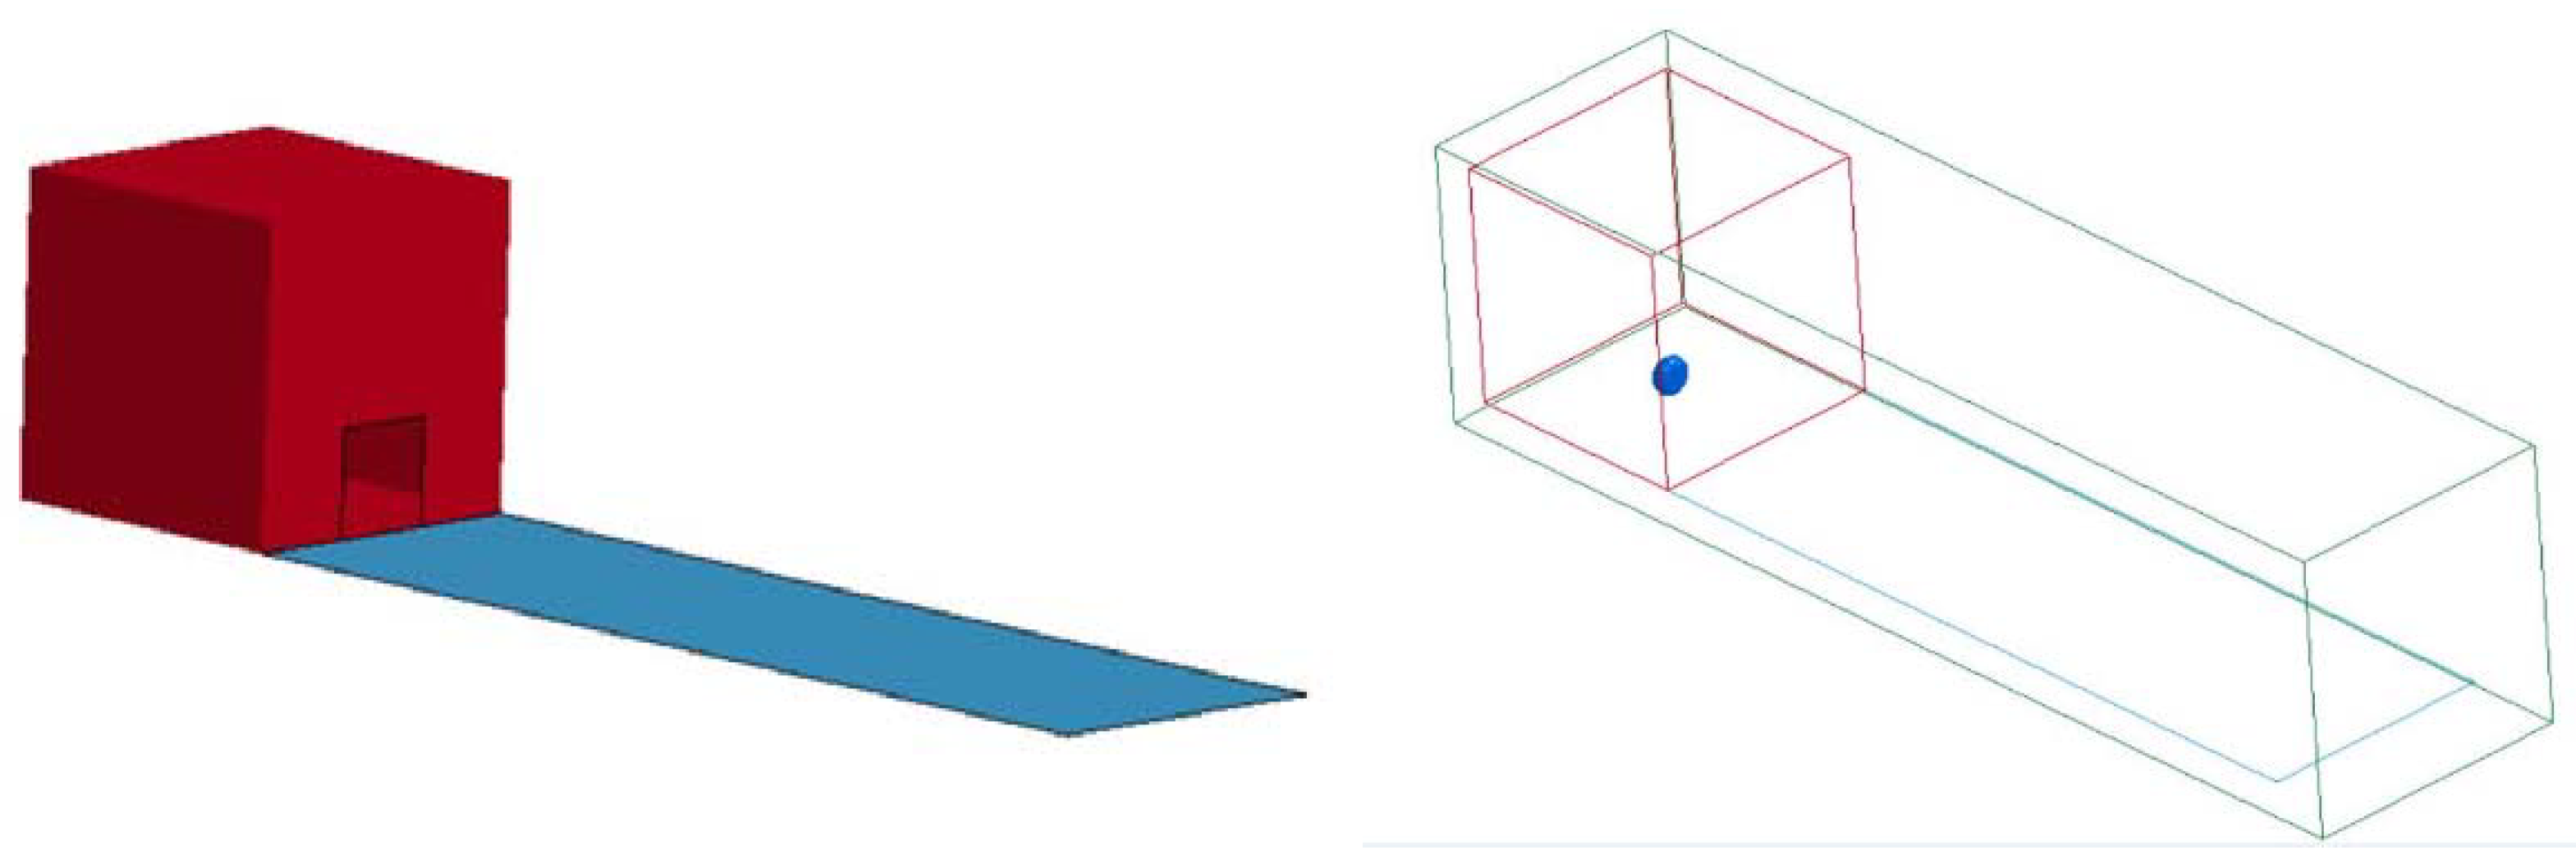
The overall ALE Fluid–Structure Interaction numerical model of the internal blast in the ammunition depot was assumed as a cube (structure length: 60 cm, width: 60 cm and height: 60 cm, the ground length: 240 cm, width: 60 cm, and thickness: 1 cm), and it was assumed as a rigid body, as shown in Figure 15. Mapping is ceased when the blast pressure is mapped close to walls, and ALE Fluid–Structure Interaction computation is implemented in order to assess the external blast pressure value, as a result of the blast wave leaking through the vent opening in the wall. In the case of a fragile wall, element erosion is generated by the wall in order to simulate blasting through the fragile wall (Figure 16).

4. Simulation Results

Considering that the limitations of computer memory and the internal blast in the ammunition depot are mainly affected by the volume of the ammunition depot and vent area, the ammunition depot was assumed as a cube (structure length: 60 cm, width: 60 cm and height: 60 cm, wall thickness was 1 cm; ground length: 240 cm, width: 60 cm, and thickness: 1 cm), and it was assumed as a rigid body. The air volume must cover the structure and ground, length: 260 cm, width: 80 cm, and height: 70 cm. A vent area opening of a 20 cm2, 40 cm2 or 60 cm2 vent was set in a wall, one pound or 1/8 pound of TNT was placed in the ammunition depot, the blast point was set at the center of the plane of the ammunition depot, and the height from the ground to the blast point was 10 cm, 20 cm, or 30 cm. The finite element model is shown in Figure 17: the air element is 0.5 cm3, the mapping is 0.25 cm3, and the wall is 1 cm3.
Regarding the discussion of blasting through concrete, the MAT72R3 material model was used with compressive strengths of 3000 psi, 4500 psi, and 6000 psi, wall thicknesses of 3 cm, 5 cm, 7 cm, and 10 cm, without vent openings. The blast point was moved to 10 cm in front of the wall, with a blast height of 10 cm. The erosion condition of the concrete was the maximum shear strain of 0.004.

4.1. Impact of Vent Opening Size

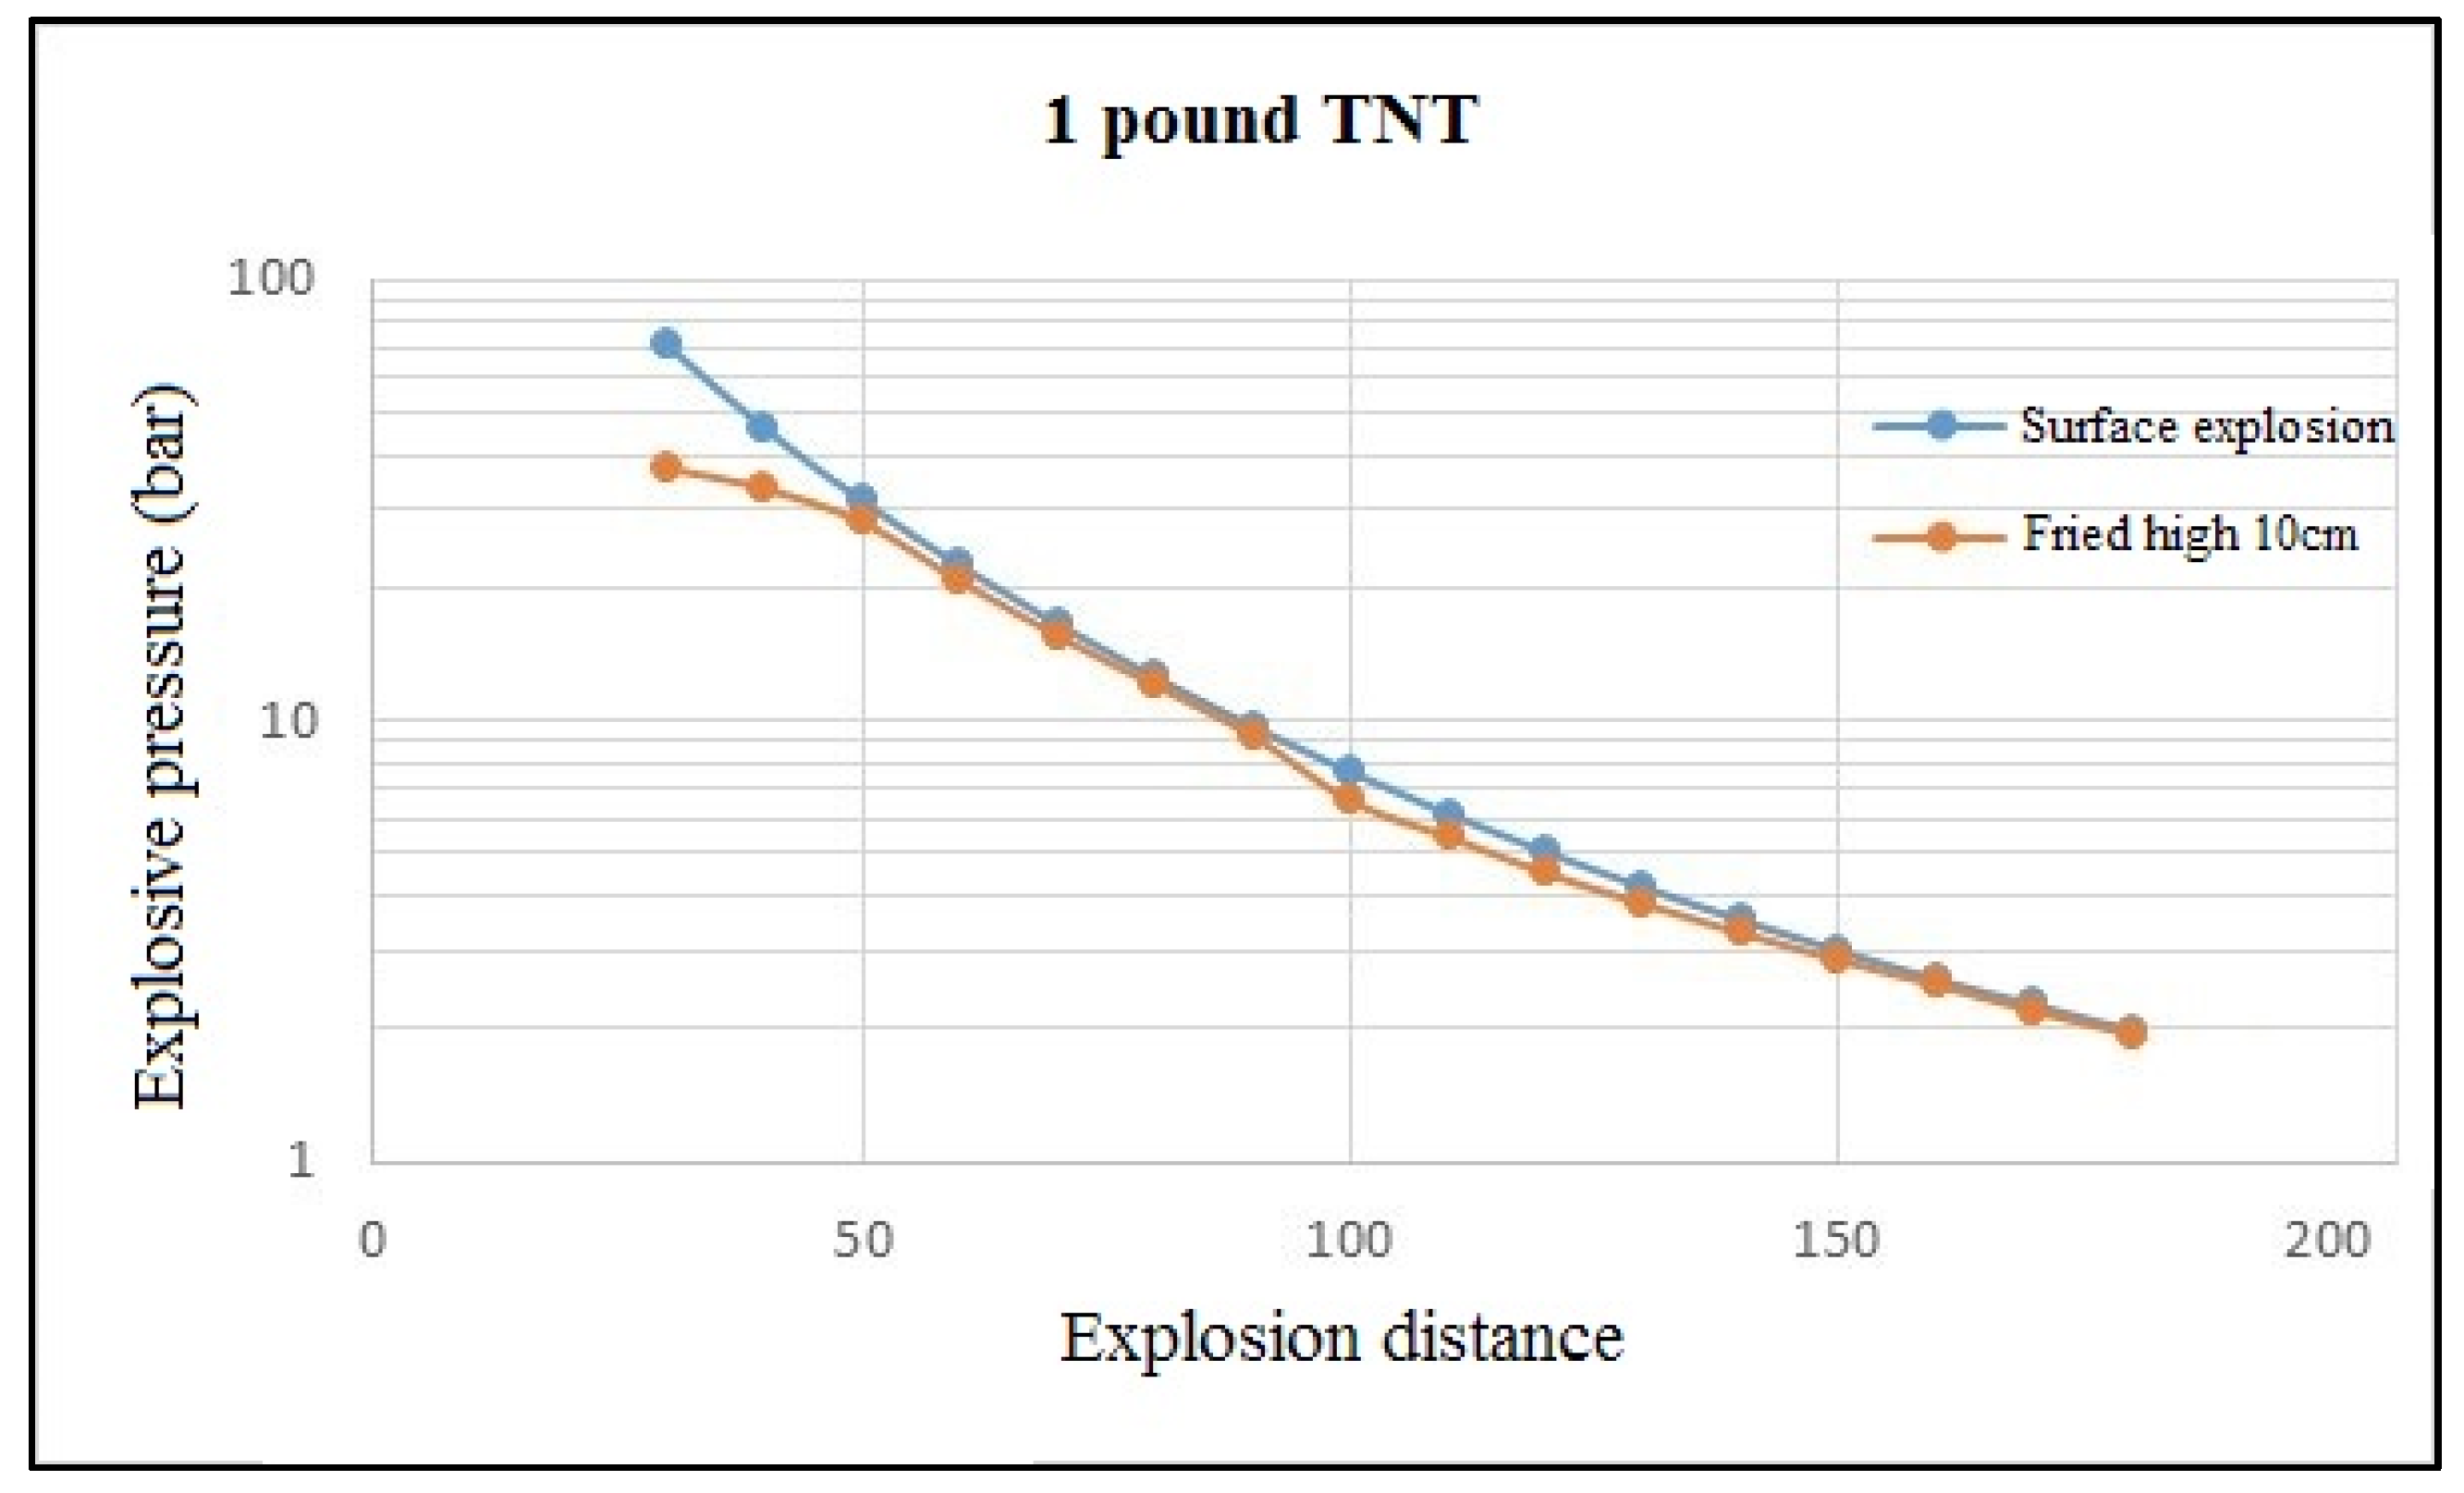
Simulation analysis was implemented based on one pound of TNT at a height of 10 cm from the ground. The ground was assumed as a rigid body. In the finite element model, the air element is 0.5 cm3 and mapping is 0.25 cm3. The simulation result of the extreme value of blast pressure at 10 cm above the ground is shown in Figure 18. Beyond 50 cm from the blast point, the result of the blast at a blast height of 10 cm is close to that of the ground blast in UFC3-340-01, which indicates that the finite element model is available. Within 50 cm from the blast point, the blast pressure is less than that of the ground blast, as that blast point is not a semicircle attached to the ground.
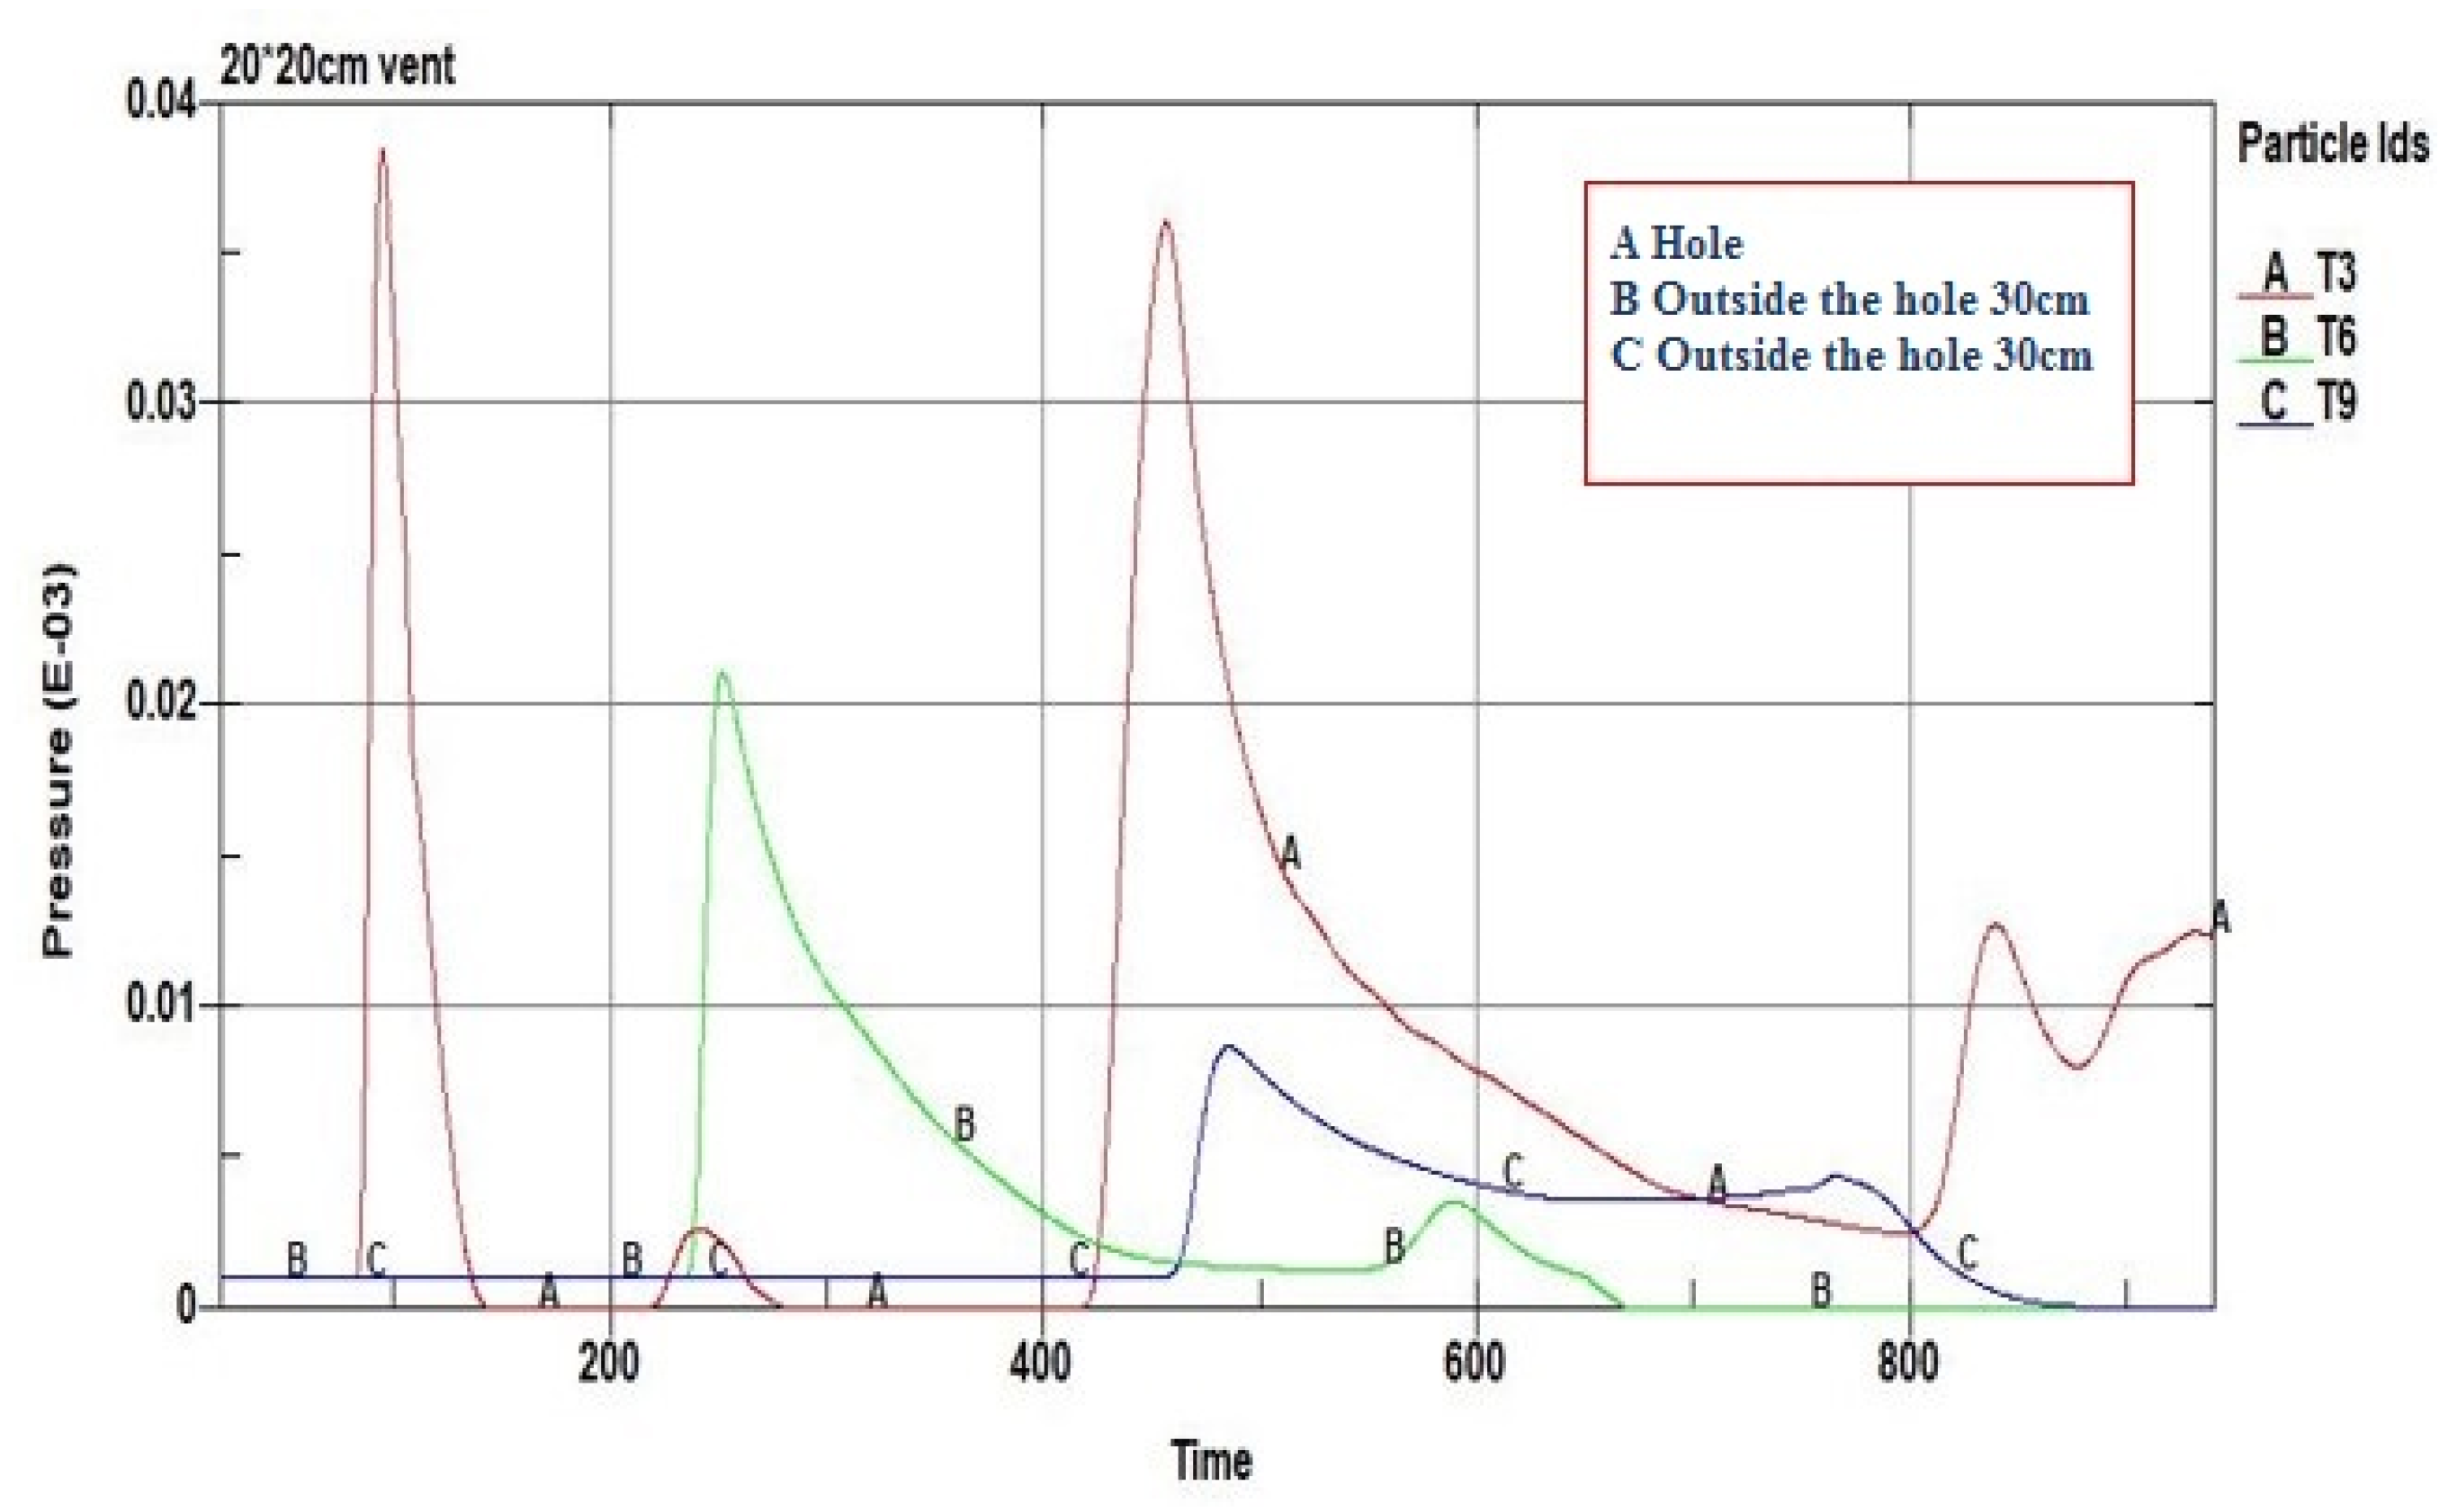
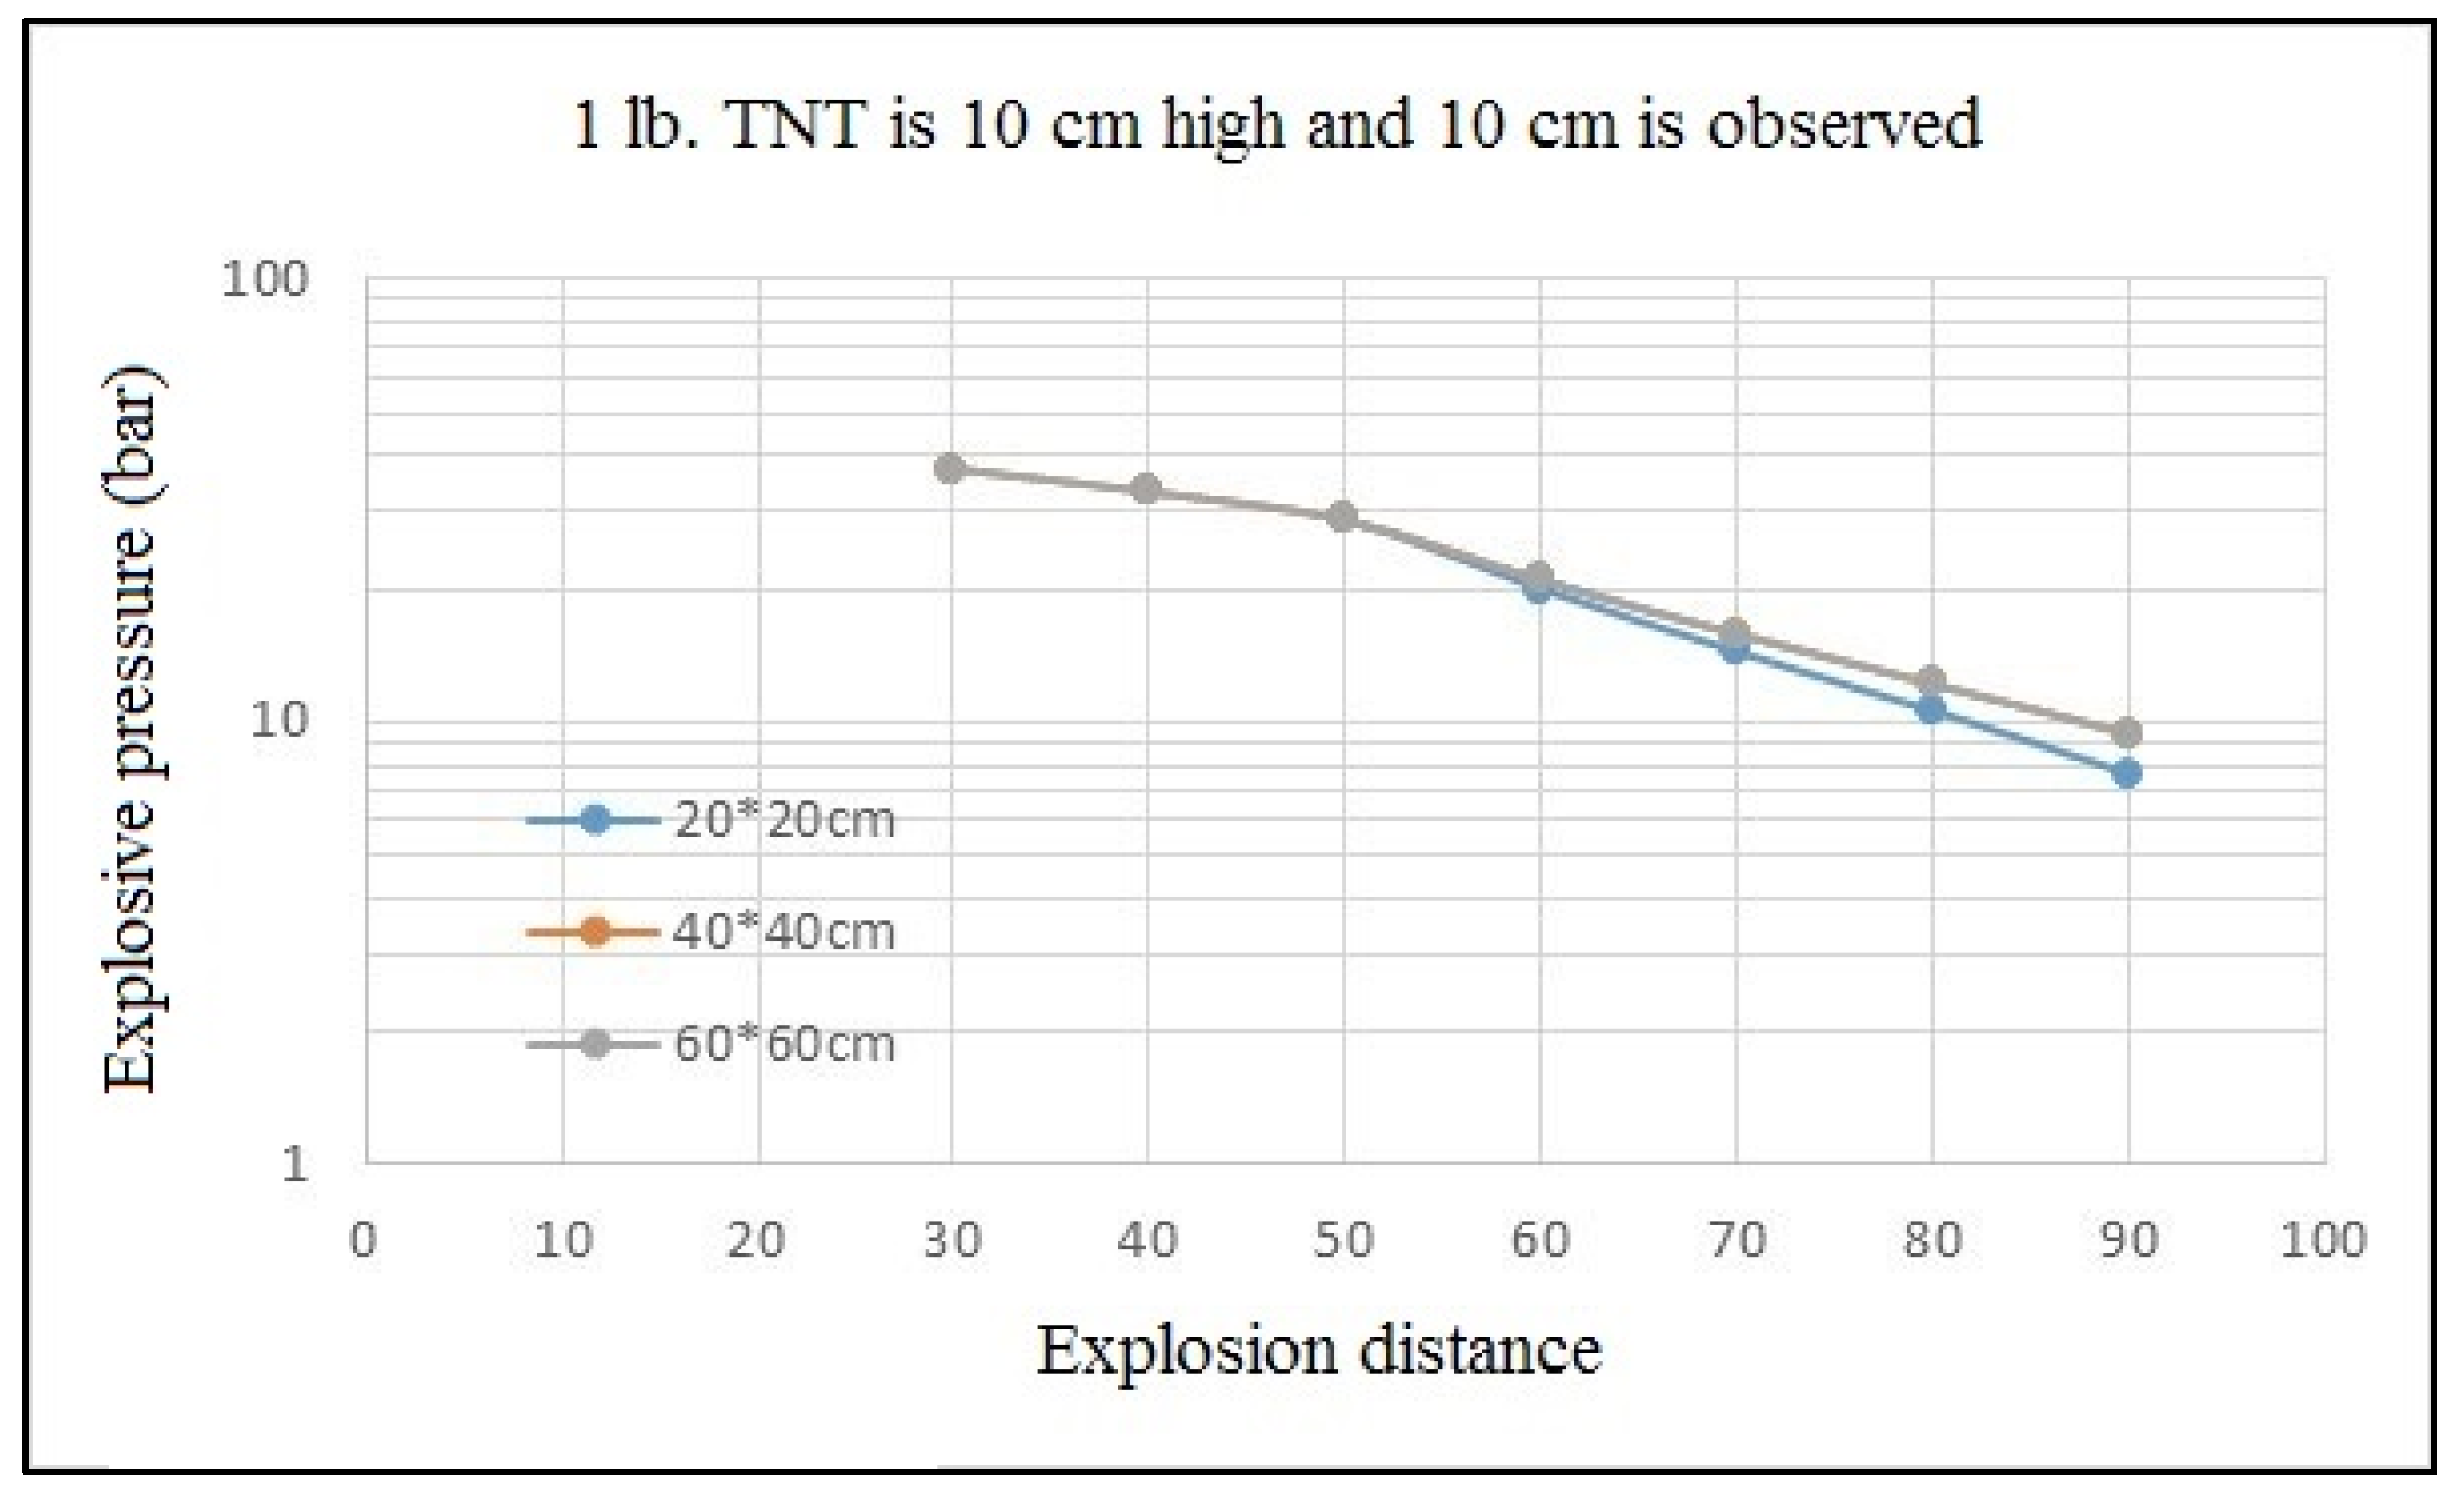
Furthermore, the structure of the ammunition depot is incorporated in the finite element model, as shown in Figure 17. The three types of vent opening sizes included 20 × 20 cm2, 40 × 40 cm2, or 60 × 60 cm2 (full vent opening). The blast pressure observation points are 10 cm, 20 cm, and 30 cm from the ground, in order to understand the impact of the height of the observation point on blast pressure. Computer simulation results are shown in Table 8, Table 9 and Table 10. The duration of the blast pressure of the 20 × 20 cm vent opening is shown in Figure 19.
The results show that the confinement effect of the ammunition depot is weak and leakage pressure remains roughly unchanged when the vent opening size is above 40 × 40 cm (as shown in Figure 20), i.e., when the vent opening is small, the confinement effect is significant, and thus, leakage pressure is low; however, the impulse on the interior wall surface reaches 36.717 bar/ms and blast pressure on the interior wall surface reaches 128 bar, which is not subject to the effect of vent opening size. The two values fall between the incident blast pressure and reflected blast pressure (or impulse), as compared with the blast pressure and impulse in free air shown in Figure 1, which is mainly because the finite element is still not small enough. While blast pressure shows a decreasing tendency with the increasing height of the observation point, it is not certain, as impulses are subject to the cumulated effect of earth-reflected waves.
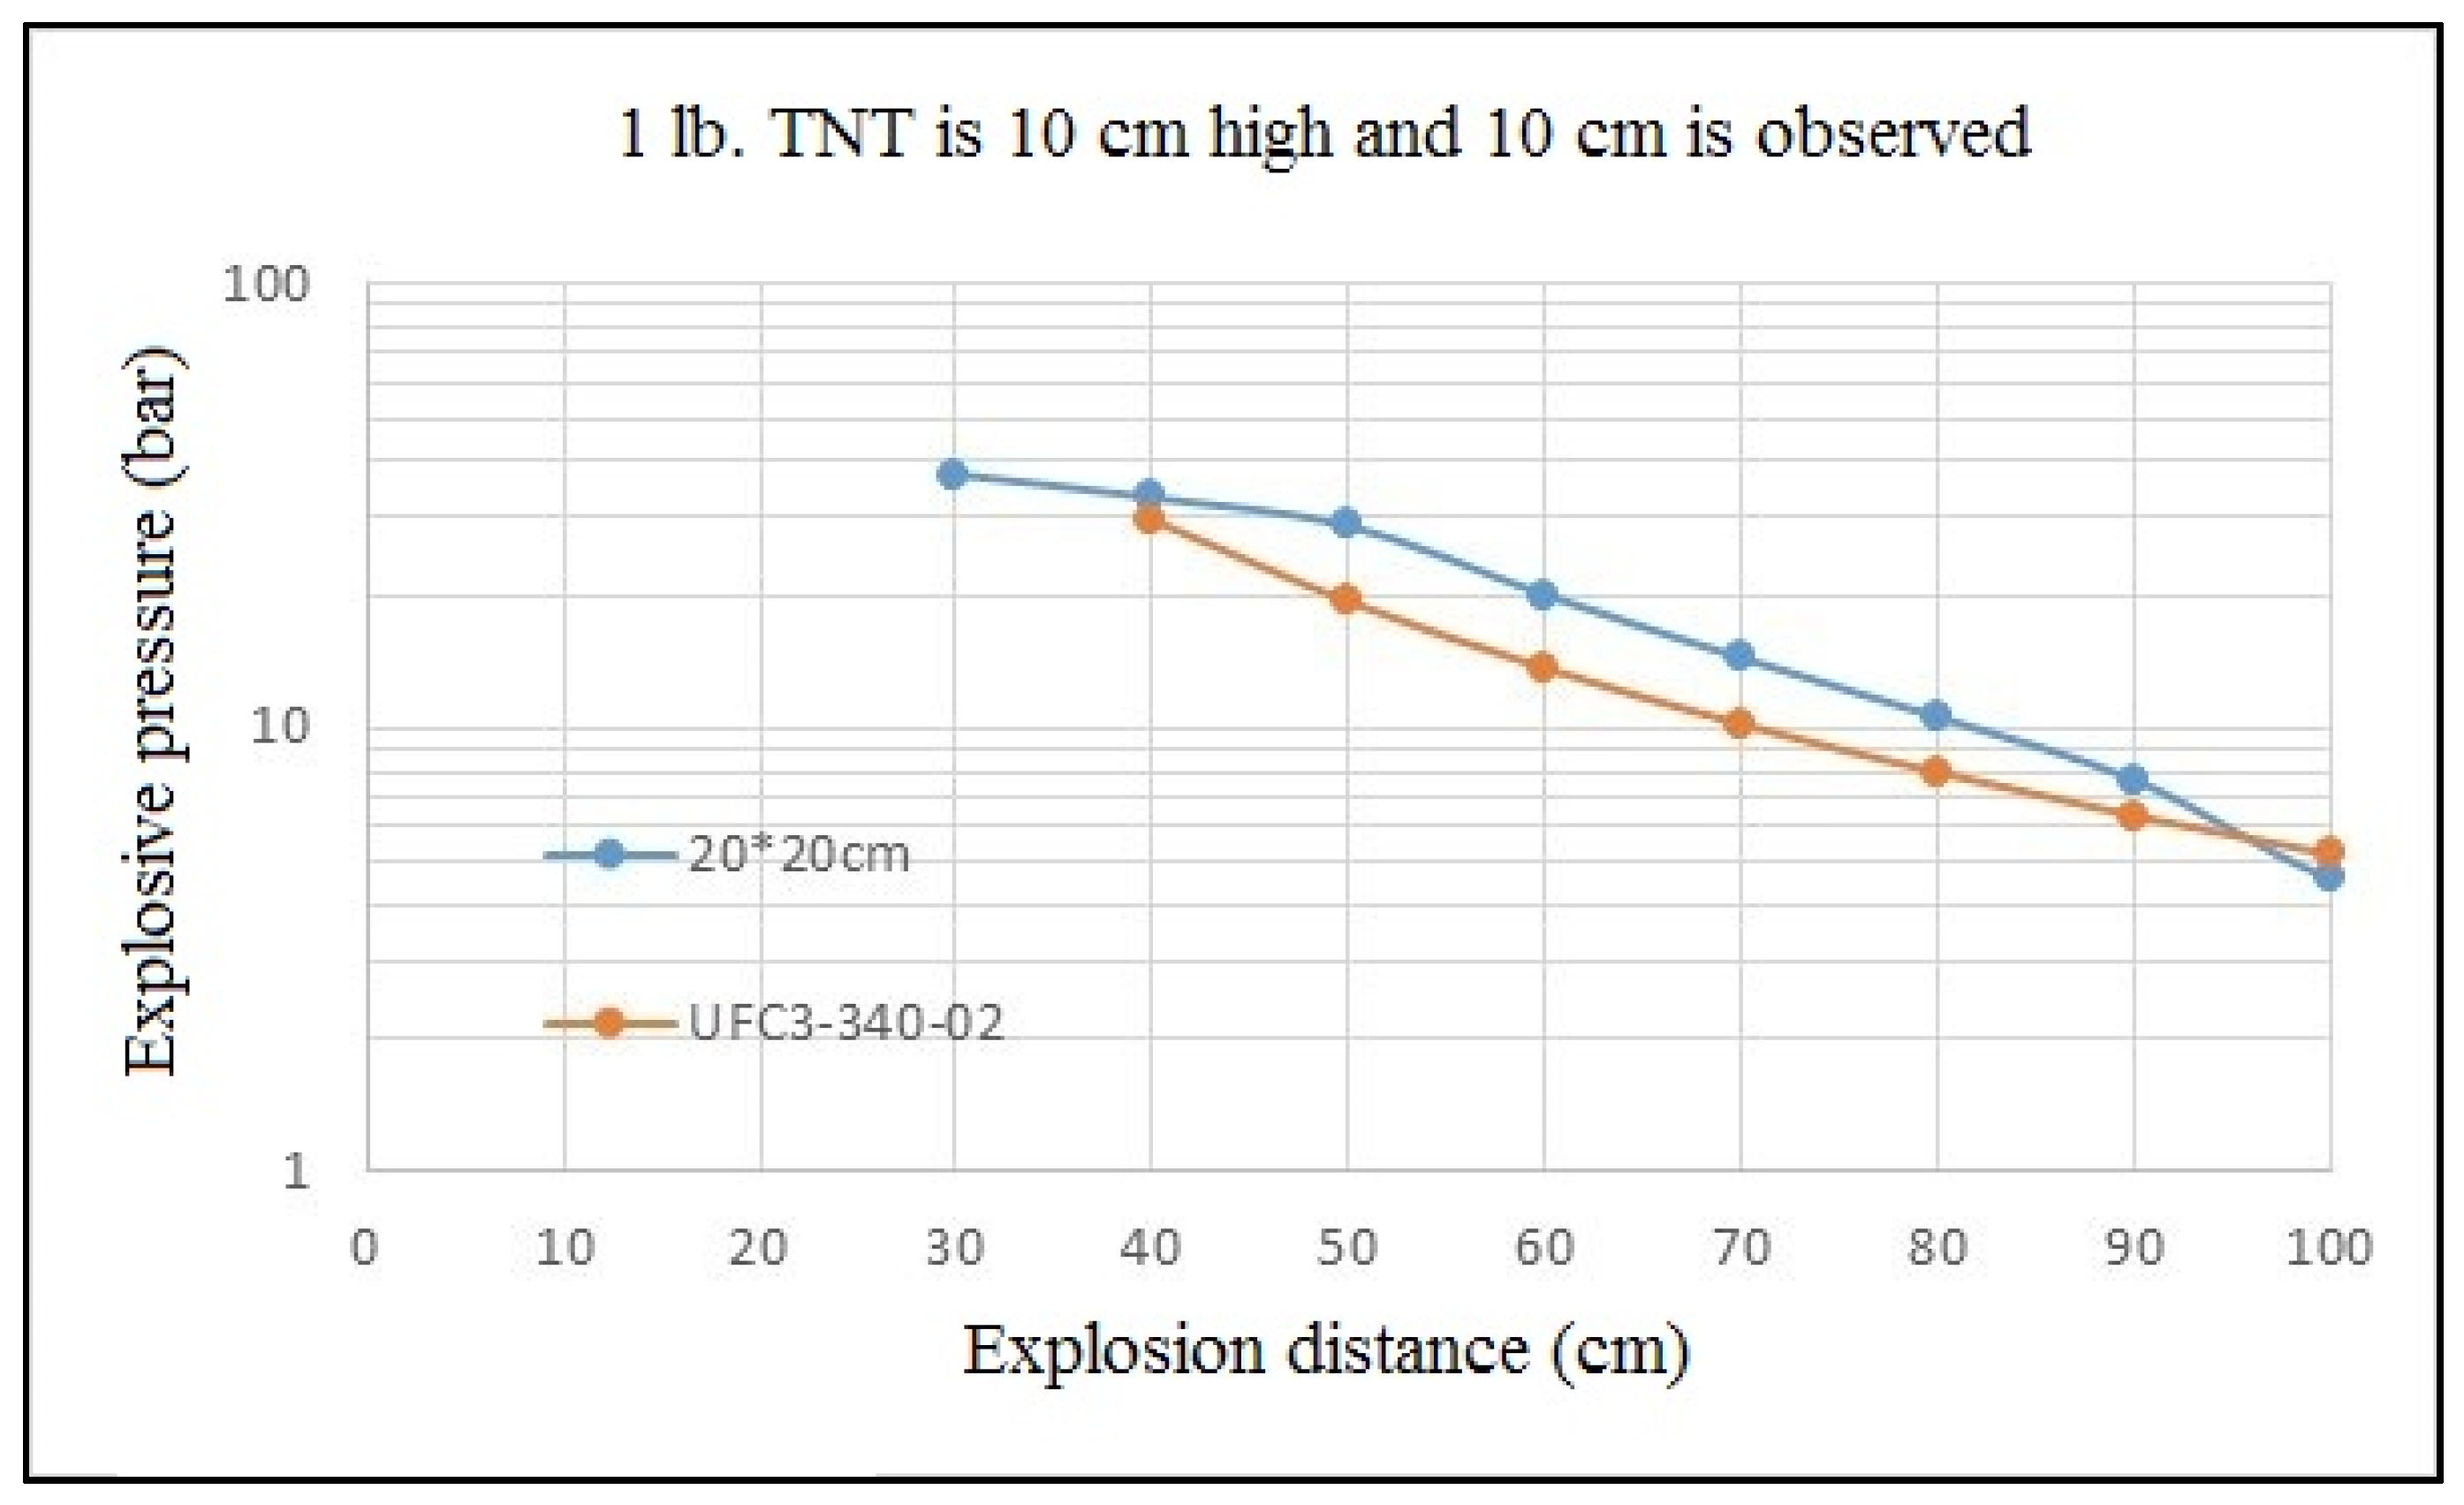
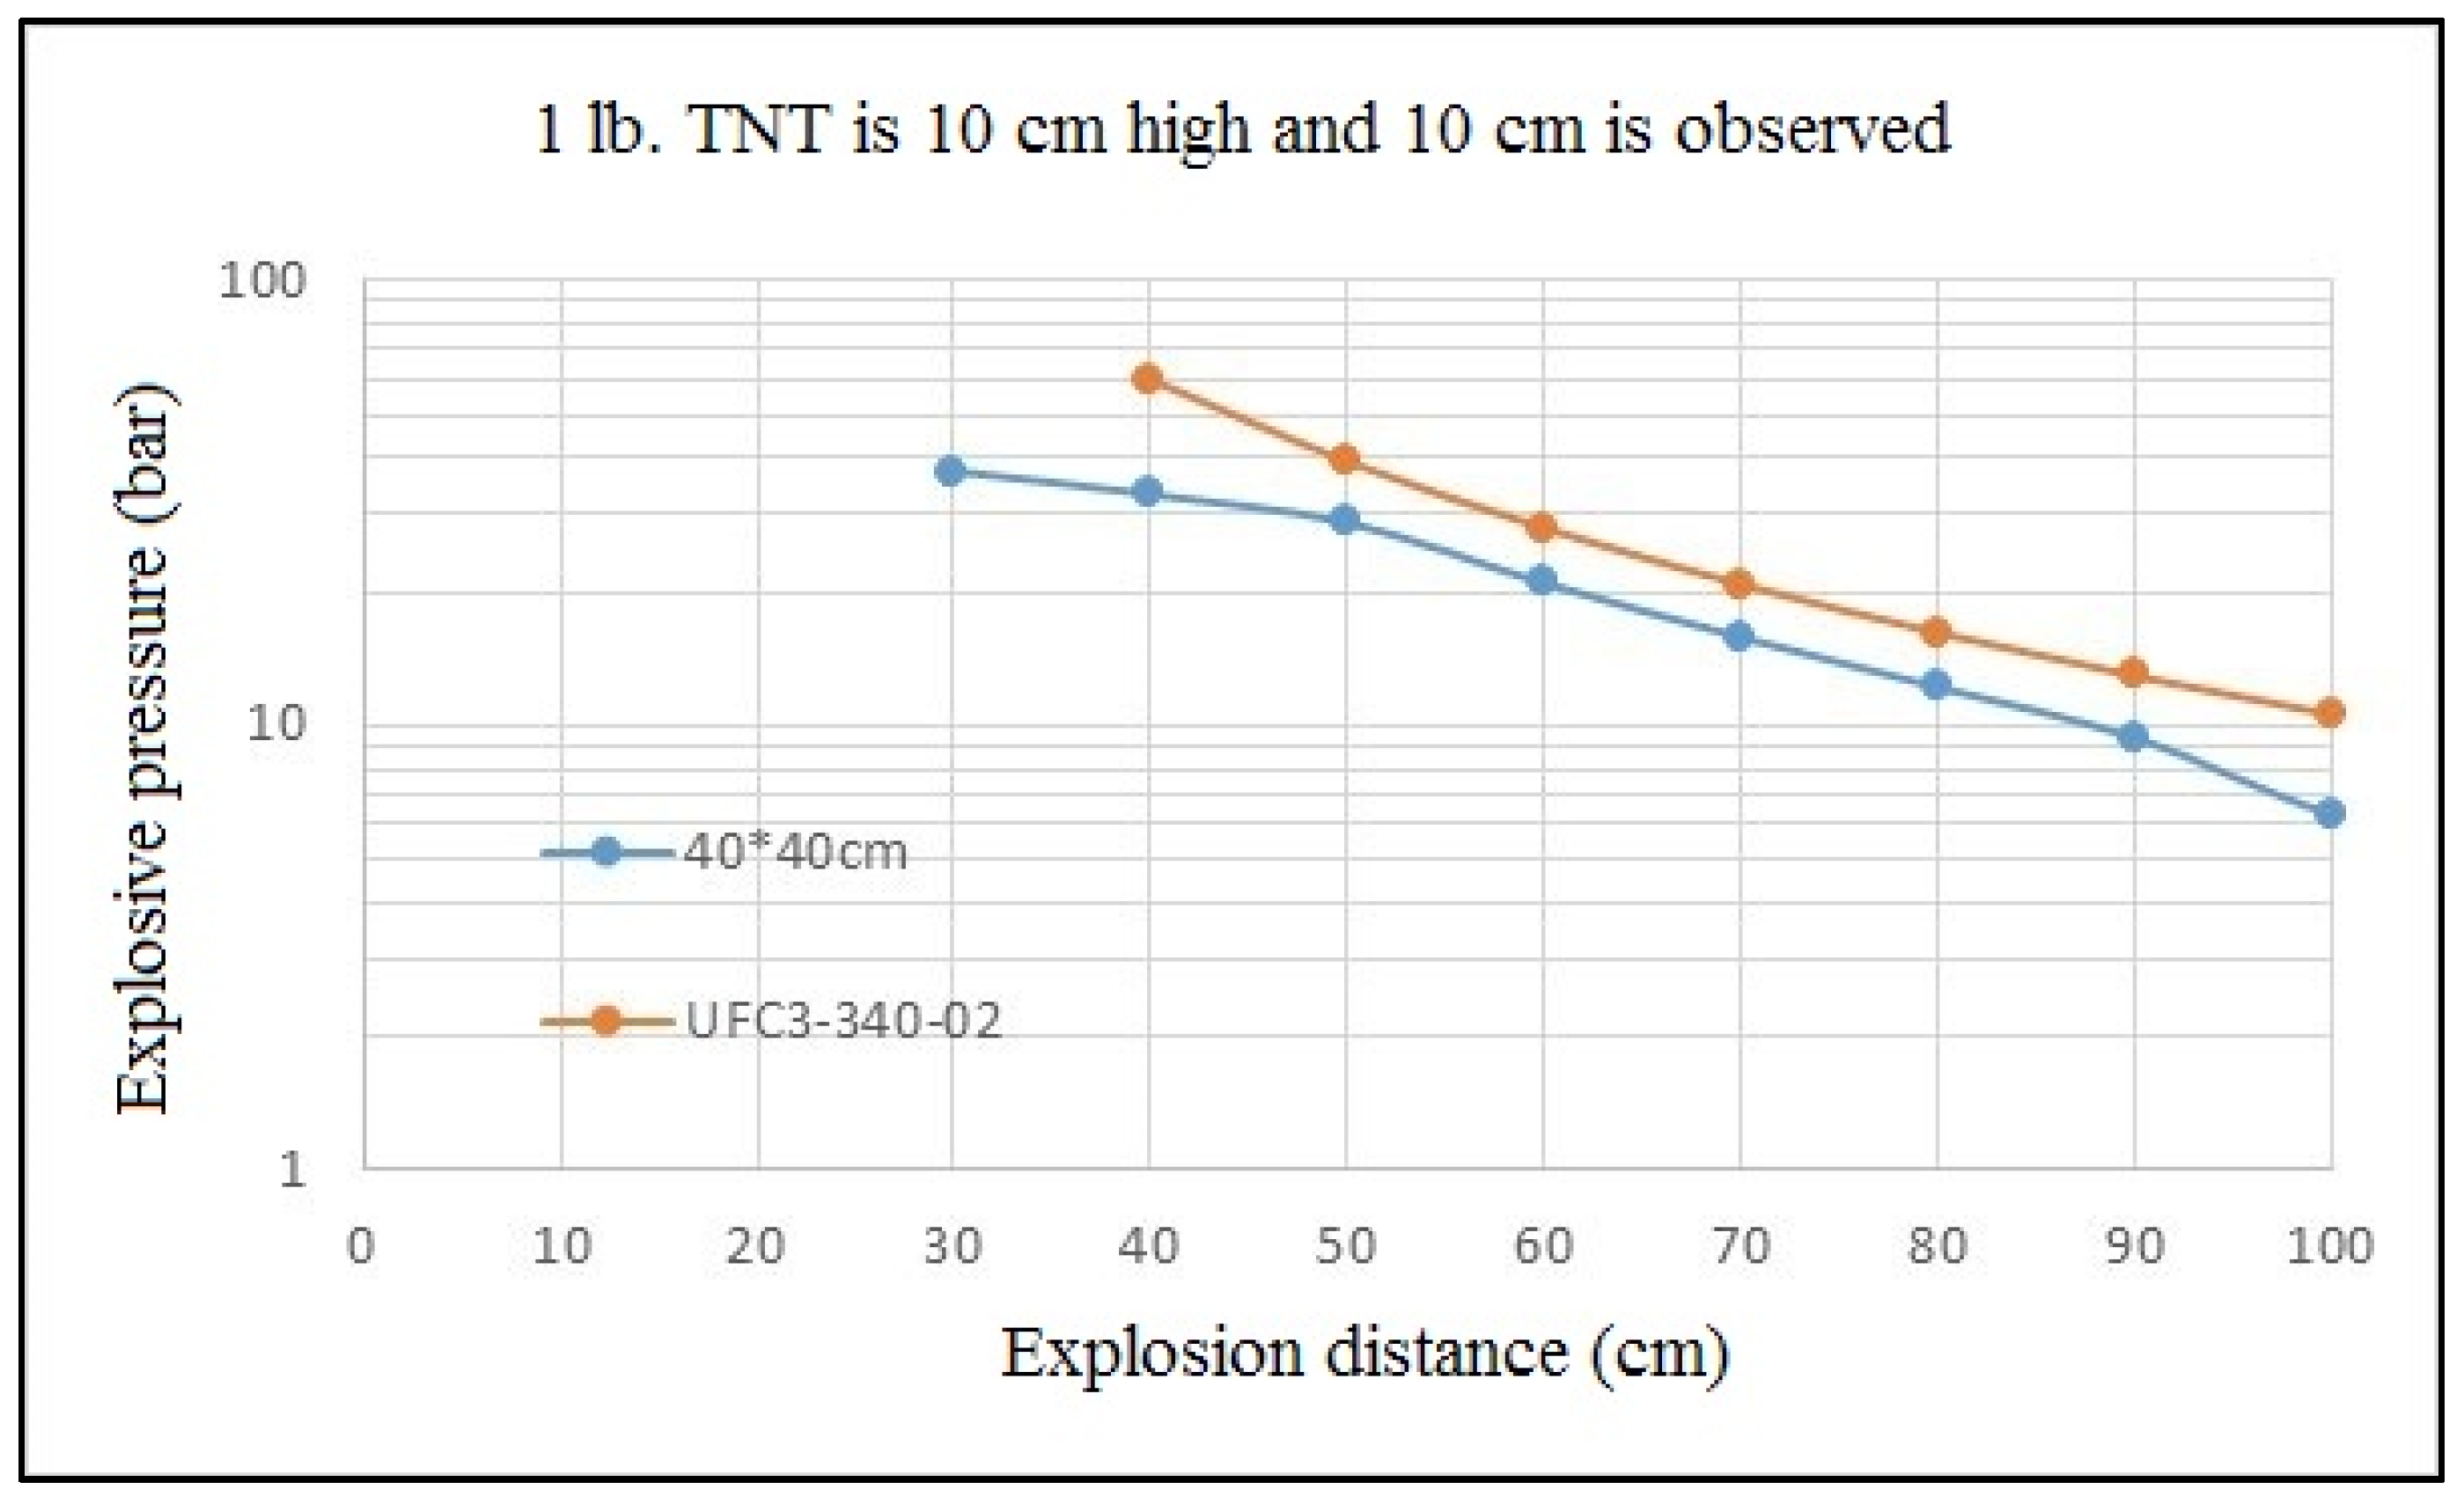
The comparison between the computer simulation value of a 20 × 20 cm vent opening and the leakage pressure value in UFC3-340-02 (Figure 10) are shown in Figure 21. The results show that the error between the computer simulation result and the specified value can be within 10%. Regarding the 40 × 40 cm vent opening, while the error between the two reaches −30% (Figure 22), the tendency is consistent.
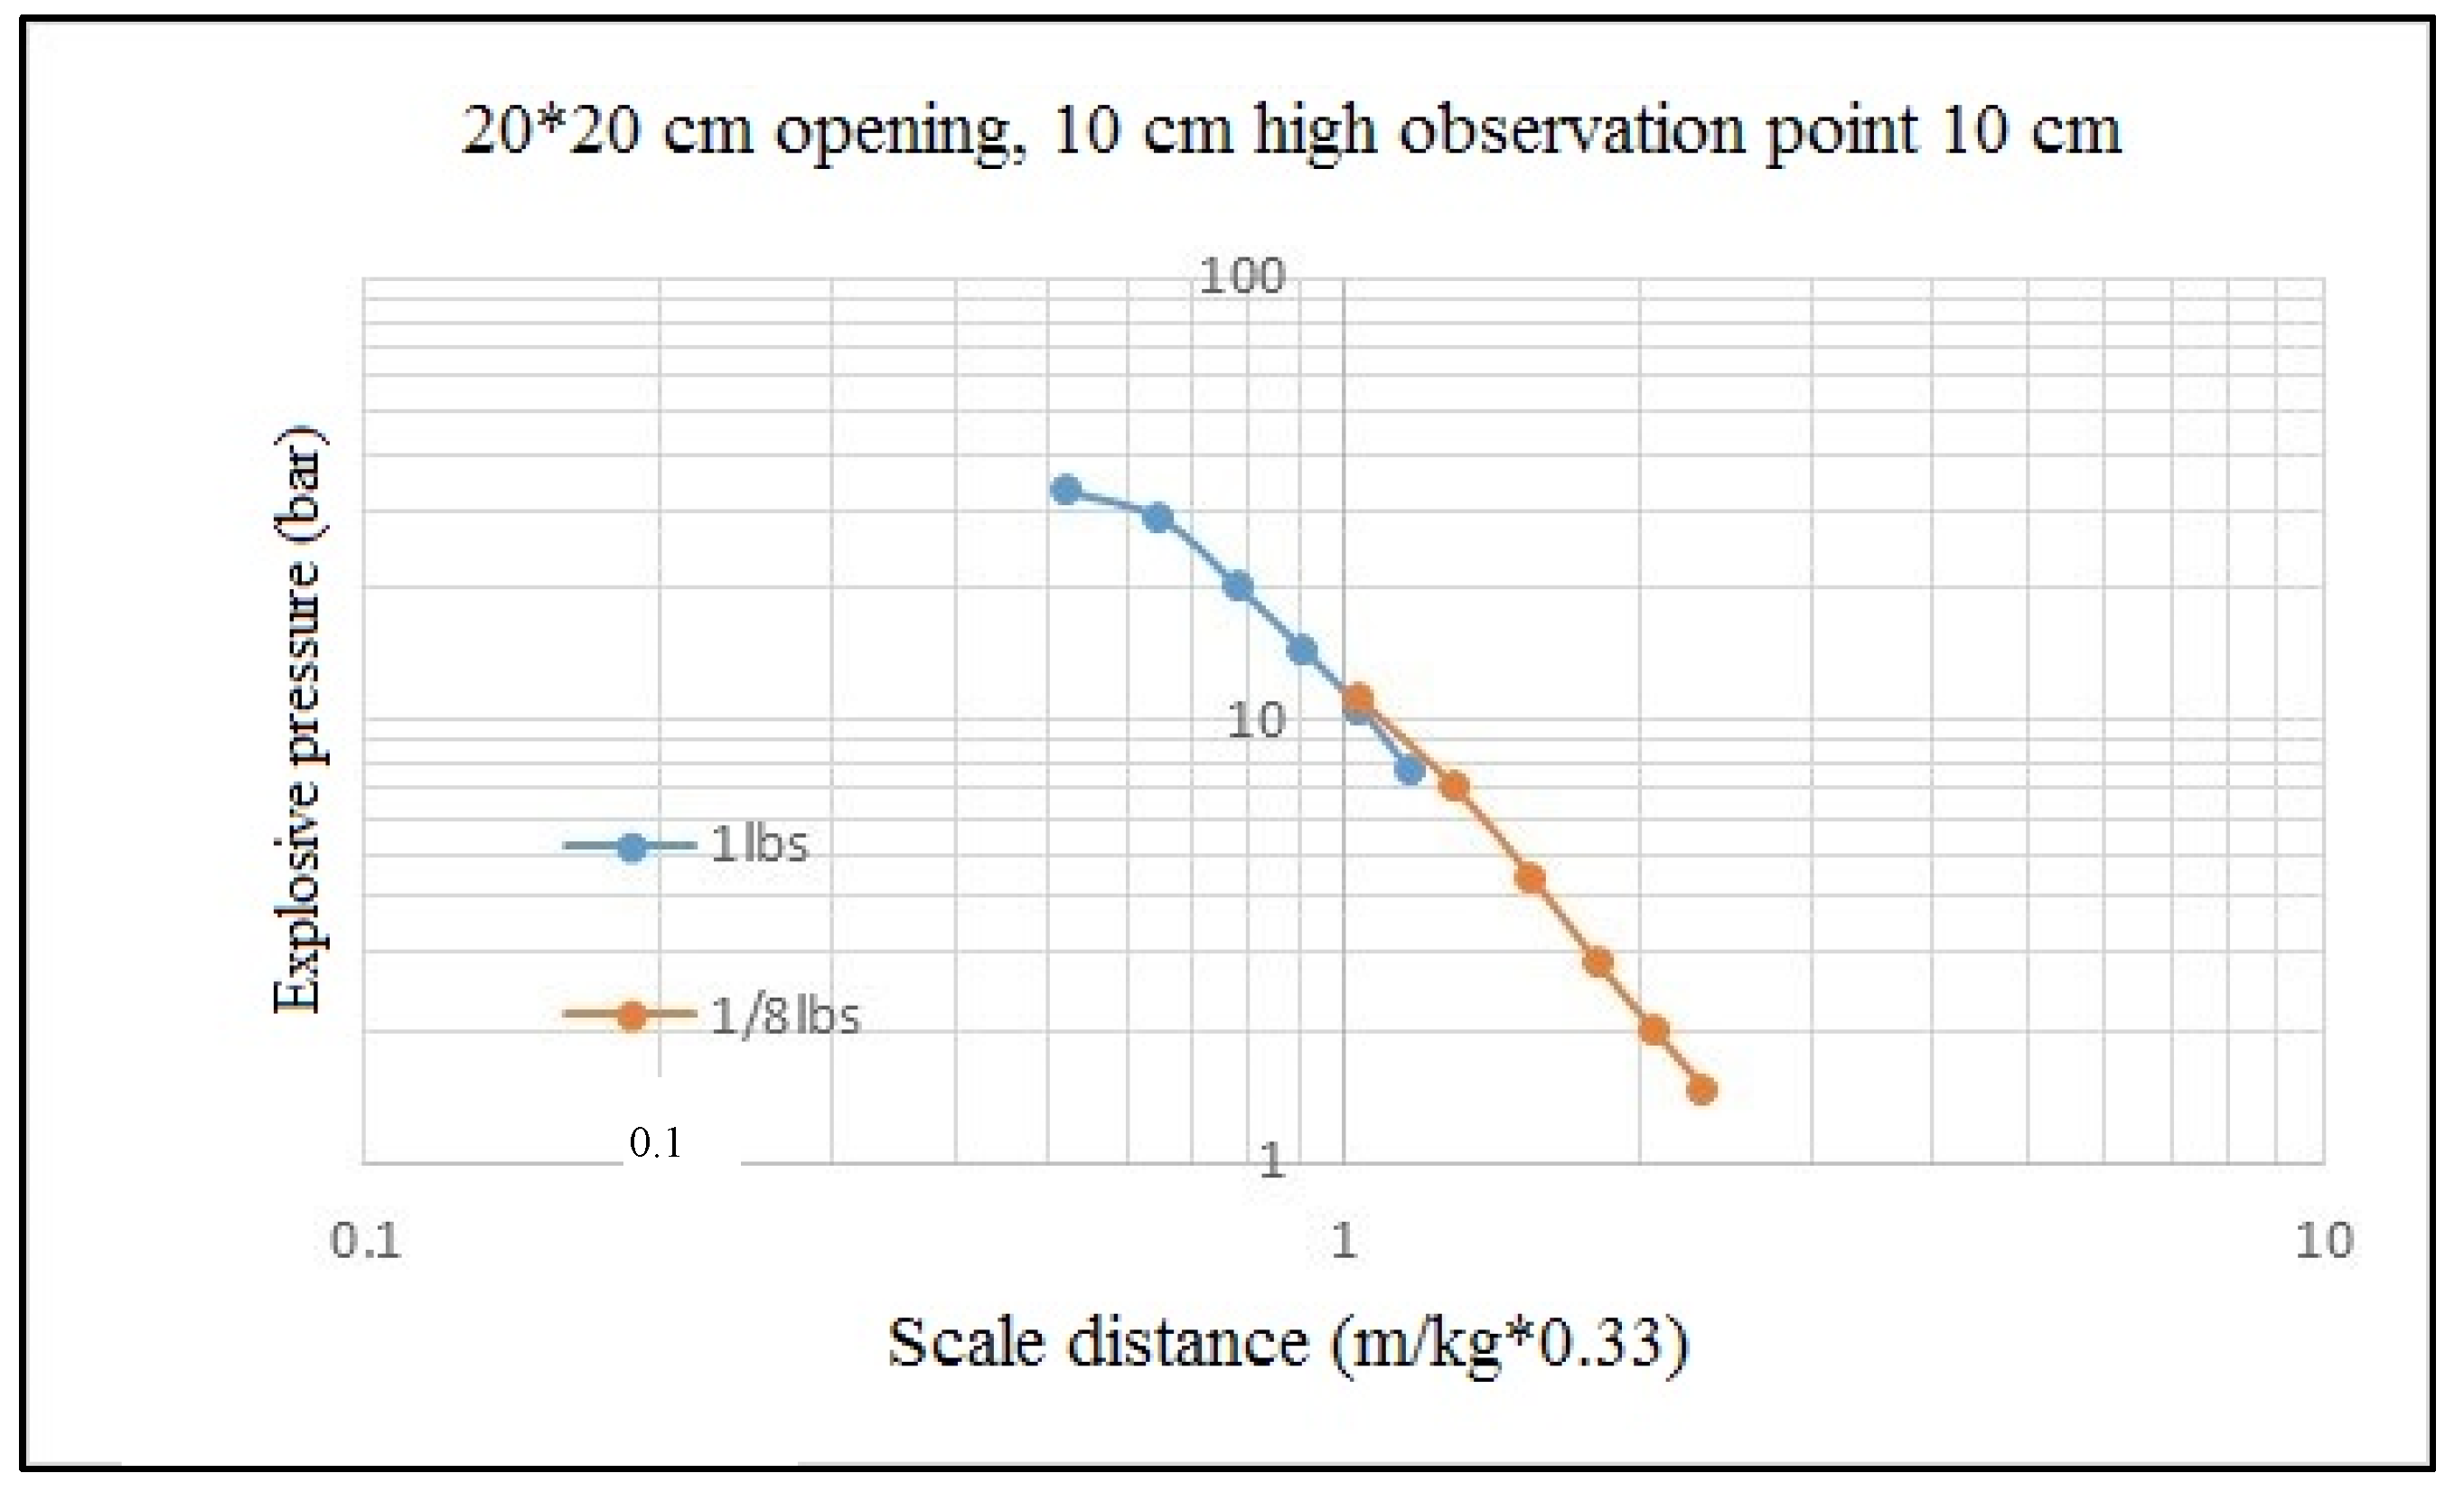
The impact of the charge weight on the computer simulation result is shown in Figure 23, which shows that the results of different charge weights (1 lb and 1/8 lb) are consistent, i.e., the scaled distance is applicable and the result of a small ammunition depot can be applied to a large ammunition depot.

4.2. Impact of the Location of Vent Opening

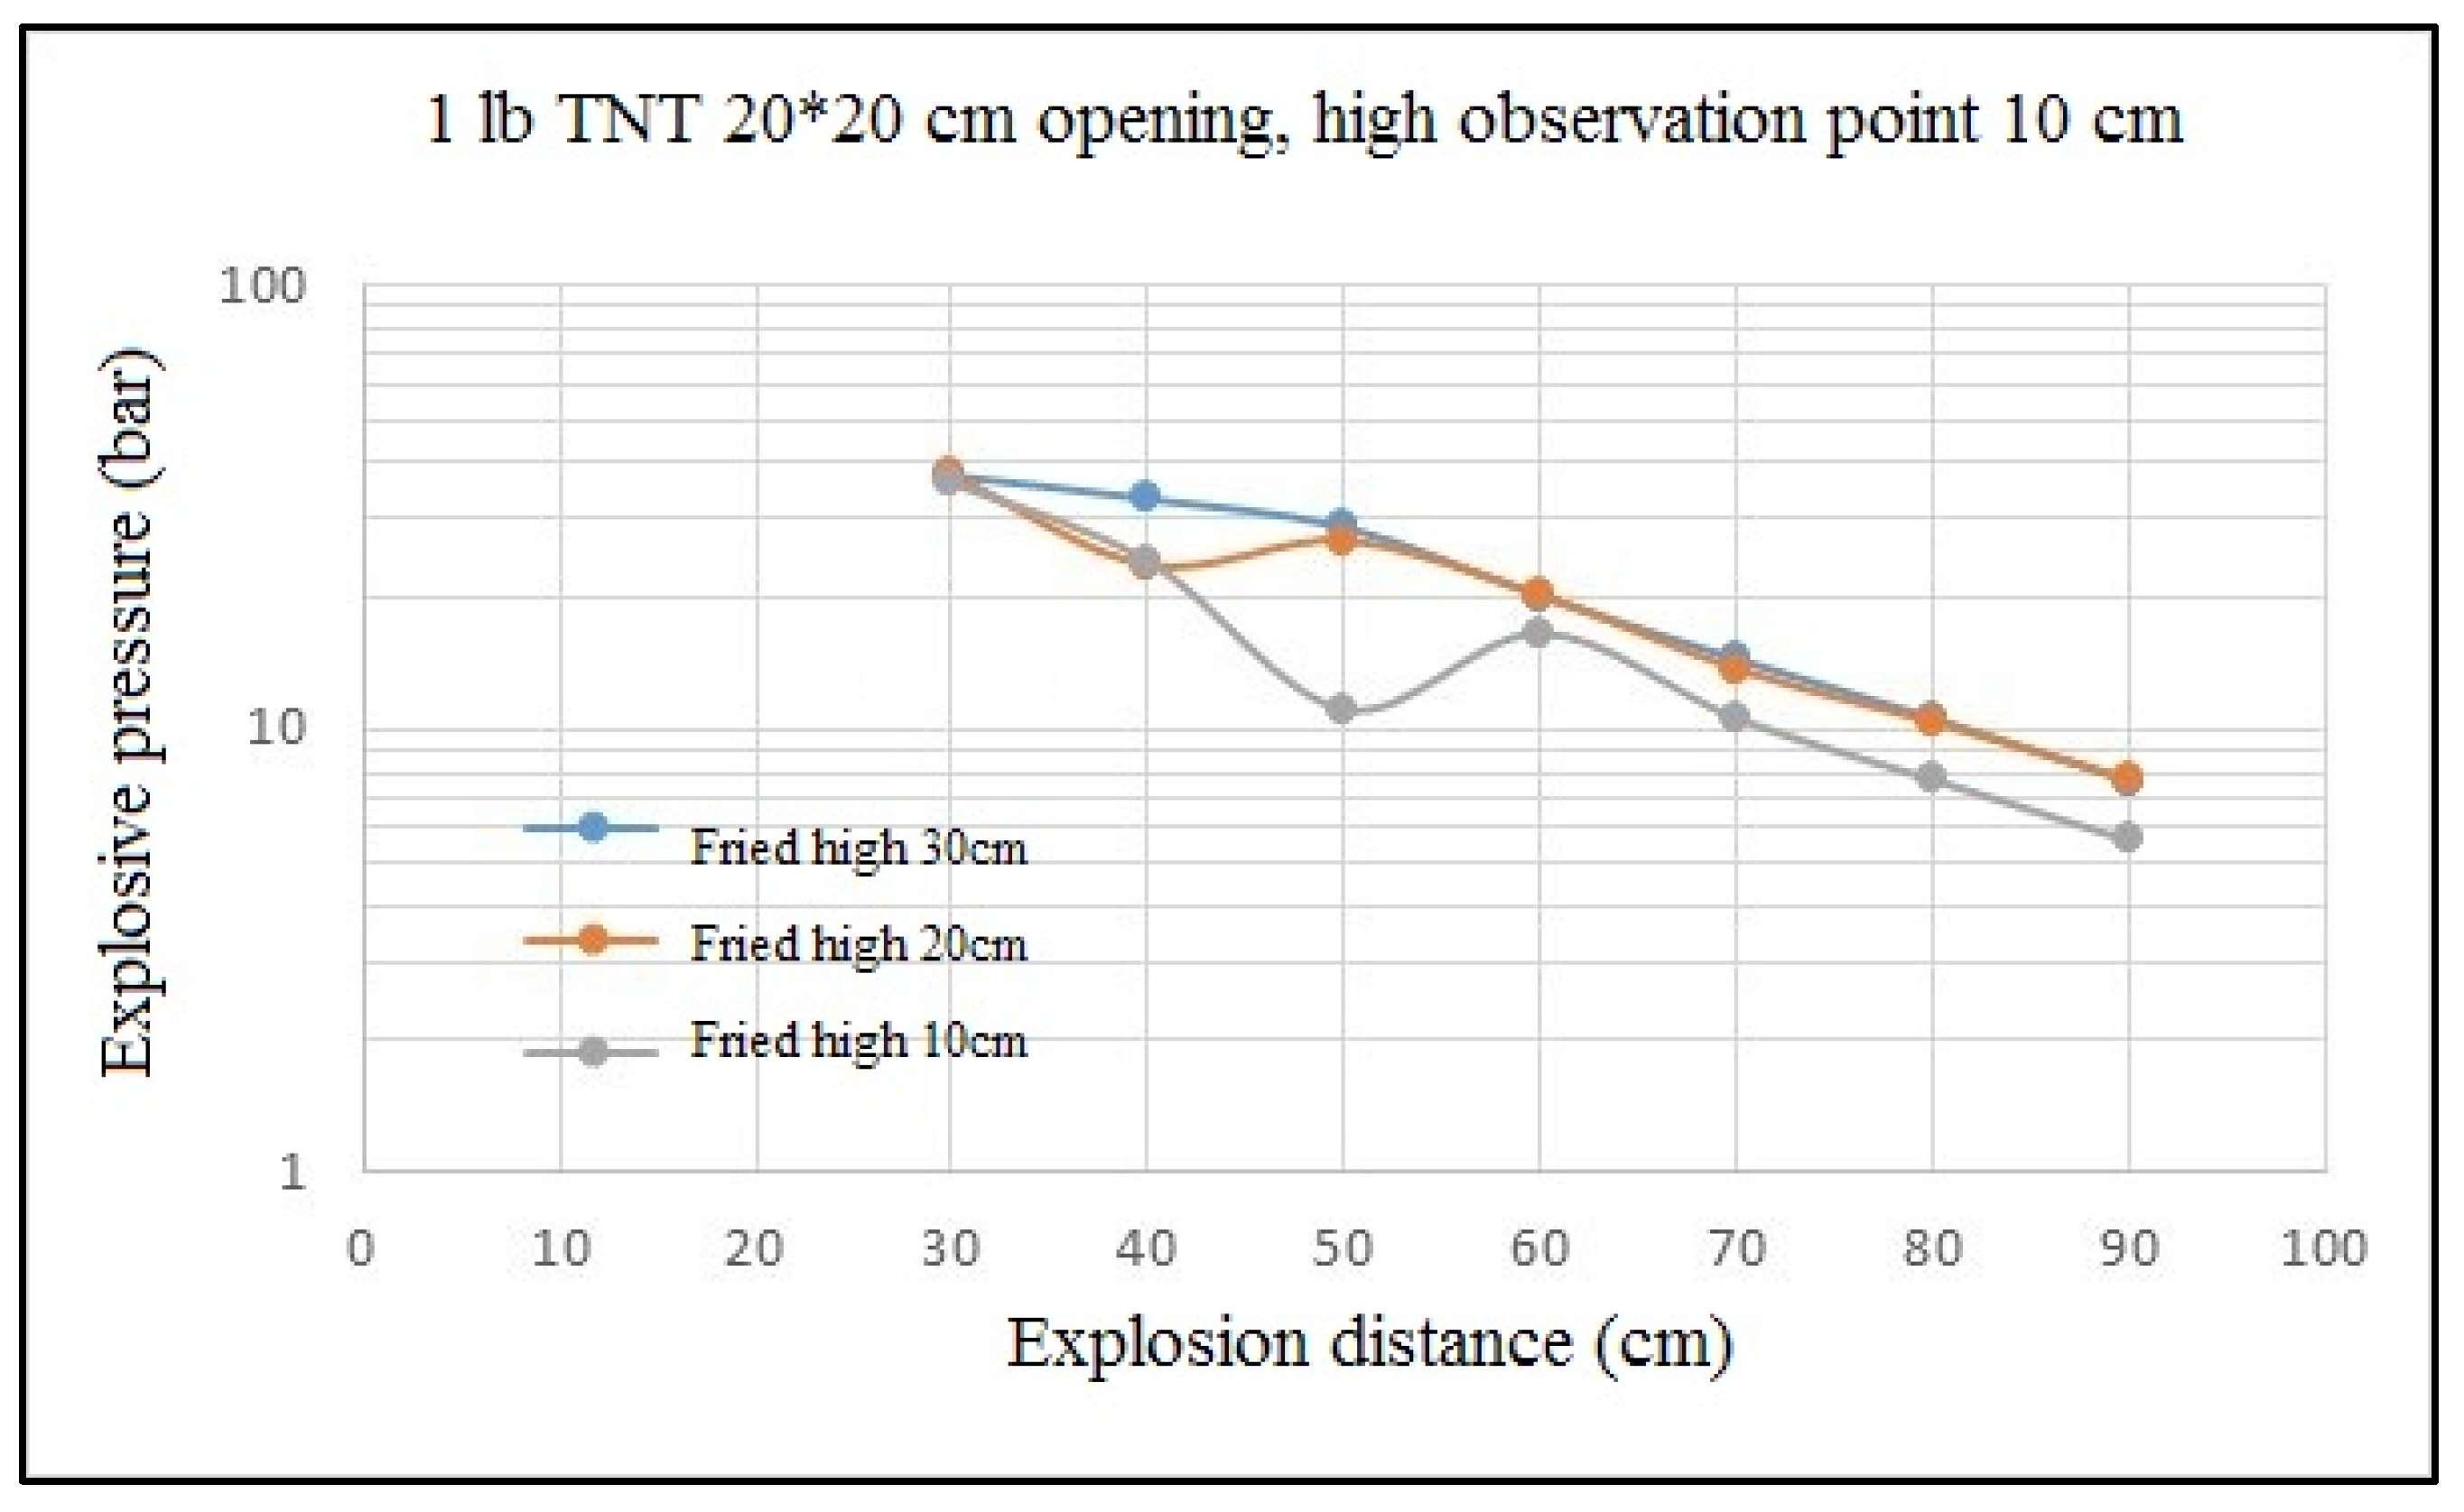
Regarding the correlation among the location of the vent opening, the location of the blast point, and the impact of the location of the vent opening on leakage pressure, the leakage pressures at the blast heights of 10 cm (at the center of the vent), 20 cm (at the edge of the vent), or 30 cm (on the top of the vent) are discussed, respectively, as based on a 20 × 20 cm vent opening and a distance of 30 cm from the 1 pound of TNT blast point to the vent opening. The computer simulation results are shown in Table 8, Table 11, and Table 12. The correlation among blast height, the location of the vent opening, and the impact of blast height on blast pressure are shown in Figure 24. The results show that at the blast height of 20 cm (at the edge of the vent), while the blast pressure is subject to the inference of walls at 10 cm outside the vent opening, and then decreases, the blast pressure is consistent with that at the blast height of 10 cm (at the center of the vent) beyond 20 cm outside the vent opening. At the blast height of 30 cm (on the top of the vent), while the blast pressure is subject to the inference of walls at 20 cm outside the vent opening, and then decreases, the blast pressure decreases slightly, as compared with that at the blast height of 10 cm (at the center of the vent) beyond 30 cm outside the vent opening. In other words, while the location of the vent opening has an impact on blast pressure, the impact is not considered in the UFC 3-340-02 Specification at present. However, a relatively conservative design will be implemented by ignoring this effect.

4.3. Impact of the Thickness of a Fragile Wall

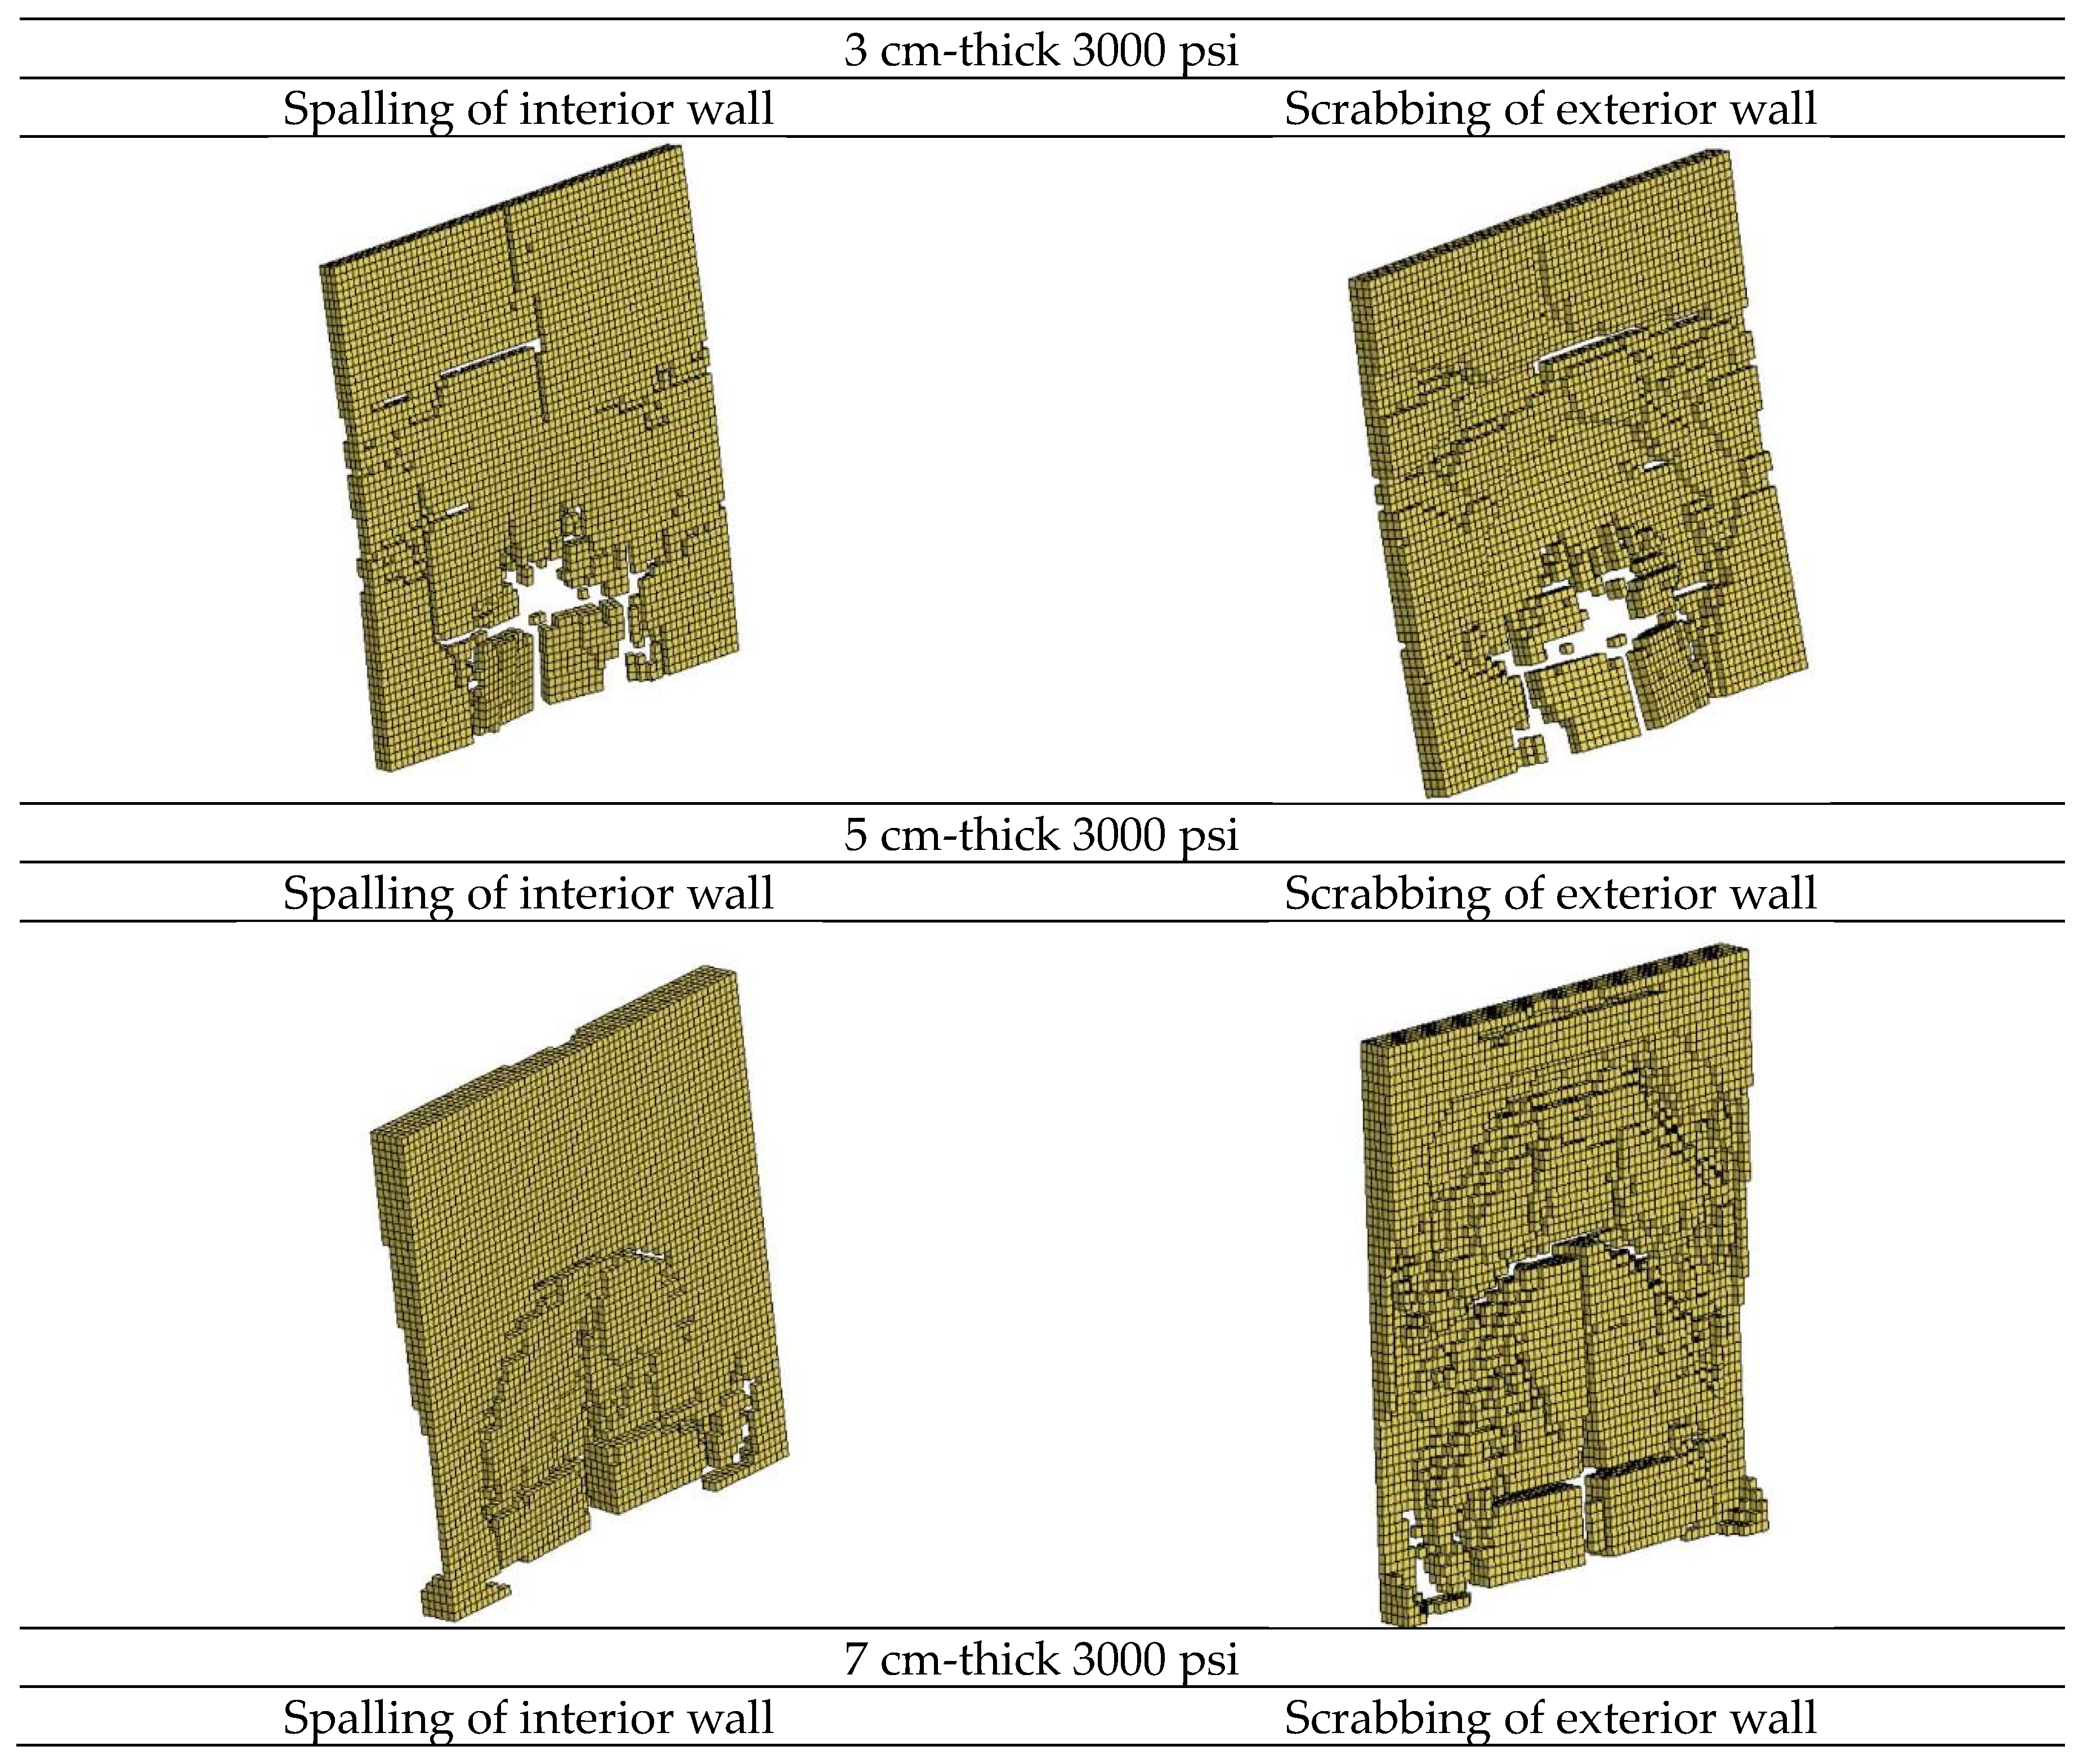
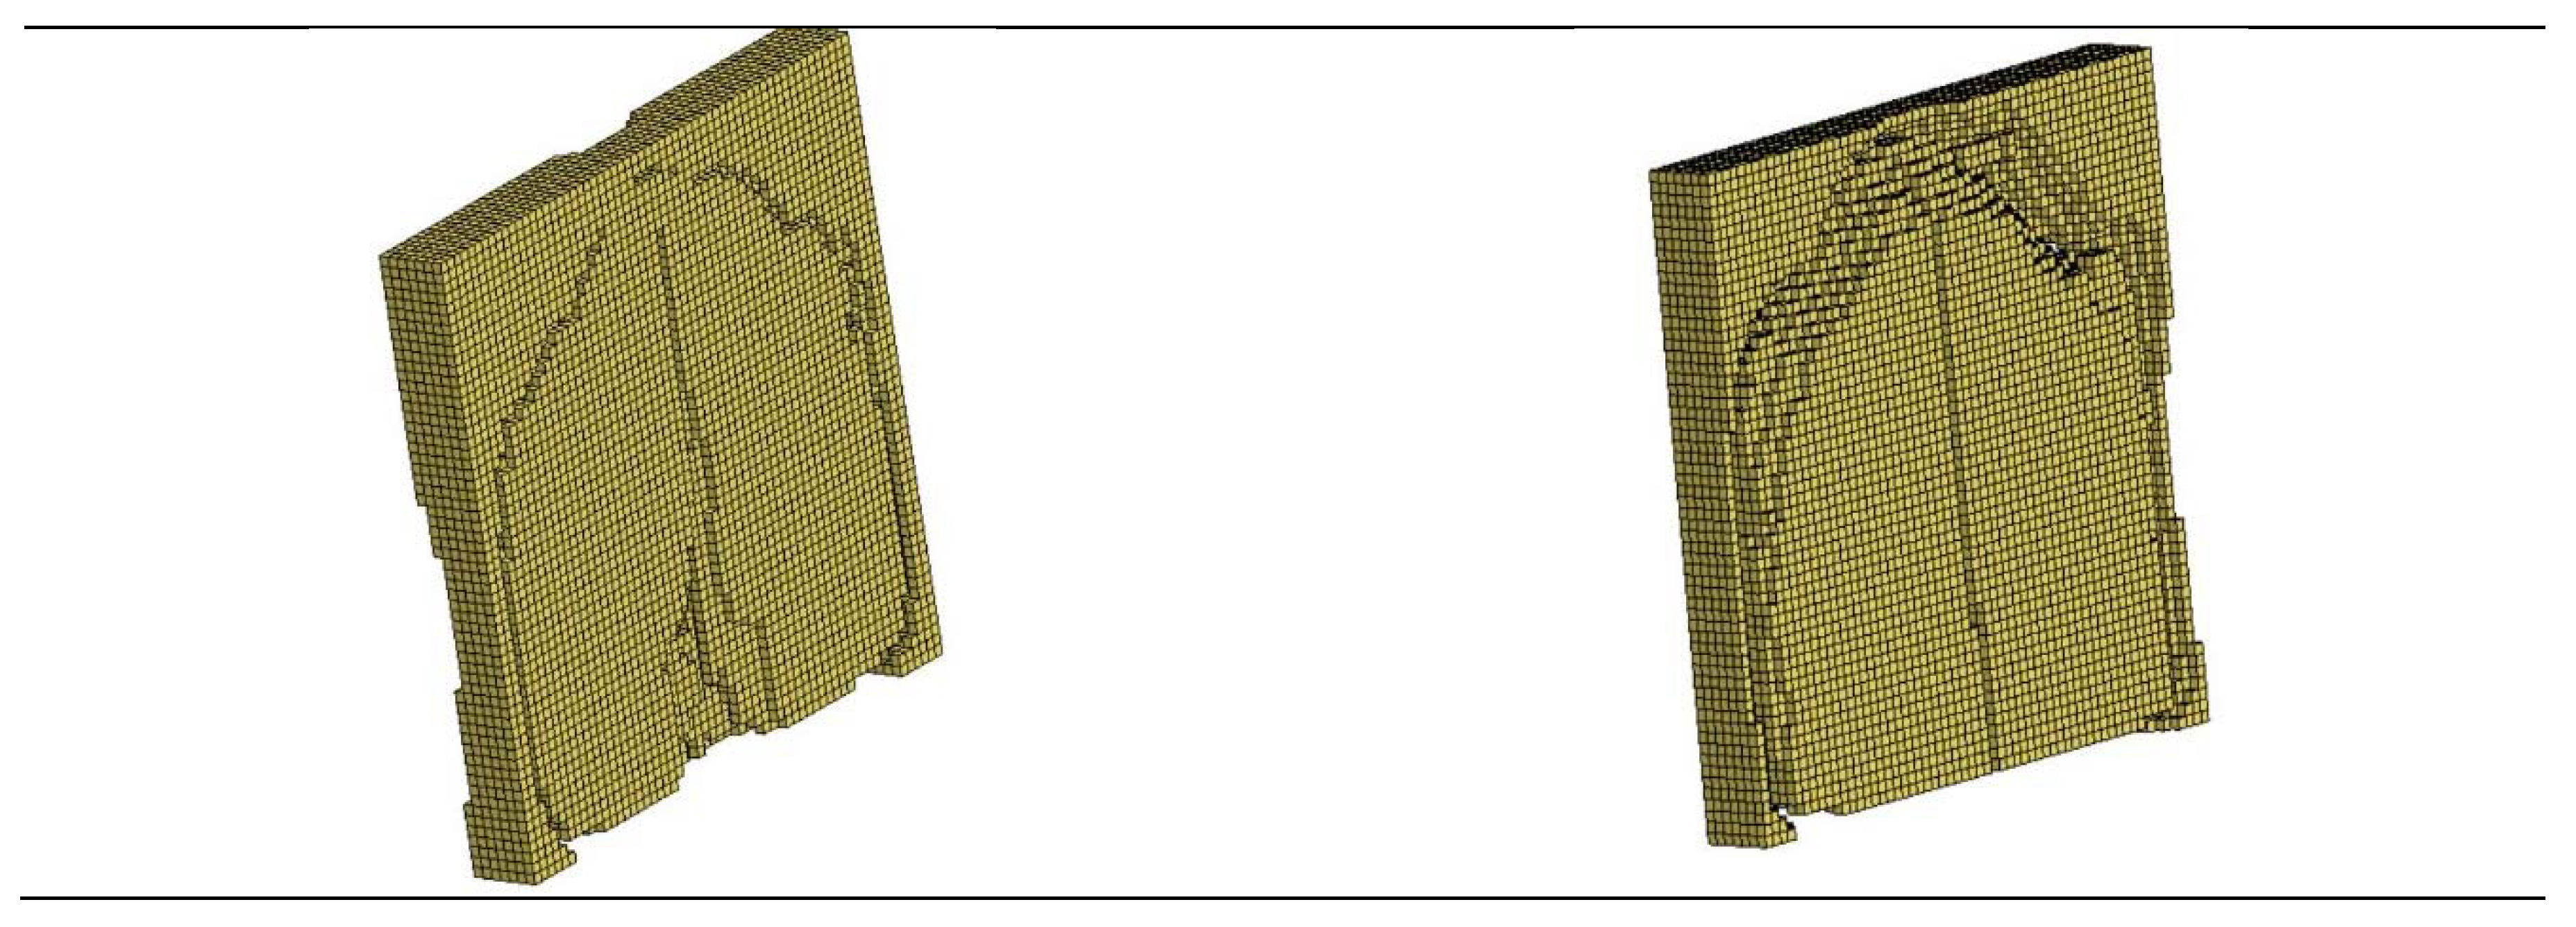
Blast pressure will be leaked outside the ammunition depot through cracks in the wall, as created under blast pressure. In the UFC3-340-02 Specification, this effect is directly deemed as a vent opening, and the blast pressure absorbed by the thickness of the wall upon cracking is ignored. In this study, 1 pound of TNT was placed 10 cm from a 3000 psi concrete wall with a blast height of 10 cm and wall thicknesses of 3 cm, 5 cm, and 7 cm, and the erosion condition of the concrete was the maximum shear strain of 0.004. The simulation results are shown in Table 13 and Figure 25. The vent opening is small and leakage pressure is low when the wall is 3 cm thick; the vent opening is smaller and leakage pressure is lower when the wall is 7 cm thick, indicating that the wall thickness has an impact on vent opening size, and hence has a great impact on leakage pressure.

4.4. Impact of the Strength of Fragile Wall

The impact of the strength of concrete is similar to the impact of the thickness of a wall on leakage pressure; 1 pound of TNT was placed 10 cm from the concrete wall, with a blast height of 10 cm and wall thickness of 5 cm, and the erosion condition of the concrete was the maximum shear strain of 0.004; strength of concrete: 3000 psi, 4500 psi, and 6000 psi. The simulation results are shown in Table 14. The vent opening is small and leakage pressure is low when the strength of the concrete is 3000 psi; the vent opening is smaller and the leakage pressure is lower when the strength of the concrete is 6000 psi, which indicates that the strength of the wall has an impact on vent opening size, and hence has a greater impact on leakage pressure.

5. Conclusions and Suggestions

In this study, the Fluid–Structure Interaction algorithm of ANSYS/LS-DYNA software was used to simulate an internal blast of an ammunition depot in order to discuss the impact of the size and location of the vent opening on leakage pressure, as well as the impact of the thickness and strength of the concrete wall on leakage pressure. The simulation results show that ANSYS/LS-DYNA software can be used for simulating an internal blast in an ammunition depot, and its leakage pressure value is similar to the UFC3-340-02 Specification.
I.
Vent opening size has an impact on leakage pressure. The assessment method in the current UFC3-340-02 Specification is close to the computer simulation value, and thus, it can be applied in design. Leakage pressure is low and the internal impulse is large if the vent opening is small; with an increasing vent opening size, the leakage pressure increases and the internal impulse decreases; however, at the ideal vent opening size, leakage pressure does not increase.
II.
Vent opening location has an impact on leakage pressure. While the assessment method in the current UFC3-340-02 Specification is not available, the computer simulation is applicable instead. Where the blast point is beyond the range of the vent opening, the leakage decreases; thus, it would be relatively conservative when the effect is ignored in design.
III.
The thickness of the concrete wall has an impact on leakage pressure, as the blast energy will be absorbed by the wall. While the assessment method in the current UFC3-340-02 Specification is not available, the computer simulation is applicable instead. The accuracy of this simulation result should be subject to further validation through experiments. The thickness of the wall has an impact on vent opening size; when thickness is small, the resistance of the wall is small; when the vent opening size is small, leakage pressure is low, but the internal impulse is large. With increasing wall thickness, while the vent opening size and leakage pressure increase, the internal impulse decreases. However, at the ideal thickness, the vent opening decreases while the leakage pressure decreases. At an excessive wall thickness, there is no vent opening and no leakage pressure.
IV.
The strength of a concrete wall has an impact on leakage pressure, as the blast energy will be absorbed by the wall. While the assessment method in the current UFC3-340-02 Specification is not available, the computer simulation is applicable instead. However, the accuracy of the simulation result should be subject to further validation through experiments. While its behaviors are similar to the impact of the thickness of a wall, the impact of the strength of concrete is easily controlled due to the range limit of the strength of concrete.

Funding

This research received no external funding.

Conflicts of Interest

The author does not have any conflicts of interest with another.

References

  1. Department of Defense. Department of Defense Ammunition and Charge Safety Standards; Department of Defense: Washington, DC, USA, 2012.
  2. Keenan, W.A.; Tancreto, J.E. Design Criteria for Frangible Covers in Ordnance Facilities. In Proceedings of the Twentieth Department of Defense Safety Seminar, Norfolk, VA, USA, 24–26 August 1982. [Google Scholar]
  3. Wager, P.C. Yield, Line Analysis of Slabs with Covered Vents. In Proceedings of the 26th Department of Defense Explosives Safety Seminar, Miami, FL, USA, 16–18 August 1994. [Google Scholar]
  4. Department of Defense. Design and Analysis of Hardened Structures to Conventional Weapons Effects; UFC: Washington, DC, USA, 2002.
  5. Department of Defense. Structures to Resist the Effects of Accidental Blasts; UFC: Washington, DC, USA, 2014.
  6. Keenan, W.A.; Tancreto, J.E. Blast Environment from Fully and Partially Vented Blast in Cubicles. In US ARMY Report CEL-TR-828; DTIC: Fort Belvoir, VA, USA, 1975. [Google Scholar]
  7. Hokanson, J.C.; Esparza, E.D.; Baker, W.E.; Sandoval, N.R. Internal Blast Measurements in a Model of the Pantex Damaged Weapons Facility. In Proceedings of the Twentieth Department of Defense Safety Seminar, Norfolk, VA, USA, 24–26 August 1982. [Google Scholar]
  8. Tancreto, J.E.; Zehrt, W.H., Jr. Design for Internal Quasi-Static Pressures from Partially Confined Blasts. In Proceedings of the 28th Department of Defense Explosives Safety Seminar, Orlando, FL, USA, 18–20 August 1998. [Google Scholar]
  9. Chen, H.C. Applications of Arbitrary Lagrangian-Eulerian in Confined Blast Simulation. Master’s Thesis, Chung Cheng Institute of Technology, National Defense University, Taoyuan, Taiwan, 2008. [Google Scholar]
  10. Chung, C.N. Experiment and Numerical Simulation of External Tunnel Blast. Master’s Thesis, Chung Cheng Institute of Technology, National Defense University, Taoyuan, Taiwan, 2011. [Google Scholar]
  11. Hung, C.W. Prediction Model of Airblast Pressure for Ammunition depot Subjected to Near-Field Blast. Ph.D. Thesis, Chung Cheng Institute of Technology, National Defense University, Taoyuan, Taiwan, 2012. [Google Scholar]
  12. Pi, S.R. Experimental and Numerical Analyses of Underground Command Center Subjected to Near-Field Blast. Ph.D. Thesis, Chung Cheng Institute of Technology, National Defense University, Taoyuan, Taiwan, 2015. [Google Scholar]
  13. Hallquist, J.O. LS-DYNA Version 971 Theory’s Manual; Livermore Software Technology Corporation: Livermore, CA, USA, 2006; pp. 1–680. [Google Scholar]
  14. Haufe, A.; Weimar, K.; Gohner, U. Advanced Airbag Simulation Using Fluid-Structure-Interaction and the Eulerian Method in LS-DYNA; DYNAmore Gmbh: Deutschland, Germany, 2004. [Google Scholar]
  15. Gebbeken, N.; Ruppert, M. On the Safety and Reliability of High Dynamic Hydrocode Simulations. Int. J. Numer. Methods Eng. 1999, 46, 839–851. [Google Scholar] [CrossRef]
  16. Cheng, D.S.; Hung, C.W.; Pi, S.J. Numerical Simulation of Near-Field Blast. J. Appl. Sci. Eng. 2013, 16, 61–67. [Google Scholar]
  17. Schwer, L.E.; Malvar, L.J. Simplified concrete modeling with *MAT_ Concrete_ Damage_ Rel3. In JRI LS-Dyna User Week; Roadsafe LLC: Livermore, CA, USA, 2005. [Google Scholar]
  18. Akers, S.; Weed, R.; Rickman, D.; Danielson, K. Numerical simulations of explosive wall breaching. In Proceedings of the Users Group Conference, Nashville, TN, USA, 27–30 June 2005. [Google Scholar]
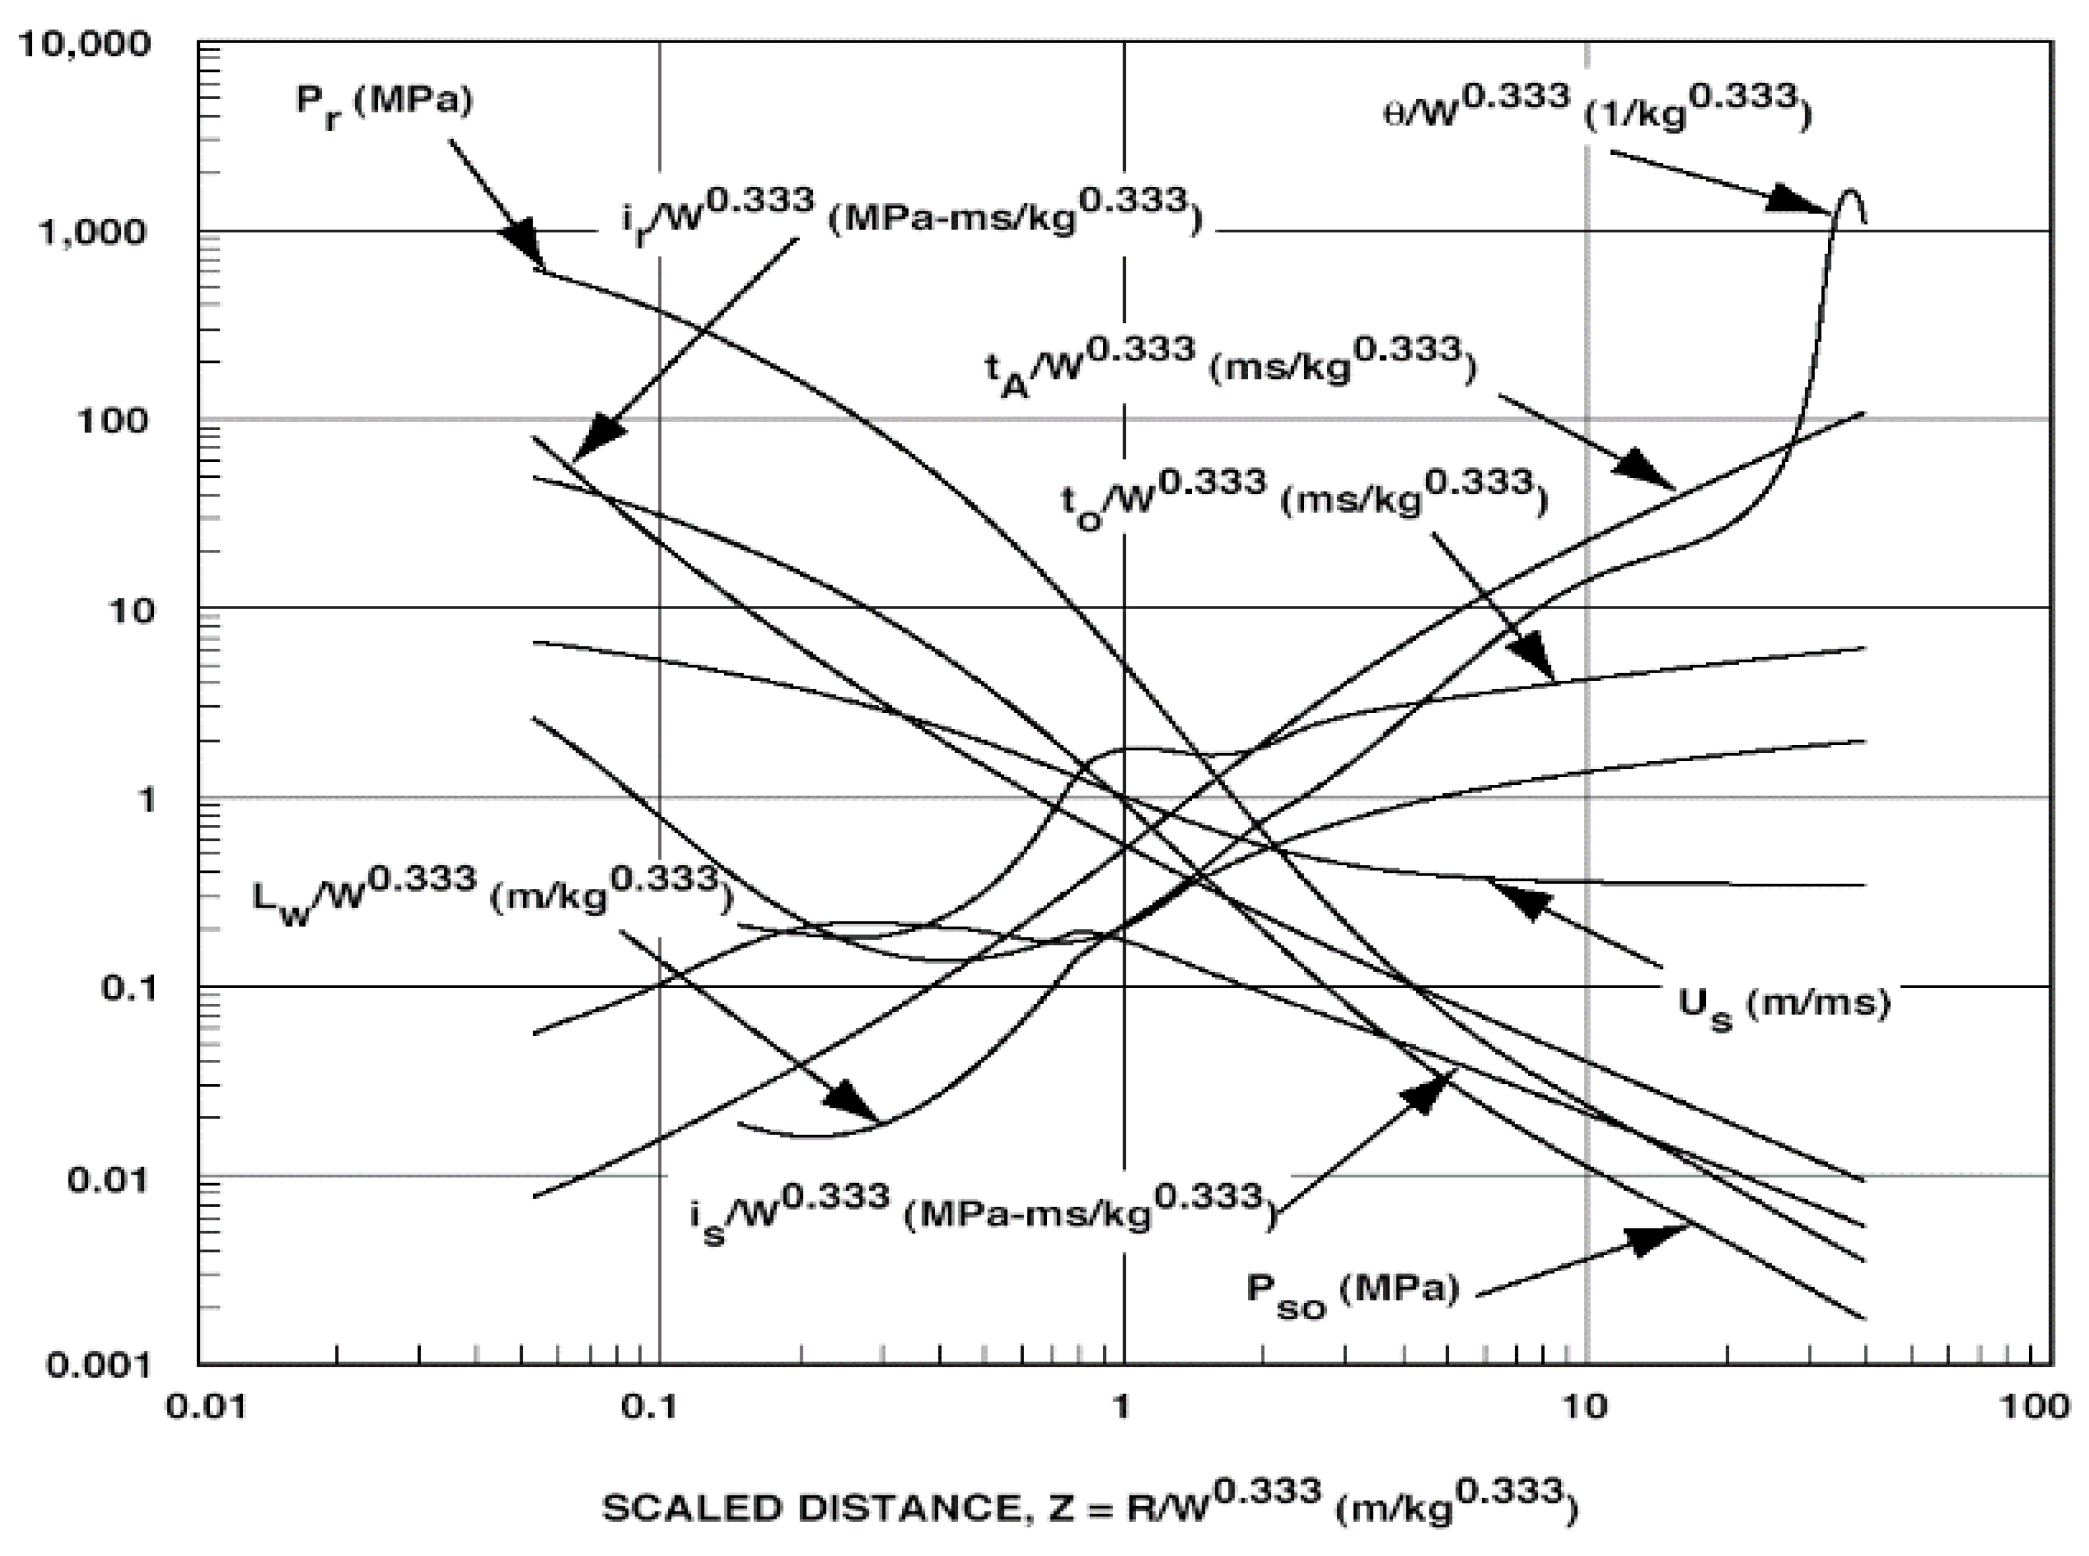
Figure 1. Blast pressure parameters of a blast in free air [4].
Applsci 10 01041 g001
Figure 2. Value of N and corresponding values of h/H and l/L under the resistant condition of the structure [5].
Applsci 10 01041 g002
Figure 3. Evenly distributed blast pressure [5].
Applsci 10 01041 g003
Figure 4. Evenly distributed impulse [5].
Applsci 10 01041 g004
Figure 5. UFC3-340-01 Quasi-Static Pressure [4].
Applsci 10 01041 g005
Figure 6. Quasi-Static Pressure [5].
Applsci 10 01041 g006
Figure 7. Gas pressure impulse [5].
Applsci 10 01041 g007
Figure 8. Blast pressure on the interior wall of the structure [4].
Applsci 10 01041 g008
Figure 9. Four sides and the roof are resistant, and the vent opening location is on the wall [5].
Applsci 10 01041 g009
Figure 10. Blast pressure at the front of the vent opening location [5].
Applsci 10 01041 g010
Figure 11. Diagram of mesh features of Lagrangian Description, Eulerian Description, and arbitrary Lagrangian–Eulerian (ALE) Description [14].
Applsci 10 01041 g011
Figure 12. Schematic diagram of ratio of Eulerian meshes to Lagrangian meshes [15].
Applsci 10 01041 g012
Figure 13. Failure curve chart of concrete material [17].
Applsci 10 01041 g013
Figure 14. Schematic diagrams of computation steps of numerical mapping [12].
Applsci 10 01041 g014
Figure 15. Schematic diagram of ALE Fluid–Structure Interaction numerical model of internal blast in the ammunition depot.
Applsci 10 01041 g015
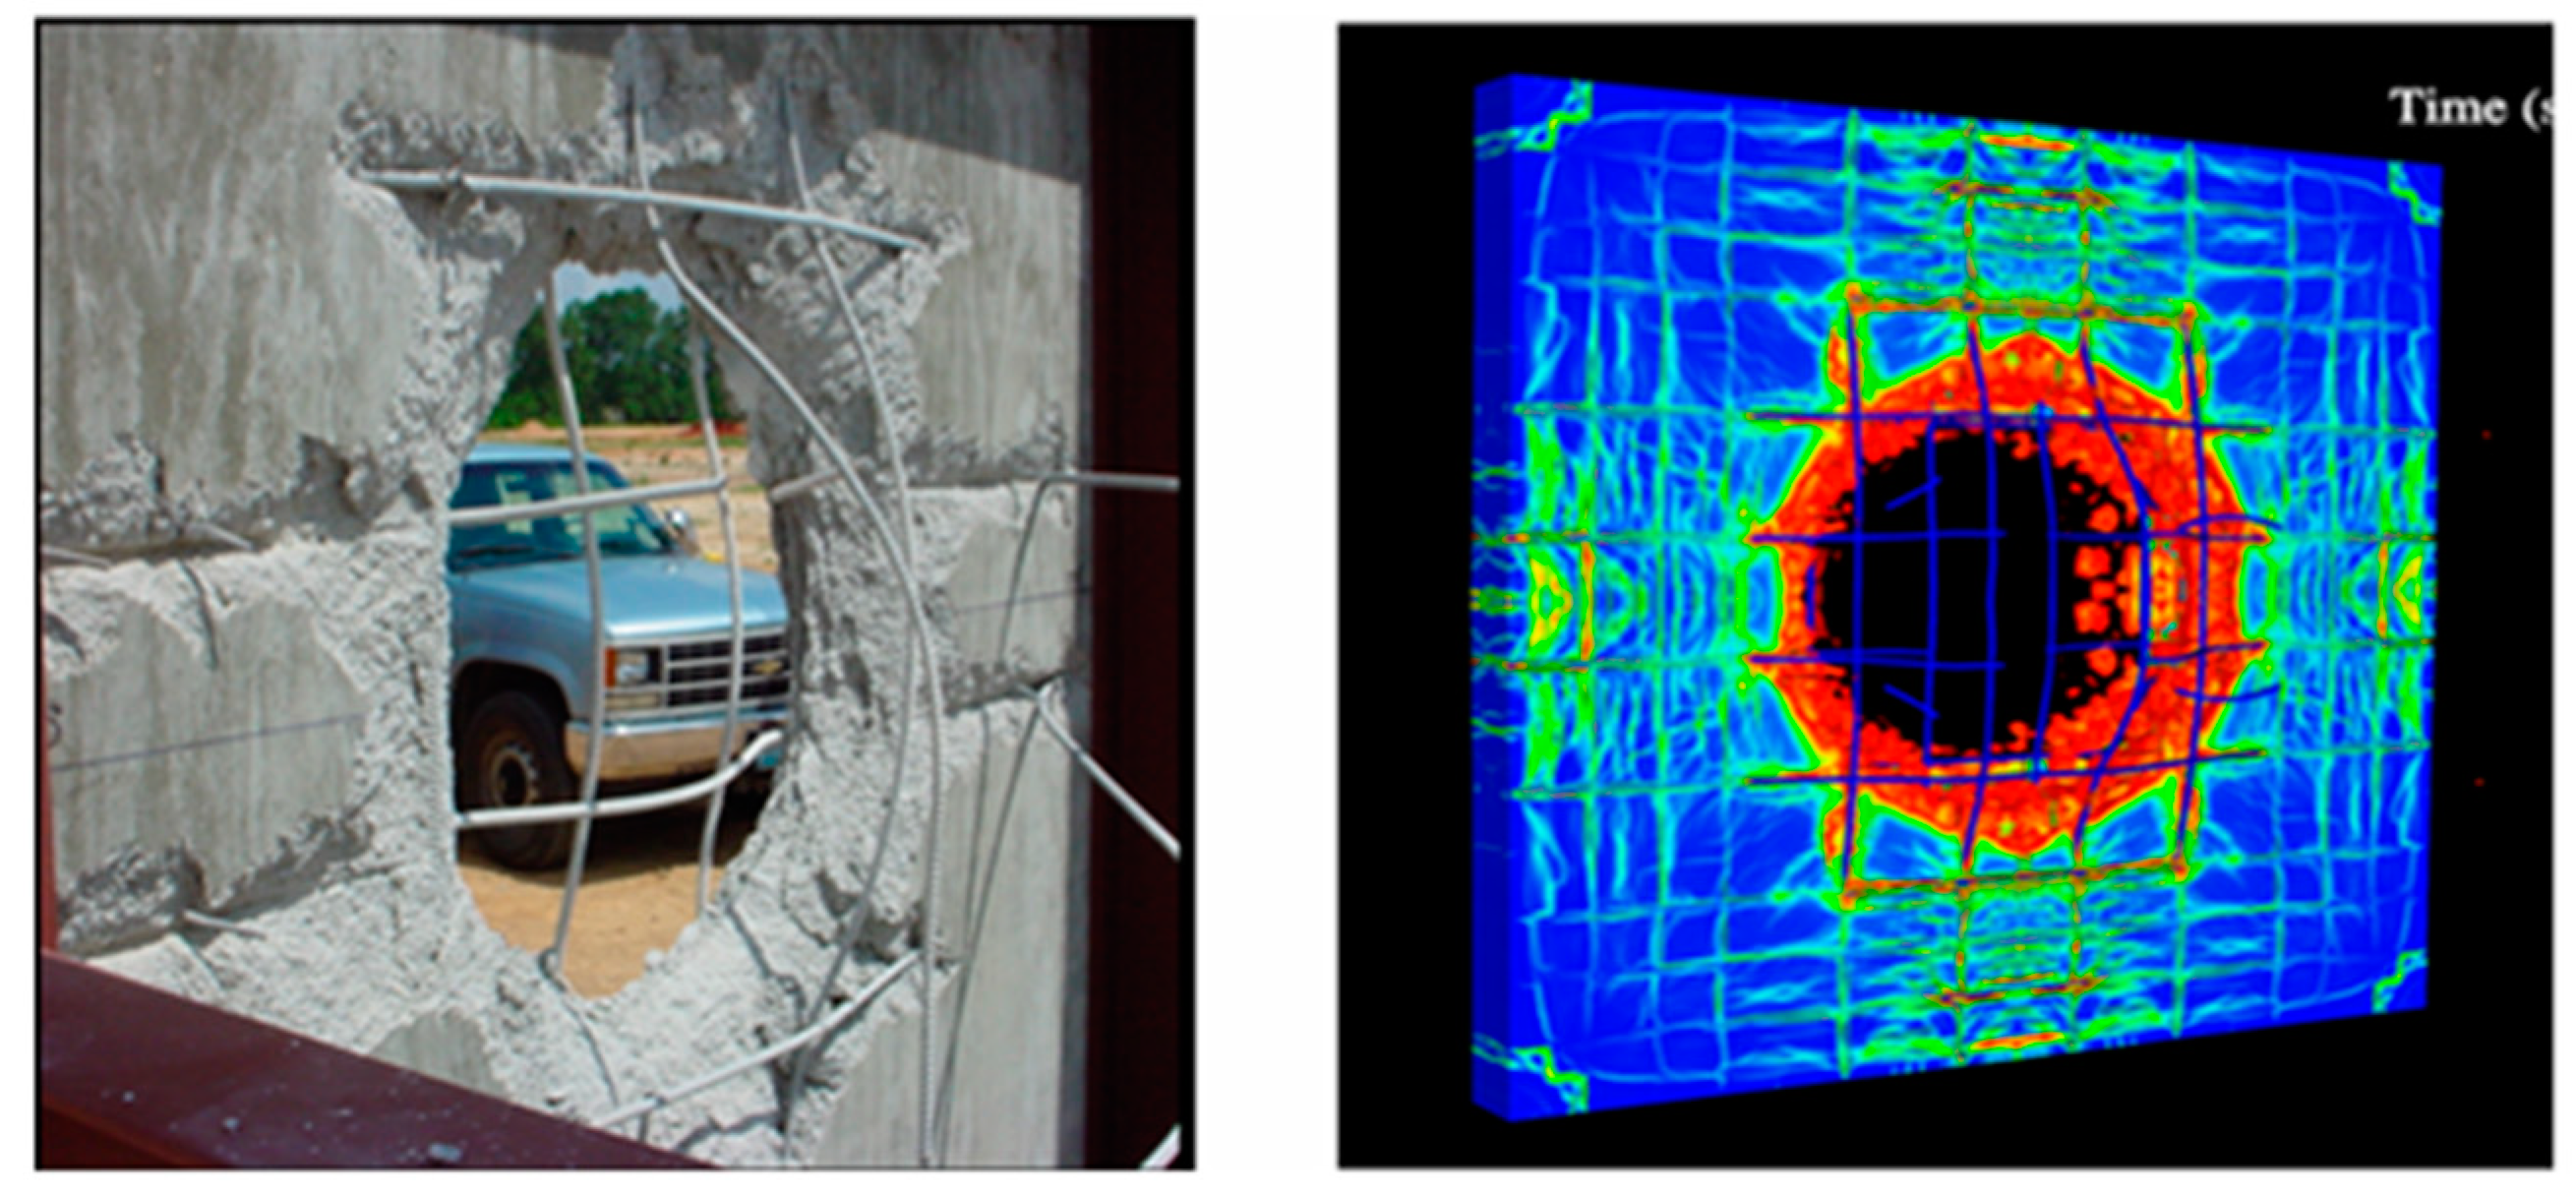
Figure 16. Schematic diagram of blasting through a fragile wall and numerical simulation [18].
Applsci 10 01041 g016
Figure 17. Finite element model.
Applsci 10 01041 g017
Figure 18. Computer simulation result of one pound of TNT at a blast height of 10 cm.
Applsci 10 01041 g018
Figure 19. Schematic diagram of duration of blast pressure of the 20 × 20 cm vent opening.
Applsci 10 01041 g019
Figure 20. Impact of vent opening size on leakage pressure.
Applsci 10 01041 g020
Figure 21. Comparison between leakage pressure of a 20 × 20 cm vent opening and the specified value in UFC3-340-02.
Applsci 10 01041 g021
Figure 22. Comparison between leakage pressure o a 40 × 40 cm vent opening and the specified value in UFC3-340-02.
Applsci 10 01041 g022
Figure 23. Impact of charge weight on computer simulation result.
Applsci 10 01041 g023
Figure 24. Impact of the location of vent opening on computer simulation results.
Applsci 10 01041 g024
Figure 25. Damages to interior and exterior walls of different thickness.
Applsci 10 01041 g025aApplsci 10 01041 g025b
Table 1. Comparison table of blast pressure and impulse at the value of N and corresponding values of h/H and l/L [5].
h/Hl/LAverage Peak Reflected PressureScaled Average Unit Reflected Impulse
Number of Adjacent Reflecting Surfaces
OneTwoThreeFourOneTwoThreeFour
0.100.102-522-642-802-922-1012-1132-1292-141
0.252-532-652-812-932-1022-1142-1302-142
0.502-542-662-822-942-1032-1152-1312-143
0.752-532-672-812-932-1022-1162-1302-142
0.250.102-552-682-832-952-1042-1172-1322-144
0.252-562-692-842-962-1052-1182-1332-145
0.502-572-702-852-972-1062-1192-1342-146
0.752-562-712-842-962-1052-1202-1332-145
0.500.102-582-722-862-982-1072-1212-1352-147
0.252-592-732-872-992-1082-1222-1362-148
0.502-602-742-882-1002-1092-1232-1372-149
0.752-592-752-872-992-1082-1242-1362-148
0.750.102-612-762-892-952-1102-1252-1382-144
0.252-622-772-902-962-1112-1262-1392-145
0.502-632-782-912-972-1122-1272-1402-146
0.752-622-792-902-962-1112-1282-1392-145
Table 2. Setting values of initial internal energy of air at different temperatures.
γ ρ c u r r e n t ρ i n i t i a l ρ i n i t i a l ( k g m 3 ) C v ( k J k g K ) T   ( K ) E 0 ( Mbar ) C 0 ( Mbar )
1.411.290.7165273.15 2.53 × 10 6 0
288.15 2.67 × 10 6 5.46 × 10 8
1000 9.27 × 10 6 2.69 × 10 6
2000 1.86 × 10 5 6.40 × 10 6
3000 2.78 × 10 5 1.01 × 10 5
Table 3. Setting values of parameters of air material and state equation.
Input values of air material and state equation (Unit = cm, g, μs, Mbar)
Mat_Null (Air)
RoPcMuTerodCerodYmPr
0.00129-1.79 × 10⁻¹⁰----
Eos_Linear_Polynomial (State equation of air)
C0C1C2C3C4C5C6E0V0
−5.46 × 10−80000.40.402.67 × 10−61
Table 4. Setting values of parameters of TNT charge material and state equation.
Input values of TNT charge material and state equation (Unit = cm, g, μs, Mbar)
Mat_High_Explosive_Burn (Charge)
RoDvPcjBetaKGSigy
1.630.6930.210000
Eos_Jwl (State equation of charge)
ABR1R2ΩEoVo
3.7120.032314.150.950.30.0701
Table 5. Parameter values of concrete.
Parameter values of concrete (Unit = g, cm, μs, Mbar)
Mat_Concrete_Damage_Rel3
RoPrA0RsizeUcf
2.40.2−2.068 × 10−40.39731.45 × 107
Table 6. Strain rates and dynamic amplification coefficients.
Strain Rate (1/μs)Dynamic Amplification CoefficientStrain Rate (1/μs)Dynamic Amplification Coefficient
−3 × 10−29.703 × 10−111.00
−3 × 10−49.701 × 10−101.03
−1 × 10−46.721 × 10−091.08
−3 × 10−54.501 × 10−081.14
−1 × 10−53.121 × 10−071.20
−3 × 10−62.091 × 10−061.26
−1 × 10−61.453 × 10−061.29
−1 × 10−71.361 × 10−051.33
−1 × 10−81.283 × 10−051.36
−1 × 10−91.201 × 10−042.04
−1 × 10−101.13
−1 × 10−111.06
0.001.00
Table 7. Parameter values of rigid body.
Parameter values of ground (Unit= g, cm, μs, Mbar)
MAT_Rigid
RoERr
1.81.916 × 10−30.3
Table 8. Blast pressure and impulse of 20 × 20 cm vent opening.
Distance from Blast Point1-Pound TNT–20 × 20 cm Vent Opening Model (Blast Height 10 cm)
Observation Point Height
10 cm20 cm30 cm
Blast Pressure BarImpulse Bar, msBlast pressure BarImpulse Bar, msBlast Pressure BarImpulse Bar, ms
30 cm37.40.799--------
40 cm33.11.99017.30.6015.240.320
50 cm28.62.42013.21.4706.70.489
60 cm201.610151.0608.890.771
70 cm14.41.12011.21.0007.70.921
80 cm10.61.1108.71.0706.60.939
90 cm7.651.2306.631.4105.361.140
Center of the side wall of the ammunition depotCenter of the back wall of the ammunition depotCenter of the roof of the ammunition depot
Blast pressure barImpulse bar, msBlast pressure barImpulse bar, msBlast pressure barImpulse bar, ms
12836.71711936.2275913.748
Table 9. Blast pressure and impulse of 40 × 40 cm vent opening.
Distance from Blast Point1-Pound TNT–40 × 40 cm vent Opening Model (Blast Height 10 cm)
Observation Point Height
10 cm20 cm30 cm
Blast Pressure BarImpulse Bar, msBlast Pressure BarImpulse Bar, msBlast Pressure BarImpulse Bar, ms
30 cm37.40.78238.70.91935.31.040
40 cm33.11.90023.91.06022.71.100
50 cm28.61.71116.21.66015.41.230
60 cm20.91.65019.92.18011.22.080
70 cm15.81.90014.62.15013.82.070
80 cm12.22.05011.61.97010.71.860
90 cm9.41.8509.11.8808.581.840
Center of the side wall of the ammunition depotCenter of the back wall of the ammunition depotCenter of the roof of the ammunition depot
Blast pressure barImpulse bar, msBlast pressure barImpulse bar, msBlast pressure barImpulse bar, ms
12830.01011935.50239.89.592
Table 10. Blast pressure and impulse of the 60 × 60 cm full vent opening.
Distance from Blast Point1-Pound TNT–Full Vent Model (Blast Height 10 cm)
Observation Point Height
10 cm20 cm30 cm
Blast Pressure BarImpulse Bar, msBlast Pressure BarImpulse Bar, msBlast Pressure BarImpulse Bar, ms
30 cm37.40.90338.70.92735.30.995
40 cm33.11.92023.91.06022.71.100
50 cm28.61.72016.21.66015.41.220
60 cm20.91.64019.91.82011.31.670
70 cm15.81.76014.61.68013.82.570
80 cm12.22.66011.62.83010.73.100
90 cm9.42.7209.13.1008.63.390
Center of the side wall of the ammunition depotCenter of the back wall of the ammunition depotCenter of the roof of the ammunition depot
Blast pressure barImpulse bar, msBlast pressure barImpulse bar, msBlast pressure barImpulse bar, ms
12719.19311822.41526.44.382
Table 11. Blast pressure and impulse of 20 × 20 cm vent opening at the blast height of 20 cm.
Distance from Blast Point1-Pound TNT–20 × 20 cm Vent Opening Model (Blast Height 20 cm)
Observation Point Height
10 cm20 cm30 cm
Blast Pressure BarImpulse Bar, msBlast Pressure BarImpulse Bar, msBlast Pressure BarImpulse Bar, ms
30 cm37.50.886-----------------
40 cm23.50.58812.70.4603.651.100
50 cm26.71.9909.90.6504.180.862
60 cm20.11.14011.20.8074.860.891
70 cm13.71.1309.60.8396.270.895
80 cm10.41.2207.761.2705.581.020
90 cm7.741.2506.381.1804.860.932
Center of the side wall of the ammunition depotCenter of the back wall of the ammunition depotCenter of the roof of the ammunition depot
Blast pressure barImpulse bar, msBlast pressure barImpulse bar, msBlast pressure barImpulse bar, ms
17343.12711542.36458.811.476
Table 12. Blast pressure and impulse of 20 × 20 cm vent opening at the blast height of 30 cm.
Distance from Blast Point1-Pound TNT–20 × 20 cm Vent Opening Model (Blast Height 30 cm)
Observation Point Height
10 cm20 cm30 cm
Blast Pressure BarImpulse Bar, msBlast Pressure BarImpulse Bar, msBlast Pressure BarImpulse Bar, ms
30 cm361.630--------------
40 cm240.9058.490.3313.950.273
50 cm11.11.1106.120.9372.71.280
60 cm16.51.0506.81.2005.831.150
70 cm10.61.0107.91.1305.030.967
80 cm7.71.4106.21.1504.480.876
90 cm5.621.4204.791.1303.810.921
Center of the side wall of the ammunition depotCenter of the back wall of the ammunition depotCenter of the roof of the ammunition depot
Blast pressure barImpulse bar, msBlast pressure barImpulse bar, msBlast pressure barImpulse bar, ms
18147.61112146.49017415.025
Table 13. Impact of wall thickness on leakage pressure.
1-Pound TNT Blast Point 10 cm from 3000 psi Concrete Wall, Blast Height 10 cm Unit: Bar
Wall thickness 3 cm
Distance behind the wallMeasurement height 10 cmMeasurement height 20 cmMeasurement height 30 cm
7 cm5.272.934.95
17 cm3.932.883.31
27 cm1.381.211.09
Wall thickness 5 cm
Distance behind the wallMeasurement height 10 cmMeasurement height 20 cmMeasurement height 30 cm
5 cm7.843.21.88
15 cm5.713.583.81
25 cm2.851.410.88
Wall thickness 7 cm
Distance behind the wallMeasurement height 10 cmMeasurement height 20 cmMeasurement height 30 cm
3 cm2.911.21.22
13 cm3.331.981.32
23 cm1.260.780.8
Table 14. Impact of the strength of concrete on leakage pressure.
1-Pound TNT Blast Point 10 cm from Concrete Wall, 5 cm-Thick Wall, Blast Height 10 cm Unit: Bar
3000 psi
Distance behind the wallMeasurement height 10 cmMeasurement height 20 cmMeasurement height 30 cm
5 cm7.843.21.88
15 cm5.713.583.81
25 cm2.851.410.88
4500 psi
Distance behind the wallMeasurement height 10 cmMeasurement height 20 cmMeasurement height 30 cm
5 cm7.473.792.06
15 cm5.983.912.75
25 cm2.871.430.89
6000 psi
Distance behind the wallMeasurement height 10cmMeasurement height 20cmMeasurement height 30cm
5 cm5.913.032.0
15 cm5.533.672.66
25 cm2.531.320.81