Article

Experimental Study on the Permeability Evolution and Gas Flow Law of Post-Strength Soft Coal

1
School of Civil Engineering, Chongqing University, Chongqing 400045, China
2
Collaborative Innovation Center for Safe Production and Clean and Efficient Utilization of Coal, Henan Polytechnic University, Jiaozuo 454000, China
3
School of Energy Science and Engineering, Henan Polytechnic University, Jiaozuo 454000, China
4
Key Laboratory of New Technology for Construction of China in Mountainous Area, Chongqing University, Chongqing 400045, China
5
School of Economics and Business Administration, Chongqing University, Chongqing 400044, China
*
Author to whom correspondence should be addressed.
Appl. Sci. 2020, 10(3), 1039; https://doi.org/10.3390/app10031039
Submission received: 20 December 2019 / Revised: 22 January 2020 / Accepted: 25 January 2020 / Published: 4 February 2020
(This article belongs to the Section Earth Sciences)

Abstract

:
Permeability is an essential indicator for predicting gas drainage yield and preventing mine gas disasters, which is significantly influenced by the stress paths and the integrity of coal. Conventional research on permeability mainly focused on the permeability evolution of initial undamaged or fractured (prefabricated fractures) coal under various stress paths; little attention has been paid to post-strength coal (stress-induced damage), especially for soft coal. To determine the permeability evolution and gas flow law of post-strength soft coal samples under various stress paths, we used the experimental method combined with the numerical method in this study. The results showed that when the confining pressure and axial pressure of post-strength soft coal samples were unloaded, the permeability increased by 1.25–1.32 times; when the coal samples were loaded into the secondary damage, the permeability first decreased and then increased. The simulation part in this study found that the development of the fracture of coal samples under triaxial compression was divided into four stages. Gas flow law of post-strength soft coal was significantly influenced by fracture locations, and the gas pressure and gas flow field near the fracture were disturbed.

1. Introduction

China is one of the countries with the most severe gas disasters in the world [1]. According to the statistics, from 2013 to 2017, there were 1945 coal mine accidents in China, of which 218 were caused by gas, accounting for 11.21% of the total [2]. Coal is a porous medium with abundant internal pores [3]. To recognize the gas flow law in coal, many theories have been developed, e.g., Darcy’s permeation, Fick’s diffusion, the diffusion-permeation mixture, etc. [4,5,6,7]. Based on the above theories, researchers found that the flow law of gas in coal is mainly determined by the gas pressure and the permeability of the coal seam; the permeability is significantly influenced by the stress paths and the integrity of coal [8,9]. Thus, it is necessary to investigate the permeability evolution of different integrity (undamaged, fractured, post-strength) states of coal under various stress paths (loading, cyclic loading, unloading).
Previous studies on the permeability changes with different stress paths and different integrity states of coal are mainly divided into four aspects. First, the permeability change rules of initial undamaged coal under loading conditions were studied. In the mining process, the original stress distribution is destroyed by the mining activities and forms the stress concentration zone, resulting in the change of permeability. The permeability of initial undamaged coal is intensely sensitive to the effective stress and decreases with the increase of the effective stress, and it is also affected by the swelling stress of coal [10,11,12]. There is an exponential relationship between the permeability and the effective stress, and the permeability anisotropy of undamaged coal under effective stress shows a dynamic development change law [13,14]. Second, the permeability change rules of initial undamaged coal under cyclic loading and unloading conditions were studied. With the advancing of the working face in the mining process, the overlying coal and rock are subjected to repeated loading and unloading stress. The permeability is significantly influenced by the repeated mining cycles. When the stress exceeds a specific value, the permeability increases with the increases of loading and unloading cycles. Conversely, the permeability decreases with the cyclic loading and unloading cycles [15,16,17]. Other parameters relevant to permeability were investigated to further understand the permeability evolution with cyclic loading and unloading stress, for instance the recovery rate, residual deformation, acoustic emission (AE) characteristics, and energy dissipation [18,19]. Third, the permeability change rules of fractured (prefabricated fractures) coal under loading conditions were studied. In the stress concentration zone, some coal is damaged, but since the stress changes complexly in front of the working face, the fractured coal is still in the stress loading stage. An increase in axial stress results in the expansion of the fracture and a decrease of the permeability [20], and the anisotropy of permeability in fractured coal is more evident than in intact coal [21]. Fourth, the permeability change rules of fractured coal (prefabricated fractures) under cyclic loading and unloading conditions were studied. In the mining process, some coal has reached the peak strength and damage, and the fractured coal is loaded and unloaded periodically under the repeated action of mining pressure and supporting resistance; even secondary damage occurs. The permeability of fractured coal can be modified by the evolution of the fracture network and is sensitive to the effective stress and stress paths [22,23].
The results of the literature review showed that most of the studies were focused on the permeability evolution in the loading stage, cyclic loading, and unloading stage of initial undamaged or fractured (prefabricated fractures) coal. However, little attention has been paid to the permeability evolution in different loading stages of post-strength coal (stress-induced damage), especially for soft coal, which has a high gas content, high gas pressure, and low gas permeability [24]. Therefore, in this work, we used the experimental method combined with the numerical method to investigate the permeability evolution of post-strength soft coal. First, the coal samples with different confining pressures (2 MPa, 3 MPa, 4 MPa) were loaded until they reached peak strength and were damaged. Then, the permeability evolution of post-strength coal samples during unloading axial stress and confining pressure and during loading to secondary damage was studied. On this basis, the fracture development mechanism of soft coal samples under triaxial compression and the gas flow law of coal samples with different fracture locations were explored by the numerical methods.

2. Materials and Methods

2.1. Materials and Specimens

The coal samples collected in this experiment were from Da-ping Coal Mine of the Zheng-mei group, Henan Province, China. The consistent coefficient of the coal samples was 0.3, which belonged to soft coal (according to the Standard for Engineering Classification of Rock Mass -GB/T 50218-2014 [25], coal with a consistent coefficient less than three is defined as soft coal). They were made into cylinder coal samples with the size of Φ 50 mm × H100 mm. The manufacturing process of coal samples was as follows: the coal samples were crushed into pulverized coal, screened with a 0.5 mm sieve, then stirred with a certain proportion of water evenly, pressed with a pressure of 200 KN for 30 min, and stripped on the hydraulic machine. These cylindrical specimens were naturally dried in a drying vessel for two weeks before testing. The numbering of coal samples is M1, M2, and M3, and the letter M represents coal. The images of manufactured coal samples are shown in Figure 1.

2.2. Apparatus

A triaxial creep-seepage test system for coal and rock equipment (Henan Polytechnic University, Jiaozuo, China) was employed to conduct the triaxial seepage tests. The instrument consisted of a press and model system, a gas supply system, a pressure and temperature test system, an outlet metering system, a computer acquisition and control processing system, etc. This equipment had high stiffness (5000 kN/mm), high load-sensing accuracy (2.5 N), and high deformation-sensing accuracy (0.75 mm). Its axial load could be controlled by force or displacement. Relevant parameters, including stress, strain, deformation, and gas pressure, were collected and recorded automatically during the triaxial seepage tests. The test device is shown in Figure 2.

2.3. Experimental Principle and Scheme

Suppose there is a rock with a cross-sectional area A and a length L, which is clamped in the core holder, as shown in Figure 3. The flow rate Q is measured by passing a fluid having a viscosity of μ through the center of the rock at a pressure difference ΔP. The experiment proves that the volume flow rate Q through the core per unit time is proportional to the pressure difference ΔP core cross-sectional area A and inversely proportional to the core length L and the viscosity of the fluid μ:
Q Q μ · Δ P L   or   Q = K Q μ · Δ P L .
Equation (1) is the so-called “Darcy equation.” It can be seen from the Equation (1) that A and L are the geometrical dimensions of the rock and ΔP is the external condition. When the external conditions, square sizes, and fluid properties are constant, the fluid throughput Q depends on the proportionality constant K. We refer to K as the permeability of the rock, then Equation (1) can be rewritten as:
K = Q μ L A Δ P
The previous discussion was based on the incompressible fluid (liquid). The gas permeability we designed was based on the compressed fluid (liquid), so the “Darcy equation” needs to be modified to apply it.
It is well known that the characteristics of compressible gas are that when the pressure increases, the fluid can be compressed; when the pressure is lowered, the fluid expands; when the temperature is constant, the expansion of the fluid obeys Boyle’s law. If considering the simplest flat line seepage, the inlet pressure is set as P1, and the outlet pressure is set as P2. When the pressure changes from P1 to P2, the volume of the gas necessarily changes, so the flow rate also varies. Therefore, it is necessary to consider substituting the average volumetric flow rate into the Darcy equation.
If the gas expansion is regarded as an isothermal process, according to Boyle’s law:
Q 1 P 1 = Q 2 P 2 = P 0 Q 0 = P Q ¯
Q ¯ = P 0 Q 0 P ¯     P ¯ = P 1 + P 2 2
Q ¯ = 2 P 0 Q 0 P 1 + P 2
where: P ¯ is the mean pressure, MPa; Q ¯ is the average volume flow under average pressure, mL/s; P0 is the atmospheric pressure, MPa; Q0 is the gas flow at atmospheric pressure, mL/s.
From the above analysis, the correction of the Darcy formula of the compressible fluid is:
K = 2 P 0 Q 0 μ g L A ( P 1 2 P 2 2 )
where μg is the viscosity of the gas, Pa s.
To simulate the permeability evolution with repeated increase and decrease of the stress on the post-strength coal seam in the process of coal mining, the test scheme adopted in this test was as follows: When the gas pressure was 0.7 MPa (this value was based on the geological conditions of the Da-ping Coal Mine), the confining pressure was 2 MPa, 3 MPa, and 4 MPa, and the axial stress was loaded until the coal samples were damaged. Then, the permeability evolution in the process of unloading axial stress and confining pressure and the permeability evolution in the process of loading axial stress to the secondary damage were measured. To make the experiment method clearer, we list the experimental scheme in Table 1. It should be noted that to determine the permeability of coal samples, we had to measure the gas flow rate. The error of permeability was mainly affected by the flowmeter, and the flowmeter we adopted in this test was 0.5 L with an accuracy of ±10 mL/min, then we could obtain the absolute deviation of permeability as ±0.045 mD. The data were collected automatically every 6 s during the experiment; due to the large amount of data, the data interval we used for analyzing was 18 s.

3. Experimental Results

3.1. Coal Sample M1

Coal sample M1 was under the experimental condition in which the gas pressure was 0.7 MPa and the confining pressure 2 MPa. The axial stress was loaded until the coal sample M1 was damaged. Then, the permeability evolution in the process of unloading the axial stress and confining pressure and loading the axial stress to the secondary damage of the coal sample M1 was measured. The following curves were obtained, as shown in Figure 4.
It can be seen from Figure 4a that after the coal sample M1 was damaged, the axial stress was unloaded from 12 MPa to 1 MPa at a rate of 20 N/S. As the axial stress decreased, the permeability gradually increased. When the axial stress was unloaded to 1 MPa, the permeability increased to about 1.08 mD, which was about 1.3 times that before unloading the axial stress.
It can be seen from Figure 4b that when the confining pressure was unloaded from 2 MPa to 1 MPa, the permeability gradually increased. When the confining pressure was unloaded to 1 MPa, the permeability increased to about 1.14 mD, which was approximately 1.32 times that before unloading.
It can be seen from Figure 4c,d that as the axial stress increased, the permeability gradually decreased. When the axial stress increased to a certain extent, the coal sample M1 underwent secondary damage, and the permeability began to increase steadily. The permeability changed to approximately U-shaped during the secondary damage process. The permeability of the coal sample M1 after initial damage was about 0.85 mD, and the permeability minimum value in the secondary damage process was about 1.05 mD. It can be seen that the permeability of the coal sample increased as a whole during the secondary damage process.

3.2. Coal Sample M2

Coal sample M2 was under the experimental condition in which the gas pressure was 0.7 MPa and the confining pressure 3 MPa. The axial stress was loaded until the coal sample M2 was damaged. Then, the permeability evolution in the process of unloading the axial stress and confining pressure and loading the axial stress to the secondary damage of the coal sample M2 was measured. The following curves were obtained, as shown in Figure 5.
It can be seen from Figure 5a that after the coal sample M2 was damaged, the permeability increased when the axial stress was unloaded from 15 MPa to 1 MPa, and the increased rate of permeability was slow first and then fast. The permeability was lower than that of coal sample M1, which was under the confining pressure of 2 MPa. When the axial stress was reduced to 1 MPa, the permeability increased to about 0.9 mD, which was about 1.25 times that before unloading the axial stress.
It can be seen from Figure 5b that when the confining pressure was unloaded from 3 MPa to 1 MPa, the radial restraint force of the coal sample decreased, and the permeability range increased approximately linearly. When the confining pressure was unloaded to 1 MPa, the permeability increased to about 1.15 mD, which was about 1.32 times that before unloading the confining pressure.
It can be seen from Figure 5c that when the confining pressure of the M2 coal sample was loaded from 1 MPa to 2 MPa, the fractures of the coal sample M2 were closed again, and its permeability was approximately linearly reduced. When the confining pressure was increased by 1 MPa, the permeability was reduced by about 1.17 times.
It can be seen from Figure 5d that when the axial stress was loaded from 1 MPa to 9 MPa, the coal sample underwent secondary damage. The peak intensity of the primary damage of the coal sample M2 was 2.33 times that of the secondary damage. During the secondary damage process, the change trend of permeability decreased first and then increased. Compared with Figure 5a, it can be seen that the permeability of the coal sample M2 after initial damage was about 0.72 mD, and the permeability minimum value in the secondary damage process was about 0.68 mD. The average permeability in the secondary damage process was higher than that during the initial damage process.

3.3. Coal Sample M3

Coal sample M3 was under the experimental condition in which the gas pressure was 0.7 MPa and the confining pressure 4 MPa. The axial stress was loaded until the coal sample M3 was damaged. Then, the permeability evolution in the process of unloading the axial stress and confining pressure and loading the axial stress to the secondary damage of the coal sample M3 was measured. The following curves were obtained, as shown in Figure 6.
It can be seen from Figure 6a that the axial stress of the coal sample M3 was loaded to 20 MPa under the condition of 4 MPa confining pressure, and then, the initial damage occurred. In the process of unloading axial stress from 20 MPa to 1 MPa, the permeability of coal sample M3 increased slowly. When the axial stress was unloaded to 1 MPa, the permeability increased by about 1.3 times that before unloading the axial stress.
According to Figure 6b, when the confining pressure was unloaded from 4 MPa to 1 MPa, the fractures binding force of coal sample M3 decreased, and the permeability increased gradually. When the confining pressure was unloaded to 1 MPa, the permeability was about 1.25 times that before unloading the confining pressure.
It can be seen from Figure 6c that when the confining pressure of the coal sample M3 was loaded from 1 MPa to 3 MPa, the fractures of the coal sample M3 were re-closed, and the gas seepage channel became smaller. The permeability range decreased approximately linearly, and the permeability decreased about 1.22 times when the confining pressure was increased by 2 MPa.
It can be seen from Figure 6d that when the axial stress was loaded from 1 MPa to 13 MPa, the coal sample M3 underwent secondary damage. The peak intensity of the initial damage of the coal sample M3 was 1.76 times that of the secondary damage. During the whole process, the permeability of the coal sample M3 first decreased and then increased. Compared with Figure 6a, it can be seen that the permeability of the coal sample M2 after initial damage was about 0.64 mD, and the permeability minimum value in the secondary damage process was about 0.62 mD. However, in general, the permeability of coal sample M3 in the secondary damage process was higher than that during the initial damage process, which was consistent with the permeability evolution of coal samples M1 and M2 in the same processes.

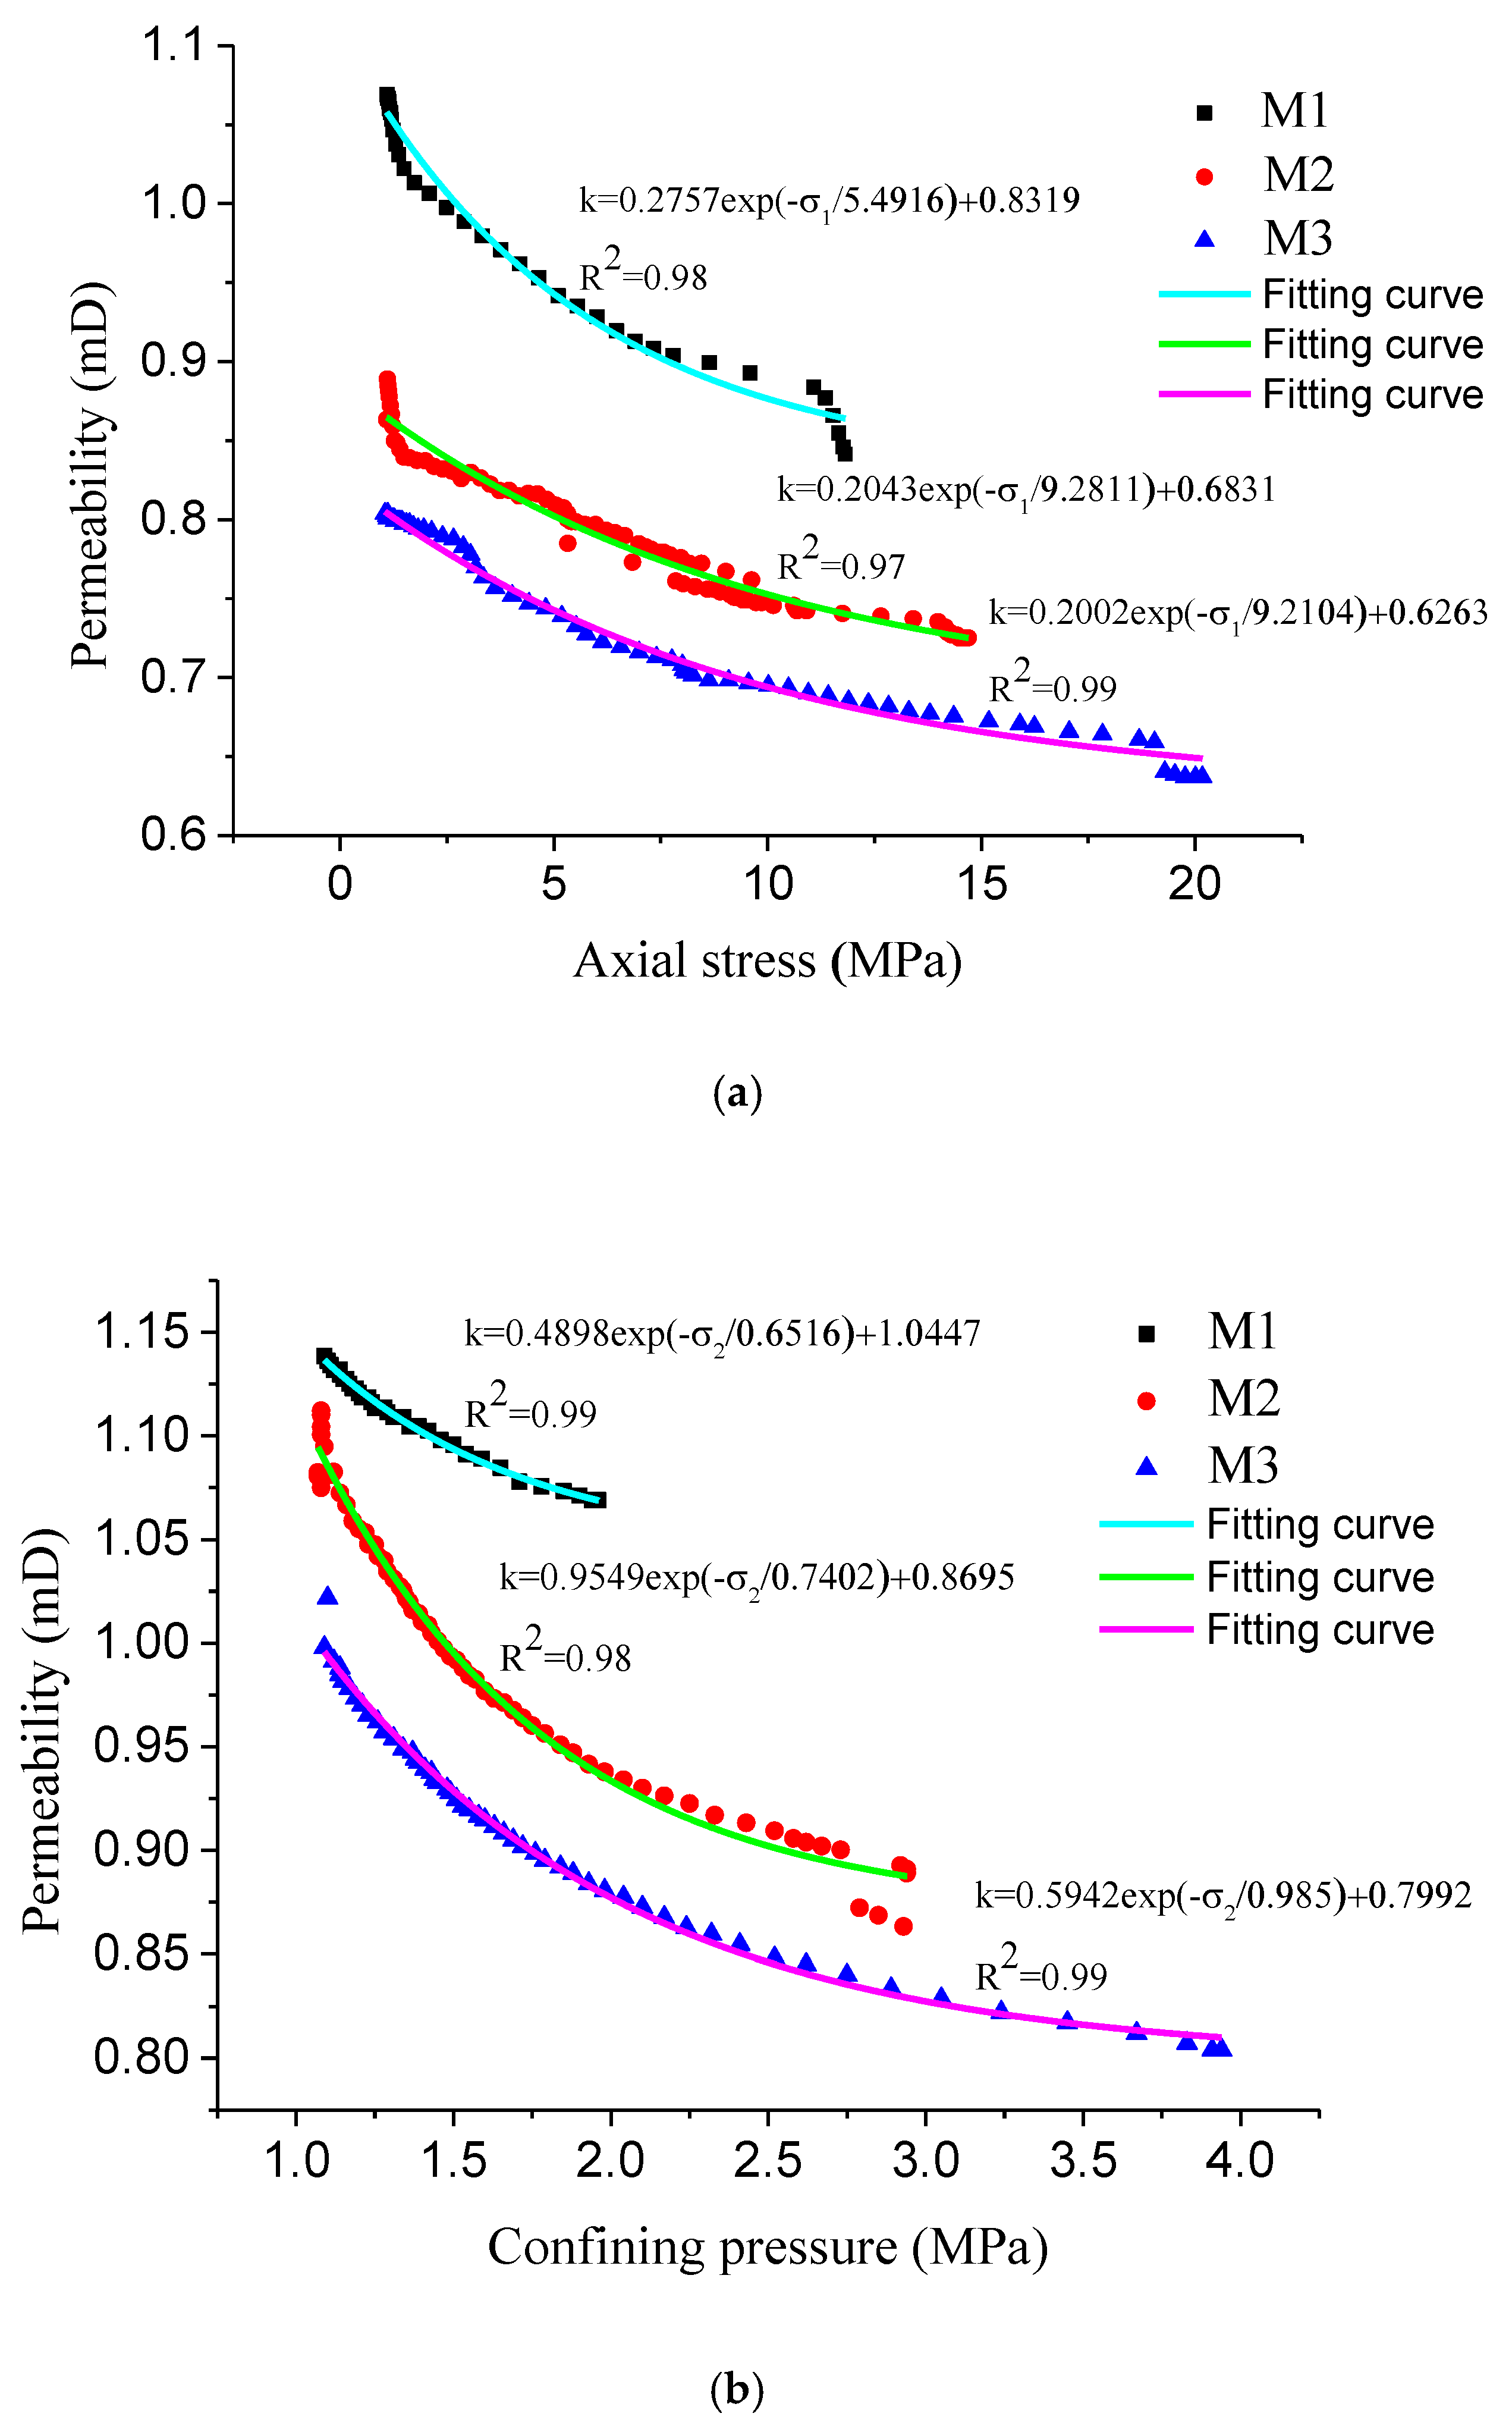
3.4. Permeability Evolution

The permeability evolution of coal samples with time is shown in Figure 7.
The table could be obtained b()y the statistics of the test data of each coal sample, as shown in Table 2.
As shown in Figure 7 and Table 2, the peak stress of coal samples M1, M2, and M3 was 14 MPa, 21 MPa, and 23 MPa, and the corresponding permeability of the peak stress point was 0.84 mD, 0.72 mD, and 0.64 mD. The permeability evolution trend of M2 and M3 was almost the same, but was different from M1; this was because M1 had no secondary loading confining pressure stage. In the secondary damage period, the rate of permeability evolution was significantly higher than in other conditions. The maximum value and the minimum value of permeability decreased with the growth of confining pressure, such as at Point E, the permeability of M1, M2, and M3 was 1.15 mD, 0.72 mD, and 0.63 mD, which showed a decreasing trend.
As shown in Figure 8, when the axial stress was unloaded, the permeability of coal samples increased, and the permeability decreased with the growth of confining pressure. When the axial stress was unloaded to 1 Mpa, the permeability of M1, M2, and M3 was 1.06 mD, 0.89 mD, and 0.80 mD. When the confining pressure was unloaded, the permeability increased; when confining pressure was unloaded to 1 MPa, the permeability of M1, M2, and M3 was 1.14 mD, 1.12 mD, and 1.03 mD. It can be seen that the permeability of M1 was higher than that of M2 and M3 under the same confining pressure. When the confining pressure was loaded, the permeability decreased; when the confining pressure was loaded to 2 MPa, the permeability of M2 and M3 was 0.95 mD and 1.1 mD. When the coal samples were loaded to the secondary damage, the permeability first decreased, then increased, and the permeability still decreased with the increase of confining pressure. From the above analysis, we could know under any condition that the permeability was M1 > M2 > M3, and this was due to that fact that as the confining pressure increased, the micropores in the coal body were compacted, resulting in a decrease in porosity. The permeability evolution with axial stress and confining pressure in the unloading process showed an exponential relation; however, in the loading confining pressure process, the relationship was linear.

4. Study of the Fracture Development Mechanism of the Coal Samples

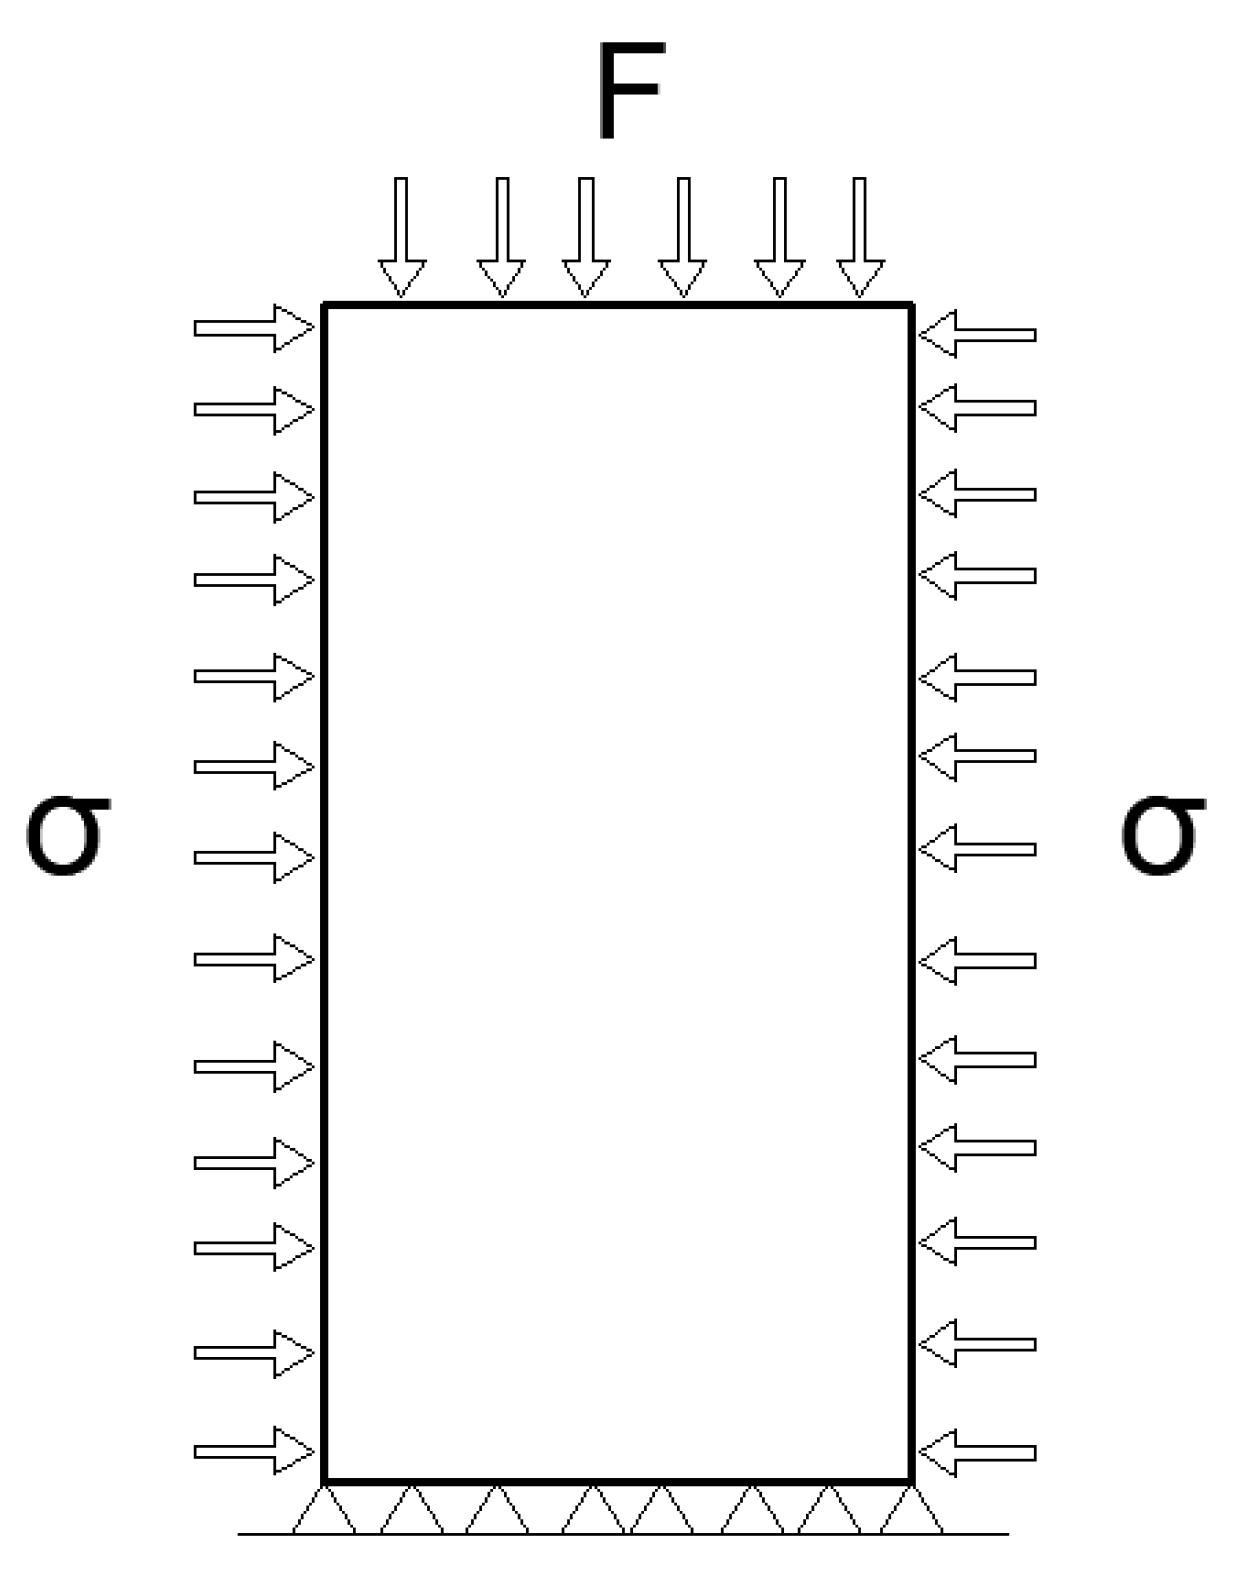
4.1. Model Establishment

The coal samples’ damage processes were also the cumulative damage and fracture process of the internal fracture generation, expansion, and penetration of the coal matrix. Studying the mechanism of fractures propagation and penetration is essential for studying the evolution of permeability. The numerical simulation model was established in the RFPA (Realistic Failure Process Analysis) 2D with a size of W50 mm × H100 mm, which was divided into 120 × 240 grids. The Mohr–Coulomb strength criterion was selected. The loading mode was stress loading with each step loaded with 0.1 MPa, and the bottom was fixed both vertically and horizontally. The fracture development mechanism of the coal samples under different confining pressure was compared and studied. The established model is shown in Figure 9, and the basic parameters of the model are shown in Table 3.

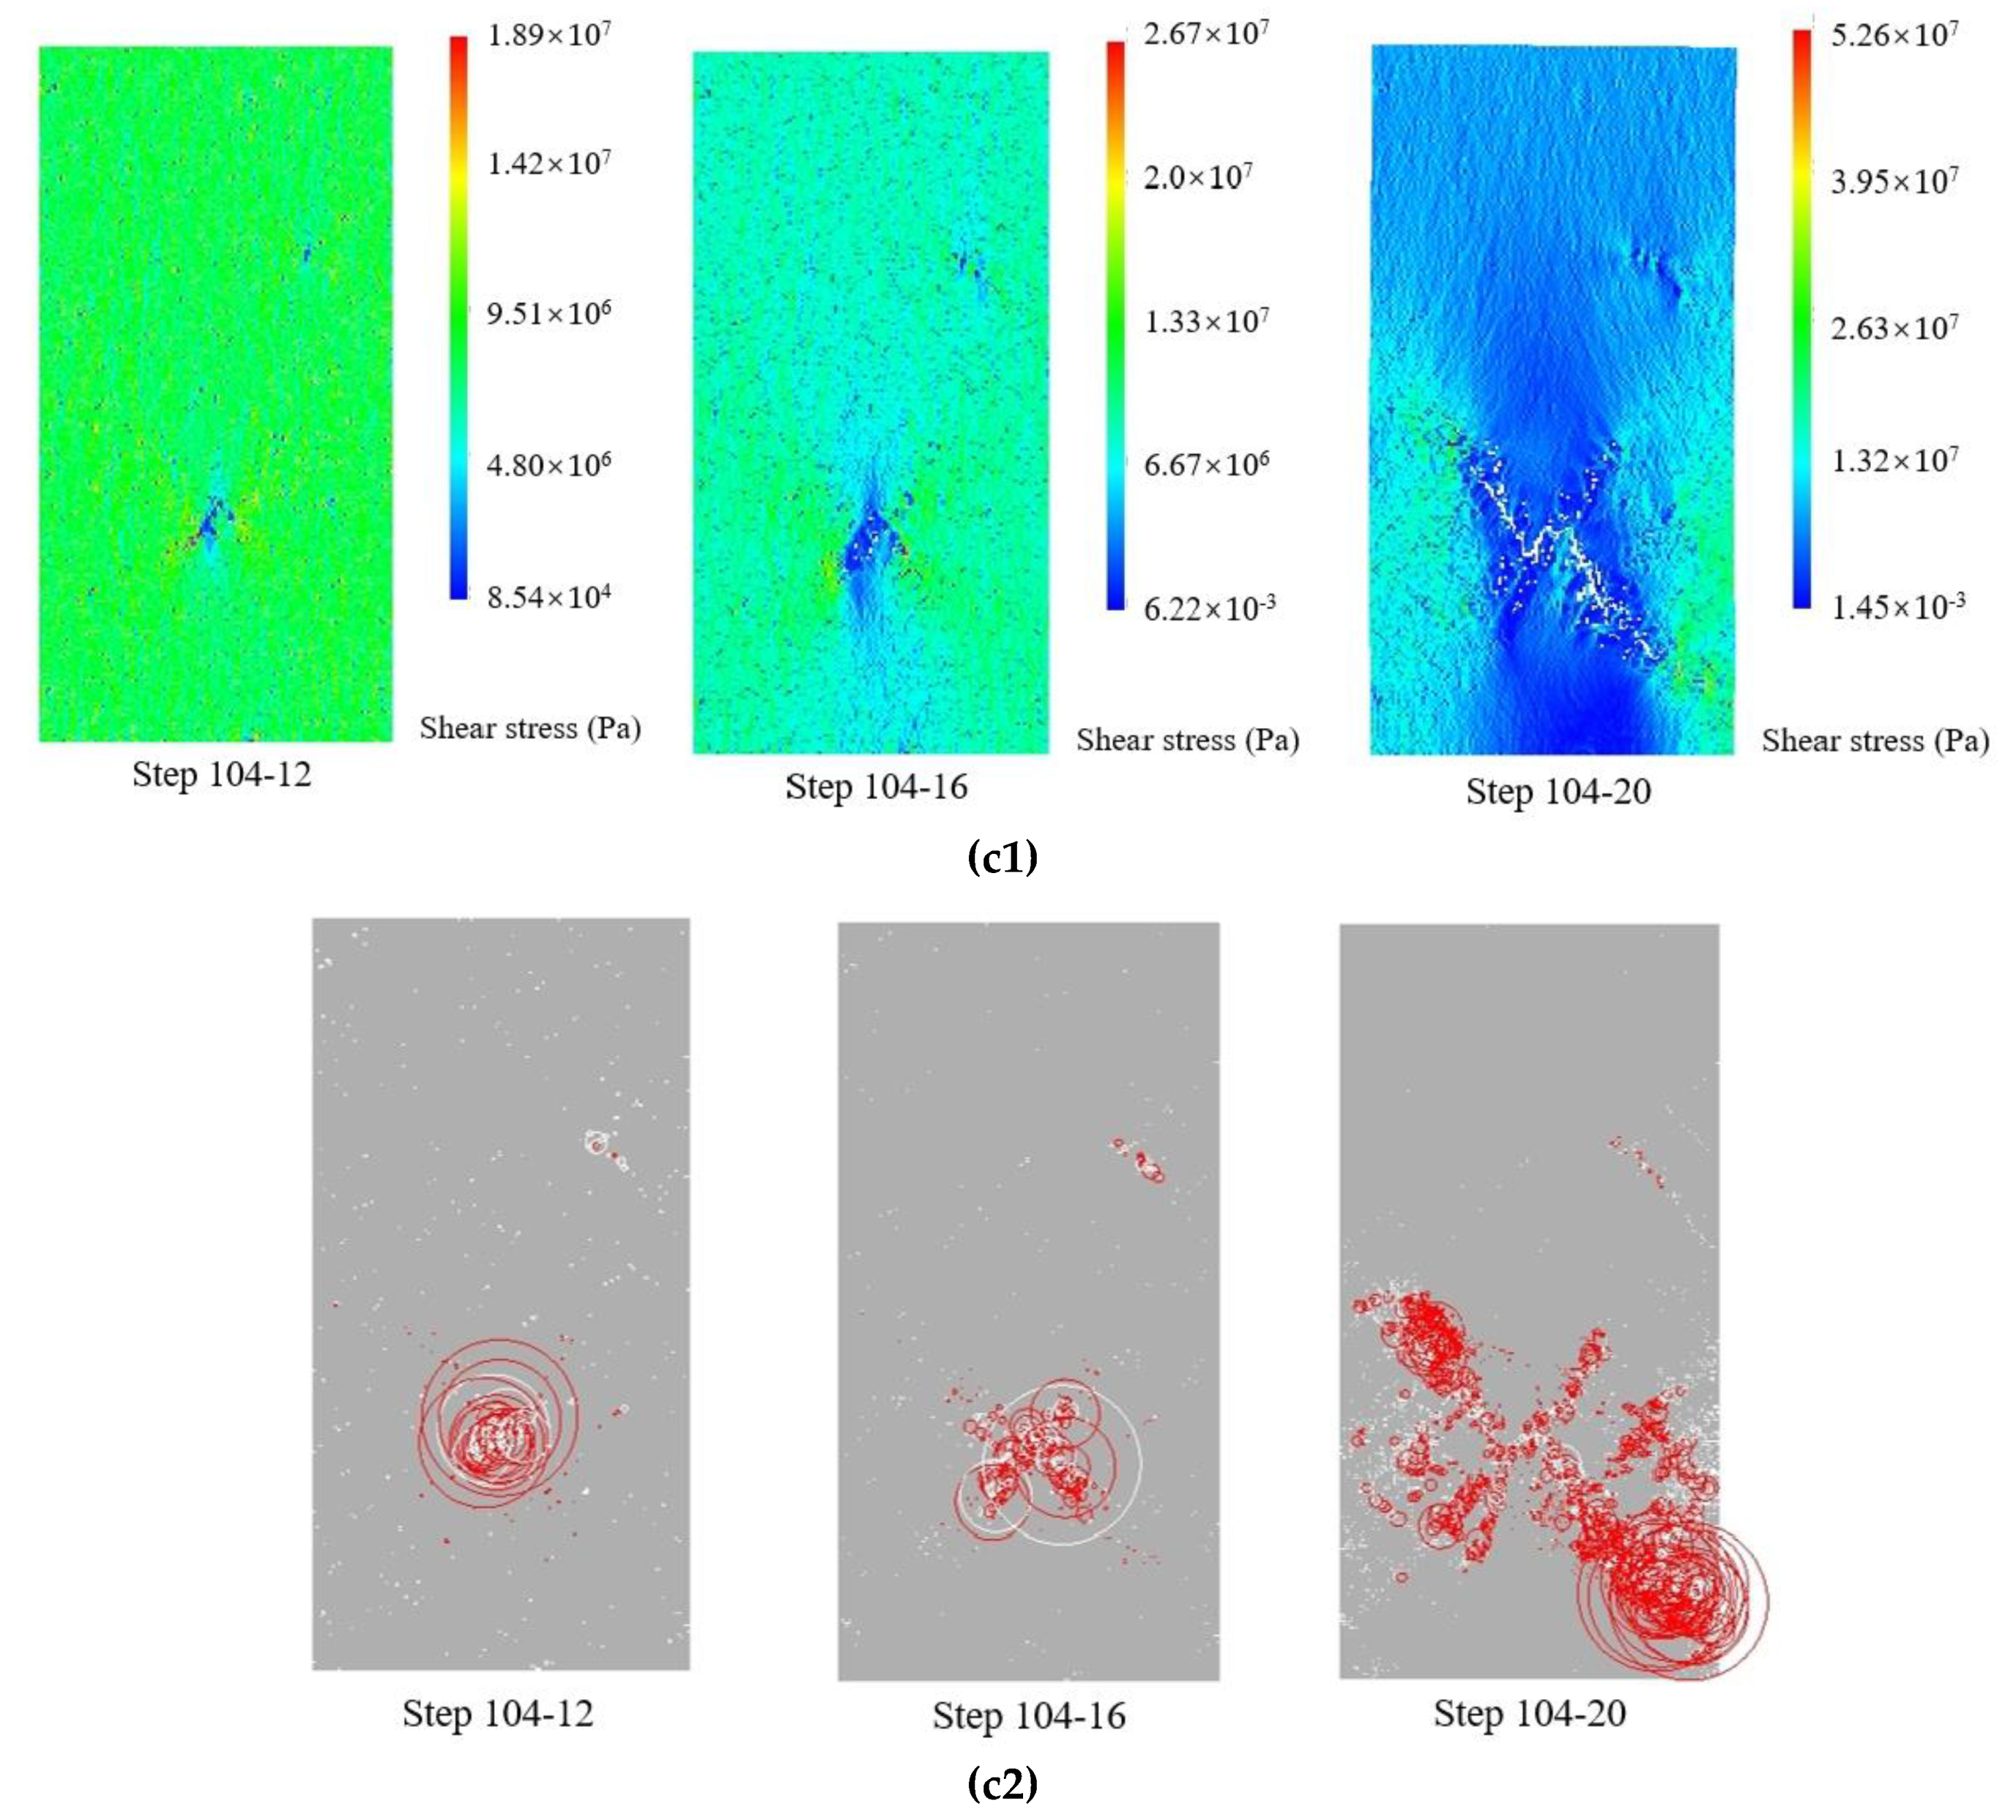
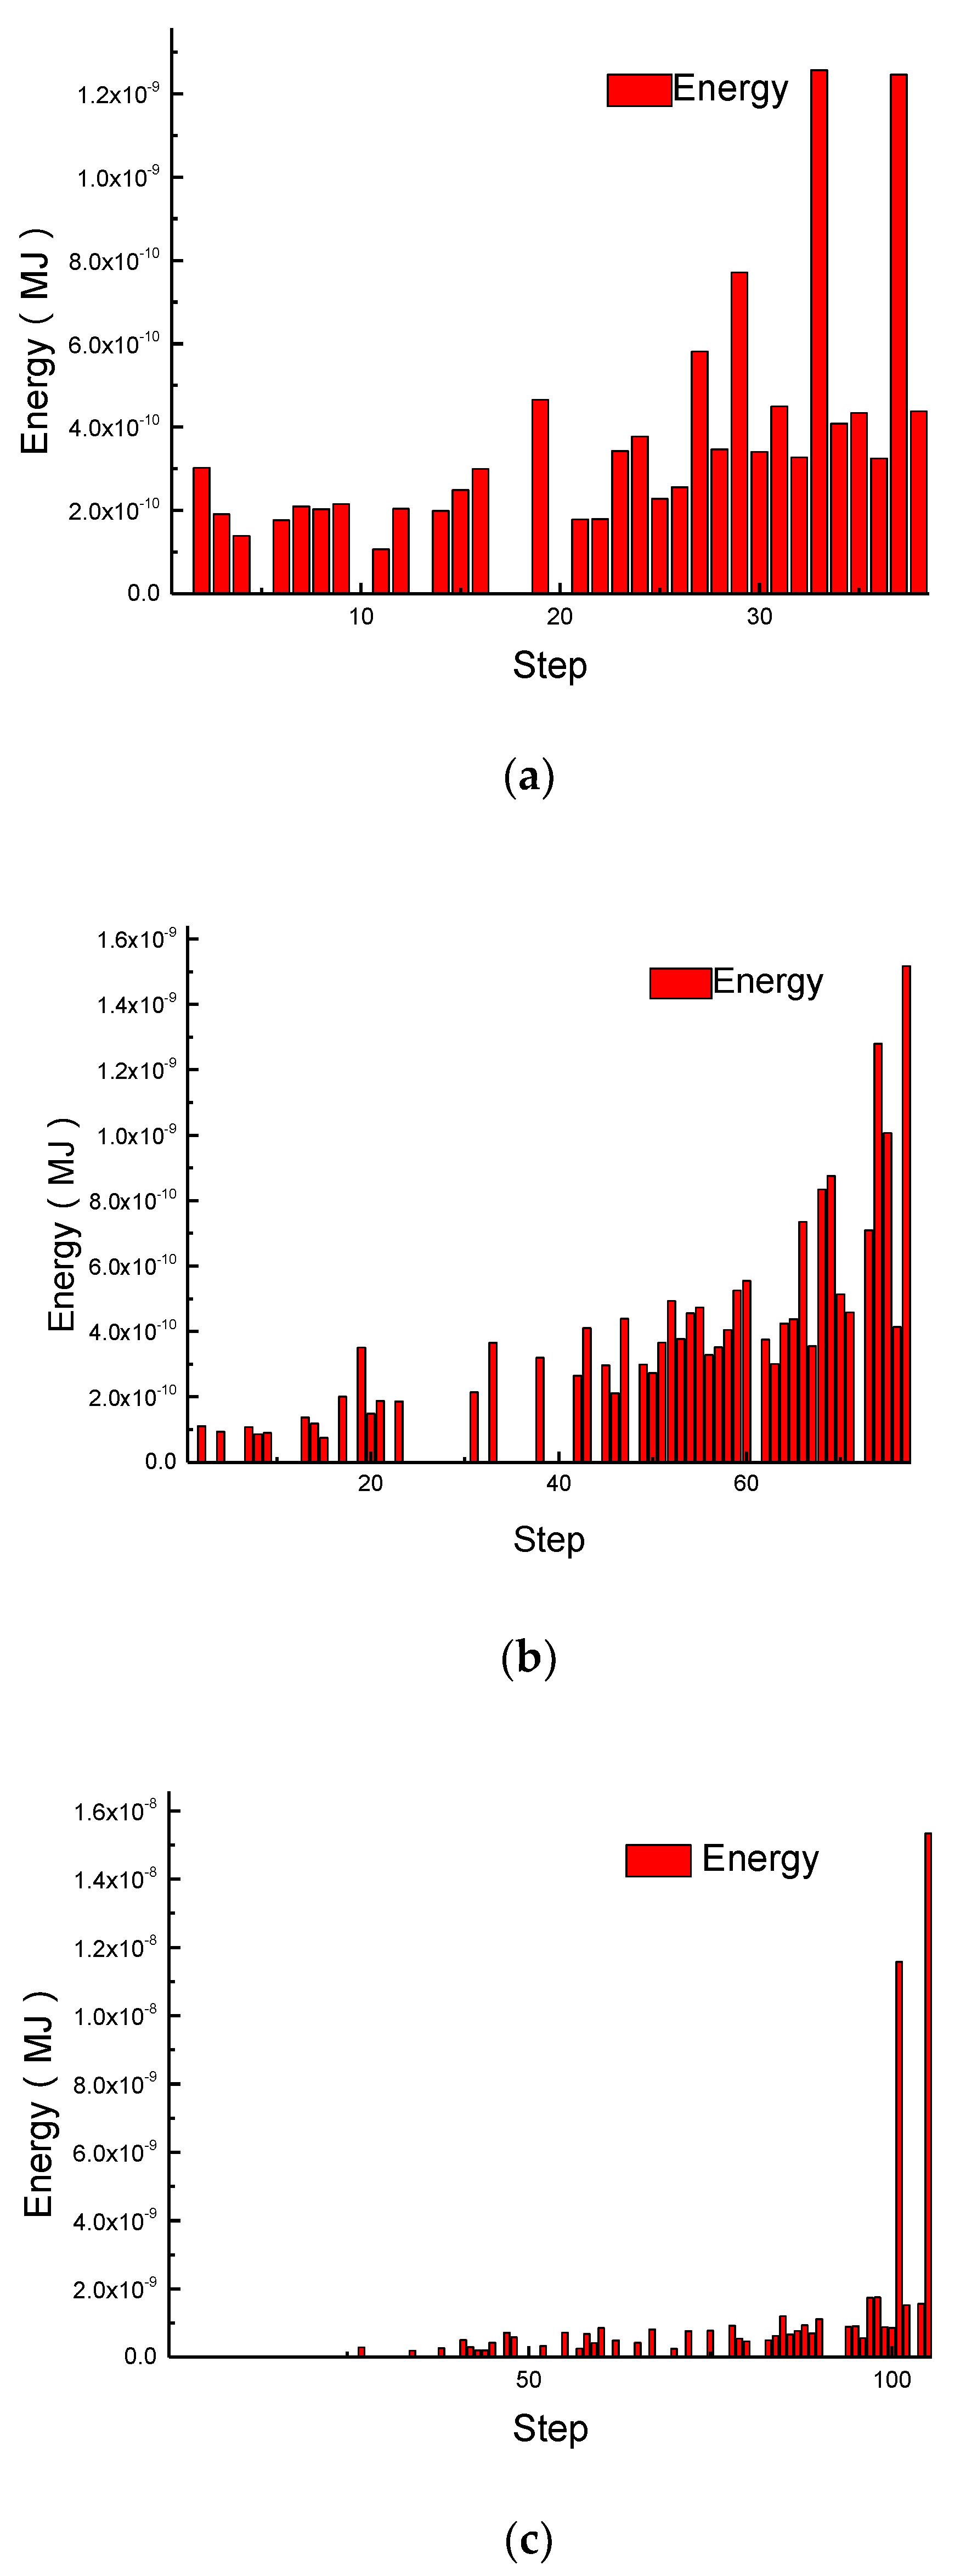
4.2. Simulation Results and Analysis

The axial stress was loaded at the initial stress of 10 MPa and 0.1 MPa per step, until the coal samples were damaged under the confining pressures of 2 MPa, 3 Mpa, and 4 MPa, respectively. The fractures development law in the damaged process of coal samples was obtained. The maximum shear stress distribution and acoustic emission of coal samples under different confining pressure are shown in Figure 10.
As shown in Figure 10a1, when the confining pressure of the coal sample was 2 MPa, the axial stress was loaded from 10 MPa, 0.1 MPa was loaded per step, and a total of 37 steps was loaded. When the model was loaded to Step 10, the coal matrix produced distinct damaged units. When the model was loaded to Step 25, the damaged units were distributed in the coal matrix. When the model was loaded to Step 37, the stress concentration at the fracture tip led to the expansion of the fracture; the damaged units passed through each other and eventually aggregated to form a macroscopic fracture; thus, the coal sample was unstable and damaged.
As shown in Figure 10a2, the diameter of the circle represents the relative size of the acoustic emission intensity. The white is the acoustic emission generated by compression shear damage, and the red is the acoustic emission generated by tensile damage. At the initial stage of loading, acoustic emission was generated randomly in the coal matrix and mainly was in compression shear failure. With the increase of load, acoustic emission caused by compression shear failure was distributed throughout the whole coal sample. When the model was loaded to Steps 37-36, the acoustic emission of tensile failure began to appear, then a large number of acoustic emission counts of tensile failure occurred until the damage of the coal sample occurred; the acoustic emission gathered at the fractures and finally formed the acoustic emission band consistent with the fracture surface.
The fractures produced in this process would have a significant impact on gas permeability. When the model was loaded to the Steps 37-36, the damaged units in the coal sample were relatively distinct, and the coal sample was in the plastic stage. At this time, due to the increase of the porosity of the coal sample, the gas permeability would show an increasing trend. With the continuous growth of the load, the porosity of the coal sample would continue to increase, and the corresponding gas permeability would gradually increase until the model was loaded to Steps 37–44, and the fractures formed a large fluid channel; thus the gas permeability reached the peak value.
As shown in Figure 10b1, when the confining pressure of the coal sample was 3 MPa, the axial stress was loaded from 10 MPa, 0.1 MPa was loaded per step, and a total of 76 steps were loaded. The damage process was similar to that of σ = 2 MPa. It is described as follows: When the model was loaded to Steps 25, the coal matrix produced significantly damaged units. When the model was loaded to Steps 60, the damaged units were distributed in the coal matrix. When the model was loaded to Steps 76, the stress concentration at the fracture’s tip led to the expansion of the fracture, and the damaged units passed through each other and eventually aggregated to form macroscopic fractures; thus, the coal sample was unstable and damaged.
As shown in Figure 10b2, when the model was loaded to Steps 76-27, the lower-left corner of the model produced evident acoustic emission, and the lower-left corner presented micro-fractures. Due to the stress concentration at the end of the fractures, the fractures expanded upward along the lower-left corner as the load continued to increase. When the model was loaded to Steps 76-31, the acoustic emission penetrated the entire model at 45 degrees substantially along the lower-left corner of the fractures. When the model was loaded to Steps 76-35, the model was damaged, and the acoustic emission was concentrated at the fractures, thus forming a visible shear-damage acoustic emission band.
Similarly, in this process, the gas permeability also changed with the changes in the porosity of the coal sample. When the model was loaded to Steps 76-27, the damaged units in the coal sample converged to form tiny fractures at the lower-left corner. With the continuous increase of the load, the damaged units in the coal matrix continued to unite and connect, and the porosity of the coal sample continued to increase; thus, the gas permeability gradually increased. When the model was loaded to Steps 76-35, the gas permeability reached the peak due to the formation of the through fractures.
As shown in Figure 10c1, when the confining pressure of the coal sample was 4 MPa, the axial stress was still loaded from 10 MPa, 0.1 MPa was loaded per step, and a total of 104 steps were loaded. The damaged process is described as follows: When the model was loaded to Steps 35, the coal matrix produced distinct damaged units. When the model was loaded to Steps 60, the damaged units were distributed in the coal matrix. When the model was loaded to Steps 104, significant fractures occurred at the lower end of the coal sample. The coal sample underwent damage at Steps 104-20, producing an “X”-type fracture.
As shown in Figure 10c2, the fractures first occurred in the lower part of the coal sample. When the model was loaded to Steps 62, this part began to produce a red acoustic emission circle. When the model was loaded to Steps 104, the acoustic emission was concentrated in this part, and the model was unstable and damaged; the acoustic emission finally formed an acoustic emission band along the fracture surface.
In this process, the gas permeability changed with the changes in the porosity of the coal sample. When the model was loaded to Steps 104-12, the damaged units in the coal sample converged in the middle and lower part of the coal matrix, and the gas permeability began to increase. When the model was loaded to Steps 104-16, the damaged area was enlarged, and the gas permeability continued to grow. When the model was loaded to Steps 104-20, the coal sample was unstable and damaged. At this time, the corresponding gas permeability reached a peak value.
The AE (acoustic emission) energy of coal samples during loading is shown in Figure 11, and the AE (acoustic emission) counts are shown in Table 4.
It can be seen from Figure 11 and Table 4 that because of the confining pressure, the primary fractures inside the coal sample were closed by different degrees of compaction, which improved the integrity and rigidity of the coal sample. The existence of confining pressure led to the small acoustic emission energy in the initial loading. Compared with the energy change of 2 MPa, 3 MPa, and 4 MPa, it can be seen that in the initial loading stage, the acoustic emission energy decreased with the increases of the confining pressure. For example, when the confining pressure was 4 MPa, there was almost no acoustic emission energy. With the rise of the axial stress, the acoustic emission energy also showed an upward trend, because there was a small scale of new fracture growth and generation in the coal sample. When the coal sample was in the elastic-plastic stage, there were more new fractures in the coal sample; at the same time, a large amount of strain energy was accumulated in the coal sample, and the acoustic emission activity was further strengthened. When the coal sample entered the stage of fracture development, in addition to the expansion of the original fractures, a large number of new fractures was produced. These fractures converged and linked up, resulting in the formation of the macro fracture surface, and the interaction between fractures was intensified, for example Step 37 of σ = 2 MPa, Step 76 of σ = 3 MPa, and Step 104 of σ = 4 MPa were all stages of the macro-destructive energy’s sudden increase. When the coal sample entered the residual deformation stage, the acoustic emission signal returned to a lower level. At this stage, the damage of the coal sample was completed, and the fractures were closed under the action of pressure.
Combining the development of the fracture with acoustic emission during the damage process of coal samples, we divided the development of the fracture into four stages:
(1)
Micro-damage nucleation and growth stage characterized by the micro-damages being randomly distributed in the coal sample; the scales were not much different from each other, and the statistics were independent of each other.
(2)
Micro-damage growth, connection, and formation of the large-scale fracture stage characterized by multi-scale damage coexisting; widespread damage occupied growth advance.
(3)
The rapid expansion and connection of the macroscopic fracture stage characterized by small fractures growing rapidly and connecting.
(4)
The extensive fracture through stage characterized by the damage gradually expanding and finally forming a fracture surface.

5. Study of the Gas Flow Law in Fractured Coal Samples

Although only the data of three coal samples were cited above, a plurality of experiments was carried out due to the influence of the experimental success rate. Most of the damaged coal samples obtained through experiments had a shear failure through the fractures, and the shear fracture locations would be different. Some were located in the upper part of the coal sample, some in the middle, and also some in the lower part of the coal sample. Therefore, it was necessary to analyze the distribution of the gas pressure and flow field at different fracture positions of the coal samples by numerical simulation and to obtain the inherent law through comparative analysis.

5.1. Established Model

Gas flow models with varying locations of the fracture of coal samples were established in the COMSOL numerical simulation software. The model had a width of 50 mm and a height of 100 mm. Gas flowed in from the upper boundary of the model and flowed out from the lower boundary; the upper boundary was set as the pressure inlet, the pressure being 0.7 MPa; the lower boundary was set as the pressure outlet, the pressure being 0.1 MPa. The boundary on both sides was set as no flow; the fracture boundary selected fracture flow and defined parameters such as the porosity and permeability of fracture. The established models and relevant parameters are shown in Figure 12 and Table 5.

5.2. Simulation Results and Analysis

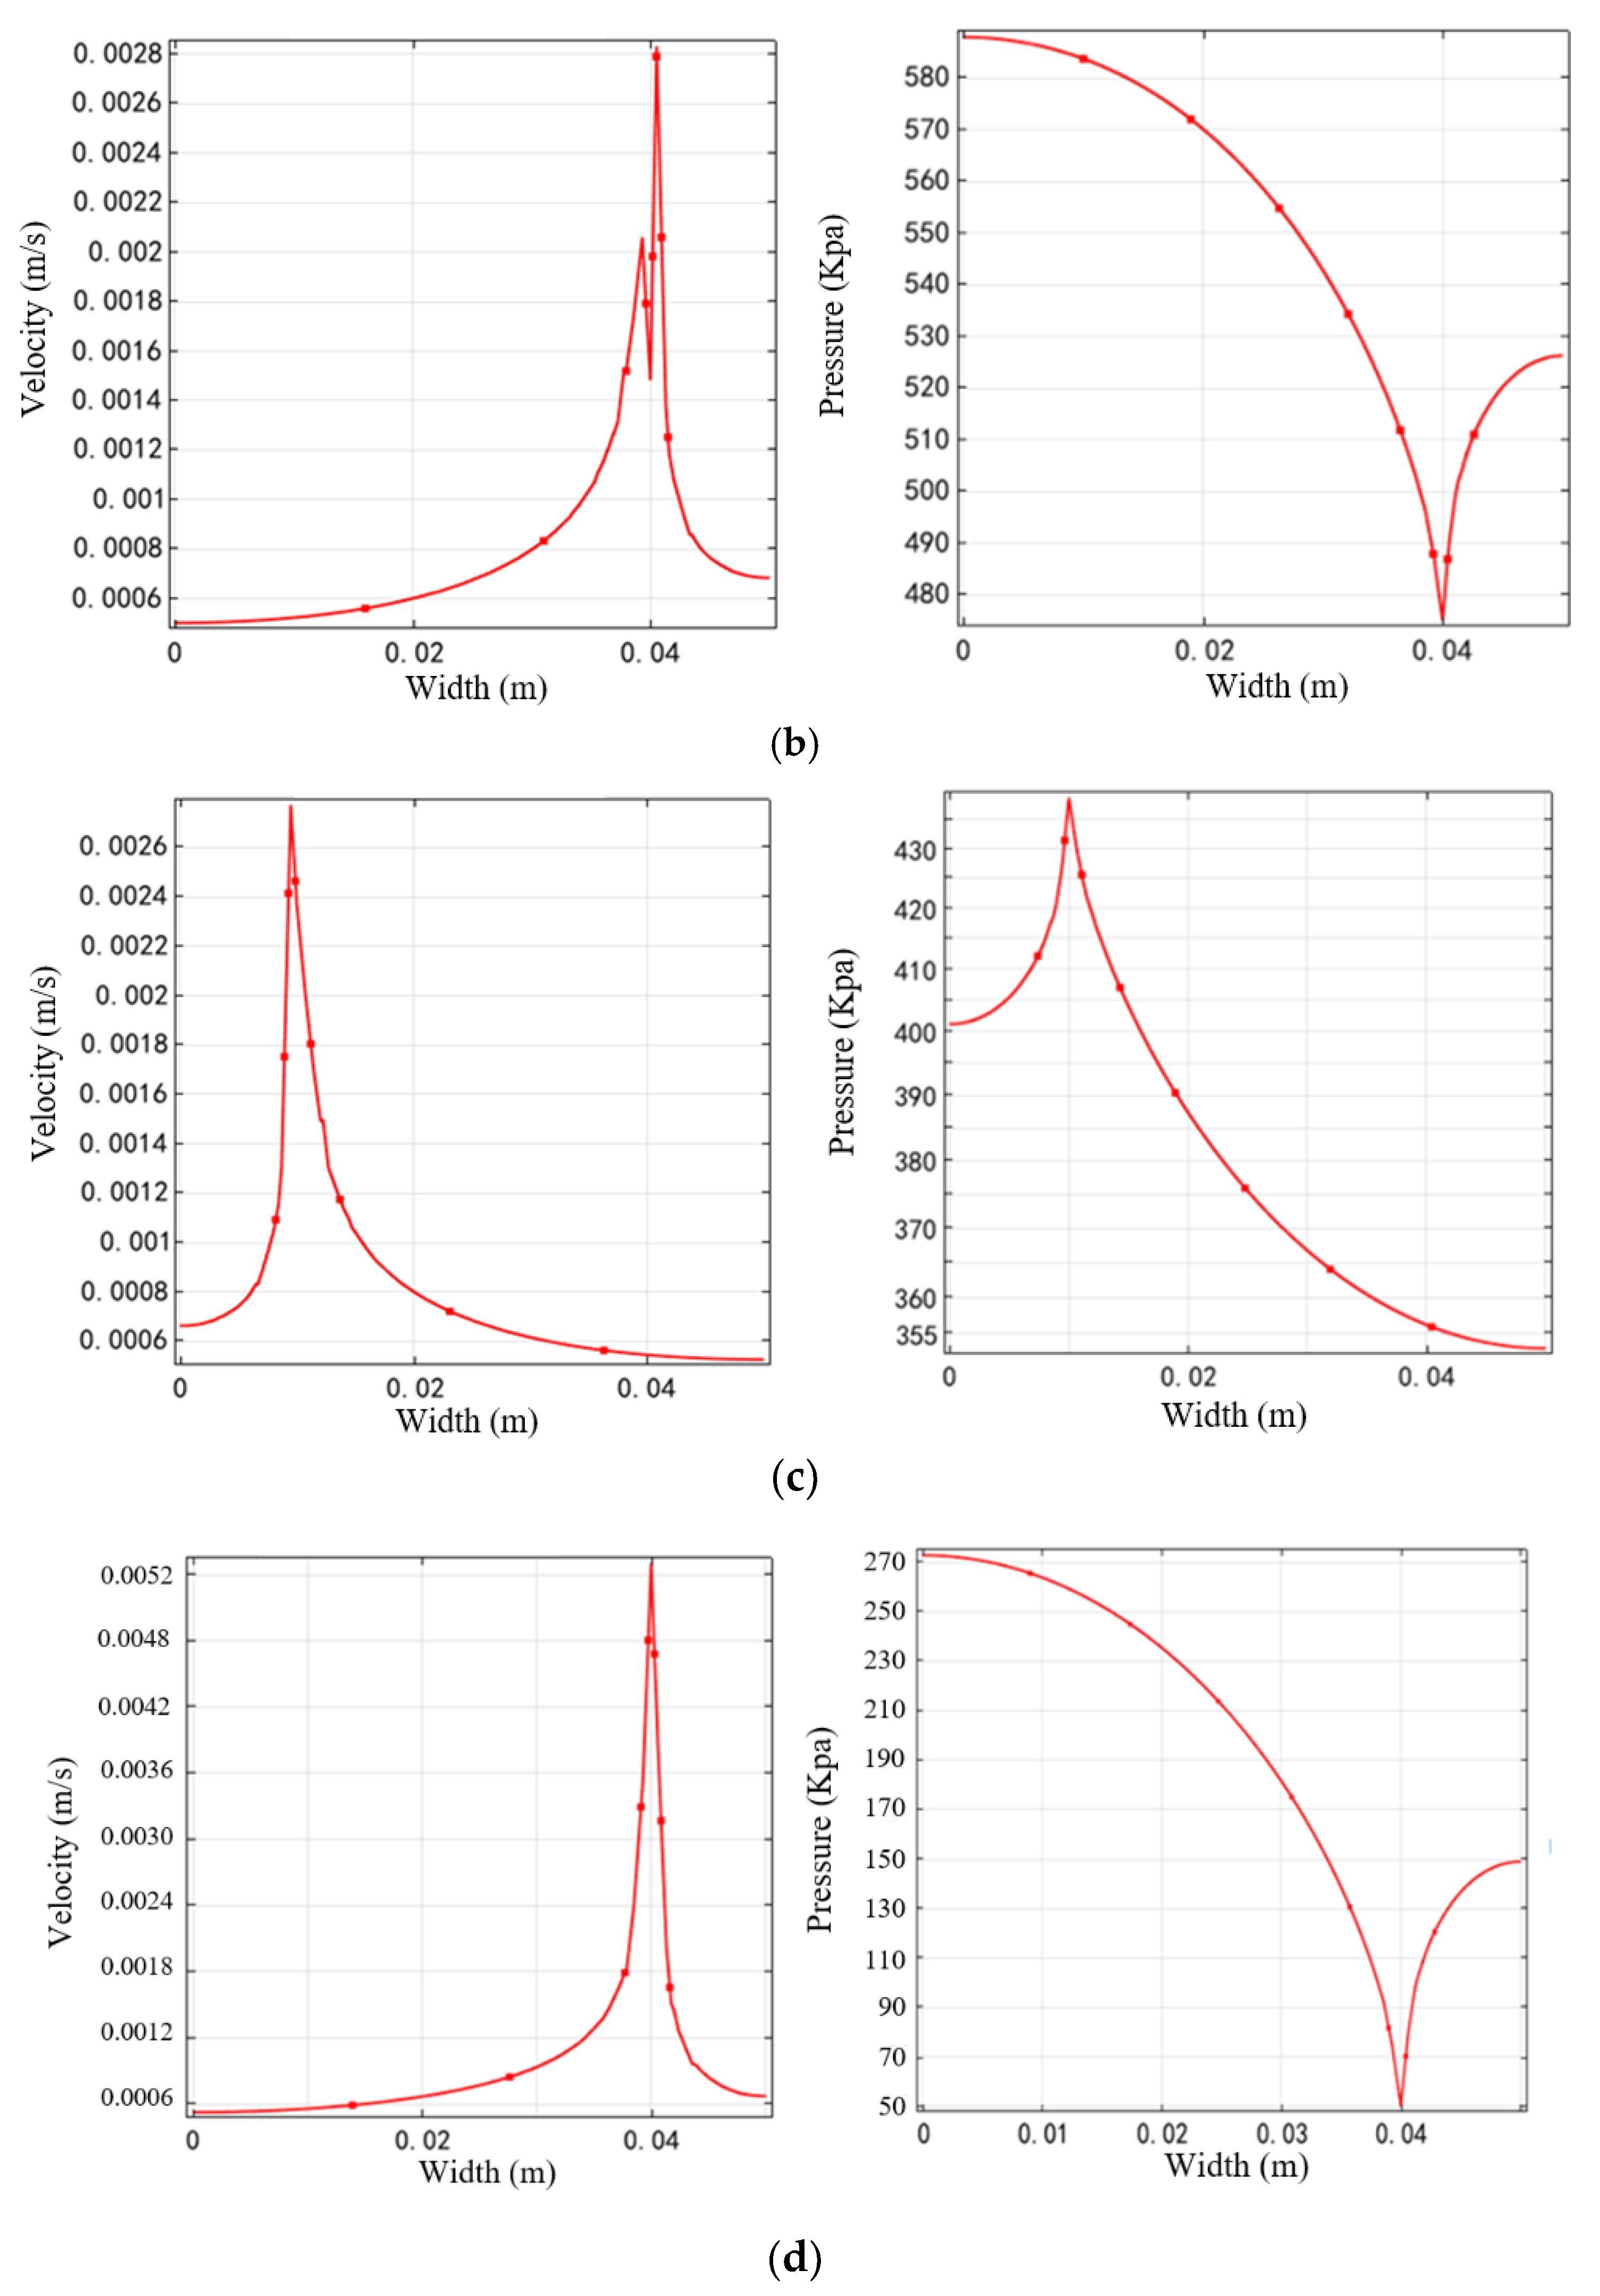
5.2.1. Upper Fracture Model

It can be seen from Figure 13 that the internal pressure of the model changed due to the generation of the upper fracture. On both sides of the fracture, the pressure on the left side was generally higher than that on the right side, especially at the fracture exit. The fracture made the pressure isoline of the model distribute in the fracture exit as wave-shaped bending. The closer to the fracture exit, the higher the curvature of the isoline bending. The reason for the above phenomenon was the upper fracture on the left side, which induced the gas flow on the left side of the model and made the gas pressure on the left side of the model higher.
It can be seen from Figure 14 that as the gas flowed mostly along the fracture, the flow had a concentrated effect, resulting in a significant decrease in the gas flow on the left and right sides of the fracture, and almost no flow in the upper left portion of the fracture. When the gas flowed down the fracture to the exit position, the flow was gradually distributed evenly to fill the entire model. At the interface between the fracture and the matrix, the gas flowed vertically into the matrix from the fracture surface.

5.2.2. Middle Fracture Model

According to the analysis of Figure 15, the pressure distribution decreased from top to bottom. On both sides of the middle fracture, the pressure on the left side was higher than that on the right side, especially at the fracture outlet. The fracture made the pressure isoline inlet and outlet of the model curve wave shaped. The closer to the inlet and outlet of the fracture, the higher the curvature of the contour curve was, and the curvature of the outlet pressure contour was higher than that of the inlet pressure contour. The influence range of the middle fracture on the pressure contour was about 0.06 m along the Y direction, and the influence rate of the outlet was higher than that of the inlet.
As shown in Figure 16, the gas flow velocity at the inlet and outlet of the fracture was much faster than that at other locations. The upper-right velocity distribution and the lower-left velocity distribution were symmetrical, and the gas velocity distribution of the two parts was more significant. The upper left velocity distribution and the lower right velocity distribution were balanced, and the gas velocity distribution of the two parts was smaller. It can be seen that, due to the effect of fractures, most of the gas flowed down along the upper left of the model through the fracture channel, and a small part of the gas flowed vertically from the upper right to the lower right. After the gas flowed to the lower part of the fracture for a certain distance, with the weakening of the fracture effect, it gradually started to flow evenly.

5.2.3. Lower Fracture Model

As shown in Figure 17, the gas pressure decreased from top to bottom. In the lower part of the model, nearly half of the space in the model was in a low-pressure state due to the penetration of the lower fracture and the bottom boundary. The contour of the pressure distribution at the upper end of the fracture was wave shaped, and the curvature was smaller as it went up. The pressure on the left side of the fracture was higher than that on the right side, and the influence of the lower fracture on the pressure contour was about 0.04 m in the Y direction.
As shown in Figure 18, the gas flow in the upper half of the model was relatively uniform as a whole, and the flow velocity at the fracture inlet was relatively high. The flow velocity in the upper half of the model was higher than that in the lower half. Part of the gas entered the fracture channel from the fracture inlet, and part of the gas entered the fracture channel from the matrix perpendicular to the fracture surface. The velocity field was uniform in the upper half, pointing vertically downward. The velocity field began to skew towards the entrance at a position of about 0.02 m above the fracture entrance. Due to the existence of the lower fracture, most of the gas flowed out of the model along the fracture channel, and only a small part flowed out from the right lower side of the model.

5.2.4. Parameter Analysis

Transversal lines L11, L21, L22, and L31, were established at the fracture outlet of the upper fracture model, the fracture inlet and the fracture outlet of the middle fracture model, and the fracture inlet of the lower fracture model, respectively, as shown in Figure 19. The coordinates of the transversal lines were as follows: L11 (0,0.06), (0.05,0.06); L21: (0,0.08), (0.05,0.08); L22: (0,0.04), (0.05,0.04); L31: (0,0.08), (0.05,0.08). The velocity and the pressure along the transversal lines are shown in Figure 20.
Figure 20a shows that the velocity of the fracture outlet of the upper fracture model was about 0.0039 m/s, which was much higher than that at other locations along the transversal line. The pressure of the fracture outlet of the upper fracture model was about 690 KPa, which was due to the connection between the fracture and the upper boundary of the model, resulting in the downward movement of the high-pressure area. The pressure at the fracture outlet was higher than that at other positions at the same level. Figure 20b,c show that the velocity of the fracture inlet and outlet of the middle fracture model was about 0.0028 m/s and 0.0029 m/s, respectively. The velocity along the transversal line showed that the closer to the fracture inlet and outlet, the higher the flow velocity. The pressure of the fracture inlet of the middle fracture model was about 470 KPa, which was lower than that at other locations along the transversal line; the pressure of the fracture outlet of the middle fracture model was about 450 KPa, which was higher than other locations along the transversal line. Figure 20d shows that the velocity of the fracture inlet of the lower fracture model was about 0.0052 m/s, which was higher than that at other locations along the transversal line; the pressure was about 50 KPa, which was lower than that at other locations along the transversal line.

6. Conclusions

We used the experimental methods combined with the numerical method to investigate the permeability evolution of post-strength soft coal. First, the coal samples with different confining pressures (2 MPa, 3 MPa, 4 MPa) were loaded until they reached peak strength and were damaged. Then, the permeability evolution of post-strength soft coal samples during unloading axial stress and confining pressure and during loading to secondary damage was studied. Lastly, we adopted numerical simulation software to acquire the development mechanism of the internal fracture network of coal samples and the gas flow law of coal samples with various fracture locations. The main conclusions can be summarized as below:
(1)
When the confining pressure and axial pressure of post-strength coal samples were unloaded, the permeability increased by 1.25–1.32 times, and the permeability evolution with axial stress and confining pressure in the unloading process showed an exponential relation; however, in the loading confining pressure process, the relationship was linear.
(2)
When the coal samples were loaded into the secondary damage process, the change trend of permeability first decreased and then increased, and the permeability during the secondary damage of the coal samples was higher than during the initial damage.
(3)
The fracture development of coal samples under triaxial compression was divided into four stages: micro-damage nucleation, growth stage; micro-damage growth, connection, and formation of large-scale fracture stage; rapid expansion of macro-fracture and connection stage; and large fracture-through stage.
(4)
The gas pressure and velocity of post strength coal were significantly influenced by the fracture locations. The gas pressure and gas flow field near the fracture were disturbed, and the pressure and velocity of the fracture outlet of the upper fracture model were about 690 KPa and 0.0039 m/s. The pressure and velocity of the fracture inlet and outlet of the middle fracture model were about 470 KPa, 450 KPa, 0.0028 m/s, and 0.0029 m/s. The pressure and velocity of the fracture inlet of the lower fracture model were about 0.0052 m/s and 50 KPa. The closer to the fracture outlet and inlet, the greater the impact on gas pressure and velocity.

Author Contributions

J.M. conceived of and designed the experiments; J.M. and C.H. performed the experiments; J.M. and C.H. analyzed the data; X.J. and C.H. wrote the paper. D.N. validated the paper. All authors have read and agreed to the published version of the manuscript.

Funding

This research was funded by [Jianhong Ma] grant number [U1204512] and [Yuanpeng Zou] grant number [2019 CDJSK 04 XK 23]. And the APC was funded by [U1204512].

Conflicts of Interest

The authors declare no conflict of interest.

References

  1. Lin, B.Q. Mine Gas Prevention and Control Theory and Technology; China University of Mining and Technology Press: Wuhan, China, 2010. [Google Scholar]
  2. Jiang, X.X.; Li, C.X. 2013–2017 national coal mine accident statistical analysis and countermeasures. Coal Eng. 2019, 51, 101–105. (In Chinese) [Google Scholar]
  3. Nie, B.S.; Liu, X.F.; Yang, L.L.; Meng, J.Q.; Li, X.C. Pore structure characterization of different rank coals using gas adsorption and scanning electron microscopy. Fuel 2015, 158, 908–917. [Google Scholar] [CrossRef]
  4. Sun, P.D. Coal gas dynamics and its applications. Sci. Geol. Sin. 1990, 3, 66–72. [Google Scholar]
  5. Ruckenstein, E.; Vaidyanathan, A.S.; Youngquist, G.R. Sorption by solids with bidisperse pore structures. Chem. Eng. Sci. 1971, 26, 1305–1318. [Google Scholar] [CrossRef]
  6. Nandi, S.P.; Walker, P.L., Jr. Activated diffusion of methane in coal. Fuel 1969, 49, 309–323. [Google Scholar] [CrossRef]
  7. Klages, R.; Radons, G.; Sokolov, I.M. Anomalous Transport: Foundations and Applications; Wiley-VCH Verlag Gmbh & Co.KGaH: Weinheim, Germany, 2008. [Google Scholar]
  8. Gensterblum, Y.; Ghanizadeh, A.; Krooss, B.M. Gas permeability measurements on Australian subbituminous coals: Fluid dynamic and poroelastic aspects. J. Nat. Gas Sci. Eng. 2014, 19, 202–214. [Google Scholar] [CrossRef]
  9. Zhou, S.N. Mechanism of gas flow in coal seam. J. Coal. 1990, 15, 15–24. [Google Scholar]
  10. Chen, Z.; Pan, Z.; Liu, J.; Connell, L.D.; Elsworth, D. Effect of the effective stress coefficient and sorption-induced strain on the evolution of coal permeability: Experimental observations. Int. J. Greenh. Gas Control. 2011, 5, 1284–1293. [Google Scholar] [CrossRef]
  11. Wang, F.; He, J.; Liang, Y.; Luo, Y.; Liao, Z.; Li, L. Study on the permeability characteristics of coal containing coalbed methane under different loading paths. Energy Sci. Eng. 2018, 6, 1–9. [Google Scholar] [CrossRef] [Green Version]
  12. Wang, D.; Lv, R.; Wei, J.; Fu, Q.; Wang, Y.; Zhang, P.; Yao, B. An experimental study of seepage properties of gas-saturated coal under different loading conditions. Energy Sci. Eng. 2019, 7, 799–808. [Google Scholar] [CrossRef] [Green Version]
  13. Liu, J.; Gao, J.; Zhang, X.; Jia, G.; Wang, D. Experimental Study of the Seepage Characteristics of Loaded Coal Under True Triaxial Conditions. Rock Mech. Rock Eng. 2019, 52, 2815–2833. [Google Scholar] [CrossRef]
  14. Wang, D.; Lv, R.; Wei, J.; Zhang, P.; Yu, C.; Yao, B. An experimental study of the anisotropic permeability rule of coal containing gas. J. Nat. Gas Sci. Eng. 2018, 53, 67–73. [Google Scholar] [CrossRef]
  15. Li, Q.M.; Liang, Y.P.; Zou, Q.L. Seepage and damage evolution characteristics of gas-bearing coal under different cyclic loading–unloading stress paths. Processes 2018, 6, 190. [Google Scholar] [CrossRef] [Green Version]
  16. Yang, D.S.; Qi, X.Y.; Chen, W.Z.; Wang, S.G.; Yang, J.P. Anisotropic Permeability of Coal Subjected to Cyclic Loading and Unloading. Int. J. Geomech. 2018, 18, 04018093. [Google Scholar] [CrossRef]
  17. Huang, M.; Zhang, L.; Zhang, C.; Chen, S. Characteristics of permeability changes in bituminous coal under conditions of stress variation due to repeated mining activities. Nat. Resour. Res. 2019, 1–18. [Google Scholar] [CrossRef]
  18. Chu, Y.; Sun, H.; Zhang, D. Experimental study on evolution in the characteristics of permeability, deformation, and energy of coal containing gas under triaxial cyclic loading-unloading. Energy Sci. Eng. 2019, 7, 2112–2123. [Google Scholar] [CrossRef] [Green Version]
  19. Jiang, C.; Duan, M.; Yin, G.; Wang, J.G.; Lu, T.; Xu, J.; Zhang, D.; Huang, G. Experimental study on seepage properties, AE characteristics and energy dissipation of coal under tiered cyclic loading. Eng. Geol. 2017, 221, 114–123. [Google Scholar] [CrossRef]
  20. Selvadurai, A.P.S. Normal stress-induced permeability hysteresis of a fracture in a granite cylinder. Geofluids 2014, 15, 37–47. [Google Scholar] [CrossRef]
  21. Liu, Y.; Yin, G.; Zhang, D.; Li, M.; Deng, B. Directional permeability evolution in intact and fractured coal subjected to true-triaxial stresses under dry and water-saturated conditions. Int. J. Rock Mech. Min. Sci. 2019, 119, 22–34. [Google Scholar] [CrossRef]
  22. Yang, J.; Zhang, Q.G.; Zheng, J.T.; Wang, J.G.; Chang, C.; Gao, F. Experimental study on CH4 permeability and its dependence on interior fracture networks of fractured coal under different excavation stress paths. Fuel 2017, 202, 483–493. [Google Scholar]
  23. Yang, Y.S.; Zhang, D.M.; Li, S. Study on Deformation and Permeation Properties of Gas-Containing Fractured Rock. Geofluids 2019, 9, 1–15. [Google Scholar] [CrossRef] [Green Version]
  24. Xiao, S.; Ge, Z.; Cheng, L.; Zhou, Z.; Zhao, H.; Chen, J. Gas migration mechanism and enrichment law under hydraulic fracturing in soft coal seams: A case study in Songzao coalfield. Energy Sources Part A-Recovery Util. Environ. Eff. 2019, 1–15. [Google Scholar] [CrossRef]
  25. Standard for Engineering Classification of Rock Mass; GB/T 50218-2014; Standardization Administration of the People’s Republic of China: Beijing, China, 2014.
Figure 1. Manufacturing of coal samples. (a) Pressing coal samples; (b) stripping coal samples; (c) photographs of the coal samples.
Applsci 10 01039 g001aApplsci 10 01039 g001b
Figure 2. Three-axis creep-seepage test system for coal and rock. (a) Image of the triaxial cell; (b) schematic diagram of the three-axis creep-seepage test system.
Applsci 10 01039 g002aApplsci 10 01039 g002b
Figure 3. Permeability calculation model.
Applsci 10 01039 g003
Figure 4. Experimental results of coal sample M1. (a) Unloading axial stress; (b) unloading confining pressure; (c) loading to secondary damage; (d) fitting curve of permeability and axial stress during the secondary damage period.
Applsci 10 01039 g004
Figure 5. Experimental results of coal sample M2. (a) Unloading axial stress; (b) unloading confining pressure; (c) loading confining pressure; (d) loading to secondary damage.
Applsci 10 01039 g005
Figure 6. Experimental results of coal sample M3. (a) Unloading axial pressure; (b) unloading confining pressure; (c) loading confining pressure; (d) loading to secondary damage.
Applsci 10 01039 g006
Figure 7. Permeability evolution with time of coal samples. (a) Coal sample M1; (b) coal sample M2; (c) coal sample M3. Note: Point A is the unloading axial stress point; Point B is the unloading confining pressure point; Point C is the loading confining pressure point; Point D is the loading axial stress point; Point E is the secondary damage point.
Applsci 10 01039 g007
Figure 8. Comparison of permeability evolution under different parameters. (a) Unloading axial stress; (b) unloading confining pressure; (c) loading confining pressure; (d) loading to the secondary damage.
Applsci 10 01039 g008aApplsci 10 01039 g008b
Figure 9. Model load diagram.
Applsci 10 01039 g009
Figure 10. Development of fractures in coal samples under triaxial compression. (a1) The maximum shear stress distribution of the coal sample at σ = 2 MPa; (a2) acoustic emission of the coal sample at σ = 2 MPa; (b1) the maximum shear stress distribution of the coal sample at σ = 3 MPa; (b2) acoustic emission of the coal sample at σ = 3 MPa; (c1) the maximum shear stress distribution of the coal sample at σ = 4 MPa; (c2) acoustic emission of the coal sample at σ = 4 MPa.
Applsci 10 01039 g010aApplsci 10 01039 g010bApplsci 10 01039 g010c
Figure 11. Acoustic emission (AE) energy diagram of coal samples. (a) Acoustic emission energy change at σ = 2 MPa; (b) acoustic emission energy change at σ = 3 MPa; (c) acoustic emission energy change at σ = 4 MPa.
Applsci 10 01039 g011
Figure 12. Numerical simulation model in COMSOL. (a) Upper fracture model; (b) middle fracture model; (c) lower fracture model.
Applsci 10 01039 g012
Figure 13. Distribution of gas pressure in the upper fracture model. (a) Gas pressure nephogram; (b) gas pressure isoline.
Applsci 10 01039 g013
Figure 14. Distribution of the gas velocity in the upper fracture model. (a) Gas velocity in coal matrix; (b) gas velocity field in coal matrix; (c) gas velocity in upper fracture; (d) gas velocity filed in upper fracture.
Applsci 10 01039 g014
Figure 15. Distribution of gas pressure in the middle fracture model. (a) Gas pressure nephogram; (b) gas pressure isoline.
Applsci 10 01039 g015
Figure 16. Distribution of gas velocity in the middle fracture model. (a) Gas velocity in the coal matrix; (b) gas velocity field in the coal matrix; (c) gas velocity in middle fracture; (d) gas velocity filed in middle fracture.
Applsci 10 01039 g016aApplsci 10 01039 g016b
Figure 17. Distribution of gas pressure in the lower fracture model. (a) Gas pressure nephogram; (b) gas pressure isoline.
Applsci 10 01039 g017
Figure 18. Distribution of gas velocity in the lower fracture model. (a) Gas velocity in the coal matrix; (b) gas velocity field in the coal matrix; (c) gas velocity in lower fracture; (d) gas velocity filed in lower fracture.
Applsci 10 01039 g018
Figure 19. The locations of the transversal line. (a) Transversal line L11; (b) transversal line L21; (c) transversal line L22; (d) transversal line L31.
Applsci 10 01039 g019
Figure 20. Pressure and flow velocity curve along the transversal line. (a) Flow velocity and pressure curve along the L11 transversal line; (b) flow velocity and pressure curve along the L21 transversal line; (c) flow velocity and pressure curve along the L22 transversal line; (d) flow velocity and pressure curve along the L31 transversal line.
Applsci 10 01039 g020aApplsci 10 01039 g020b
Table 1. Experimental scheme.
Coal SamplesGas Pressure (MPa)Ci (MPa)Ai (MPa)Au (MPa)Cu (MPa)Csl (MPa)Asl (MPa)
M10.72peak stress111secondary peak stress
M20.73112
M30.74113
Note: Ci is the initial confining pressure; Ai is the peak stress; Au is the axial stress after unloading; Cu is the confining pressure after unloading; Csl is the confining pressure after the secondary loading; Asl is the axial stress after the secondary loading.
Table 2. The experiment results of the coal samples.
Coal SamplesConfining Pressure
(MPa)
Peak Stress
(MPa)
Gas Pressure
(MPa)
Permeability after Unloading Axial Stress
(mD)
Permeability after Unloading Confining Pressure
(mD)
M12140.71.061.14
M23210.70.891.12
M34230.70.801.03
Table 3. Basic parameters of the model.
Homogeneous DegreeDensity (kg/m3)Elastic Modulus (GP)Poisson’s RatioInternal Friction Angle (°)
4117110.2930
Table 4. Counts of acoustic emission.
σ = 2 MPaσ = 3 MPaσ = 4 MPa
StepAE CountsStepAE CountsStepAE Counts
3410573781015
355574921029
361607514210326
3712,0717617,22510418,401
Table 5. Basic model parameters.
Dynamic Viscosity (Pa*s)Permeability (m2)PorosityFracture Width (mm)
1.08 × 10−51.0 × 10−150.31

