User-Engagement Score and SLIs/SLOs/SLAs Measurements Correlation of E-Business Projects Through Big Data Analysis


Abstract
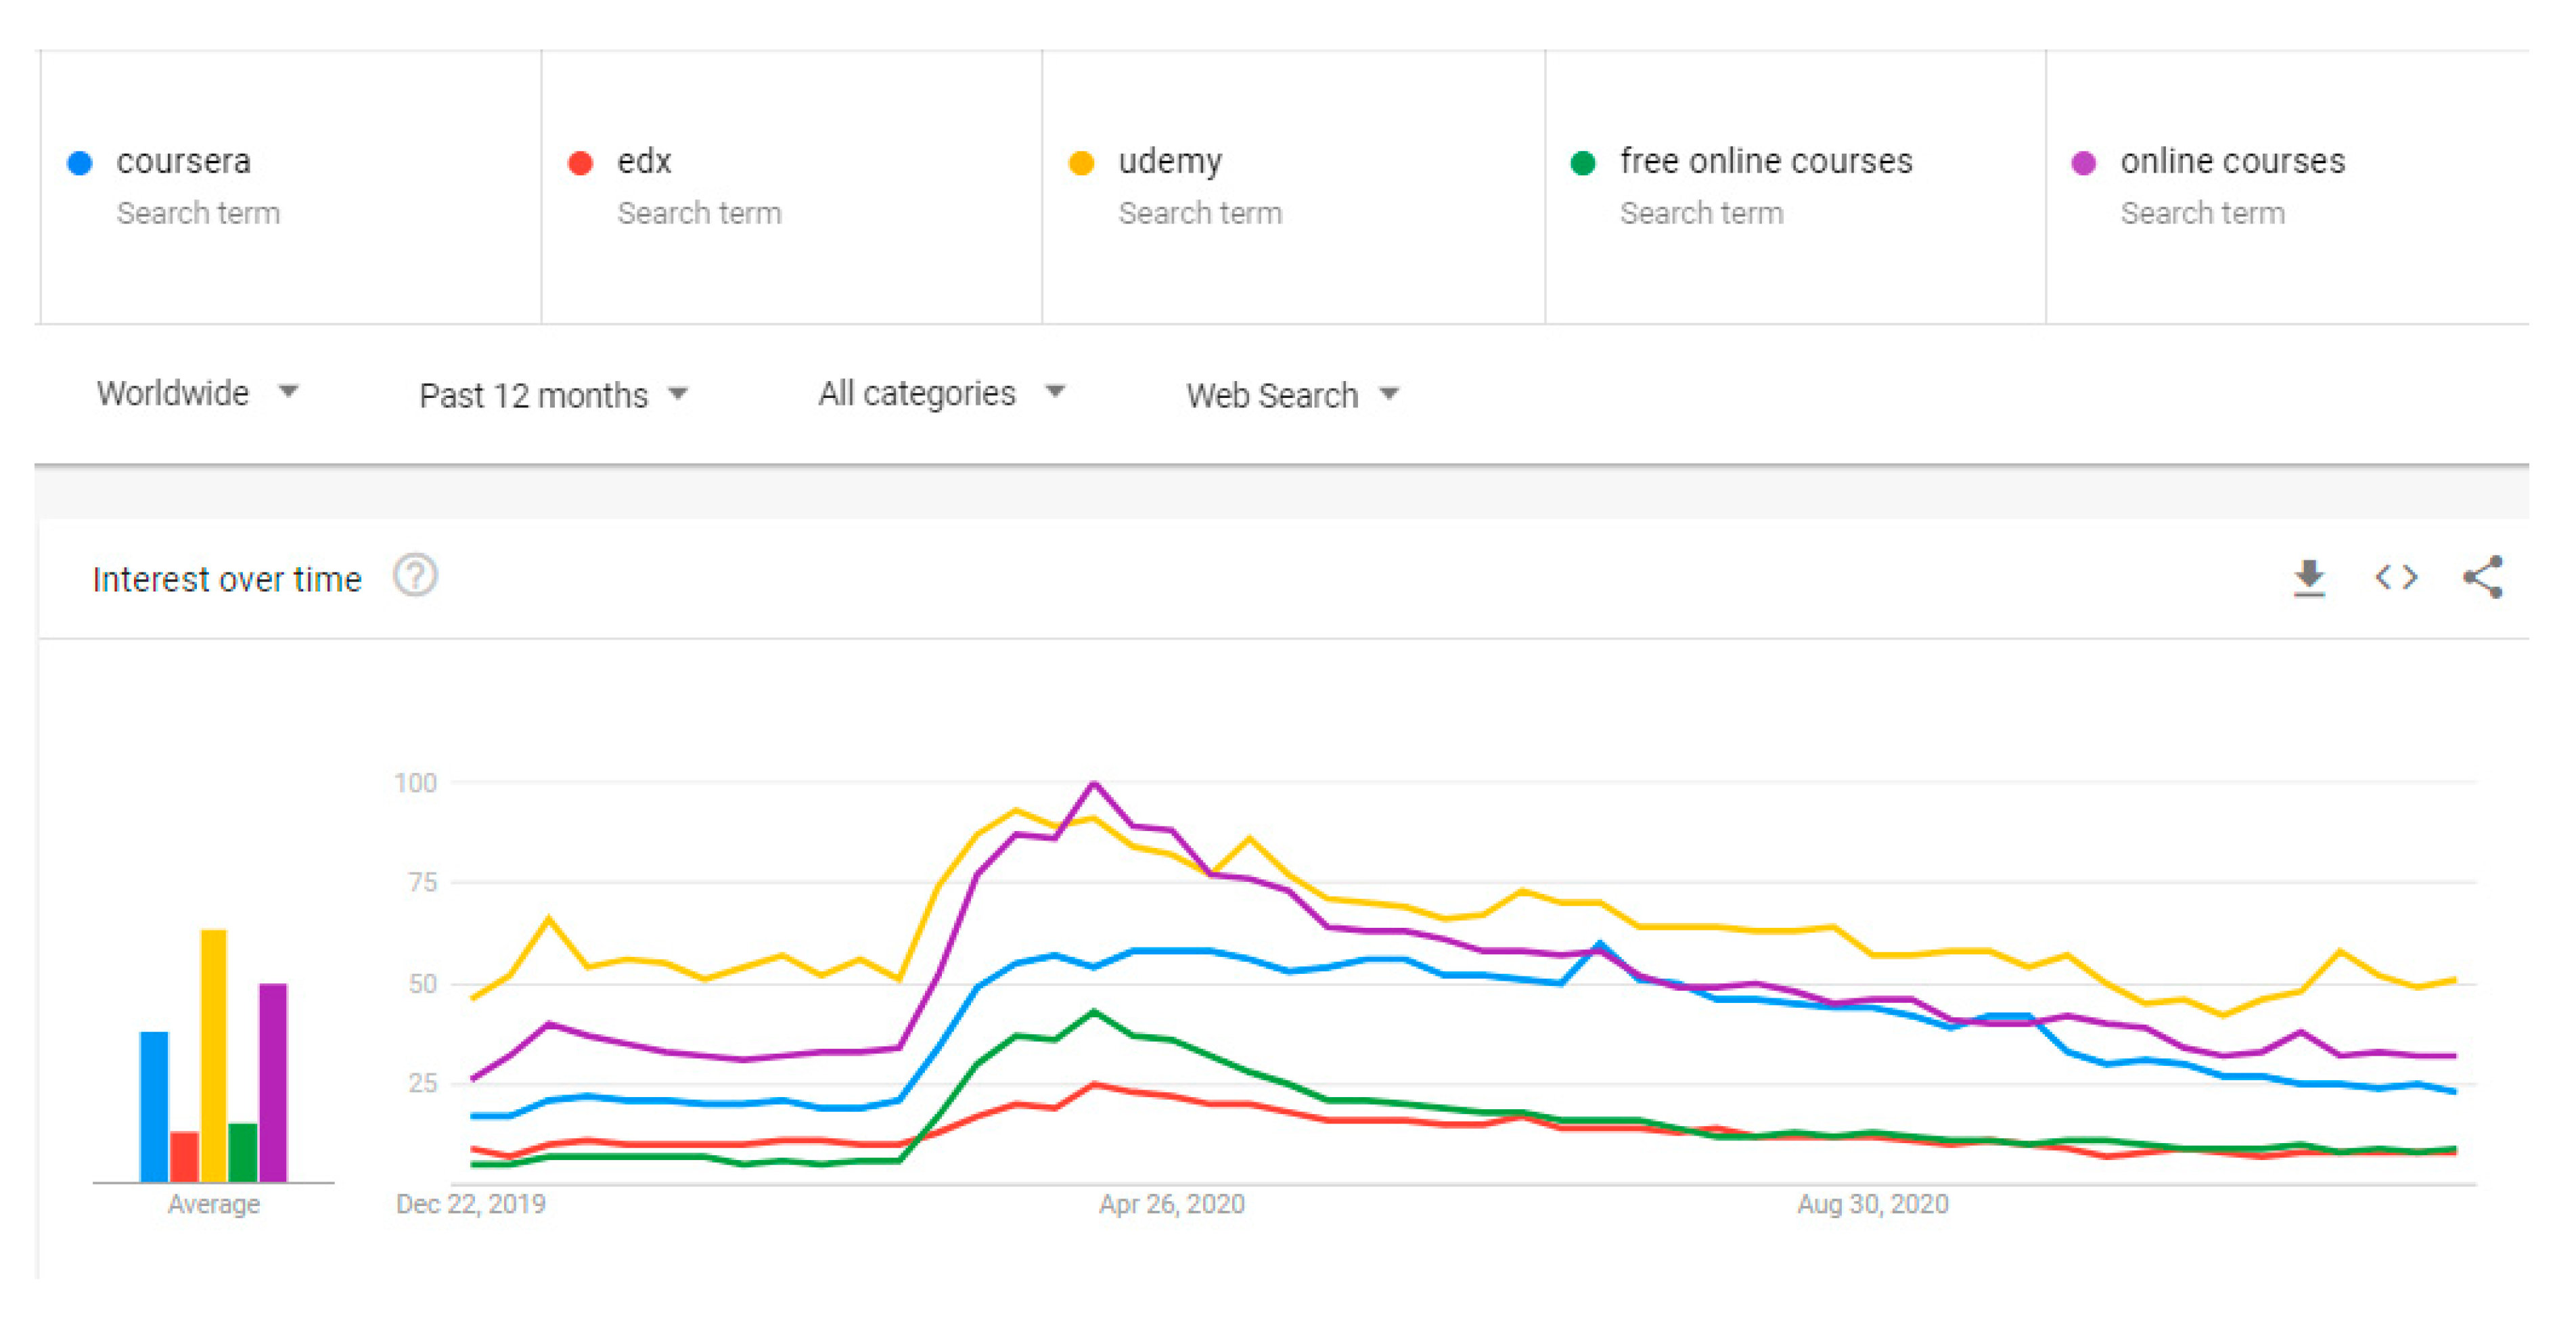
1. Introduction
- lack of internal infrastructure or subscriptions to external online projects to provide educational services;
- insufficient reliability of institutions’ infrastructural and technical support;
- complete or partial lack of the necessary teaching materials and resources for online classes;
- the lack of the university’s strategy for web projects implementation to support students’ e-learning needs.
2. Literature Review
3. Materials and Methods
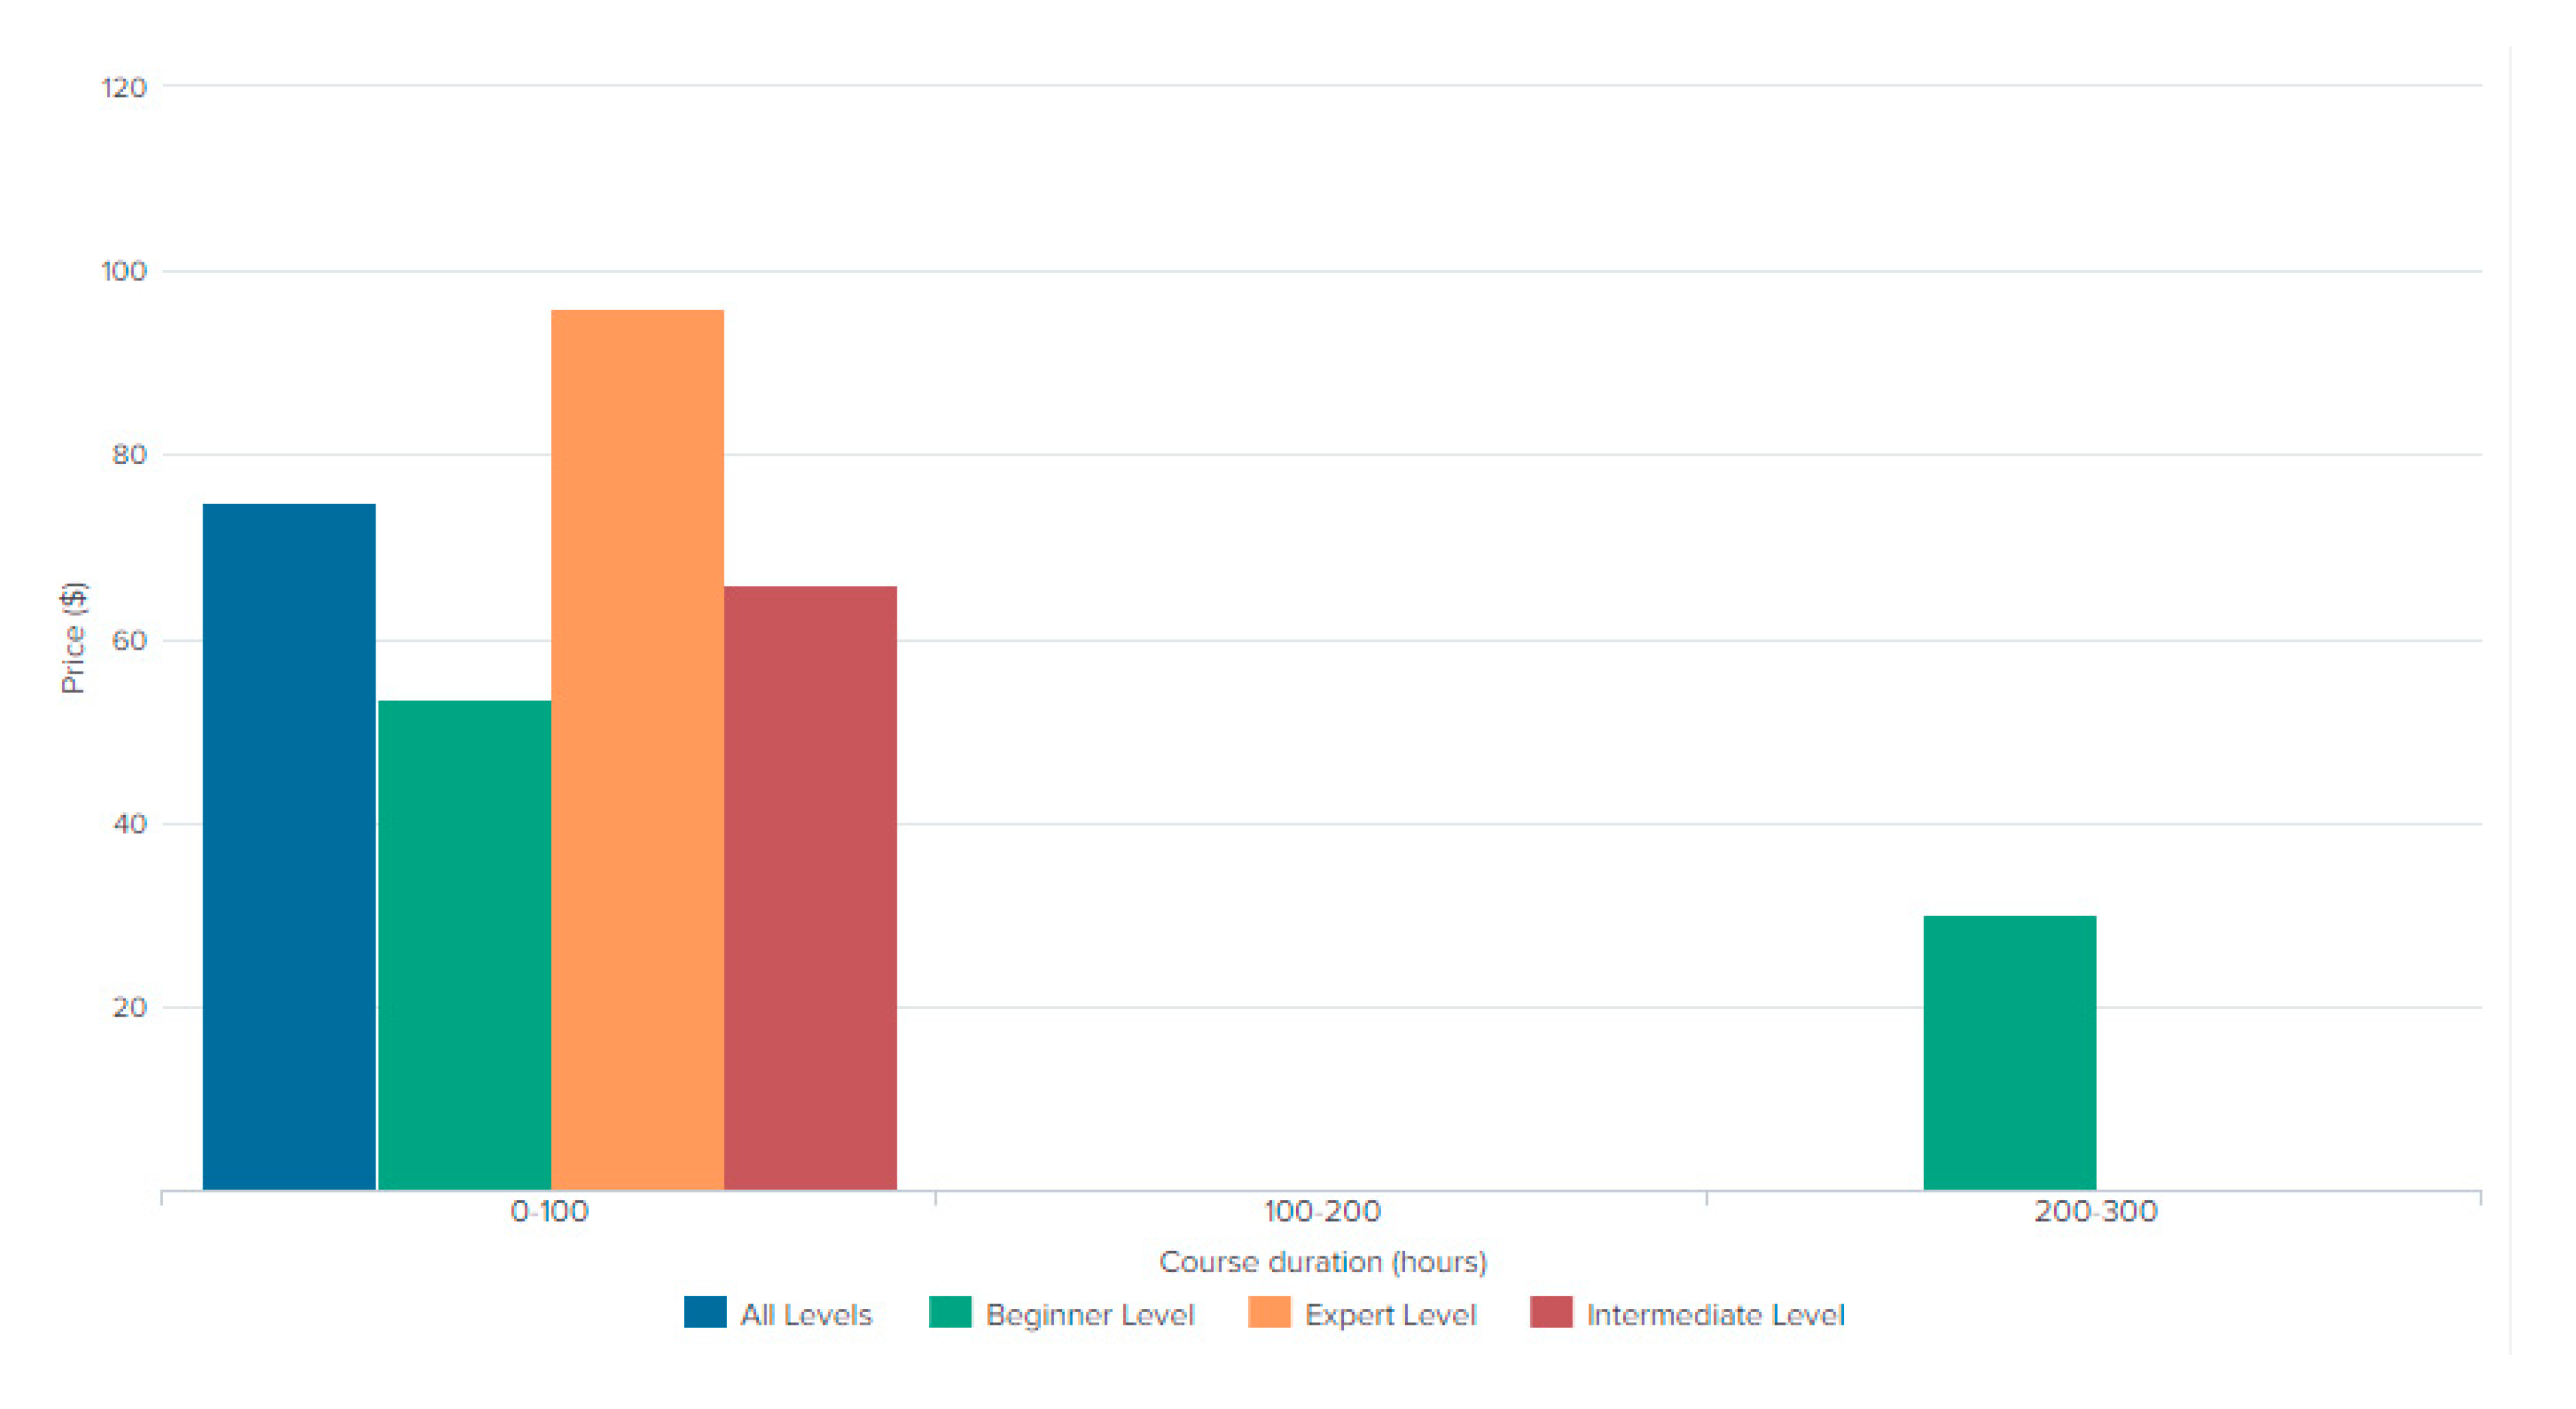
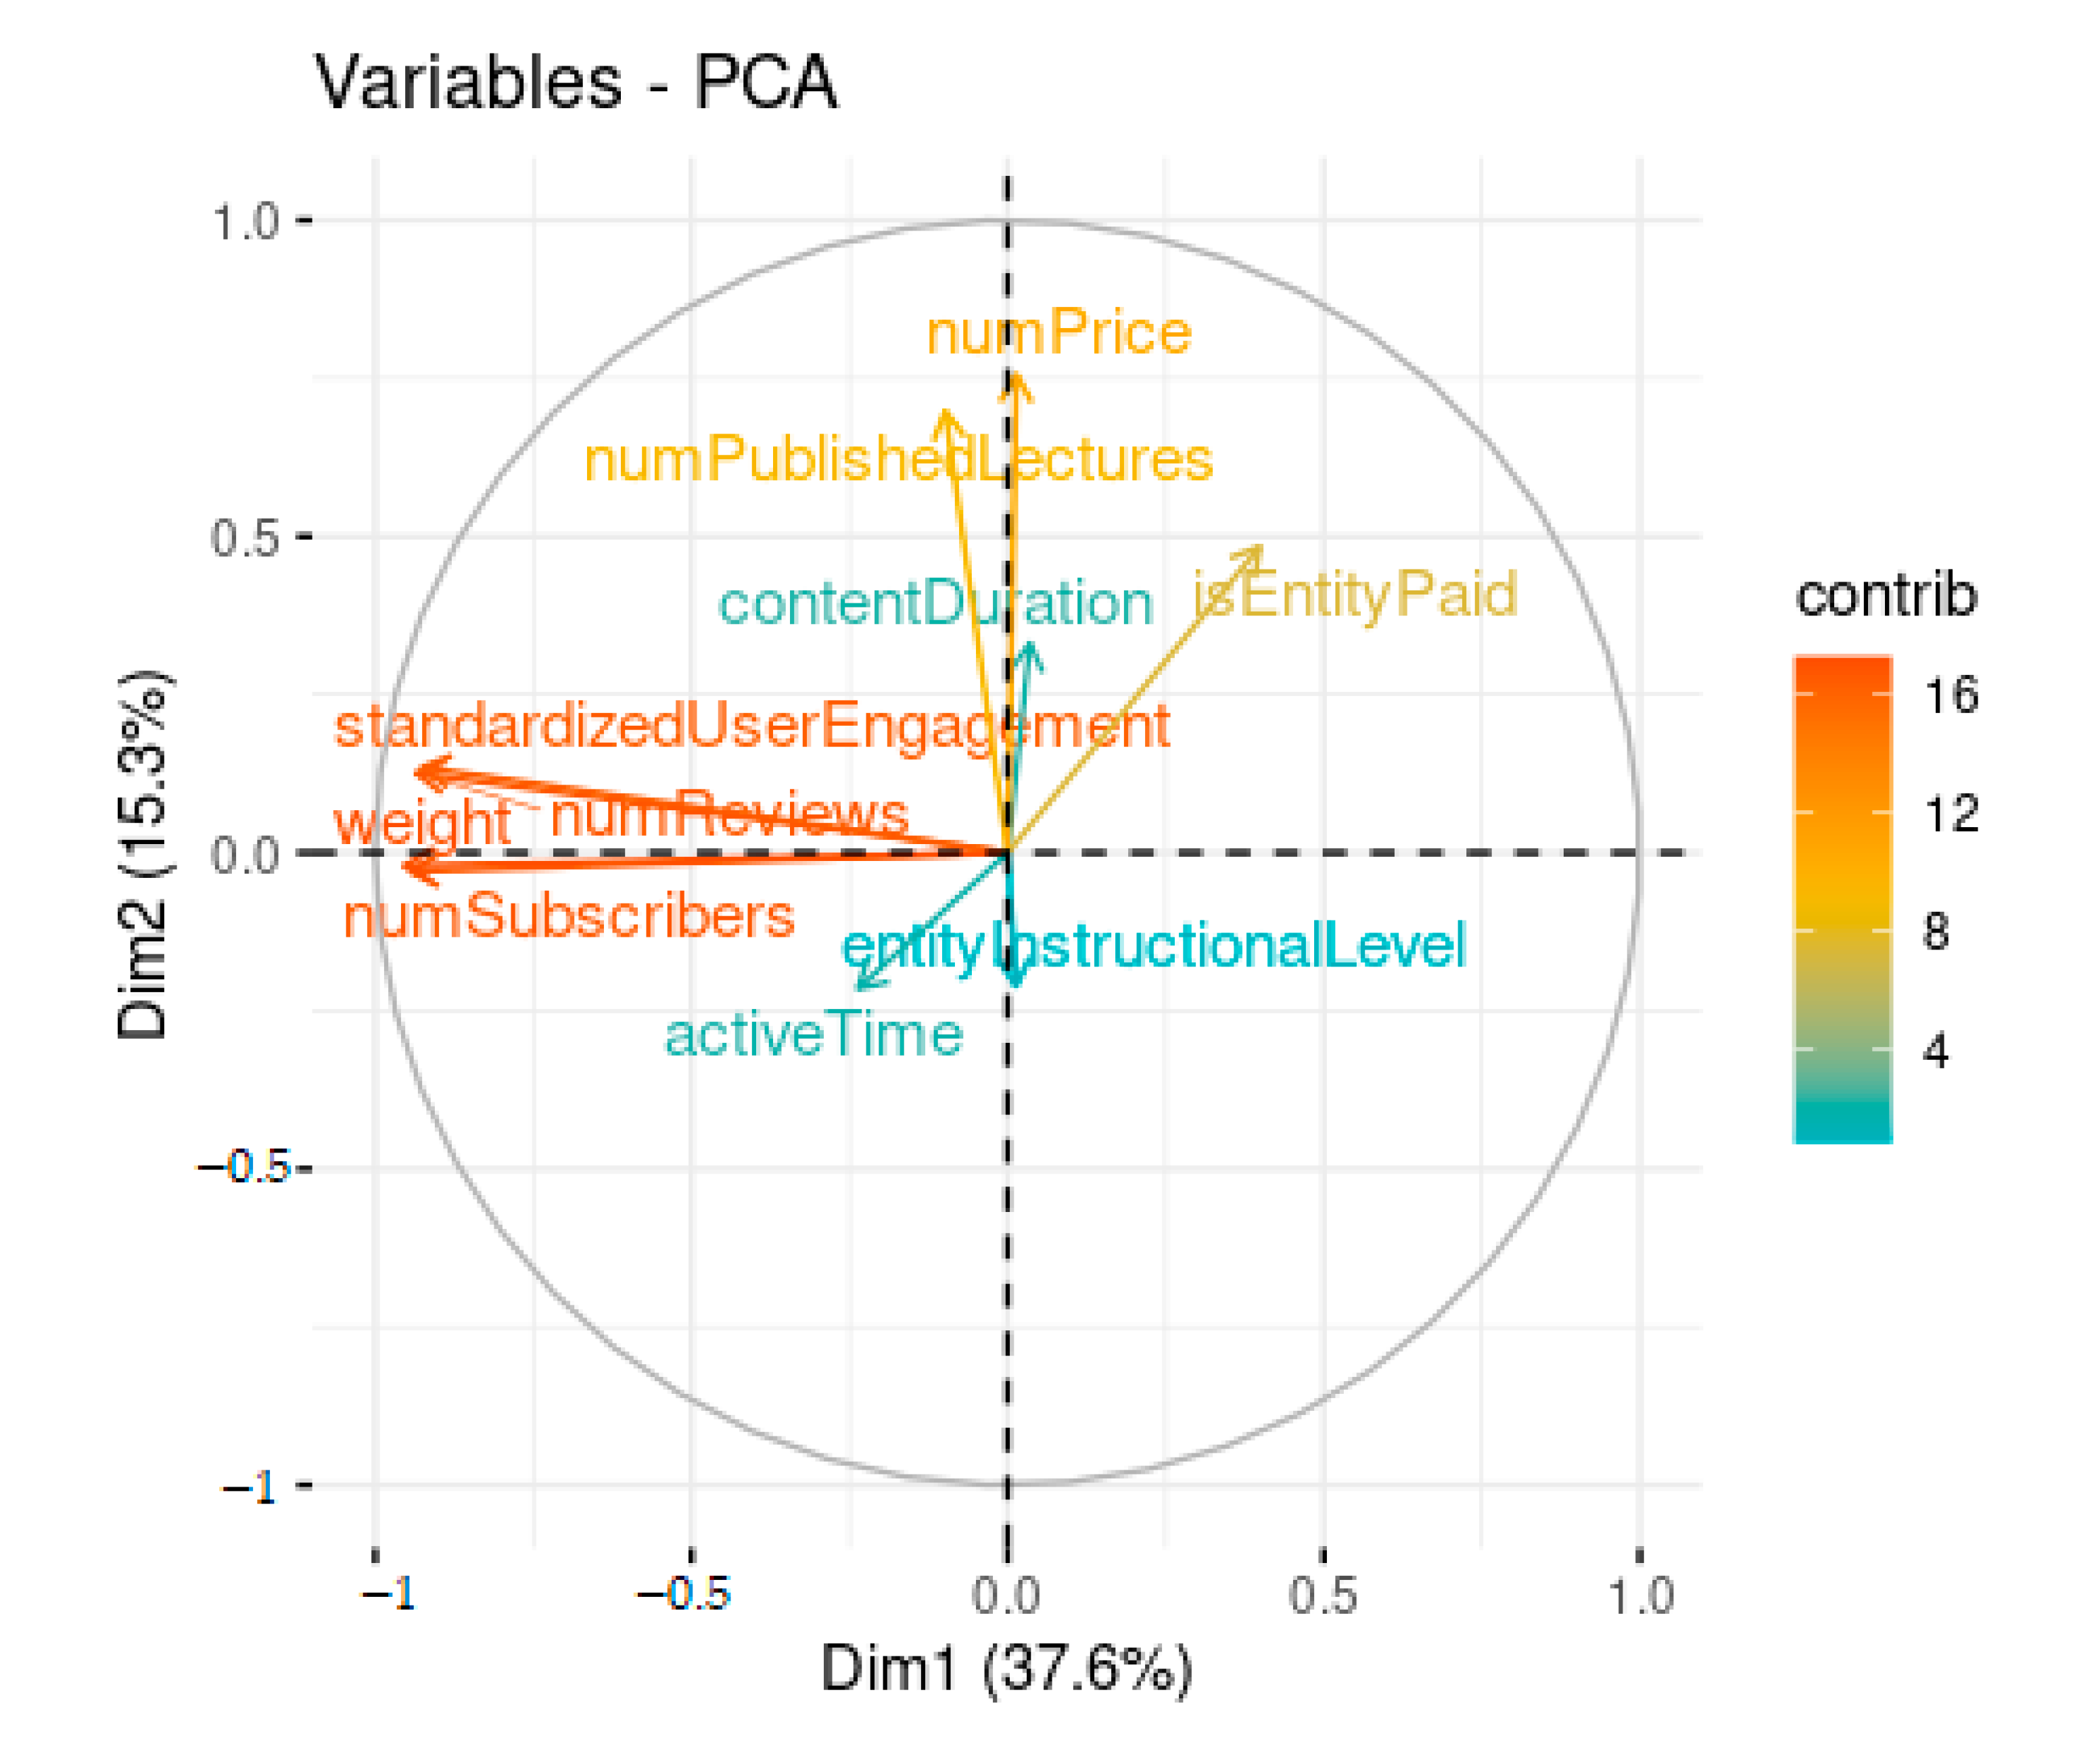
4. Results
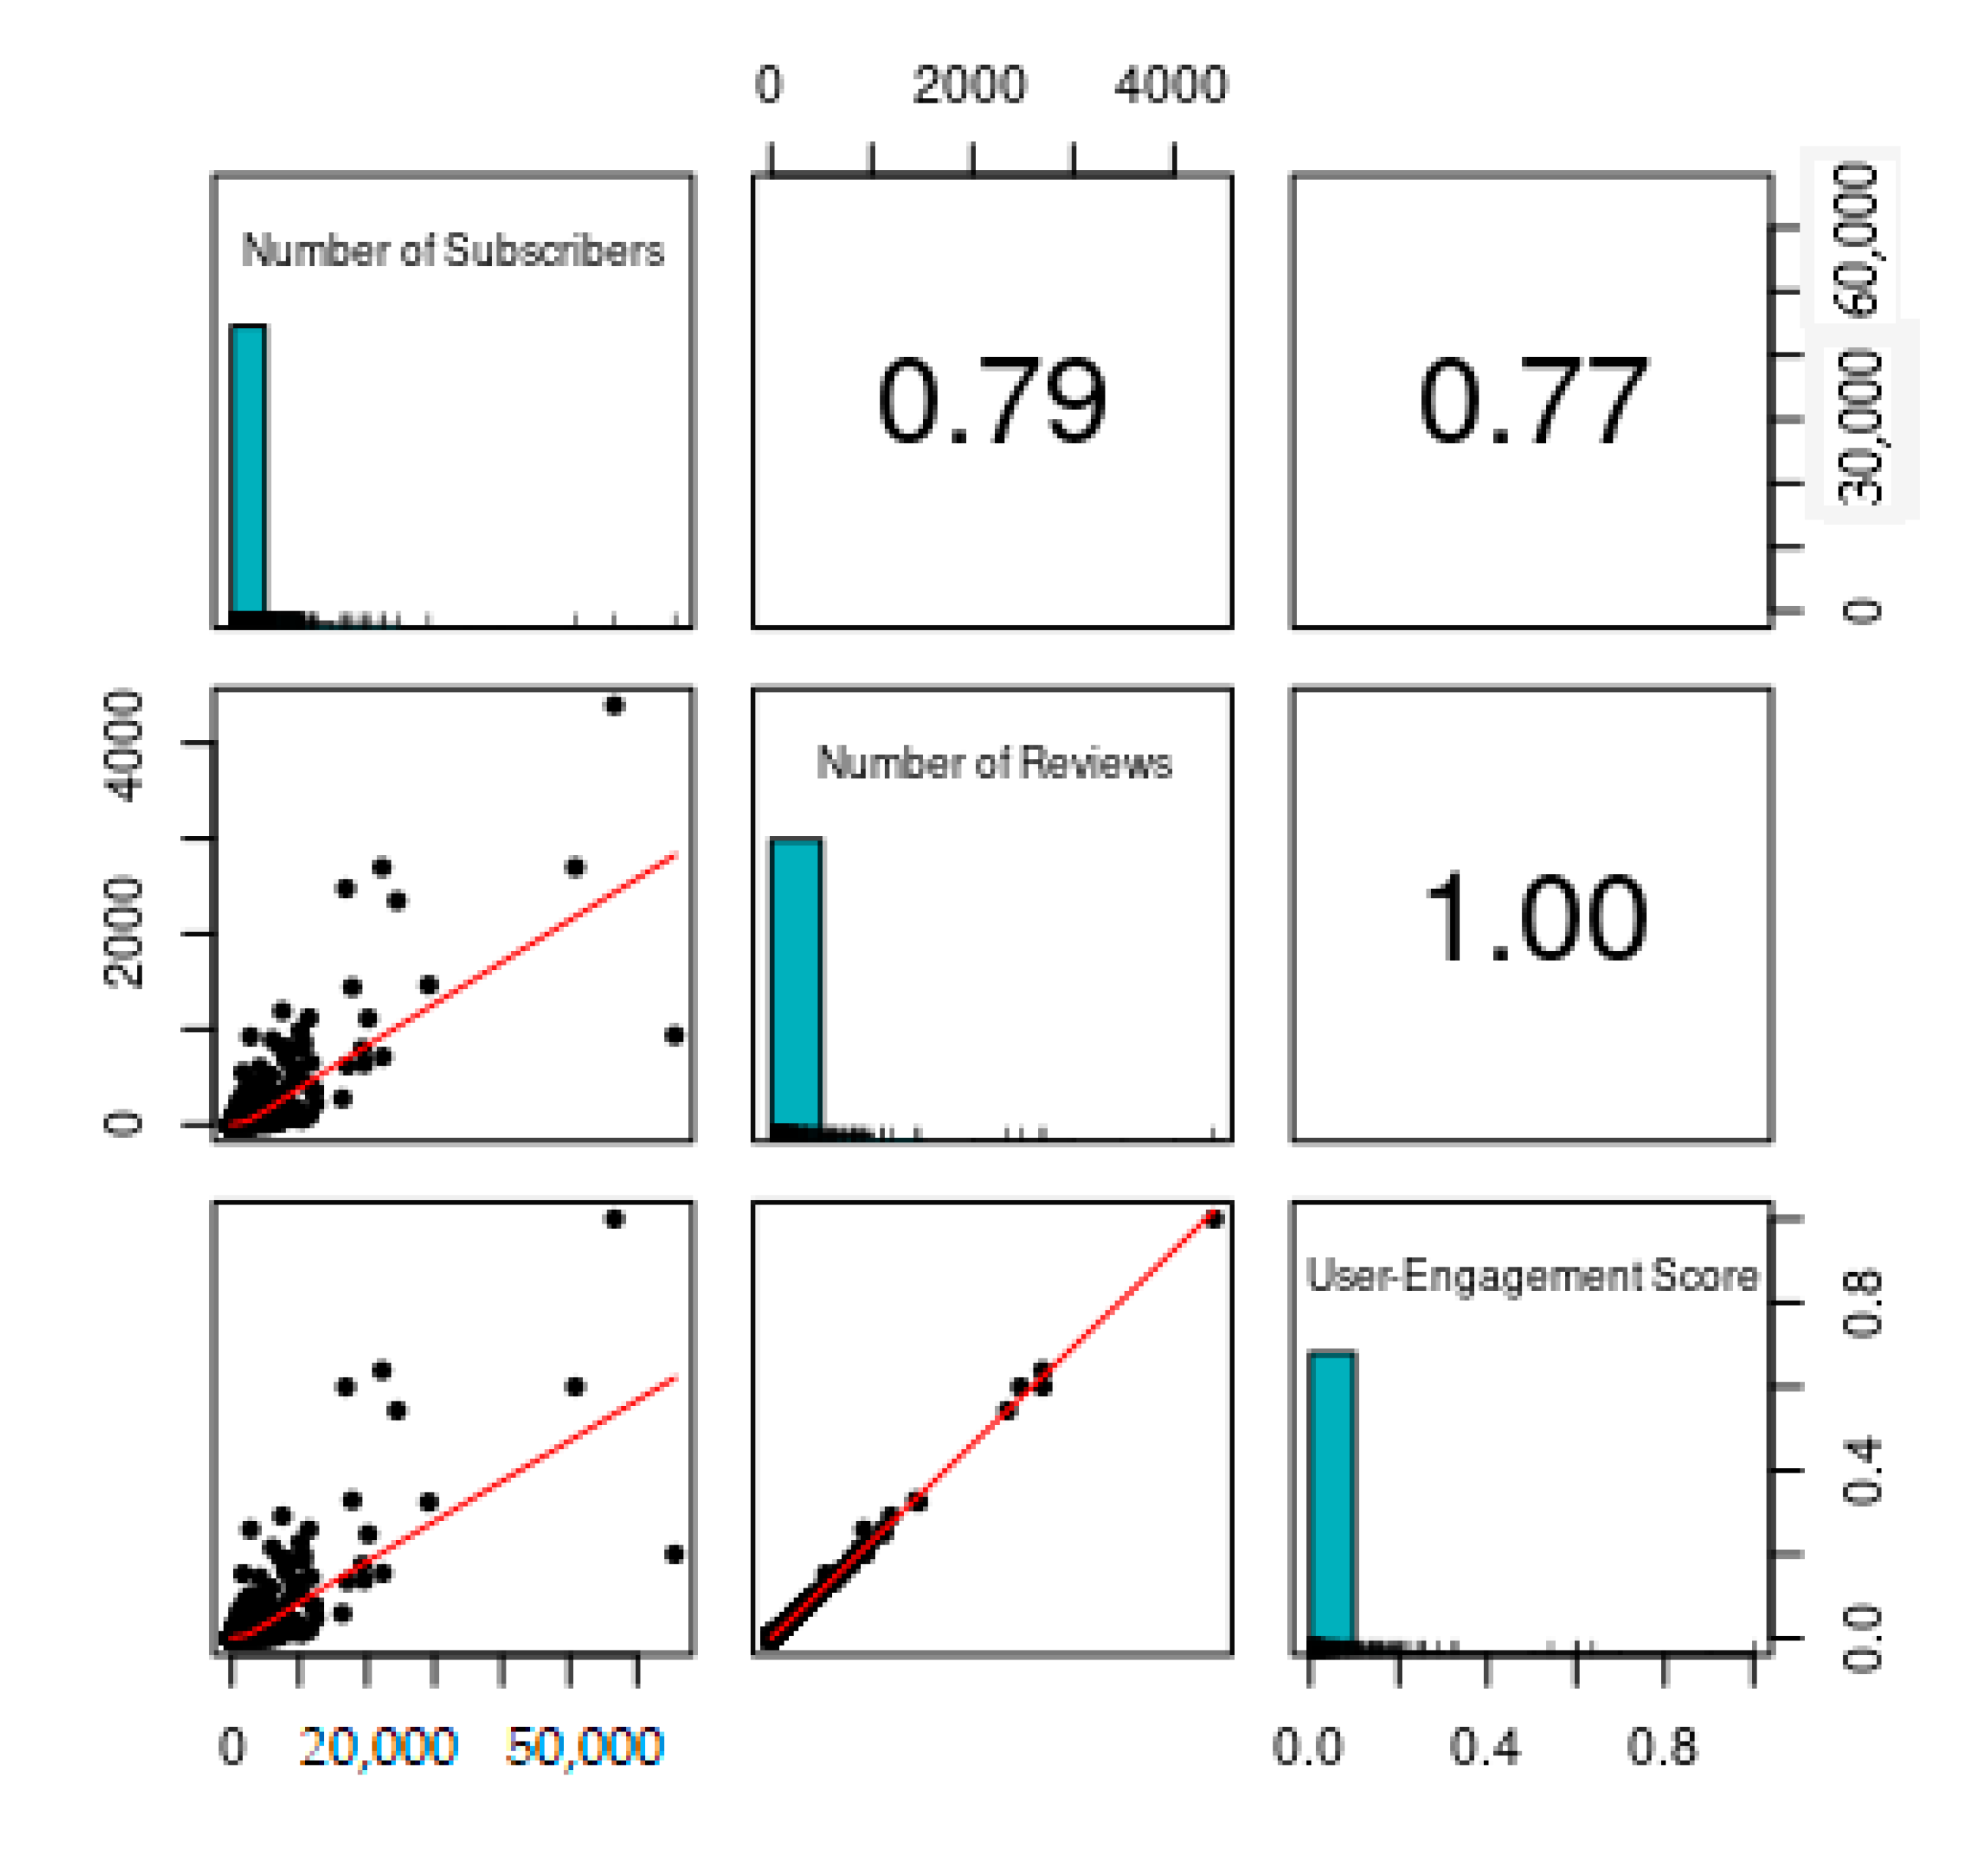
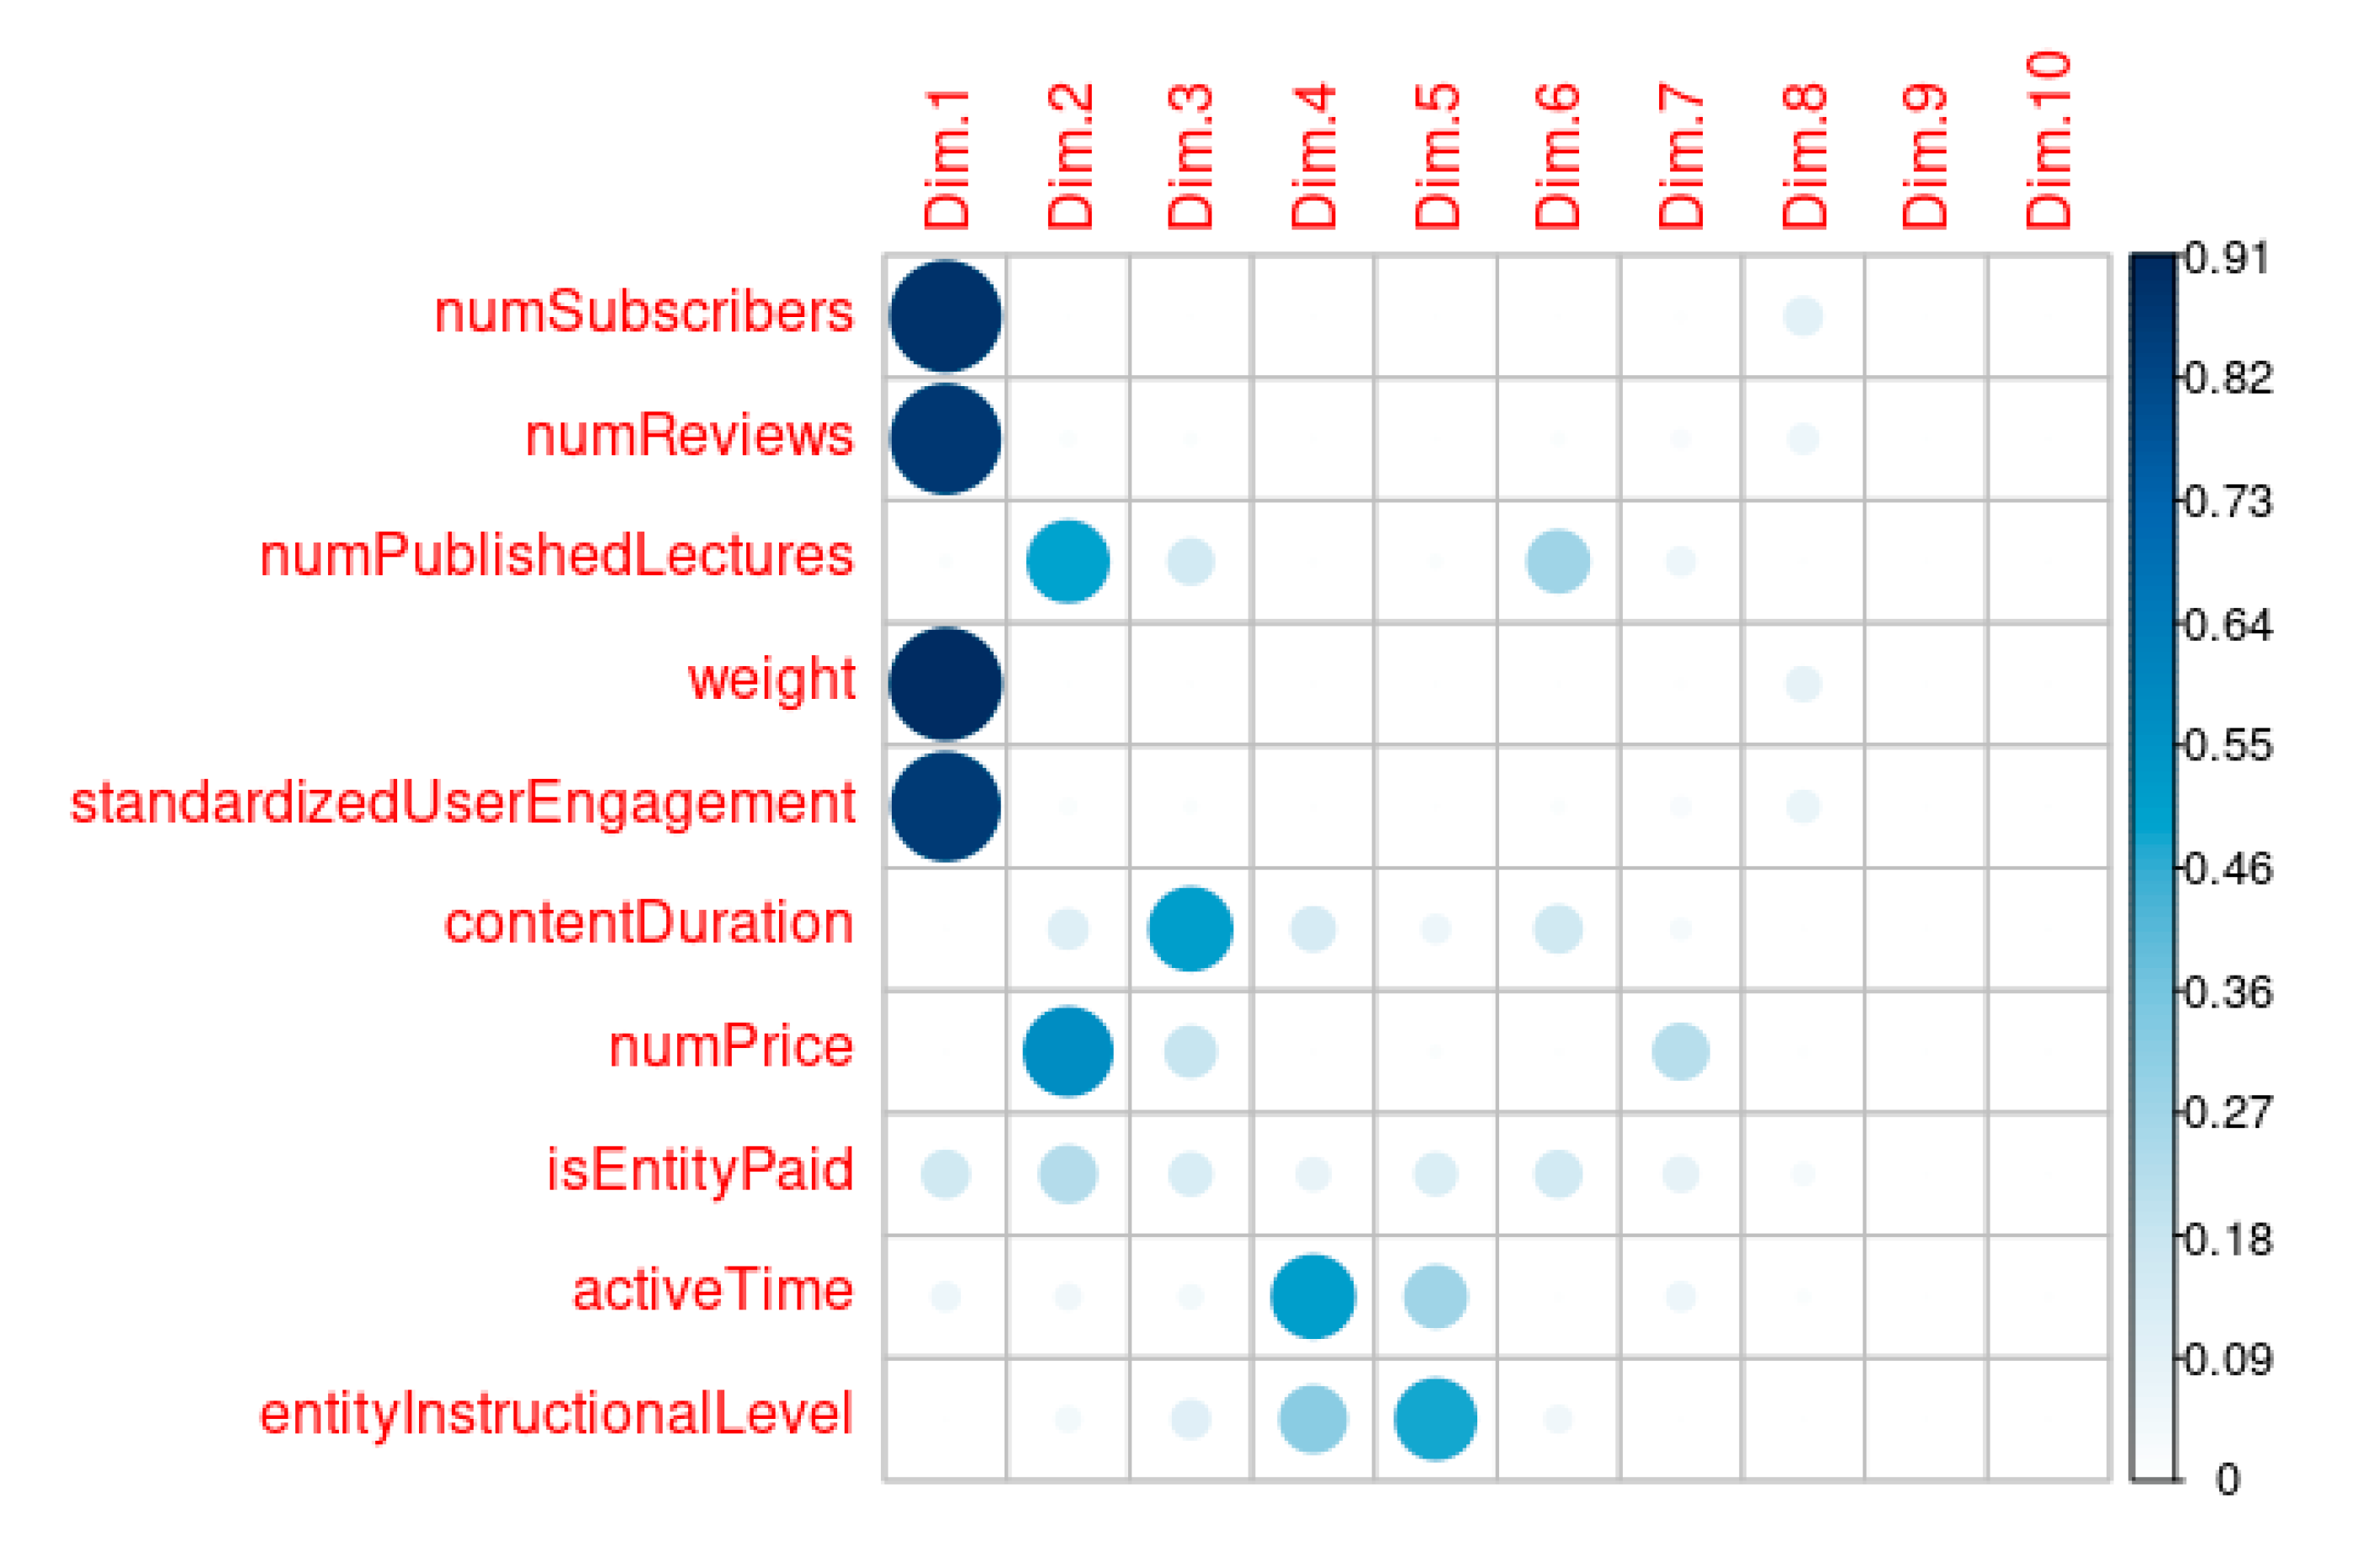
4.1. User-Engagement Calculations to Assess Educational Web Project Parts Interaction
4.2. SLO/SLA and the Obtained User-Engagement Score Correlation
5. Conclusions
Author Contributions
Funding
Conflicts of Interest
References
- Bojović, Ž.; Bojović, P.D.; Vujošević, D.; Šuh, J. Education in times of crisis: Rapid transition to distance learning. Comput. Appl. Eng. Educ. 2020, 28, 1467–1489. [Google Scholar] [CrossRef]
- Benta, D.; Bologa, G.; Dzitac, S.; Dzitac, I. University Level Learning and Teaching via E-Learning Platforms. Procedia Comput. Sci. 2015, 55, 1366–1373. [Google Scholar] [CrossRef]
- Moreno, R.; Mayer, R. Interactive multimodal learning environments. Educ. Psychol. Rev. 2007, 19, 309–326. [Google Scholar] [CrossRef]
- Lakshminarayanan, R.; Kumar, B.; Raju, M. Cloud Computing Benefits for Educational Institutions. In Second International Conference of the Omani Society for Educational Technology. Available online: https://arxiv.org/abs/1305.2616 (accessed on 12 May 2013).
- Google Trends. Available online: https://www.sciencedirect.com/science/article/pii/S1877050915015987 (accessed on 2 July 2020).
- Bashirov, M.G.; Bashirova, E.M.; Khusnutdinova, I.G.; Luneva, N.N. The technical condition assessment and the resource of safe operation of technological pipelines using electromagnetic-acoustic effect. In IOP Conference Series: Materials Science and Engineering; IOP Publishing: Bristol, UK, 2020; Volume 734, p. 012191. [Google Scholar] [CrossRef]
- Bednarski, L.; Sieńko, R.; Howiacki, T. Supporting historical structures technical condition assessment by monitoring of selected physical quantities. Procedia Eng. 2017, 195, 32–39. [Google Scholar] [CrossRef]
- Belodedenko, S.V.; Yatsuba, A.V.; Klimenko, Y.M. Technical condition assessment and prediction of the survivability of the mill rolls. Metall. Min. Ind. 2015, 7, 85–94. [Google Scholar]
- Błachnio, J. Analysis of technical condition assessment of gas turbine blades with non-destructive methods. Acta Mech. Autom. 2013, 7, 203–208. [Google Scholar] [CrossRef][Green Version]
- Fedushko, S.; Ustyianovych, T.; Gregus, M. Real-time high-load infrastructure transaction status output prediction using operational intelligence and big data technologies. Electronics 2020, 9, 668. [Google Scholar] [CrossRef]
- Belforte, S.; Fisk, I.; Flix, J.; Hernández, M.; Klem, J.; Letts, J.; Magini, N.; Saiz, P.; Sciaba, A. The commissioning of CMS sites: Improving the site reliability. J. Phys. 2010, 219, 062047. [Google Scholar] [CrossRef]
- Alfian, G.; Ijaz, M.F.; Syafrudin, M.; Syaekhoni, M.A.; Fitriyani, N.L.; Rhee, J. Customer behavior analysis using real-time data processing: A case study of digital signage-based online stores. Asia Pac. J. Mark. and Logist. 2019, 31, 265–290. [Google Scholar] [CrossRef]
- Alfian, G.; Syafrudin, M.; Ijaz, M.F.; Syaekhoni, M.A.; Fitriyani, N.L.; Rhee, J. A personalized healthcare monitoring system for diabetic patients by utilizing BLE-based sensors and real-time data processing. Sensors 2018, 18, 2183. [Google Scholar] [CrossRef]
- Cegan, L.; Filip, P. Advanced web analytics tool for mouse tracking and real-time data processing. In Proceedings of the IEEE 14th International Scientific Conference on Informatics, Informatics 2017–2018, Poprad, Slovakia, 14–16 November 2017; pp. 431–435. [Google Scholar]
- Elmsheuser, J.; Legger, F.; Medrano Llamas, R.; Sciacca, G.; Van Der Ster, D. Improving ATLAS grid site reliability with functional tests using Hammer Cloud. J. Phys. 2012, 396, 032066. [Google Scholar] [CrossRef]
- Kamiński, K.; Kamiński, W.; Mizerski, T. Application of artificial neural networks to the technical condition assessment of water supply systems. Ecol. Chem. Eng. 2017, 24, 31–40. [Google Scholar] [CrossRef]
- Su, Z.; Yang, Z.; Zhang, X. Tank gun recoil mechanism technical condition assessment based on improved kernel function SVM. In Proceedings of the IEEE 10th International Conference on Electronic Measurement and Instruments, ICEMI 2011, Chengdu, China, 16–19 August 2011; Volume 4, pp. 361–363. [Google Scholar] [CrossRef]
- Bosse, S.; Lehmhus, D. Digital real-time data processing with embedded systems. Mater. Integr. Intell. Syst. Technol. Appl. 2016, 281–300. [Google Scholar] [CrossRef]
- Feldmann, A.; Gasser, O.; Lichtblau, F.; Pujol, E.; Poese, I.; Dietzel, C.; Wagner, D.; Wichtlhuber, M.; Tapidor, J.; Vallina-Rodriguez, N.; et al. The Lockdown Effect: Implications of the COVID-19 Pandemic on Internet Traffic. In Proceedings of the ACM Internet Measurement Conference, Pittsburgh, PA, USA, 27–29 October 2020. [Google Scholar]
- Google. COVID-19 Community Mobility Report. 2020. Available online: https://www.google.com/covid19/mobility/ (accessed on 15 December 2020).
- Canizo, M.; Conde, A.; Charramendieta, S.; Minon, R.; Cid-Fuentes, R.G.; Onieva, E. Implementation of a large-scale platform for cyber-physical system real-time monitoring. IEEE Access 2019, 7, 52455–52466. [Google Scholar] [CrossRef]
- Habeeb, R.A.A.; Nasaruddin, F.; Gani, A.; Hashem, I.A.T.; Ahmed, E.; Imran, M. Real-time big data processing for anomaly detection: A survey. Int. J. Inf. Manag. 2019, 45, 289–307. [Google Scholar] [CrossRef]
- Chen, Y.; Iyer, S.; Liu, X.; Milojicic, D.; Sahai, A. SLA decomposition: Translating service level objectives to system level thresholds. In Proceedings of the 4th International Conference on Autonomic Computing (ICAC’07), Jacksonville, FL, USA, 11–15 June 2007. [Google Scholar]
- Melo, C.; Dantas, J.; Fé, I.; Oliveira, A.; Maciel, P. Synchronization server infrastructure: A relationship between system downtime and deployment cost. In Proceedings of the International Conference on Systems, Man, and Cybernetics (SMC), Banff, AB, Canada, 5–8 October 2017; pp. 1250–1255. [Google Scholar] [CrossRef]
- Elliot, S. DevOps and the Cost of Downtime: Fortune 1000 Best Practice Metrics Quantified; International Data Corporation (IDC): Framingham, MA, USA, 2014; Available online: https://kapost-files-prod.s3.amazonaws.com/published/54ef73ef2592468e25000438/idc-devops-and-the-cost-of-downtime-fortune-1000-best-practice-metrics-quantified.pdf (accessed on 15 December 2014).
- Izonin, I.; Tkachenko, R.; Kryvinska, N.; Zub, K.; Mishchuk, O.; Lisovych, T. Recovery of Incomplete IoT Sensed Data using High-Performance Extended-Input Neural-Like Structure. Procedia Comput. Sci. 2019, 160, 521–526. [Google Scholar] [CrossRef]
- Izonin, I.; Kryvinska, N.; Vitynskyi, P.; Tkachenko, R.; Zub, K. GRNN Approach Towards Missing Data Recovery Between IoT Systems. In Proceedings of the Advances in Intelligent Networking and Collaborative Systems; Springer: Cham, Switzerland, 2020; pp. 445–453. [Google Scholar]
- Beshley, M.; Kryvinska, N.; Seliuchenko, M.; Beshley, H.; Shakshuki, E.M.; Yasar, A. End-to-End QoS “Smart Queue” Management Algorithms and Traffic Prioritization Mechanisms for Narrow-Band Internet of Things Services in 4G/5G Networks. Sensors 2020, 20, 2324. [Google Scholar] [CrossRef]
- Poniszewska-Maranda, A.; Matusiak, R.; Kryvinska, N.; Yasar, A.-U.-H. A real-time service system in the cloud. J. Ambient. Intell. Humaniz. Comput. 2020, 11, 961–977. [Google Scholar] [CrossRef]
- Kryvinska, N.; Bickel, L. Scenario-Based analysis of IT enterprises servitization as a part of digital transformation of modern economy. Appl. Sci. 2020, 10, 1076. [Google Scholar] [CrossRef]
- Markovets, O.; Pazderska, R.; Horpyniuk, O.; Syerov, Y. Informational support of effective work of the community manager with web communities. CEUR Workshop Proc. 2020, 2654, 710–722. Available online: http://ceur-ws.org/Vol-2654/paper55.pdf (accessed on 17 June 2020).
- Kaminskyj, R.; Shakhovska, N.; Gregus, M.; Ladanivskyy, B.; Savkiv, L. An Express Algorithm for Transient Electromagnetic Data Interpretation. Electron. 2020, 9, 354. [Google Scholar] [CrossRef]
- Wurster, L.; Baul, S. Market Share Analysis: ITOM. Perform. Anal. Softw. Worldw. 2019. Available online: https://www.gartner.com/doc/reprints?id=1-1ZA4D838&ct=200619&st=sb (accessed on 17 June 2020).
- Chaudhary, V. Covid-19 & e-learning: Coursera sees massive uptake in courses. April 2020. Available online: https://www.financialexpress.com/education-2/covid-19-e-learning-coursera-sees-massive-uptake-in-courses/1920127/ (accessed on 6 April 2020).
- Beyer, B.; Jones, C.; Petoff, J.; Murphy, N.R. Site Reliability Engineering: How Google Runs Production Systems; O’Reilly Media, Inc.: Sebastopol, CA, USA, 2016; p. 552. [Google Scholar]
- Naseer, U.; Niccolini, L.; Pant, U.; Frindell, A.; Dasineni, R.; Benson, T.A. Zero Downtime Release: Disruption-free Load Balancing of a Multi-Billion User Website. In Proceedings of the Annual Conference of the ACM Special Interest Group on Data Communication on the Applications, Technologies, Architectures, and Protocols for Computer Communication; Association for Computing Machinery: New York, NY, USA, 2020; pp. 529–541. [Google Scholar]


| Subscribers Count Interval | Number of Courses |
|---|---|
| 0–5000 | 1119 |
| 5000–10,000 | 52 |
| 10,000–15,000 | 14 |
| 15,000–20,000 | 6 |
| 20,000–30,000 | 5 |
| 50,000–70,000 | 3 |
| User-Engagement Standardized Score | ||||||
|---|---|---|---|---|---|---|
| SLO/SLA | 0–0.25 | 0.25–0.5 | 0.5–0.75 | 0.75–0.95 | 0.95–1 | Total |
| 0–25% | X11 | X12 | X13 | X14 | X15 | X1+ |
| 25–50% | X21 | X22 | X23 | X24 | X25 | X2+ |
| 50–75% | X31 | X32 | X33 | X34 | X35 | X3+ |
| 75–95% | X41 | X42 | X43 | X44 | X45 | X4+ |
| 95–100% | X51 | X52 | X53 | X54 | X55 | X5+ |
| Total | X+1 | X+2 | X+3 | X+4 | X+5 | X |
| Low User-Engagement | Moderate User-Engagement | High User-Engagement | |
|---|---|---|---|
| Low SLO/SLA | Poor technical equipment condition. Critical infrastructure problems might arise. | Users face potential issues. Web-service needs to be improved, and the logs might be analyzed. | Users face many issues during interaction with a service. The bounce rate (single page visit) is likely to be high. |
| Moderate SLO/SLA | A service can face potential issues and problems. Even with a low load, the SLO/SLA is not high enough to be met. | Changes and improvements to the online-resource are necessary as well as user-monitoring implementation. | A service has a high throughput and users actively interact with it. The technical conditions need to be improved. |
| High SLO/SLA | A service met its objectives and is reliable, however, due to low user-engagement, it is quite difficult to predict online-resource behavior, and the SLO/SLA levels themselves when the load increases. | A system infrastructure/network/technical component performs well. The user-interaction needs to be improved and its future increase outcomes must be observed. | A service works well, users actively interact with a platform. The technical condition meets the desired requirements, so features and improvements can be added to maintain high scores. |
| Standardized User-Engagement Score Interval | Value |
|---|---|
| (0–0.1) | 1165 |
| (0.1–0.2) | 20 |
| (0.2–0.3) | 7 |
| (0.3–0.4) | 2 |
| (0.4–0.5) | 0 |
| (0.5–0.6) | 3 |
| (0.6–0.7) | 1 |
| (0.7–0.8) | 0 |
| (0.8–0.9) | 0 |
| (0.9–1) | 1 |
Publisher’s Note: MDPI stays neutral with regard to jurisdictional claims in published maps and institutional affiliations. |
© 2020 by the authors. Licensee MDPI, Basel, Switzerland. This article is an open access article distributed under the terms and conditions of the Creative Commons Attribution (CC BY) license (http://creativecommons.org/licenses/by/4.0/).
Share and Cite
Fedushko, S.; Ustyianovych, T.; Syerov, Y.; Peracek, T. User-Engagement Score and SLIs/SLOs/SLAs Measurements Correlation of E-Business Projects Through Big Data Analysis. Appl. Sci. 2020, 10, 9112. https://doi.org/10.3390/app10249112
Fedushko S, Ustyianovych T, Syerov Y, Peracek T. User-Engagement Score and SLIs/SLOs/SLAs Measurements Correlation of E-Business Projects Through Big Data Analysis. Applied Sciences. 2020; 10(24):9112. https://doi.org/10.3390/app10249112
Chicago/Turabian StyleFedushko, Solomiia, Taras Ustyianovych, Yuriy Syerov, and Tomas Peracek. 2020. "User-Engagement Score and SLIs/SLOs/SLAs Measurements Correlation of E-Business Projects Through Big Data Analysis" Applied Sciences 10, no. 24: 9112. https://doi.org/10.3390/app10249112
APA StyleFedushko, S., Ustyianovych, T., Syerov, Y., & Peracek, T. (2020). User-Engagement Score and SLIs/SLOs/SLAs Measurements Correlation of E-Business Projects Through Big Data Analysis. Applied Sciences, 10(24), 9112. https://doi.org/10.3390/app10249112