Abstract
During heat treatment of rectangular steel sections, a heated charge in the form of regularly arranged packages is placed in a furnace. The article presents a model of a complex heat transfer in such a package using the thermo-electric analogy. The model considers the following types of heat transfer: conduction in section walls, conduction and natural convection within gas, heat radiation between the walls of a section, as well as contact conduction between the adjacent sections. The results of our own experimental research were used for calculations of heat resistance applying to natural convection and contact conduction. We assumed that the material of sections was low-carbon steel and the gas was air. The result of the calculations of the presented model is total thermal resistance Rto. The calculations were performed for the temperature range 20–700 °C for four geometrical cases. Due to the variability of conditions for contact heat conduction, we assumed that total thermal resistance for a given charge is contained within a value range between Rto-min and Rto-max. We established that the value of Rto depends significantly on the section’s geometry. The larger the section sizes, the greater the changes of Rto. The minimal and maximal values of Rto for all packages were 0.0051 (m2·K)/W and 0.0238 (m2·K)/W, respectively. The correctness of model calculations was verified with the use of experimental data.
1. Introduction
In the practice of the industrial heat treatment of steel products, in many situations, there is a need to heat a porous charge [1]. An example of such a charge is a package of rectangular steel sections, which is presented in Figure 1. Due to heat treatment operations having a significant influence on energy consumption, production efficiency, pollutant emission, as well as the quality of the end product, they must be carefully controlled with the use of automatic control systems. This is connected with the selection of an optimal heating curve for each given case. The process of matching is performed by calculations with the use of adequate numerical models of heat transfer phenomena occurring in the furnace-heated charge system [2,3,4,5]. Due to the inhomogeneous, two-phase structure (steel-gas) of the discussed packages, there is a complex heat flow in their area. This is connected with the simultaneous occurrence of heat conduction, natural convection, and heat radiation. The total intensity of these processes can be expressed quantitatively by total thermal resistance Rto. Therefore, a model used to control the heated packages of sections must comprise a procedure of calculating the value of resistance Rto.
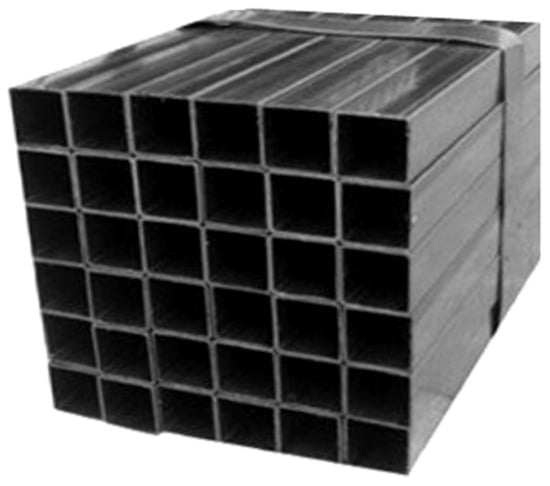
Figure 1.
A package of rectangular steel sections.
The article presents an original mathematical model for determining the value of resistance Rto of a package of steel sections based on electrical analogy [6]. This concept is often used to solve steady heat transfer problems in complex systems that involve combined parallel-series arrangements. Though such problems are often two- or even three-dimensional, an approximate solution can be obtained by assuming one-dimensional heat flow and using an appropriate thermal resistance network. The novelty of the presented approach consists of considering all the types of heat transfer that occur in the considered package. Moreover, the values of the parameters used to create the model were determined based on our own experimental research. Thanks to this knowledge (information), it was possible to derive relatively simple relationships that describe the influence of the natural convection of air and the contact conduction resistance between the layers of the package. This means that it would not be possible to create this model without conducting experimental research.
2. Materials and Methods
The starting point for the introduction of appropriate relationships is a physical model of the considered phenomenon. This model, as shown in Figure 2, is a regularly packed package of rectangular sections in which a steady one-dimensional heat flow occurs.
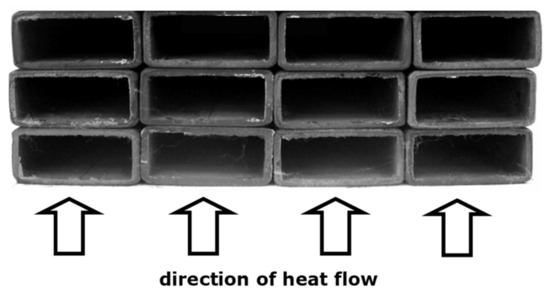
Figure 2.
A package of rectangular steel sections with one-dimensional heat transfer.
The total thermal resistance of the system presented in Figure 2 can be broadly considered as a serial connection of two resistances: heat resistance of sections Rst and thermal contact resistance Rct, which occurs between the consecutive layers of the package:
The resistances in Equation (1) refer to the unit surface area; therefore, their unit is (m2·K)/W. This unit has all the resistances included in the discussed model. The value of thermal resistance depends on the dimension of the considered layer. The resistance calculated according to the relationship (1) relates to the dimension that is equal to the height of a single layer of sections.
To determine the resistance Rst, it is necessary to consider all the mechanisms of heat transfer that occur within the sections. The heat is transmitted as a result of conduction in steel walls, conduction and natural convection of gas inside the sections, as well as heat radiation occurring between the inner surfaces of a section. The model considers the changes in the intensity of those mechanisms caused by the increase in temperature. Each of the mentioned mechanisms of heat transfer is assigned a corresponding thermal resistance. This means that when determining the value of Rst, it is necessary to consider the following: conduction resistances in steel, conduction resistance Rgs in the gas area, and heat radiation resistance Rrd. The solution is obtained by assuming one-dimensional heat transfer represented by heat flux q. When solving complex multidimensional heat transfer problems by regarding them as one-dimensional, two assumptions are commonly used: any plane wall normal to the direction of heat flow is isothermal and any plane parallel to the direction of heat flow is adiabatic [6]. These assumptions lead to two different resistance networks, and thus to different values for the total thermal resistance Rst-a and Rst-b. The resistance Rst-a relates to the division of the section into three vertical zones (I–III) parallel to the direction of heat flow, as shown in Figure 3a. The resistance Rst-b relates to the division of the section into three horizontal layers 1–3 (Figure 3b).
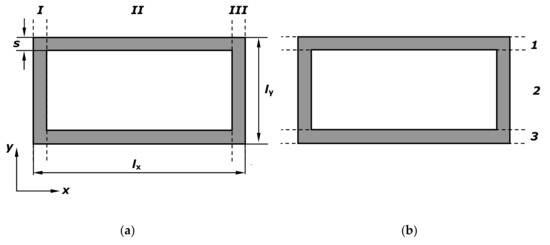
Figure 3.
Division of a section into: (a) vertical zones I–III, (b) horizontal layers 1–3.
The thermal resistance networks corresponding to the individual divisions of the section are shown in Figure 4. On this basis, we obtain:
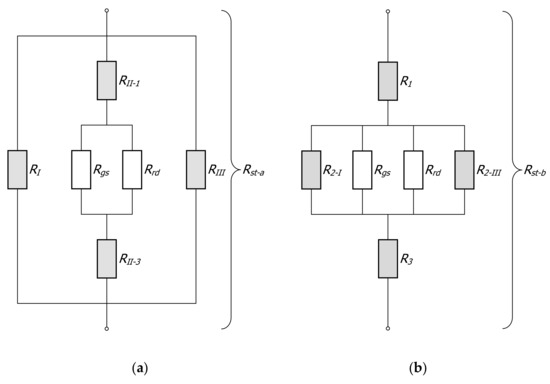
Figure 4.
Thermal resistance networks of a rectangular section: (a) network for resistance Rst-a and (b) network for resistance Rst-b.
As each division of a section considers different assumptions about the temperature field, the value of Rst-a is slightly bigger than the value of Rst-b. This result follows the above-mentioned different properties of the division planes. In the case of division into vertical zones, the division planes are adiabatic, whereas in the case of division into horizontal zones, the division planes are excellent conductors, which underrates the value of resistance. Hence, the final value of the section thermal resistance Rst is calculated using [7]:
The resistances occurring in the Equations (2) and (3), which apply to conduction in section walls (they are marked grey in Figure 4), are described with the following relationships:
where ks is the thermal conductivity of steel.
The resistance Rgs applies to the heat flow in the gas area, which is connected with the conduction and the natural convection in a horizontal enclosure occurring at the same time. Both phenomena can be treated jointly as an intensified heat conduction expressed quantitatively by equivalent gas thermal conductivity keg [7]:
where kg is the thermal conductivity of gas and Nu is the Nusselt number.
The following correlations are recommended for horizontal enclosures that contain air [6]:
For 104 < Ra < 4 × 10⁵:
For 4 × 10⁵ < Ra < 107:
where Ra is the Rayleigh number. For an enclosure, this number is defined as:
where g is gravitational acceleration, β is the coefficient of volume expansion, Δt is the temperature difference between hot and cold surfaces of the enclosure, Lc is the characteristic length of the geometry (in the section case, this is the distance between the hot and the cold surface), v is the kinematic viscosity of the fluid, and Pr is the Prandtl number. For air, Pr = 0.71 [6].
Based on the research described in [8,9], the values of the Rayleigh number for square 60 mm and 80 mm sections were calculated. The research consisted of heating the sections with a one-dimensional (oriented vertically from the bottom to the top), steady heat flux and measuring the temperature difference Δt between their hot (lower—with th temperature) surface and their cold (upper—with temperature tc) surface with the use of jacked thermocouples. The research was conducted for the temperatures ranging from room temperature to 750 °C. The values of the Δt parameter in the function of the mean temperature of a section tm = 0,5(th + tc) obtained this way are presented in Figure 5a. Then, the values of the Nusselt number (Figure 5b) for the above-mentioned sections were calculated using Equations (10)–(12). Depending on the size of a section, natural convection in relation to pure conduction can increase the intensity of heat transfer four to seven times. However, this effect decreases significantly with the temperature increase.
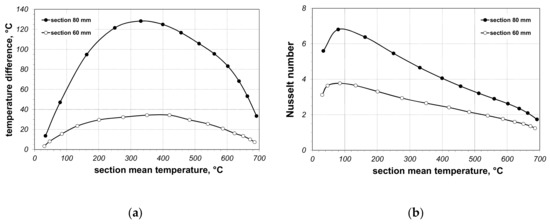
Figure 5.
Values for the 60 and 80 mm sections: (a) temperature difference Δt and (b) Nusselt number [9].
The highest values of the Nu occur for the temperature of 100 °C. This is mainly caused by changes in the temperature difference Δt observed in the area of sections and changes in kinematic viscosity of air. The increase in the Nu value at the initial stage is attributable to changes in the parameter Δt. After exceeding 100 °C, the main effect on convection is from changes in air viscosity. Thus, with a further increase in temperature, the Nusselt number starts to decline rapidly despite a further rise in the difference in temperature. At the same time, the value of parameter Δt depends on the other heat transfer mechanisms that are present in the section. All these mechanisms are interrelated and, as a result, the course of convection and the Nusselt value depend on the section geometry and the thermal properties of the steel [10].
Based on the curves in Figure 5b for calculating the change in the Nusselt number in relation to temperature, the following relationships were derived.
For a 60 mm section:
For an 80 mm section:
In case of sections with dimensions smaller than 60 mm, the Nu number does not exceed the value of 1.2. Therefore, for such sections, the influence of natural convection of gas in the model calculations is ignored.
Considering Equation (9), resistance Rgs can be described by:
Radiation resistance Rrd can be solved through analysis of the thermal radiation transfer in the system of four flat surfaces that close a space. The methodology for the determination of resistance Rrd for this system was described in [11]. When the temperature drop ΔT in the system is much smaller than its mean absolute temperature Tm [K], radiation resistance can be described by:
where σc is the Stefan–Boltzmann constant and ε is the emissivity of the section surface.
According to Equation (1), the intensity of heat flow in the package area also depends on the thermal contact resistance Rct. This resistance expresses the heat transmitted between subsequent layers of the package in a quantitative way. Due to shape errors of the sections, contact between adjacent layers does not occur across the entire surface of the package, but only on small discrete contour areas whose sizes and spacing are completely random. This is the reason why the thermal contact resistance cannot be described by the commonly used analytical relationships [12,13,14]. Furthermore, the experimental investigation of this resistance also proves difficult due to the hollow interior of the sections, which makes it impossible to measure the temperature distribution along those elements. To overcome this problem, we assumed that the thermal contact resistance of the adjacent sections is similar to the thermal contact resistance in the packed bed of square or flat bars. The pictorial photographs of these type of beds are shown in Figure 6.
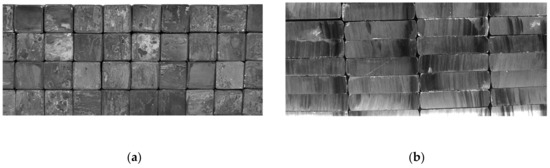
Figure 6.
Examples of the investigated samples: (a) a bed of square bars and (b) a bed of flat bars.
The total thermal resistance Rto of such beds was determined experimentally using a guarded hot plate apparatus. The operating principle of this device is described in the standards [15,16]. During these tests, the beds of bars were heated with a one-dimensional, steady heat flux rate. The moment the fixed state was reached, the temperature difference Δt between the surfaces of the sample perpendicular to the direction of heat flow was measured. The thermal resistance of the sample relating to the dimension equal to a single layer of bars was calculated from the relationship:
where qs is the heat flux in the sample, lb is the dimension of the layer of bars, and lsp is the dimension of the tested sample (the dimensions lb and lsp relate to the direction congruent with the heat flow).
Due to a series of measurements for bigger and bigger values of qs, it is possible to determine the change in resistance Rto for a set temperature range. In the described tests, the resistance Rto was set for four samples (two beds of rectangular 10 mm × 10 mm and 20 × 20 mm bars, two beds of flat 5 × 20 mm and 10 × 40 mm bars) in the temperature range of 50–650 °C. The smoothed results of these measurements are presented in Figure 7a.
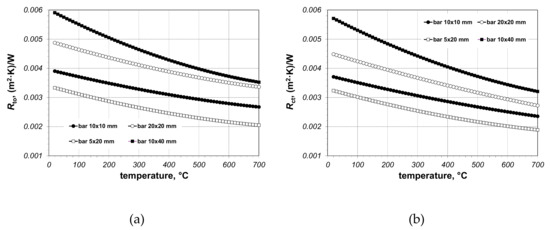
Figure 7.
(a) Smoothed results of measurements of the Rto resistance of beds of bars and (b) the results of calculations of the Rct resistance of beds of bars.
If the bar thermal conductivity kb is known, the thermal contact resistance of such samples can be calculated from the following relation:
The lb dimension for individual samples took the following values: 0.01, 0.02 and 0.005 m. The results of the Rct resistance calculations according to the Equation (18) are presented in Figure 7b.
The changes in the Rct resistance for all the tested samples with respect to temperature t can be approximated by the polynomial:
The lowest and highest values of the thermal contact resistance Rct are described by the following equations:
where Rct-min resistance corresponds to the bed of 5 × 20 mm bars and Rct-max resistance corresponds to the bed of 10 × 40 mm bars.
Using Equations (20) and (21), two limiting values of the resistance Rto can be determined. The total thermal resistance of a given section package should remain between these values. This approach appears to be reasonable because the resistance Rto expressing the ability of a given package to transfer heat. For the considered system, this ability is largely dependent on the contact conditions in adjacent sections layers, which may vary between different section types.
3. Results and Discussion
In the presented model, the following parameters are used as input data: section dimensions (width lx, height ly, and wall thickness s), emissivity of the section surface ε, Nusselt number Nu, thermal conductivities of steel ks, and gas kg. The last two parameters with respect to temperature are described by the following equations [17]:
Equation (22) refers to steel with a carbon content of 0.2%, whereas Equation (23) refers to the air. For the emissivity of section surface, a value of 0.5 was assumed, which relates to the rolled carbon steel [18].
The presented model enables the analysis of the process of heat flow in the area of the package of sections, both in a quantitative and qualitative manner. The quantitative analysis relates to determining the value of individual resistances, whereas the quantitative analysis consists of determining the share of the individual mechanisms in the heat transfer that occurs while heating the package. The results of the calculations presented below relate to four packages of the following sections: 20 × 40 × (2.5) mm, 40 × 40 × (3) mm, 60 × 60 × (3) mm, and 80 × 80 × (3) mm, where the number in parentheses is the thickness of a section wall.
First, the results of the calculations of the Rst resistance of the sections are presented. This parameter was calculated for two cases. Case I applies to the situations when all the types of heat transfer (conduction, radiation and convection) occur within a section; the results of these calculations are presented in Figure 8a. Case II applies to the situations when only heat conduction occurs within a section (gas convection and heat radiation between the inner surfaces of a section were ignored); the results of these calculations are presented in Figure 8b. By comparing the diagrams, it is possible to notice that the difference between the values of Rst resistance for both cases increases with temperature; the bigger the size of a section, the bigger this difference. This effect is caused by the intensity of heat radiation increasing with the temperature function (proportional to the third power of Tm) and the distance between the surfaces that exchange heat.
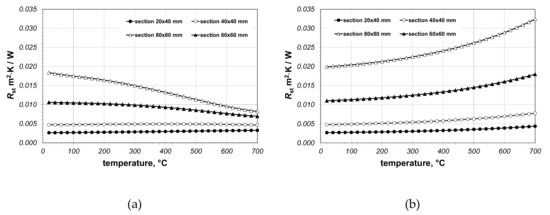
Figure 8.
The results of the calculations of Rst resistance of sections: (a) the values obtained for all kinds of heat transfer and (b) values obtained while considering conduction only.
To quantitatively express the differences in the value of Rst resistance between case I and case II, a relative percentage difference ΔRst was calculated, which was defined by the following relationship:
where Rst-I is the value of resistance of a section in case I and Rst-II is the value of resistance of a section in case II.
The values of the ΔRst parameter obtained for individual sections for chosen temperature values are collated in Table 1. The maximum value of ΔRst was nearly 300%.

Table 1.
The values of the ΔRst parameter for individual sections for chosen temperatures.
In the case of the performed analysis, the shape of the relationship between the Rst resistance of individual sections and the Rct resistance of contact conduction is interesting. To show the problem from the quantitative perspective, the quotient of resistances Rct/Rst was calculated for each section. The calculations were run both for the maximal and the minimal value of Rct. The results of these calculations are collated in Figure 9. In most cases, the Rst resistance was characterized by a higher value.
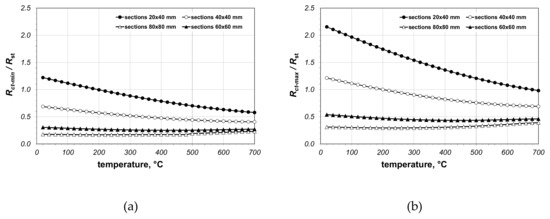
Figure 9.
The results of the calculation results of the Rct/Rst quotient: (a) values obtained for Rct-min and (b) values obtained for Rct-max.
At the end of the performed analysis, the results of calculations of Rto resistance of packages will be discussed. These results are presented in Figure 10. The total thermal resistance value as well as its changes in the temperature function depend significantly on the section geometry. The larger the sections size, the greater the changes of Rto. The values of Rto-min and Rto-max obtained for each package for 20 and 700 °C are presented in Table 2. The minimal and maximal values for all packages were 0.0051 and 0.0238 (m2·K)/W, respectively. This means that the resistance Rto varies more than four and a half times.
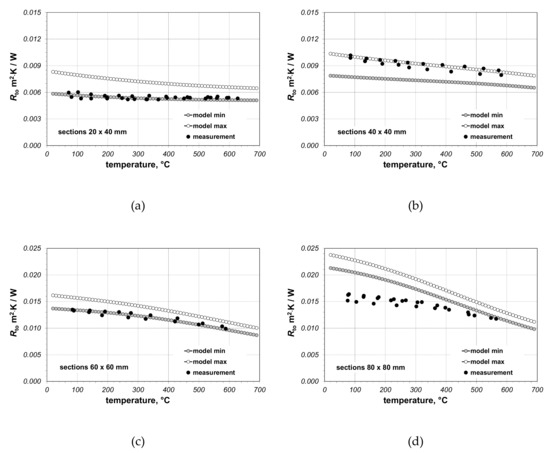
Figure 10.
The results of model calculations and the measurements of the total thermal resistance of packages of rectangular steel sections: (a) sections 20 × 40 mm, (b) sections 40 × 40 mm, (c) sections 60 × 60 mm, (d) sections 80 × 80 mm.
Table 2.
Minimal and maximal values of resistance Rto obtained for 20 and 700 °C.
To perform a more detailed analysis, one additional parameter was calculated. This parameter, denoted as dRto, describes percentage changes in the resistance Rto in relation to its mean value and is expressed as:
The values of the parameter dRto are shown in Figure 11. The larger the section’s dimensions, the smaller the values of the considered parameter. At the same time, with the increase in dimensions of the sections in the package, we observe smaller changes in dRto in the temperature function. The values of the parameter dRto obtained for the extreme temperatures are summarized in Table 3.
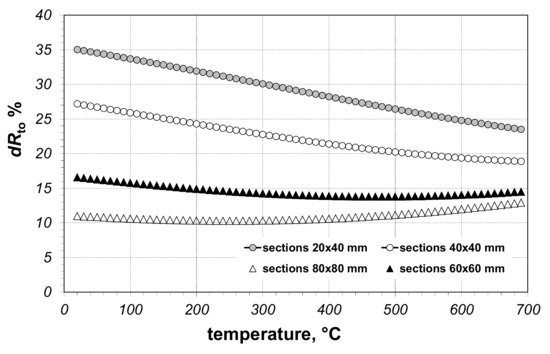
Figure 11.
The values of the parameter dRto in the temperature function.
Table 3.
The values of the parameter dRto obtained for 20 and 700 °C.
To evaluate the correctness of the presented model, the computed values of Rto were compared with the experimental results. The experimental values of Rto were measured using a guarded hot plate apparatus [19]. The device works according to the principles described in the standards [15,16]. The measurement data also apply to the same sections that were analyzed in the calculations. The tests consisted of heating flat beds of sections (see Figure 2) with a steady, one-dimensional heat flux rate. The moment the fixed state was reached, the temperature difference Δts between the outer layers of the sample perpendicular to the direction of heat flow was measured. The thermal resistance of the sample relating to the dimension of a single layer of section was calculated from the relationship:
where qs is the heat flux in the sample, lst is the dimension of a layer of sections, and lsp is the dimension of the tested sample (the lst and lsp dimensions relate to the direction congruent with the direction of heat flow).
The experimental values of Rto are shown in Figure 10 with the use of black dots. In case of the 20 × 40 and 60 × 60 mm sections, the measurement values of Rto almost exactly coincided with the modelled values Rto-min, while for the 40 × 40 mm sections, experimental data were very close to the modelled values Rto-max. For these three cases, the considered model reflects the temperature changes in the Rto values relatively well. A different situation was observed for the 80 × 80 mm sections. In this case, all the measured results were distinctly lower than the calculated values. This discrepancy, however, diminished with temperature increase.
For the sections of 20 × 40 and 60 × 60 mm, the maximum differences between the measured and the model Rto-min values were 6.1% and 5.2%, respectively. These differences are similar to measurement uncertainty, which, for the used experimental stand, is about 5%. For the 80 × 80 mm sections, the maximum discrepancy between the modelled and experimental values was 26%. The lack of consistent results for this package can be explained by the excessive measurement error. The samples investigated in a guarded hot plate apparatus should have a suitable proportion of dimensions: the height of the sample cannot be too large in relation to its transverse dimensions. In the case of the sample from 80 × 80 mm sections (due to their large dimensions), this condition was not fulfilled. This situation caused undesirable heat loss from the side surface of the sample. As a consequence of these losses, the values of the measured parameter were characterized by an additional error. This caused the measured values to be too low, but it is very difficult to estimate this inaccuracy. For this reason, the values of total thermal resistance measured for this package cannot be used for model evaluation.
4. Conclusions
The computations of the total thermal resistance Rto of the steel rectangular section package were performed. The value of Rto mostly depends on the heat transfer conditions that exist between adjacent layers of the package. These conditions are determined by the quality of the section surface. Therefore, we assumed that for a package of the same geometry, the value of resistance Rto might vary within some range. The correctness of this assumption confirmed the results of the experimental measurements. We showed that despite the high complexity of heat transfer in the considered package, its total thermal resistance can be calculated with the use of a relatively simple mathematical model.
We also showed that the main influence over the heat flow within the sections is exerted by heat conduction in the walls. The second mechanism is heat radiation; however, its share was significant only in the case of the 60 mm and 80 mm sections, whereas heat transfer within gas plays a much less important role. We established that, in most cases, the Rst resistance of sections is larger than the Rct resistance of contact conduction.
Author Contributions
Conceptualization, R.W. and V.B.; methodology, R.W.; software, M.G.; measurements, R.W.; validation, M.G. and R.W.; formal analysis, M.G. and R.W.; writing—original draft preparation, M.G., R.W., and V.B.; writing—review and editing, M.G., R.W., and V.B.; visualization, M.G.; supervision, V.B. All authors have read and agreed to the published version of the manuscript.
Funding
This research received no external funding
Conflicts of Interest
The authors declare no conflict of interest.
References
- Kolmasiak, C.; Wyleciał, T. Heat treatment of steel products as an example of transport phenomenon in porous media. Metalurgija 2018, 57, 363–366. [Google Scholar]
- Sahay, S.S.; Krishnan, K. Model Based Optimization of Continuous Annealing Operation for Bundle of Packed Rods. Ironmak. Steelmak. 2007, 29, 89–94. [Google Scholar] [CrossRef]
- Sahay, S.S.; Mehta, R.; Krishnan, K. Genetic-Algorithm-Based Optimization of an Industrial Age-Hardening Operation for Packed Bundles of Aluminium Rods. Mater. Manuf. Proc. 2007, 22, 615–622. [Google Scholar] [CrossRef]
- Jaluria, Y. Numerical simulation of the transport process in a heat treatment furnace. Int. J. Numer. Methods Eng. 1988, 25, 387–399. [Google Scholar] [CrossRef]
- Sahay, S.S.; Krishnan, K.; Kuthle, M.; Chodha, A.; Bhattacharya, A.; Das, A.K. Model-Based Optimization of a Highly Automated Industrial Batch Annealing Operation. Ironmak. Steelmak. 2006, 33, 306–314. [Google Scholar] [CrossRef]
- Cengel, Y.A. Heat and Mass Transfer—A Practical Approach, 3rd ed.; Mc Graw Hill: New York, NY, USA, 2007. [Google Scholar]
- Kostowski, E. Heat Flow; Wydawnictwo Politechniki Śląskiej: Gliwice, Poland, 2000. (In Polish) [Google Scholar]
- Wyczółkowski, R. Computational model of complex heat flow in the area of steel rectangular section. Procedia Eng. 2016, 157, 185–192. [Google Scholar] [CrossRef][Green Version]
- Wyczółkowski, R. Analysis of the Rayleigh number in the area of steel rectangular sections in the conditions of steady and unsteady heat flow. Civ. Environ. Eng. Rep. 2014, 14, 107–118. [Google Scholar] [CrossRef]
- Wyczolkowski, R. Analysis of components effecting free convection intensity in steel rectangular sections. Arch. Thermodyn. 2015, 36, 105–121. [Google Scholar] [CrossRef][Green Version]
- Wyczolkowski, R.; Urbaniak, D. Modelling of radiation in bar bundles using the thermal resistance concept. J. Thermophys. Heat Transf. 2016, 30, 721–729. [Google Scholar] [CrossRef]
- Yovanovich, M.M.; Marotta, E.E. Chapter 4 Thermal spreading and contact resistances. In Heat Transfer Handbook; Bejan, A., Kraus, A.D., Eds.; John Wiley & Sons, Inc.: New York, NY, USA, 2003. [Google Scholar]
- Yovanovich, M.M. Four decades of research on thermal contact, gap, and joint resistances in microelectronics. IEEE Trans. Compon. Packag. Technol. 2005, 20, 182–206. [Google Scholar] [CrossRef]
- Sridhar, M.R.; Yovanovich, M.M. Review of elastic and plastic contact conductance models: Comparison with experiment. J. Thermophys. Heat Transf. 1994, 8, 633–640. [Google Scholar] [CrossRef]
- ASTM C1044-12. Standard Practice for Using a Guarded-Hot-Plate Apparatus or Thin-Heater Apparatus in the Single-Sided Mode; ASTM International: West Conshohocken, PA, USA, 2012. [Google Scholar]
- ASTM C177-13. Standard Test Method for Steady-State Heat Flux Measurements and Thermal Transmission Properties by Means of the Guarded-Hot-Plate Apparatus; ASTM International: West Conshohocken, PA, USA, 2013. [Google Scholar]
- Wyczolkowski, R.; Benduch, A. The possibilities of determining the effective thermal conductivity of steel rectangular section bundles based on the selected literature models. J. Phys. Sci. Appl. 2016, 6, 55–65. [Google Scholar] [CrossRef]
- Modest, F.M. Radiative HeatTtransfer, 3rd ed.; Academic Press: Amsterdam, The Netherlands, 2013. [Google Scholar]
- Wyczolkowski, R.; Benduch, A. The experimental study of the effective thermal conductivity of bundles of rectangular steel section. Civ. Environ. Eng. Rep. 2014, 14, 119–132. [Google Scholar] [CrossRef]
Publisher’s Note: MDPI stays neutral with regard to jurisdictional claims in published maps and institutional affiliations. |
© 2020 by the authors. Licensee MDPI, Basel, Switzerland. This article is an open access article distributed under the terms and conditions of the Creative Commons Attribution (CC BY) license (http://creativecommons.org/licenses/by/4.0/).