Article

Photo-Transformation of Effluent Organic Matter by ZnO-Based Sunlight Irradiation

Department of Civil and Environmental Engineering, Chung-Ang University, 84 Heukseok-ro, Dongjak-gu, Seoul 06974, Korea
*
Authors to whom correspondence should be addressed.
Appl. Sci. 2020, 10(24), 9002; https://doi.org/10.3390/app10249002
Submission received: 13 November 2020 / Revised: 6 December 2020 / Accepted: 14 December 2020 / Published: 16 December 2020

Abstract

:
This study investigated the impact of effluent organic matter (EfOM) from wastewater effluent on the properties of organic matter in receiving water and the efficiency of its removal using photocatalysis. The organic matter is characterized using fluorescence excitation-emission matrices coupled with parallel factor analysis (EEM-PARAFAC), UV-Vis spectroscopy, and dissolved organic carbon (DOC) measurements. The experiments are conducted with water samples that were collected from upstream waters (used as a source of dissolved organic matter (DOM)), wastewater effluent (a source of EfOM), and waters downstream of a wastewater treatment plant, and with upstream water and wastewater effluent being mixed at different ratios in the lab (DOM/EfOM). EEM-PARAFAC analysis identifies three components: a humic-like component (C1), a tyrosine-like component (C2), and a terrestrial-like humic component (C3). When compared to DOM, EfOM has a higher specific ultraviolet absorbance at 254 nm (SUVA254), a higher fluorescence index (FI), and more abundant humic-like components. As the EfOM contribution increased, an increase in both humic-like components and a simultaneous decrease in the protein-like components are observed. The photocatalytic degradation of the organic matter using simulated solar irradiation with ZnO as a catalyst is examined. The removal efficiency of photocatalysis is calculated using the DOC, UV absorbance at 254 nm (UV254), and the maximum fluorescence intensity (Fmax) of the PARAFAC components. After 120 min of irradiation, the removal efficiency of photocatalysis differs between the DOM, EfOM, and EfOM-impacted samples due to the change in the properties of the organic matter in the source water. The photocatalytic degradation of organic matter follows pseudo-first-order kinetics, with the DOC and UV254 exhibiting a lower removal efficiency with the increasing contribution of EfOM, which indicated that EfOM has a potentially negative impact on the performance of drinking water treatment. The removal of PARAFAC components follows the order C3 > C1 > C2, indicating that humic-like components are preferentially removed when compared to protein-like components under sunlight irradiation.

1. Introduction

In the face of continuing climate change, population growth, rapid urbanization, and water scarcity, wastewater reclamation and reuse have become important strategies in the conservation of water supplies. When treated wastewater is discharged into receiving waters, the indirect potable reuse of wastewater occurs, and it then serves as a source of drinking water. Treated wastewater adds a significant amount of effluent organic matter (EfOM) into the receiving waters. EfOM includes natural dissolved organic matter (DOM), soluble microbial products, synthetic organic compounds, endocrine-disrupting compounds, flame retardants, pesticides, artificial sweeteners, and disinfection by-products [1,2,3]. The characteristics and composition of EfOM are strongly dependent on the source of the wastewater and the operating conditions of the wastewater treatment facility. Compared to DOM, EfOM has a higher concentration of hydrophilic organic matter, a higher fluorescence index (FI), a higher proportion of protein-like substances, a greater organic nitrogen content, and a higher molecular weight [3,4,5]. The complex composition and chemical properties of EfOM negatively affect the quality of receiving waters and the efficiency of reclamation treatment processes [2,3,4]. Therefore, a better understanding of the characteristics of EfOM in receiving waters is important in evaluating and predicting the potential influences of EfOM on the sources of drinking water and in developing optimal and cost-effective treatment methods for drinking-water treatment plants. However, to the best of our knowledge, there have been few studies [3,6,7,8] focused on the characteristics, fate, transport, and impact of EfOM in receiving waters.
Recently, heterogeneous photocatalysis has become the most common and efficient method for the removal of organic matter from water and wastewater [9]. The method relies on the in-situ production of highly reactive oxygen species (ROS) (e.g., hydroxyl and superoxide radicals) that decompose organic pollutants into CO2, H2O, and other inorganic substances via the irradiation of a catalyst (e.g., TiO2, or ZnO) under a light source (e.g., ultraviolet (UV), sunlight, or artificial sunlight) [10,11,12]. Previous studies have introduced various photocatalytic approaches [9,11,12,13,14], including (i) UV photocatalysis (e.g., UV/TiO2, UV/ZnO), (ii) modified catalysts (e.g., Ag-doped TiO2, N-doped ZnO, N-doped TiO2/graphene/(near) visible light), and (iii) simulated solar photocatalysis with Fe-doped TiO2 or ZnO. In particular, solar photocatalysis using ZnO, a recyclable and chemically stable catalyst [10], has a high removal efficiency at a low operating cost [11]; thus, this process has been proposed as a cost-effective and sustainable technology for the degradation of organic matter in water and wastewater treatments. The mechanism of ZnO-assisted photodegradation of organic matter under artificial sunlight irradiation is based on the in-situ generation of ROS [10,11,12]. When ZnO absorbs photons from artificial sunlight, pairs of valence-band hole h vb + and conduction-band electron e cb are generated [11]. Subsequently, the valence band holes react with H2O and hydroxide ions in order to form hydroxyl radicals, while the conduction band electrons react with O2 to form superoxide radicals [10,11,12]. The hydroxyl and superoxide radicals can oxidize and decompose molecules of organic matter into CO2, H2O, and degradation products [9,11,12,13,14]. Consequently, the degradations of organic matter are based on three pathways, including oxidation by hydroxyl radicals, reduction by superoxide radicals, and adsorption by catalyst, although hydroxyl radicals are considered to be the dominant oxidant [9].
In this study, the photodegradation of the organic matter present in the receiving water within a ZnO-catalyzed artificial sunlight system is examined. Specifically, the objectives of the study are: (1) to examine the impacts of EfOM on the characteristics of organic matter present in the receiving water, (2) to evaluate the fate and transport of EfOM during the sunlight-induced photocatalytic process, and (3) to evaluate how EfOM influences the degradation of organic matter in the receiving water by photocatalysis using simulated wastewater-impacted surface water samples. The samples were collected from wastewater effluent and the waters upstream and downstream of a municipal wastewater treatment plant. The analysis of dissolved organic carbon (DOC), UV/Vis absorption, and fluorescence excitation-emission matrices coupled with parallel factor analysis (EEM-PARAFAC) is employed to trace the effects of treated wastewater effluent discharged into receiving waters and to evaluate the behavior of organic matter within a sunlight-induced photocatalysis system.

2. Materials and Methods

2.1. Water Sample Collection and Preparation

Wastewater effluent samples that were discharged from Seonam Water Reclamation Center, the largest municipal wastewater treatment plant (WWTP) in Seoul, South Korea, were collected as a source of EfOM. We also collected water samples upstream of the WWTP as a reference source for DOM and water samples downstream of the WWTP. The wastewater in the WWTP undergoes three processes before being discharged into the Han River, which is one of the major rivers in South Korea: (1) primary treatment (sedimentation, homogenization, and primary settling), (2) secondary treatment (conventional activated sludge, a Modified Ludzack–Ettinger process, and secondary settling), and (3) tertiary treatment (chlorine disinfection). The influent for the WWTP mainly consists of residential wastewater with substantial contributions from commercial businesses in the Seoul Metropolitan area. The collected samples were filtered using 0.45-μm cellulose acetate membrane filters (Whatman, Buckinghamshire, UK) in order to remove particles and bacteria. The filtered samples were then stored at 2–4 °C in the dark before the experiments.
The basic water properties (pH, conductivity, and total nitrogen) of the samples were measured without filtration (Table S1). Simulated wastewater-impacted surface water samples were prepared by mixing upstream DOM samples and wastewater EfOM samples at percentage volume ratios of 100/0, 75/25, 50/50, 25/75, and 0/100 in order to examine the effects of the wastewater effluent from the WWTP on the characteristics of organic matter in the receiving water.

2.2. Photocatalytic Degradation Experiments

Photocatalytic experiments were carried out using a solar simulator and a 100-mL Pyrex reactor with a double-layer jacket (Figure S1) [11]. A 300-W Xenon arc lamp (Ushio Inc., Tokyo, Japan) was installed in the solar simulator (SLB300B, Sciencetech Inc., London, Canada). The Xenon lamp emitted a visible light with a wavelength range of 350–2000 nm. The irradiation intensity on the surface of the solutions was 3.15 ± 0.05 mW/cm2, as measured using a radiation intensity meter (UV-340C, Custom, Tokyo, Japan). This intensity reading was equivalent to the natural solar irradiance that was measured on Chung-Ang University campus (Seoul, South Korea) at noon during November 2019. The distance between the light source and samples was maintained at ~5 cm. Zinc oxide (MF: ZnO, MW: 81.39 g/mol) that was purchased from Sigma-Aldrich (Saint Louis, MO, USA) was used as the photocatalyst. The photocatalyst dosage was set at 0.2 g/L. The initial pH of the solution was set at pH 7 by adjusting the solution with 1 M sulfuric acid (H2SO4) and 1 M sodium hydroxide (NaOH). The H2SO4 (purity ≥ 96%) was obtained from Kanto Chemicals (Tokyo, Japan), and the NaOH was obtained from Daejung Chemicals (Busan, South Korea). The samples (100 mL) were placed in the reactor and irradiated for 120 min at room temperature (23 ± 1 °C). The solution in the reactor was gently stirred with a magnetic bar for uniform mixing during the experiment. At regular time intervals (0, 30, 60, 90, and 120 min), the samples were removed and then immediately filtered through a 0.45-μm polytetrafluoroethylene (PTFE) syringe filter in order to separate the ZnO powder from the solution.

2.3. Analytical Methods

The DOC concentration was measured using a TOC-VCPH analyzer (Shimadzu, Kyoto, Japan). Potassium hydrogen phthalate with the concentration range of 1–20 mgC/L was used as a standard solution for DOC calibration. The samples for DOC analysis were filtered with a 0.45-μm filter, acidified to pH ≤ 2. UV/Vis absorption spectra were recorded at a wavelength range of 200–800 nm using a double-beam UV/Vis spectrophotometer (SPECORD 200 PLUS, Analytik Jena AG, Jena, Germany) with a 1-cm quartz cuvette. Several indicators extracted from the UV/Vis spectra were used to investigate the properties of the organic matter. UV absorbance at 254 nm (UV254) was used to assess the aromaticity and molecular weight of the organic matter [15], while the specific ultraviolet absorbance at 254 nm (SUVA254), which was calculated as the ratio of the normalized UV254 to the DOC concentration (UV254 × 100/DOC), was used to determine its hydrophobicity and hydrophilicity [16]. The absorption ratio at 250 and 365 nm (E2/E3) was used to indicate the molecular size of the organic matter [17]. Spectra slopes, including S275–295 and S350–400, were obtained from the linear regression of log-transformed absorption coefficients (computed using MATLAB 2018b, Mathworks, USA) from wavelengths of 275–295 nm and 350–400 nm, respectively. The spectra slope ratio (SR) was calculated from the ratio of S275–295 and S350–400. The spectra slopes and SR were used to assess the molecular weight and aromaticity of the organic matter [18]. The molar absorptivity at 280 nm ( ε 280 ), which was defined as the absorption per mole of organic carbon at 280 nm, was used to indicate the aromaticity and apparent molecular weight of the organic matter [19].
Fluorescence EEMs were recorded using a Cary Eclipse fluorescence spectrophotometer (Agilent Technologies Inc., Santa Clara, CA, USA) with a 1-cm quartz cuvette. All of the EEMs were obtained by scanning the emission spectra in the range of 250–600 nm at 1-nm intervals and the excitation spectra in the range of 230–550 nm at 1-nm intervals. The bandwidths were adjusted to 10 nm for both excitation and emission. The scanning speed was set at 9600 nm/min. We used a 290-nm cutoff for all samples to limit the influence of second-order Rayleigh scattering. To eliminate the inner-filter effect, the samples were diluted to a final DOC close to ~1 mgC/L before the measurement of the EEMs. To eliminate the effect of Raman scattering, the EEMs were blank-subtracted using the EEMs of a water blank (Milli-Q water) that was measured on the same day as the samples. The EEMs were calibrated to Raman units (RUs) by dividing the EEMs by the Raman peak area of 370–700 nm of Milli-Q water measured on the same day as the samples.
The FI, humidification index (HIX), and biological/autochthonous index (BIX), calculated using the corrected fluorescence data, were utilized to define and classify the characteristics of the organic matter. The FI was used to determine the relative contribution of allochthonous and autochthonous organic matter in aquatic ecosystems. The FI was calculated from the ratio of the fluorescence intensity at an emission wavelength of 450 nm with that at an emission wavelength of 550 nm at an excitation wavelength of 370 nm [20]. The HIX was used to indicate the degree of humidification of the organic matter and it was calculated as the ratio of two spectral regions at emission wavelengths of 435–480 nm and 300–345 nm at an excitation wavelength of 254 nm [21]. The BIX, which is also known as the β:α ratio, was used to estimate the degree of biological degradation of the organic matter. The BIX was calculated as the ratio of the fluorescence intensity at an emission wavelength of 380 nm (β peak) and the maximum intensity between emission wavelengths of 420 nm and 435 nm at an excitation wavelength of 310 nm (α peak) [22].
PARAFAC modeling was employed to identify individual components of the organic matter by extracting the information contained in the fluorescence EEMs. PARAFAC analysis was conducted using MATLAB 7.0 and the DOMFluor Toolbox (http://www.models.life.ku.dk) with two to seven components. The details of the modeling have been described in previous studies [23,24,25]. We used split-half analysis to validate the identified components and their numbers. The maximum fluorescence intensity (Fmax) of the individual components was used for describing their relative concentrations. EEM data from 197 samples were used for the PARAFAC model. Split-half validation explained variation (>99.9%), core consistency diagnostic (>85%), Tucker’s congruence coefficient, and spectral analysis of the excitation and emission loadings were used for determining and validating the model.

2.4. Statistical Analyses

All of the samples and experiments were conducted in at least triplicate. Significant differences in parameters were identified using the p-values computed in analysis of variance (ANOVA) tests. The relationships among the variables were evaluated using regression and Pearson correlation analyses. All of the statistical analyses were conducted using SPSS Version 26 (IBM Inc., New York, NY, USA).

3. Results and Discussion

3.1. DOC and Optical Parameters

3.1.1. Characterization of the DOM, EfOM, and EfOM-Impacted

Table 1 summarizes the DOC and optical parameters (i.e., absorbance and fluorescence) of the organic matter from different sources. Initially, all of the samples exhibited a low SUVA254 (1.124–1.234, less than 2), indicating that the samples mainly contained hydrophilic organic compounds and had a low molecular weight, a low charge density, and a higher non-humic than humic fraction [16,26,27,28]. Organic matter with a higher non-humic fraction has a potentially negative impact on drinking water treatment processes because the removal of non-humic compounds is more difficult [28]. Fluorescence EEM measurements displayed two dominant peak areas (Figure S2a): a humic-like organic matter peak (at Ex/Em = 330–350 nm/420–480 nm and Ex/Em = 250–260 nm/380–480 nm) and a protein-like organic matter peak (Ex/Em = 250–280 nm/280–350 nm) [25,29]. The protein-like peak in the wastewater effluent and wastewater-impacted samples may originate from soluble microbial products in biologically treated wastewater [3,25,26]. The protein-like organic matter peak detected in the drinking water DOM may originate from algal organic matter [2,3]. The samples also exhibited a low HIX (HIX = 1.01–1.45, less than 4), a high BIX (BIX = 0.96–1.04), and a low FI (FI = 1.26–1.66), which suggested that the organic matter in samples was associated with autochthonous organic matter [3,20,21].
A comparison between wastewater EfOM and upstream DOM samples showed that the EfOM samples had a higher SUVA254, ε 280 , and SR than the DOM samples did, while E2/E3 and S350–400 exhibited the opposite trend. These observations indicate that the aromatic content and average molecular weight of the EfOM samples were probably higher than those of the DOM samples [17]. The FI, HIX, and BIX for the EfOM samples were higher than those for the DOM samples, which indicated that the EfOM was derived from autochthonous and microbially derived sources [3,6,24]. In the comparison between the upstream and downstream samples, the changes in optical parameters (SUVA254, ε 280 , SR, FI, HIX, and BIX) were similar to those observed in the comparison between the EfOM and DOM samples, which indicated that these changes were the result of the contribution of EfOM. The discharge of wastewater effluent may affect wildlife (such as fish, birds, etc.), which uses the river water as a habitat or for drinking and it may contribute to algal blooms in the Han River due to the high nutrient levels from protein-like components.
To further investigate the impact of EfOM on the quality of the receiving water, changes in DOC and optical parameters in DOM/EfOM samples were examined. Most of the measured parameters were close to the theoretical mixing lines (R2 = 0.90–0.99), which suggested that the investigated indicators were primarily dependent on the physical mixing of the DOM and EfOM. The EfOM ratio had a positive linear relationship with DOC, UV254, SUVA254, FI, HIX, and BIX (Figure S2b), a positive nonlinear relationship with ε 280 , and a negative nonlinear relationship with E2/E3. The positive linear changes in the FI with an increasing EfOM contribution were attributed to a higher proportion of microbially derived organic matter from the biological treatment at the WWTP [6,7]. Unlike previous studies, the SUVA254 exhibited a linear increase as the EfOM contribution increased, which indicated that the EfOM consisted primarily of more UV-sensitive fractions, providing a high relative index of DOC humic content [3,6,7,30]. As the EfOM ratio increased, the EEM contours (Figure S2a) exhibited more humic-like and less protein-like organic matter peaks. The humic-like organic matter peak is significant in wastewater effluent and it is related to its ability to bind to toxic substances (e.g., heavy metals) [4].
The means of variables for the five different mixtures were compared using the one-way ANOVA in order to investigate the characteristic parameters that discriminate the water quality depending on the mixing ratios. The normality and equal variance were tested prior to one-way ANOVA. The means of most parameters except S350–400 and E2/E3 showed significantly different (p < 0.05), indicating that discharge of treated wastewater affects the characteristics of organic matters in receiving waters due to different properties of EfOM, as shown in Table 2.

3.1.2. Photocatalytic Degradation of DOM, EfOM, and EfOM-Impacted

The organic matter in the water samples was subjected to lab-scale photocatalysis experiments under simulated solar irradiation using ZnO as a photocatalyst. After 120 min of irradiation, photocatalysis led to a significant decrease in the fluorescence intensity and significant changes in the shape of the EEM contour plots (Figure 1). The broad, strong peaks at emission wavelengths above ~350 nm, commonly referred to as humic-like peaks, were significantly lower. The UV/Vis absorbance show that the wastewater contains a greater amount of organic substances absorbing UV-B and UV-C range than the upstream sample, and those substances rapidly decreased with reaction time; however, after 120 min of irradiation, absorption was still observed, which suggested that complete mineralization could not be achieved under these experimental conditions (Figure S3). During photocatalytic oxidation, a substantial decrease in SUVA254 was observed (Figure S4a), which could be explained by the preferential removal of aromatic chromophores over aliphatic moieties, followed by the transition of transforming the DOM into non- or less-UV-absorbing substances upon irradiation [11,12,13]. Photocatalysis also resulted in decreases in ε 280 (Figure S4b), S275–295, and S350–400, and an increase in SR and E2/E3 (Figure S4c), indicating a reduction in the aromaticity, molecular size, and molecular weight of the organic matter [17,31,32]. The FI, HIX, and BIX of all the samples decreased after photocatalysis (Figure S4d,e,f), demonstrating the reduction of aromatic structures in the organic matter following solar irradiation [31,32]. These observations are similar to the previously reported photocatalytic degradation of organic matter in aquatic environments [11,31,32].
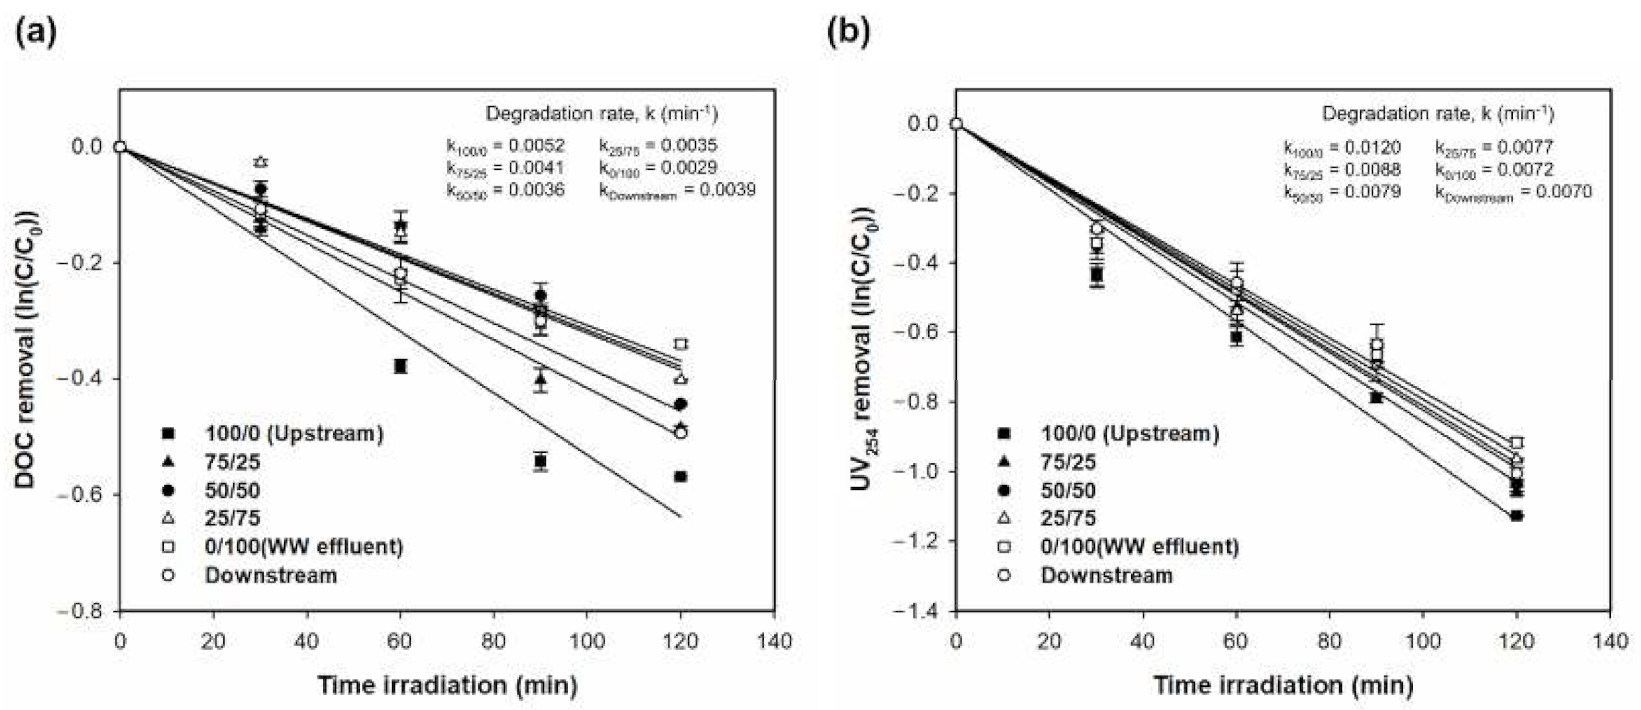
Figure 2 and Table 3 illustrate changes in the DOC and UV254 during photocatalysis. Solar irradiation led to a significant reduction in DOC and UV254, suggesting that the organic matter underwent both photomineralization and photobleaching [8,12,31]. All of the observed degradation trends followed pseudo-first-order kinetic models (R2 = 0.96–1.00), which has also been reported in previous studies on the photocatalytic degradation of organic matter [11,12,13,14]. The DOC removal ranged from 28.8 ± 0.8% to 43.4 ± 0.3%, with empirical degradation rates ranging from 0.0029 ± 0.0107 min−1 to 0.0052 ± 0.0054 min−1. When compared to the DOC, UV254 absorbance showed higher removal and degradation rates, ranging from 60.0 ± 0.8% to 67.6 ± 0.2% and from 0.0072 ± 0.0206 min−1 to 0.0102 ± 0.0532 min−1, respectively. This observation could be explained by the terminal functional groups (e.g., hydroxyl and carboxyl groups) of the aromatic compounds strengthened the adoption affinity of the catalyst surfaces and/or some of the aromatic chromophores were partially transformed into non- or less-UV-absorbing substances in the photochemical reaction [11,12,13].
The removal efficiency (DOC and UV254) of the upstream, wastewater effluent, and downstream samples followed the order of upstream > downstream > wastewater effluent. In particular, the DOC removal from the downstream sample was 4.4% lower than that from the upstream sample and it was 10.2% higher than that from the wastewater effluent sample. Similarly, the UV254 removal from the downstream sample was 4.2% lower than that from the upstream sample and it was 3.4% higher than that from the wastewater effluent sample. These results reflect the impact of EfOM on the degradation efficiency of the organic matter present in receiving waters.
The impact of EfOM on the degradation of the organic matter present in receiving waters was examined with various DOM/EfOM mixtures. The changes in optical parameters were more pronounced for DOM than for EfOM (Figure S3). The DOC and UV254 removal decreased as the EfOM ratio increased in the DOM/EfOM mixtures (Figure 1 and Figure 2). These observations reflect the contribution of more hydrophilic, higher molecular weight, and more non-humic organic compounds from the EfOM (i.e., wastewater effluent) into receiving waters. The DOC removal of EfOM reached 28.8±0.8% after 120 min of irradiation. The incomplete mineralization of EfOM represented the refractory properties of the EfOM and its products [12,13], while the catalyst dosage and reaction time may have been insufficient. These results show that the presence of EfOM in drinking water sources may have a negative impact on the performance of drinking water treatment, due to differences in the properties of EfOM and DOM, especially in terms of DOC and UV254 removal. Previous studies have also reported the negative impact of EfOM on drinking water treatment and the photochemical production of reactive intermediates in river water [2,3,6,7]. Additionally, the loss of DOC under solar irradiation in the upstream samples suggested that organic matter in the receiving water was photo-mineralized into CO2, which indicated that the photoreactivity of the organic matter might impact local carbon cycles [33].

3.2. EEM-PARAFAC Components

3.2.1. Spectral Characteristics of PARAFAC Components

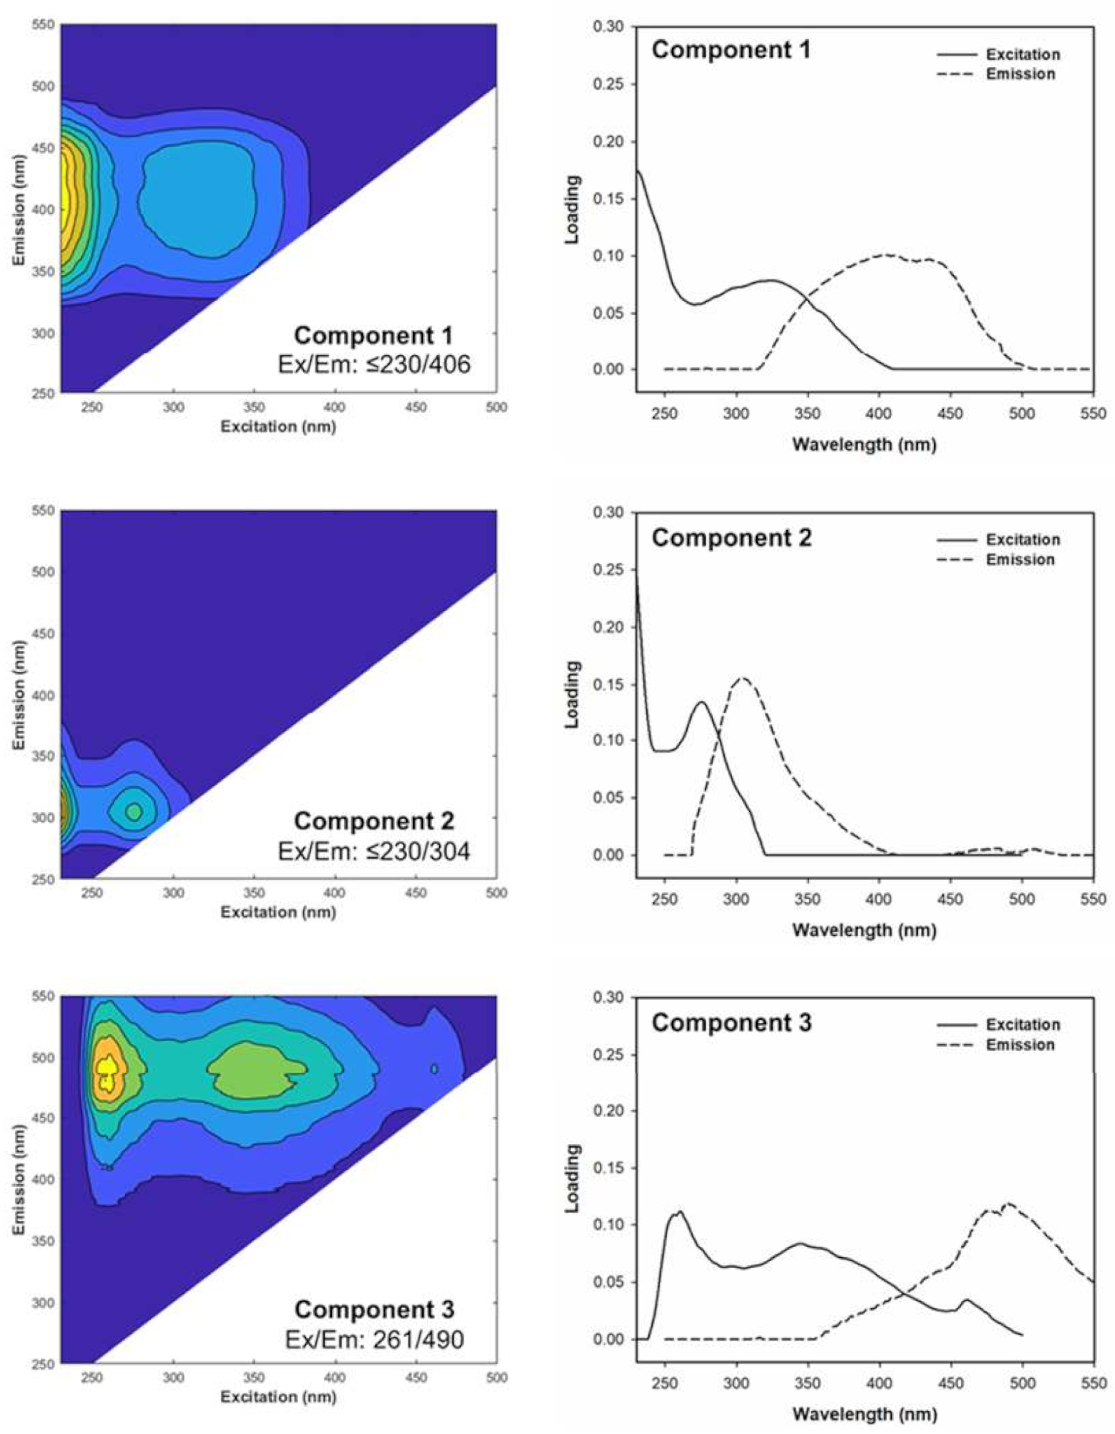
Using PAFAFAC modeling based on 197 EEM samples, three components (C1, C2, and C3) were identified (Figure 3). The spectral characteristics of these three components were similar to those of organic matter that was previously identified in other aquatic environments and the OpenFluor database (Table S2). C1 (Ex/Em maxima at ≤230(325)/406 nm) has been categorized as microbial humic-like [25], humic-like (peaks A + M) [26], an intermediate that forms as a result of the photochemical degradation of terrestrial DOM [34], and a phytoplankton-degradation humic component that arises from microbial activity [35]. The C1 detected in the river samples may be either terrestrially derived or autochthonously produced in aqueous environments from terrestrial organic substrates [8,25,26]. C2 (Ex/Em maxima at ≤230(276)/304 nm) was assigned to autochthonous tyrosine-like fluorescence peak B [8,25,26,36]. The C2 in the wastewater effluent samples could be formed during the biological wastewater treatment process [8,26], while the C2 in the upstream and downstream samples may be anthropogenically derived organics in wastewater-impacted waters, plankton-derived organics in fresh water, or algal organic matter in the river water [26,36]. C3 (Ex/Em maxima at 261/490 nm) resembled a combination of traditionally defined peak A and peak C, and it has been ascribed to terrestrial-like humic substances [13,14,24,25]. Prior studies have demonstrated that C3 may be either terrestrially derived or possibly produced autochthonously in aquatic environments that were largely affected by terrestrial input [13,24,25]. C1 and C3 were both associated with the presence of humic-like substances; however, C1 had a peak at a shorter emission wavelength than C3, suggesting that C3 appeared to have a larger molecular size and was more hydrophobic than the C1 [11,12,13]. Thus, the three components were identified as a humic-like component (C1), a tyrosine-like component (C2), and a terrestrial-like humic component (C3).
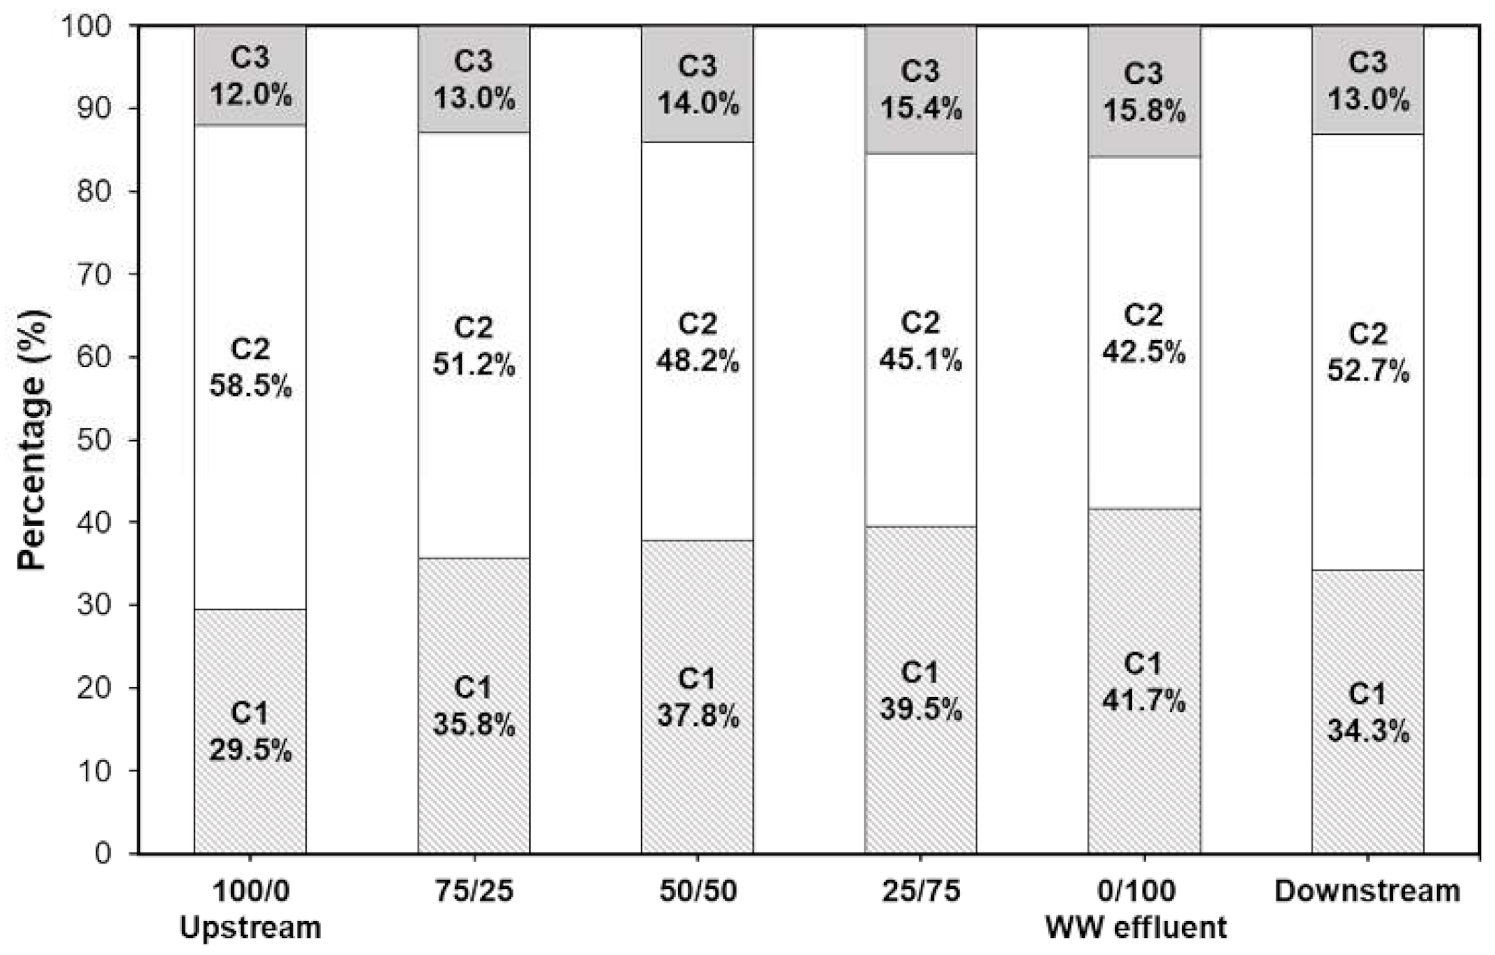
Figure 4 shows the relative distributions of the three PARAFAC components (i.e., %C1, %C2, and %C3) that were calculated using Fmax. C1 and C2 accounted for over 84% of the total PARAFAC components, which indicated that the majority of the fluorophores in the organic matter in the present study could be described by a combination of the humic-like (C1) and the tyrosine-like (C2) components. Furthermore, the contributions of the PARAFAC components from different sources of organic matter in the receiving water differed. Specifically, the contributions of C1 and C3 followed the order of wastewater effluent > downstream > upstream, whereas the contribution of C2 followed the order of upstream > downstream > wastewater effluent. This reveals an increase in both humic-like components (C1 and C3) from the upstream to the downstream samples with a simultaneous decrease in the protein-like component (C2), reflecting the impact of EfOM on the PARAFAC components of organic matter in the receiving water.
To understand the impact of EfOM on the receiving water from the perspective of organic matter characteristics, changes in the contribution of the three PARAFAC components in the DOM/EfOM mixtures were investigated. As the EfOM ratio increased, %C1 and %C3 increased linearly (R2 = 0.91–0.99), while %C2 decreased linearly (R2 = 0.95) (Figure 4 and Figure S5). The ratio of the humic-like/protein-like components, i.e., C1/C2, C3/C2, and (C1 + C3)/C2, also increased linearly with a greater EfOM ratio (R2 = 0.97–1.00). The relative shares of components with respect to the increased wastewater impact show that the treated wastewater sample of this study contains a large fraction of microbial humic-like substance (i.e., C1), which is thought to be present in the influent of the treatment plant, and remained after being partially transformed through the processes.

3.2.2. Changes in PARAFAC Components during Photocatalysis

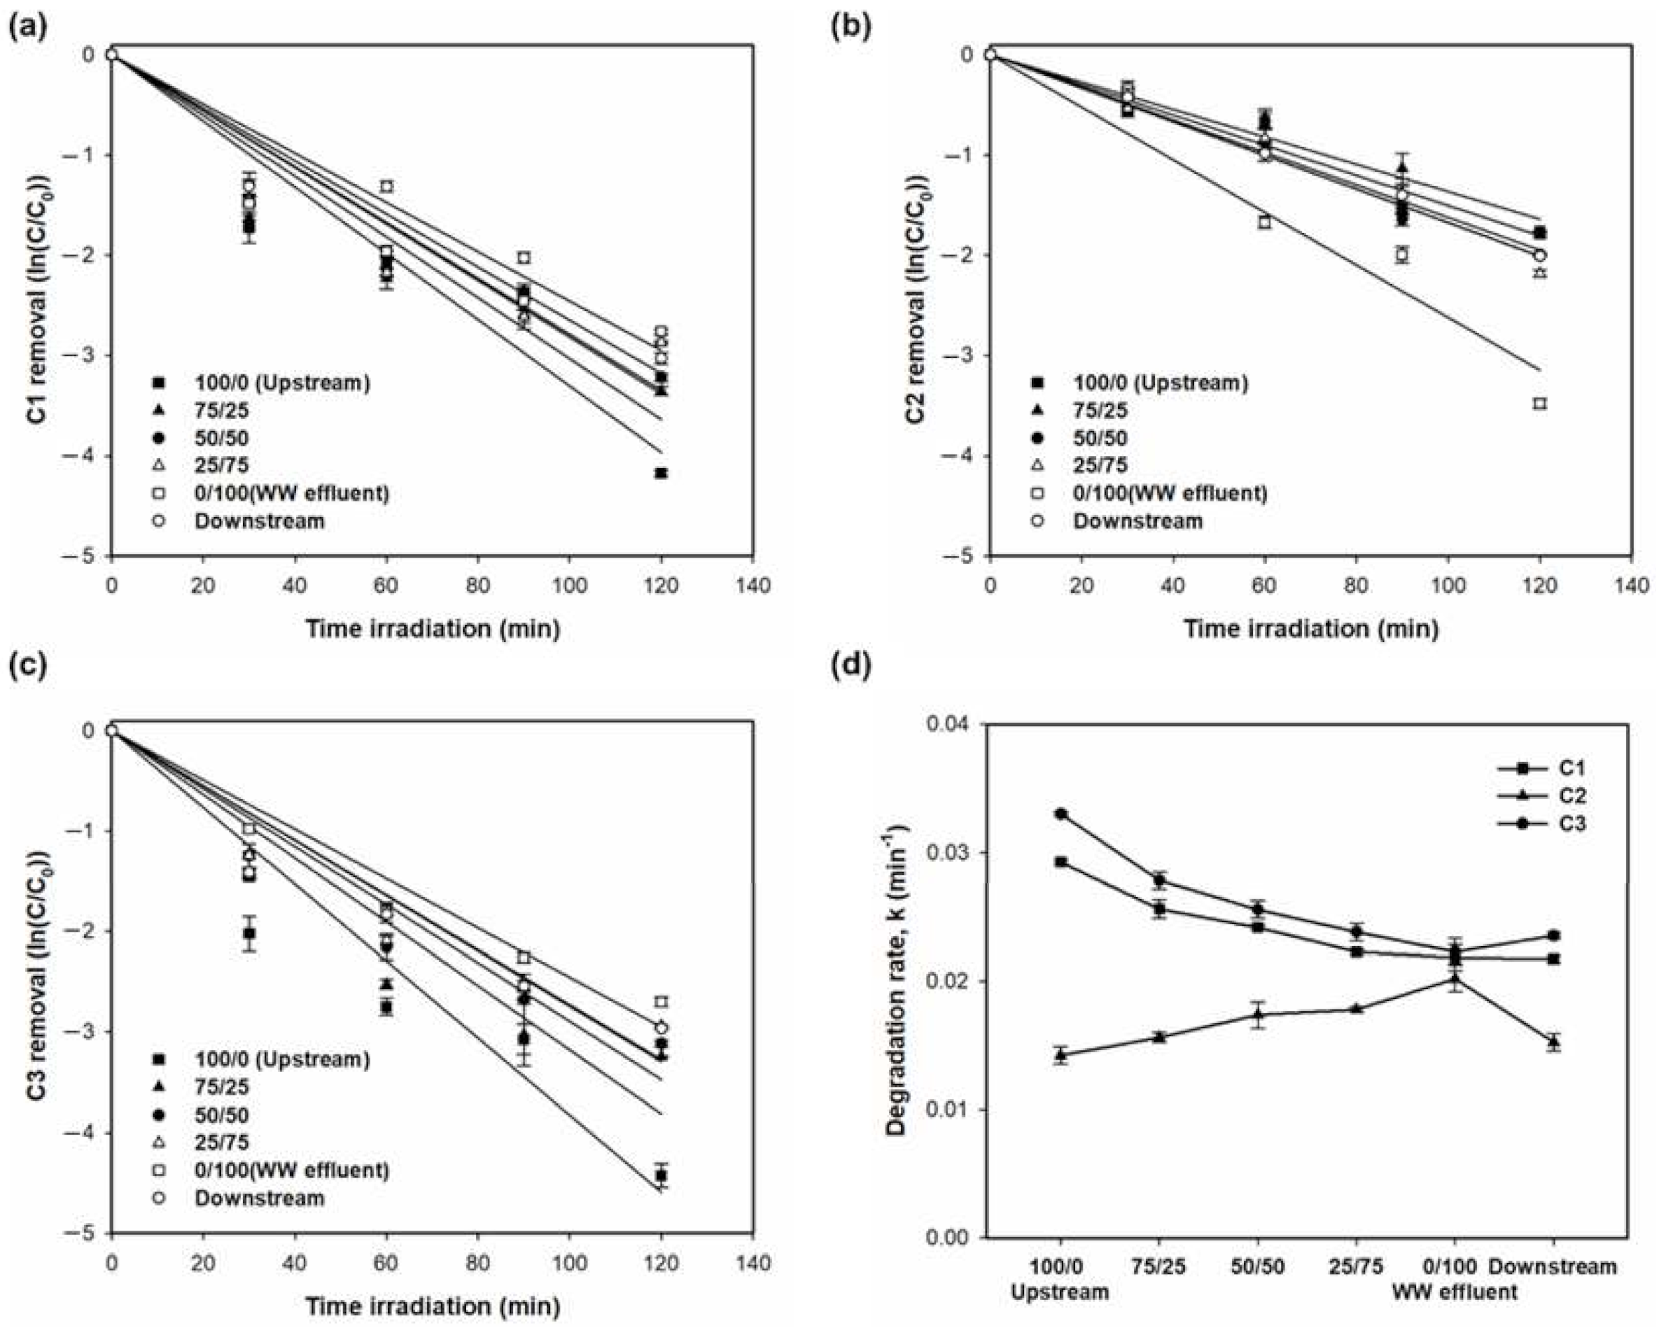
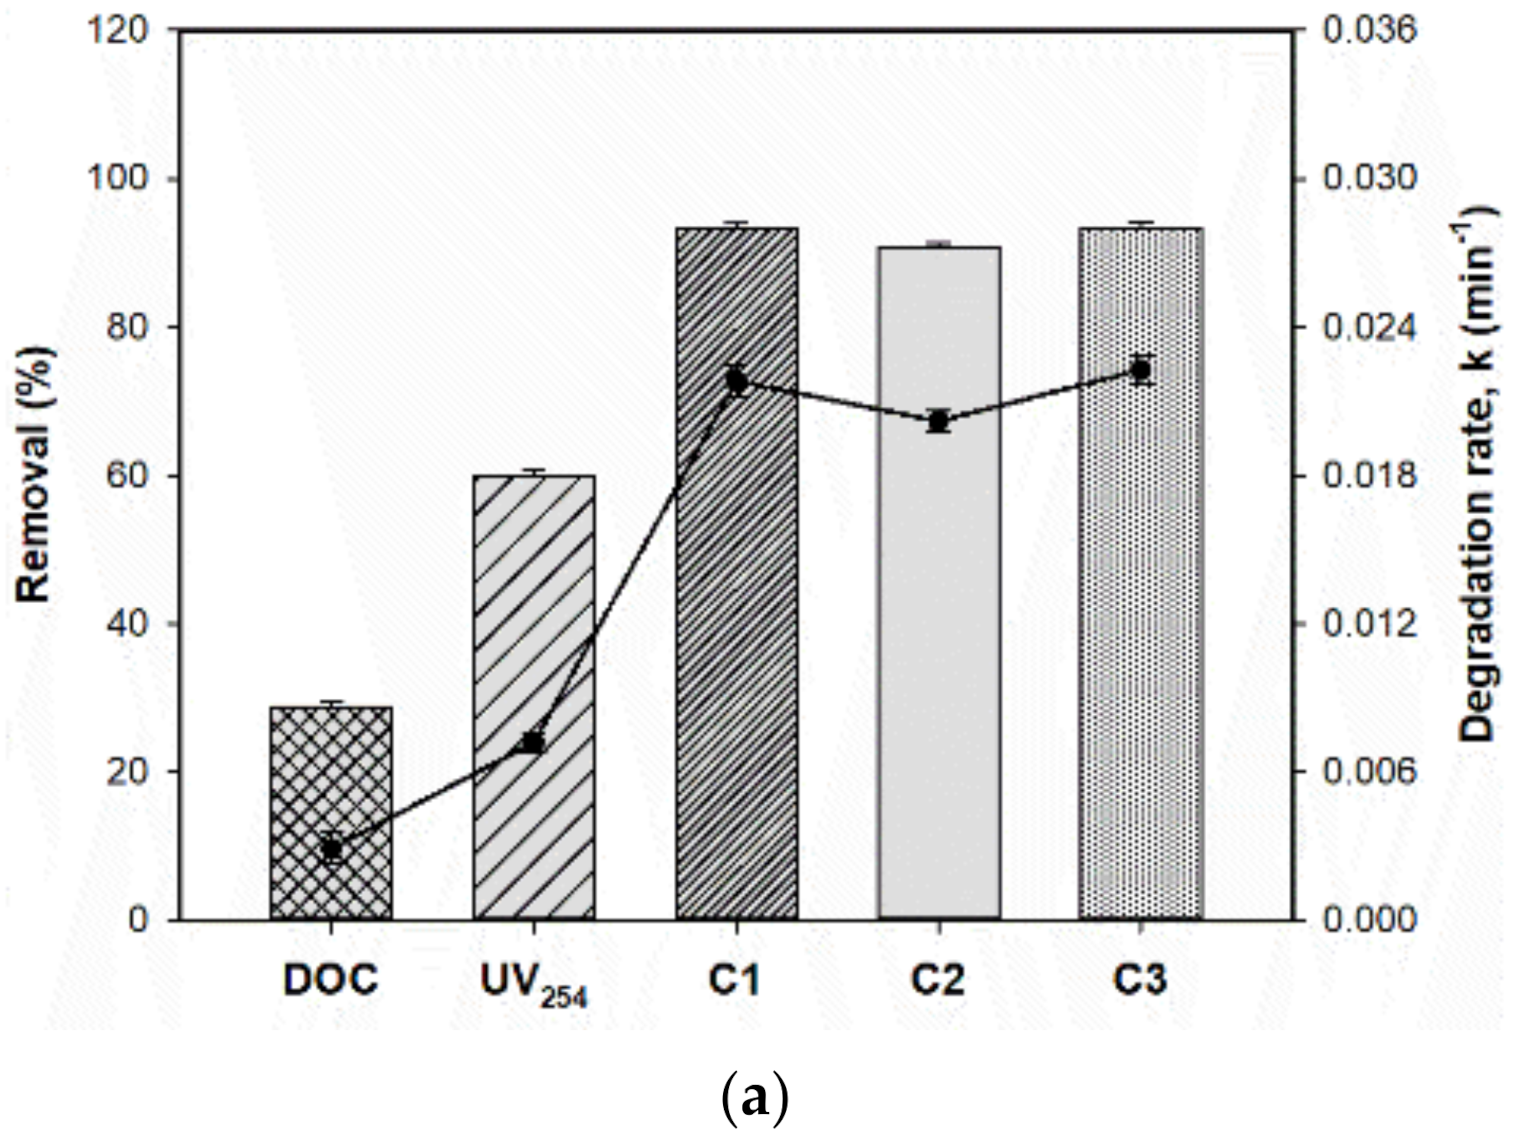
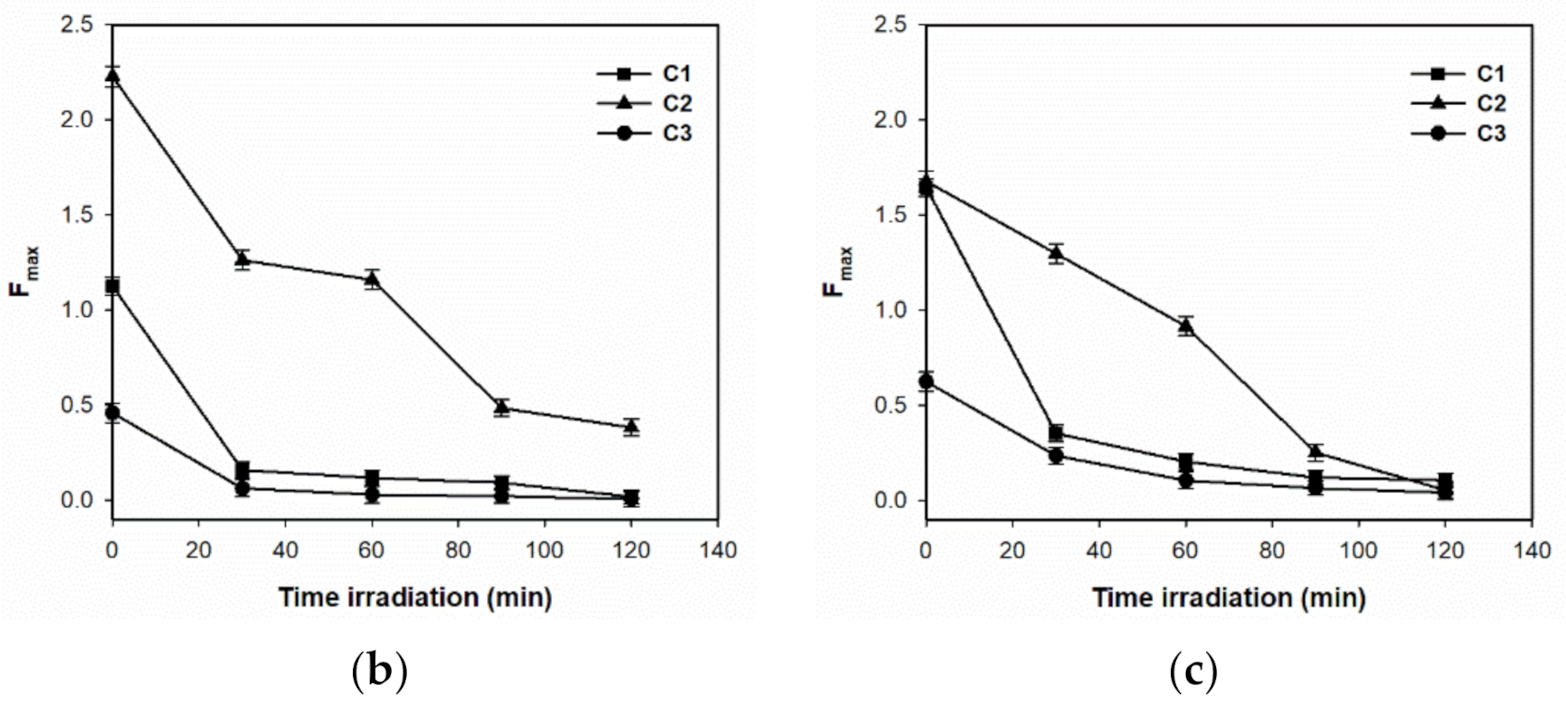
Table 3 and Figure 5 provide the removal of the three PARAFAC components based on Fmax measurements (%). The apparent photodegradation rates (kapp) of the three PARAFAC components fit a pseudo-first-order model (R2 = 0.91–1.00), suggesting that their photocatalytic degradation and kinetic rates could be directly compared. After 120 min of irradiation, a significant proportion of the three components had been removed, ranging from 82.8% to 98.7%, which indicated that all of the identified fluorophore groups were subject to direct photochemical degradation. Consequently, the degradation of the fluorescing components was higher than the removal of DOC and UV254. Apparently, a lower degradation of DOC than UV254 and PAFAFAC components may be due to the transformation of light-sensitive moieties in organics to non-light absorbing ones, and yet it could not be judged which PARAFAC components would be mostly transformed to the DOC-causing with non-light response (Figure 6a). However, assuming from the fact that C1 and C2 (the highest in both the upstream and effluent samples) exhibited a significant reduction in Fmax (Figure 6b,c), these two components are presumable contributors to residual DOCs. This also tells us that DOC measurement should be accompanied for addressing the mineralization of organic matter, because there are certain portions of the aliphatic or polysaccharides that are not responsive to the fluorescence spectroscopy. Thus, for a further understanding on fate and transport of EfOM by photocatalysis, it would be necessary to analyze the DOM using additional techniques, such as size exclusion chromatography with organic carbon and fluorescence detection simultaneously.
The faster degradation of the fluorescence components as compared to UV-absorbing moieties was possibly due to the fluorescence that arises from the π–π* transitions in organic matter molecules and its rapid extinction under sunlight irradiation [8,11,12,13]. The Fmax removal and kapp of the three PARAFAC components followed the order C3 > C1 > C2, indicating that the humic-like components were preferentially removed under sunlight irradiation. Our results were consistent with prior photobleaching studies using aquatic DOM samples [11,12,13], in which protein-like fluorescence peaks were more resistant to photodegradation than other peaks (e.g., peaks A, M, and C) and the humic-like fluorescence peaks (i.e., C3 in the present study), with the excitation wavelength falling within the UVA band (i.e., 315–400 nm). Thus, the humic-like and the tyrosine-like components can be associated with photolabile organic matter and residual products, respectively. The removal and degradation rate of C3 was higher than that of C1, which can be explained by the preferable adsorption of organic molecules that are larger, that are more hydrophobic, or that have a higher degree of aromatic condensation compared to minerals and/or nanoparticles [11,12,13]. With peaks at longer wavelengths, C1 might be related to the structural condensation and polymerization of organic matter [13]. Indeed, more pronounced fluorescence at longer emission wavelengths in the EEMs of larger and/or more hydrophobic organic matter fractions has been previously reported [5,13,36]. Therefore, the observed changes in the optical proxies reflected the preferential removal of aromatic structures and relatively bio-refractory fractions from the organic matter samples, while the labile fraction tended to be resistant to photodegradation, which was due to the lack of absorption [11,12,13].
Compared to the wastewater effluent and downstream samples, the upstream samples had higher C1 and C3 removal, but lower C2 removal. For example, the removal of C1 and C3 from the upstream samples was 3.8% and 3.9% higher, respectively, than that from the downstream samples. In comparison, the removal of C2 from the upstream samples was 3.6% lower than that from the downstream samples. Similarly, the removal of C1 and C3 from the upstream samples was 5.1% and 5.3% higher, respectively, than that from the wastewater effluent samples. The removal of C2 from the upstream samples was 7.9% lower than that from the wastewater effluent samples. Sunlight-driven photocatalytic changes in the PARAFAC components within the DOM/EfOM mixtures were also examined, and it was found that the removal and kapp of C1 and C3 decreased, whereas that of C2 increased with an increasing EfOM ratio. Therefore, the presence of EfOM in the receiving water impacted the contribution and degradation of the components during the sunlight-induced photocatalytic process.

3.3. Estimating the Impact of EfOM on Receiving Waters

The three PARAFAC components had a strong correlation with the EfOM contributions to the receiving water (Table S3), which suggested that these components could be used as indicators for the assessment of the impact of wastewater. Discharge from the WWTP accounts for a large proportion of the river flow for most of the year, meaning that the impact of the wastewater on the river can be evaluated based on the river and wastewater flow data. In the present study, we estimated the impact of the wastewater (i.e., % wastewater contribution) at the downstream sampling point in the Han River using the PARAFAC components and the flow rates. Flow data were recorded for three months (from 1 May to 30 August 2019) at both upstream and downstream points obtained from the Han River Flood Control Office (Table S4). The daily discharge volume from the WWTP into the Han River was available from the Seoul Metropolitan Government (Table S5). Using the PARAFAC component-based method, the EfOM levels were measured as the total mass of organic carbon (kg) discharged from the WWTP, which could be calculated using DOC and flow data from the WWTP. The total mass of organic carbon at the downstream site was assessed in terms of the %EfOM, which was calculated using Equation (1). Using the flow-based method, the percentage wastewater impact at the downstream site was calculated using Equation (2).
% E f O M =   mass   of   organic   carbon   from   WWTP   effluent   to   the   downstream   site   kg mass   of   organic   carbon   present   at   the   downstream   site   kg × 100
% WW flow =   flow   of   WWTP   effluent   to   the   downstream   site   m 3 river   flow   at   the   downstream   site   m 3 × 100
Based on the flow data at the downstream site, %EfOM and %WWflow were determined to be 3.8 ± 1.7% and 3.7 ± 1.6%, respectively. This indicates that combining the PARAFAC components with the flow data can be successfully used to assess the impact of wastewater on receiving waters.

4. Conclusions

This study investigated the impact of EfOM on receiving waters in terms of the properties of the organic matter and its removal efficiency by sunlight-driven photocatalysis. The experiments were conducted with water samples that were collected upstream and downstream of a WWTP and from wastewater effluent, while mixtures of upstream and wastewater effluent samples were mixed at different ratios in the lab. EEM-PARAFAC analysis decomposed the fluorescent organic matter into three components: a humic-like component (C1), a tyrosine-like component (C2), and a terrestrial-like humic component (C3). The DOC, UV254, and Fmax of the PARAFAC components were used to calculate the removal efficiency via photocatalysis. The results showed that the EfOM had a higher SUVA254, a higher FI, and more abundant humic-like components than did the DOM. The analysis of the relative distribution of the PARAFAC components revealed an increase in both humic-like components and a simultaneous decrease in the protein-like component as the contribution of EfOM increased. The photocatalytic removal efficiency differed between the DOM, EfOM, and EfOM-impacted samples due to the change in the properties of the organic matter in the source waters. The photocatalytic degradation of organic matter followed pseudo-first-order kinetics and the order of C3 > C1 > C2, which indicated that the humic-like components were preferentially removed as compared to the protein-like component under sunlight irradiation. The DOC and UV254 removal efficiency decreased as the contribution of EfOM increased, suggesting that EfOM has potentially negative impacts on the efficiency of drinking water treatment. Additionally, a method based on the PARAFAC components incorporated with the flow data was established to compute the contribution of wastewater effluent in the receiving water. Applying this method at the point where we collected the downstream samples, the wastewater effluent contribution was determined to be 3.8 ± 1.7% and 3.7 ± 1.6%, respectively, in terms of %EfOM and %WWflow. This suggested that combining the PARAFAC components with the flow data can be successfully used to assess the impact of wastewater on receiving waters.

Supplementary Materials

The following are available online at https://www.mdpi.com/2076-3417/10/24/9002/s1, Figure S1: Experimental setup for the sunlight-induced photocatalytic degradation of organic matter present in receiving waters using ZnO as a photocatalyst, Figure S2: The UV/Vis absorption and EEM fluorescence spectrum for upstream, wastewater effluent, and downstream samples: (a) Fluorescence EEM spectra and (b) Changes in UV/Vis absorption spectra, DOC, UV254, SUVA254, FI, HIX, and BIX during the mixing between upstream and wastewater effluent (WW effluent), Figure S3: Changes of UV/Vis spectra during the photocatalytic degradation of organic matter with 0.2 g/L of ZnO dosage at pH 7: (a) DOM (upstream sample), and (b) EfOM (wastewater effluent), Figure S4: Changes of the optical parameters for upstream, wastewater effluent, and downstream samples by photocatalysis with 0.2 g/L of ZnO at pH 7: (a) SUVA254, (b) ε 280 , (c) E2/E3, (d) FI, (e) HIX, and (f) BIX, Figure S5: Changes in the relative distribution of PARAFAC components during the mixing between upstream and wastewater effluent: (a) percentage contribution (%) and (b) PARAFAC component ratios, Table S1: Basic water properties of upstream, wastewater effluent, and downstream samples, Table S2: Spectral characteristics of the three PARAFAC components identified by EEM-PARAFAC in this study and the comparison with those previously identified. The maxima wavelengths are presented in excitation/emission wavelengths, Table S3: Pearson’s correlation coefficients between selected parameters for upstream, wastewater effluent, and downstream samples, Table S4: Flow data at the points where we collected the upstream and downstream samples for three months in 2019. Unit: m3/s (Source: Han River Flood Control Office), Table S5: Discharge volume from the wastewater treatment plant into the Han river in 2019 (Source: Seoul Metropolitan Government).

Author Contributions

Investigation, formal analysis, data curation, and writing—original draft preparation, T.T.N.; conceptualization, methodology, validation, writing—review and editing, and supervision, S.N.N.; supervision and funding acquisition, J.O. All authors have read and agreed to the published version of the manuscript.

Funding

This research received no external funding.

Acknowledgments

This research was supported by the Korea Environment Industry and Technology Institute (KEITI) through Public Technology Program based on Environmental Policy (Project No.: 2018000700005) funded by Korea Ministry of Environment (MOE). This research was also supported by the Chung-Ang University Young Scientist Scholarship (CAYSS) in 2017.

Conflicts of Interest

The authors declare no conflict of interest.

References

  1. Shon, H.K.; Vigneswaran, S.; Snyder, S.A. Effluent organic matter (EfOM) in wastewater: Constituents, effects, and treatment. Crit. Rev. Environ. Sci. Technol. 2006, 36, 327–374. [Google Scholar] [CrossRef]
  2. Michael-Kordatou, I.; Michael, C.; Duan, X.; He, X.; Dionysiou, D.D.; Mills, M.A.; Fatta-Kassinos, D. Dissolved effluent organic matter: Characteristics and potential implications in wastewater treatment and reuse applications. Water Res. 2015, 77, 213–248. [Google Scholar] [CrossRef]
  3. Nam, S.-N.; Amy, G.L. Differentiation of wastewater effluent organic matter (EfOM) from natural organic matter (NOM) using multiple analytical techniques. Water Sci. Technol. 2008, 57, 1009–1015. [Google Scholar] [CrossRef]
  4. Vakondios, N.; Koukouraki, E.E.; Diamadopoulos, E. Effluent organic matter (EfOM) characterization by simultaneous measurement of proteins and humic matter. Water Res. 2014, 63, 62–70. [Google Scholar] [CrossRef] [PubMed]
  5. Coble, P.G.; Lead, J.; Baker, A.; Reynolds, D.M.; Spencer, R.G. Aquatic Organic Matter Fluorescence, 1st ed.; Cambridge University Press: Cambridge, UK, 2014. [Google Scholar] [CrossRef]
  6. Nam, S.-N.; Krasner, S.W.; Amy, G.L. Differentiating Effluent Organic Matter (EfOM) from Natural Organic Matter (NOM): Impact of EfOM on Drinking Water Sources. In Advanced Environmental Monitoring; Springer: Dordrecht, The Netherland, 2008; pp. 259–270. [Google Scholar] [CrossRef]
  7. Bodhipaksha, L.C.; Sharpless, C.M.; Chin, Y.P.; Sander, M.; Langston, W.K.; Mackay, A.A. Triplet Photochemistry of Effluent and Natural Organic Matter in Whole Water and Isolates from Effluent-Receiving Rivers. Environ. Sci. Technol. 2015, 49, 3453–3463. [Google Scholar] [CrossRef] [PubMed]
  8. Yang, X.; Meng, F.; Huang, G.; Sun, L.; Lin, Z. Sunlight-induced changes in chromophores and fluorophores of wastewater-derived organic matter in receiving waters—The role of salinity. Water Res. 2014, 62, 281–292. [Google Scholar] [CrossRef] [PubMed]
  9. Sillanpää, M.; Ncibi, M.C.; Matilainen, A. Advanced oxidation processes for the removal of natural organic matter from drinking water sources: A comprehensive review. J. Environ. Manage. 2018, 208, 56–76. [Google Scholar] [CrossRef] [PubMed]
  10. Ong, C.B.; Ng, L.Y.; Mohammad, A.W. A review of ZnO nanoparticles as solar photocatalysts: Synthesis, mechanisms, and applications. Renew. Sustain. Energy Rev. 2018, 81, 536–551. [Google Scholar] [CrossRef]
  11. Nguyen, T.T.; Nam, S.-N.; Kim, J.; Oh, J. Photocatalytic degradation of dissolved organic matter under ZnO-catalyzed artificial sunlight irradiation system. Sci. Rep. 2020, 10, 1–12. [Google Scholar] [CrossRef]
  12. Phong, D.D.; Hur, J. Non-catalytic and catalytic degradation of effluent dissolved organic matter under UVA-and UVC-irradiation tracked by advanced spectroscopic tools. Water Res. 2016, 105, 199–208. [Google Scholar] [CrossRef]
  13. Phong, D.D.; Hur, J. Insight into photocatalytic degradation of dissolved organic matter in UVA/TiO2 systems revealed by fluorescence EEM-PARAFAC. Water Res. 2015, 87, 119–126. [Google Scholar] [CrossRef] [PubMed]
  14. Ahn, Y.; Lee, D.; Kwon, M.; Choi, I.-H.; Nam, S.-N.; Kang, J.W. Characteristics and fate of natural organic matter during UV oxidation processes. Chemosphere 2017, 184, 960–968. [Google Scholar] [CrossRef] [PubMed]
  15. Korshin, G.; Chow, C.W.K.; Fabris, R.; Drikas, M. Absorbance spectroscopy-based examination of effects of coagulation on the reactivity of fractions of natural organic matter with varying apparent molecular weights. Water Res. 2009, 43, 1541–1548. [Google Scholar] [CrossRef] [PubMed]
  16. Weishaar, J.L.; Aiken, G.R.; Bergamaschi, B.A.; Fram, M.S.; Fujii, R.; Mopper, K. Evaluation of specific ultraviolet absorbance as an indicator of the chemical composition and reactivity of dissolved organic carbon. Environ. Sci. Technol. 2003, 37, 4702–4708. [Google Scholar] [CrossRef]
  17. Li, P.; Hur, J. Utilization of UV-Vis spectroscopy and related data analyses for dissolved organic matter (DOM) studies: A review. Crit. Rev. Environ. Sci. Technol. 2017, 47, 131–154. [Google Scholar] [CrossRef]
  18. John, R.H.; Stubbins, A.; Ritchie, J.D.; Minor, E.C.; Kieber, D.J.; Mopper, K. Absorption spectral slopes and slope ratios as indicators of molecular weight, source, and photobleaching of chromophoric dissolved organic matter. Limnol. Oceanogr. 2009, 54, 1023. [Google Scholar] [CrossRef] [Green Version]
  19. Leenheer, J.A.; Croué, J.-P. Characterizing aquatic dissolved organic matter. Environ. Sci. Technol. 2003, 37, 18A–26A. [Google Scholar] [CrossRef] [Green Version]
  20. McKnight, D.M.; Boyer, E.W.; Westerhoff, P.K.; Doran, P.T.; Kulbe, T.; Andersen, D.T. Spectrofluorometric characterization of dissolved organic matter for indication of precursor organic material and aromaticity. Limnol. Oceanogr. 2001, 46, 38–48. [Google Scholar] [CrossRef]
  21. Ohno, T. Fluorescence Inner-Filtering Correction for Determining the Humification Index of Dissolved Organic Matter. Environ. Sci. Technol. 2002, 36, 742–746. [Google Scholar] [CrossRef]
  22. Huguet, A.; Vacher, L.; Relexans, S.; Saubusse, S.; Froidefond, J.M.; Parlanti, E. Properties of fluorescent dissolved organic matter in the Gironde Estuary. Org. Geochem. 2009, 40, 706–719. [Google Scholar] [CrossRef]
  23. Stedmon, C.A.; Bro, R. Characterizing dissolved organic matter fluorescence with parallel factor analysis: A tutorial. Limnol. Oceanogr. Methods 2008, 6, 572–579. [Google Scholar] [CrossRef]
  24. Murphy, K.R.; Stedmon, C.A.; Waite, T.D.; Ruiz, G.M. Distinguishing between terrestrial and autochthonous organic matter sources in marine environments using fluorescence spectroscopy. Mar. Chem. 2008, 108, 40–58. [Google Scholar] [CrossRef]
  25. Murphy, K.R.; Hambly, A.; Singh, S.; Henderson, R.K.; Baker, A.; Stuetz, R.; Khan, S.J. Organic Matter Fluorescence in Municipal Water Recycling Schemes: Toward a Unified PARAFAC Model. Environ. Sci. Technol. 2011, 45, 2909–2916. [Google Scholar] [CrossRef] [PubMed]
  26. Baghoth, S.A.; Sharma, S.K.; Amy, G.L. Tracking natural organic matter (NOM) in a drinking water treatment plant using fluorescence excitation-emission matrices and PARAFAC. Water Res. 2011, 45, 797–809. [Google Scholar] [CrossRef] [PubMed]
  27. Sharp, E.L.; Parsons, S.A.; Jefferson, B. Seasonal variations in natural organic matter and its impact on coagulation in water treatment. Sci. Total Environ. 2006, 363, 183–194. [Google Scholar] [CrossRef]
  28. Bose, P.; Reckhow, D.A. The effect of ozonation on natural organic matter removal by alum coagulation. Water Res. 2007, 41, 1516–1524. [Google Scholar] [CrossRef]
  29. Henderson, R.K.; Baker, A.; Murphy, K.R.; Hambly, A.; Stuetz, R.M.; Khan, S.J. Fluorescence as a potential monitoring tool for recycled water systems: A review. Water Res. 2009, 43, 863–881. [Google Scholar] [CrossRef]
  30. Musikavong, C.; Wattanachira, S. Reduction of dissolved organic matter in terms of DOC, UV−254, SUVA and THMFP in industrial estate wastewater treated by stabilization ponds. Environ. Monit. Assess. 2007, 134, 489–497. [Google Scholar] [CrossRef]
  31. Hansen, A.M.; Kraus, T.E.C.; Pellerin, B.A.; Fleck, J.A.; Downing, B.D.; Bergamaschi, B.A. Optical properties of dissolved organic matter (DOM): Effects of biological and photolytic degradation. Limnol. Oceanogr. 2016, 61, 1015–1032. [Google Scholar] [CrossRef] [Green Version]
  32. Chen, Z.; Wen, M.L.Q.; Ren, N. Evolution of molecular weight and fluorescence of effluent organic matter (EfOM) during oxidation processes revealed by advanced spectrographic and chromatographic tools. Water Res. 2017, 124, 566–575. [Google Scholar] [CrossRef]
  33. Pickard, A.E.; Heal, K.V.; McLeod, A.R.; Dinsmore, K.J. Temporal changes in photoreactivity of dissolved organic carbon and implications for aquatic carbon fluxes from peatlands. Biogeosciences 2017, 14, 1793–1809. [Google Scholar] [CrossRef] [Green Version]
  34. Stedmon, C.A.; Markager, S.; Tranvik, L.; Kronberg, L.; Slätis, T.; Martinsen, W. Photochemical production of ammonium and transformation of dissolved organic matter in the Baltic Sea. Mar. Chem. 2007, 104, 227–240. [Google Scholar] [CrossRef]
  35. Zhang, Y.; Liu, M.; Qin, B.; Feng, S. Photochemical degradation of chromophoric-dissolved organic matter exposed to simulated UV-B and natural solar radiation. Hydrobiologia 2009, 627, 159–168. [Google Scholar] [CrossRef]
  36. Zhang, Y.; Yin, Y.; Feng, L.; Zhu, G.; Shi, Z.; Liu, X.; Zhang, Y. Characterizing chromophoric dissolved organic matter in Lake Tianmuhu and its catchment basin using excitation-emission matrix fluorescence and parallel factor analysis. Water Res. 2011, 45, 5110–5122. [Google Scholar] [CrossRef] [PubMed]
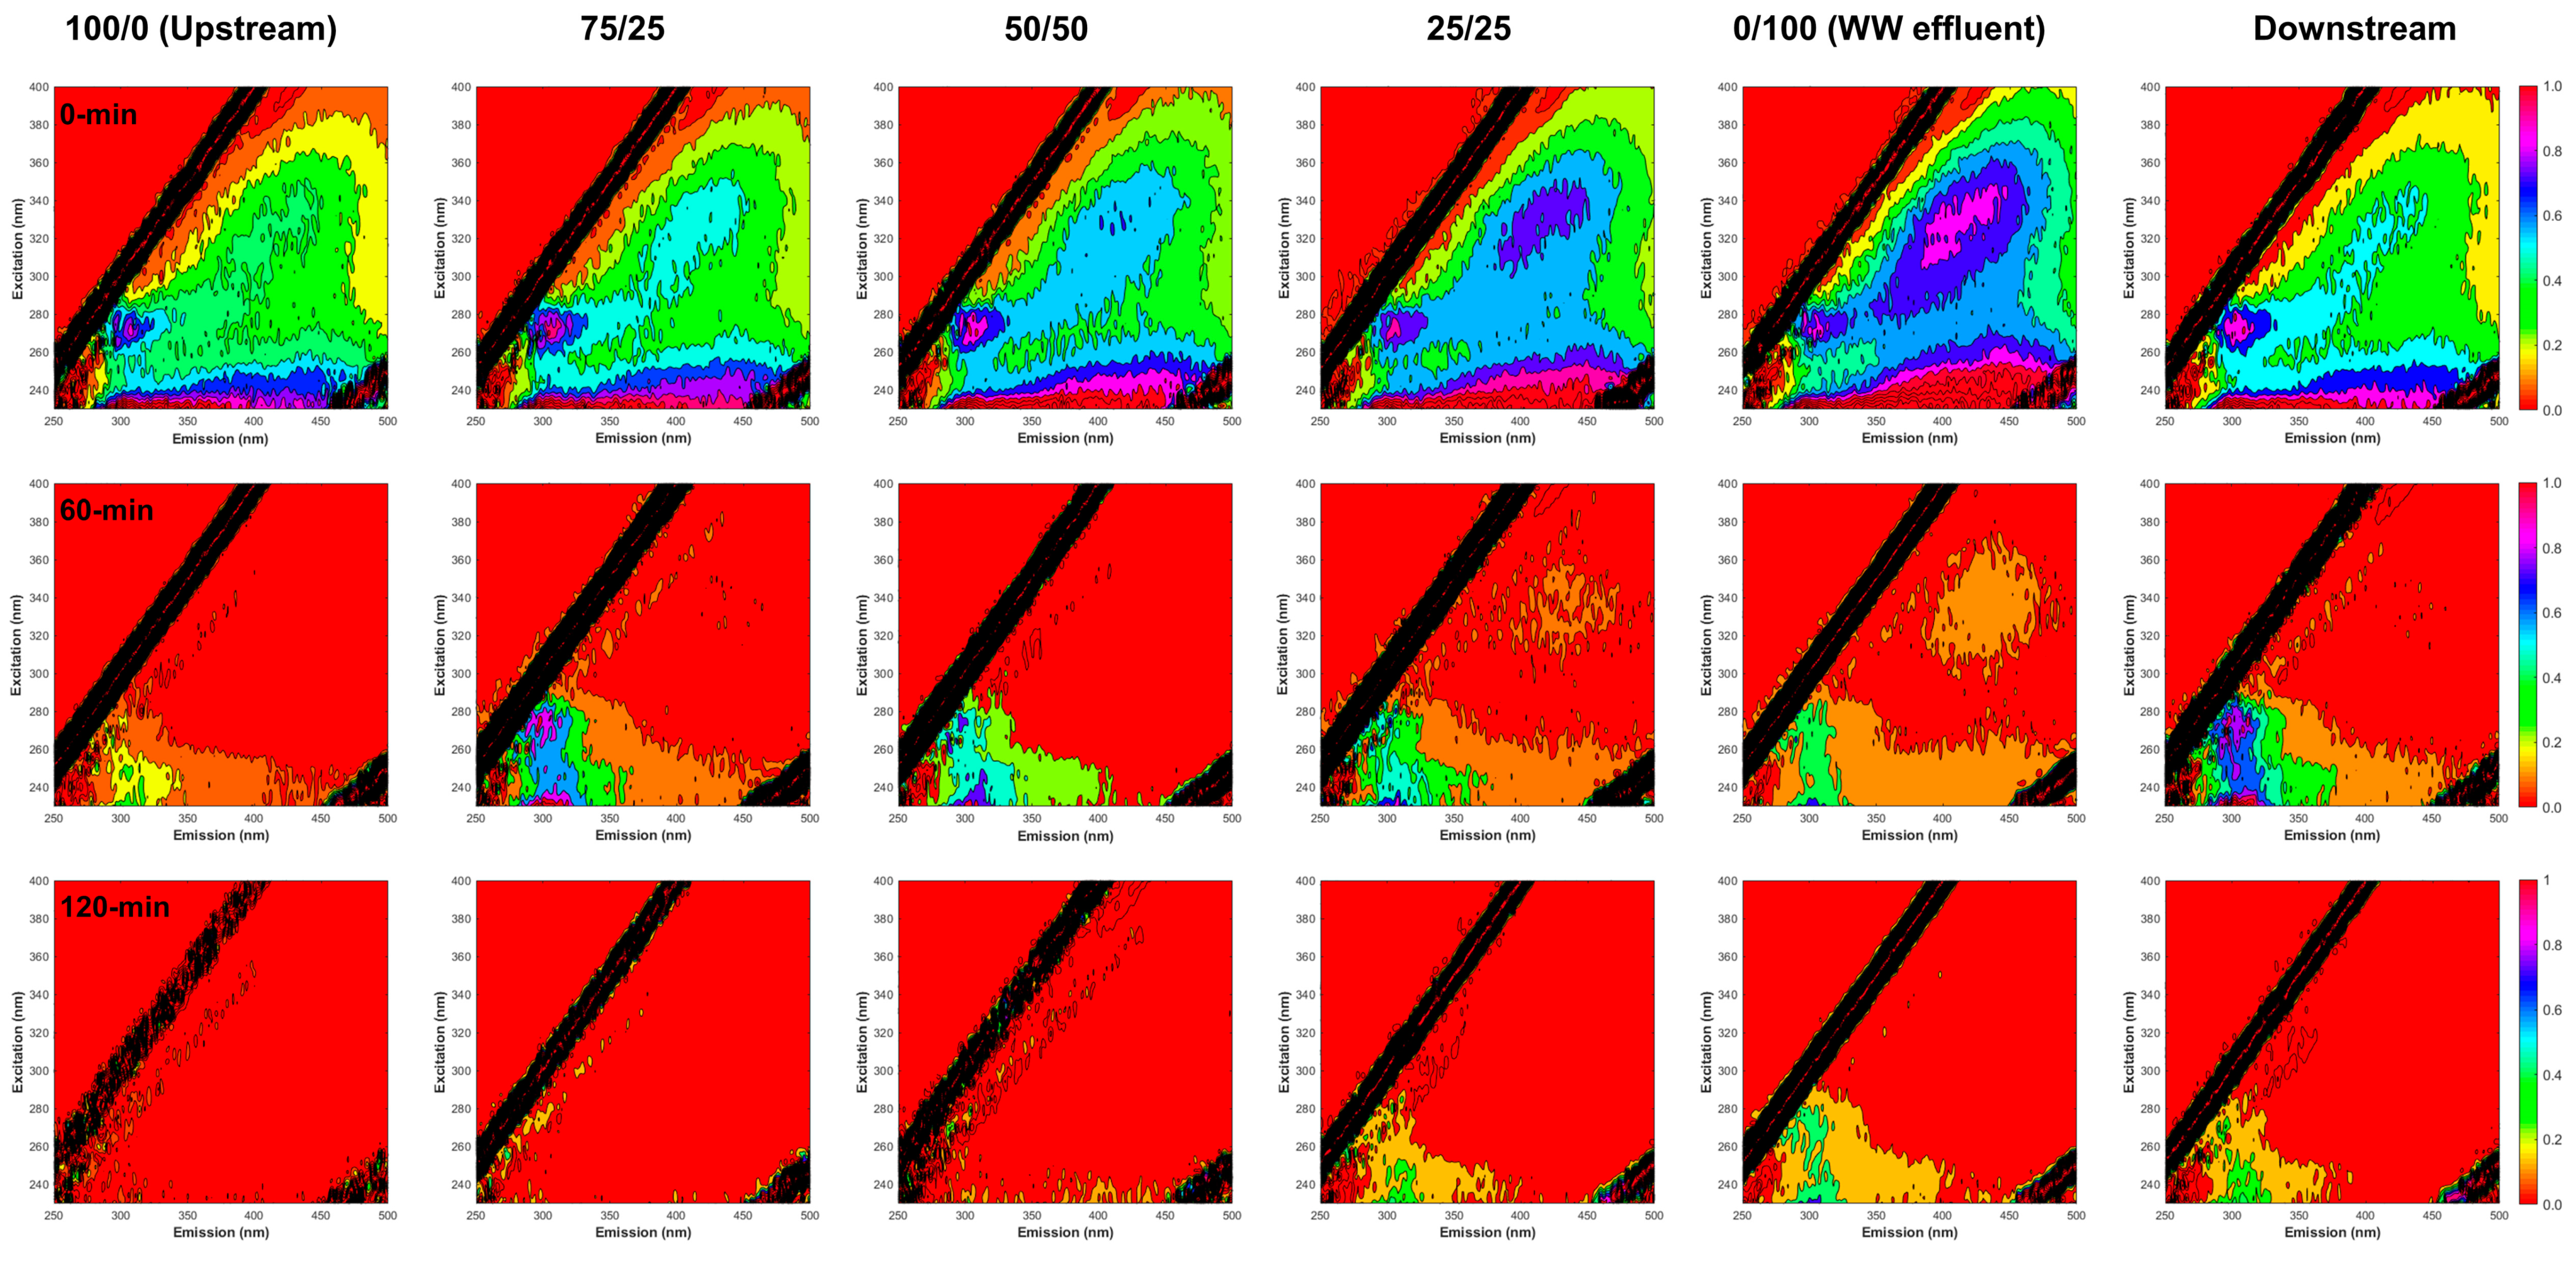
Figure 1. Changes in the EEM contour maps of the initial (0-min), after 60-min, and after 120-min photocatalysis with 0.2 g/L of ZnO at pH 7 for samples with different mixing ratio.
Applsci 10 09002 g001
Figure 2. DOC and UV254 removal from upstream, wastewater effluent, and downstream samples using photocatalysis with 0.2 g/L of ZnO at pH 7: (a) DOC removal and (b) UV254 removal.
Applsci 10 09002 g002
Figure 3. Contour plots and excitation/emission loadings for three PARAFAC components from upstream, wastewater effluent, and downstream samples.
Applsci 10 09002 g003
Figure 4. Percentage contribution of PARAFAC components in upstream, wastewater effluent, and downstream samples.
Applsci 10 09002 g004
Figure 5. Changes in three PARAFAC components during photocatalysis with 0.2 g/L of ZnO at pH 7 for upstream, wastewater effluent, and downstream samples: (a) C1 degradation curves, (b) C2 degradation curves, (c) C3 degradation curves, and (d) degradation rates.
Applsci 10 09002 g005
Figure 6. Comparisons of removals and apparent degradation rates in terms of DOC, UV254, and three PARAFAC components (a), and changes of Fmax values ((b)-upstream sample, and (c)-wastewater effluent) during photocatalytic degradation of EfOM with 0.2 g/L ZnO at pH 7 under artificial sunlight irradiation.
Applsci 10 09002 g006aApplsci 10 09002 g006b
Table 1. Measured DOC and optical parameters for upstream, wastewater effluent, and downstream samples before and after photocatalysis with 0.2 g/L of ZnO at pH 7 with irradiation for 120 min (mean ± standard deviation). The standard deviation less than 0.5% of the mean were not displayed.
Parameters100/0
(Upstream)
75/2550/5025/750/100
(WW Effluent)
Downstream
DOC
(mg/L)
Initial6.51 ± 0.037.05 ± 0.077.62 ± 0.037.79 ± 0.068.54 ± 0.018.04 ± 0.07
Photocatalysis3.68 ± 0.034.34 ± 0.034.89 ± 0.055.21 ± 0.026.08 ± 0.064.90 ± 0.05
UV254
(A.U.)
Initial0.0730.0790.089 ± 0.0010.0920.103 ± 0.0010.099
Photocatalysis0.0240.0270.0310.0350.041 ± 0.0010.036 ± 0.001
SUVA254
(L mg−1 m−1)
Initial1.124 ± 0.0081.116 ± 0.0801.163 ± 0.0201.177 ± 0.0121.205 ± 0.0181.234 ± 0.013
Photocatalysis0.643 ± 0.0110.627 ± 0.0090.6470.671 ± 0.0060.677 ± 0.0120.740 ± 0.029
E2/E3Initial7.06 ± 1.177.60 ± 0.017.57 ± 1.246.86 ± 0.576.42 ± 0.727.12 ± 0.06
Photocatalysis28.96 ± 1.3023.30 ± 1.0226.19 ± 1.9924.45 ± 2.5421.50 ± 1.1335.08 ± 1.18
ε 280  
(L mol−1 m−1)
Initial21.2520.4220.9922.5722.8723.16
Photocatalysis7.92 ± 0.277.45 ± 0.567.87 ± 0.088.16 ± 0.298.27 ± 1.067.92 ± 0.45
S275−295
(nm−1)
Initial−0.017 ± 0.002−0.016−0.016 ± 0.003−0.014 ± 0.002−0.013 ± 0.001−0.014
Photocatalysis−0.025 ± 0.005−0.019−0.018 ± 0.001−0.016−0.020 ± 0.002−0.025 ± 0.005
S350–400
(nm−1)
Initial−0.016 ± 0.002−0.019−0.017 ± 0.002−0.018−0.017−0.018
Photocatalysis−0.024 ± 0.003−0.021 ± 0.001−0.030 ± 0.003−0.023 ± 0.001−0.022 ± 0.005−0.024 ± 0.003
SRInitial1.022 ± 0.0120.872 ± 0.0020.909 ± 0.1210.768 ± 0.1110.744 ± 0.0270.783 ± 0.010
Photocatalysis1.051 ± 0.0910.905 ± 0.0450.620 ± 0.0700.706 ± 0.0120.952 ± 0.2631.051 ± 0.091
FIInitial1.26 ± 0.031.31 ± 0.011.45 ± 0.051.49 ± 0.071.66 ± 0.041.50 ± 0.01
Photocatalysis0.33 ± 0.010.370.500.66 ± 0.050.87 ± 0.030.51 ± 0.01
HIXInitial1.011.141.191.371.541.18
Photocatalysis0.1500.160.180.200.22 ± 0.010.20
BIXInitial0.960.970.991.011.041.00
Photocatalysis0.030.270.370.410.520.31
Table 2. The results of one-way ANOVA for characteristic parameters of organic matters by varing the mixing ratios.
ParametersSources of VariationSum of
Squares
Degree of FreedomMean SquareFSignificance
DOCBetween Groups7.06941.767992.8710.000
Within Groups0.018100.002
Total7.08714
UV254Between Groups0.00240.000612.3060.000
Within Groups0.000100.000
Total0.00214
SUVA254Between Groups0.01740.00426.3240.000
Within Groups0.002100.000
Total0.01814
ε 280 Between Groups13.25443.3135.6640.012
Within Groups5.850100.585
Total19.10414
S275–295Between Groups0.00040.00011.8660.001
Within Groups0.000100.000
Total0.00014
S350–400Between Groups0.00040.0001.8400.198
Within Groups0.000100.000
Total0.00014
SRBetween Groups0.24840.06216.3050.000
Within Groups0.038100.004
Total0.28614
E2/E3Between Groups2.98040.7451.2660.346
Within Groups5.886100.589
Total8.86514
FIBetween Groups0.30340.07647.8100.000
Within Groups0.016100.002
Total0.31814
HIXBetween Groups0.52440.131313.4960.000
Within Groups0.004100.000
Total0.52814
BIXBetween Groups0.01140.00310.2980.001
Within Groups0.003100.000
Total0.01314
C1_FmaxBetween Groups0.63840.159174.6860.000
Within Groups0.009100.001
Total0.64714
C2_FmaxBetween Groups0.85040.212186.6900.000
Within Groups0.011100.001
Total0.86114
C3_FmaxBetween Groups0.09640.024263.6780.000
Within Groups0.001100.000
Total0.09714
Table 3. Changes in DOC, UV254, and the three EEM-PARAFAC components for upstream, wastewater effluent, and downstream samples during photocatalysis with 0.2 g/L of ZnO at pH 7 for 120 min of irradiation (mean).
SamplesRemoval (%)Degradation Rate, k (min−1)
DOCUV254C1C2C3DOCUV254C1C2C3
100/0 (upstream)43.467.698.482.898.70.00520.01020.02920.01420.0330
75/2538.465.496.184.096.50.00410.00880.02560.01560.0278
50/5035.964.695.686.495.70.00360.00790.02420.01740.0255
25/7533.161.994.288.794.70.00350.00770.02230.01780.0238
0/100 (WW effluent)28.860.093.390.893.50.00290.00720.02180.02020.0223
Downstream39.063.494.686.594.80.00390.00700.02170.01520.0235
Publisher’s Note: MDPI stays neutral with regard to jurisdictional claims in published maps and institutional affiliations.