Article

Estimation of the High-Frequency Attenuation Parameter Kappa for the Zagreb (Croatia) Seismic Stations

1
Faculty of Geotechnical Engineering, University of Zagreb, 42000 Varaždin, Croatia
2
Department of Geophysics, Faculty of Science, University of Zagreb, 10000 Zagreb, Croatia
3
Department of Geology, Croatian Geological Survey, 10000 Zagreb, Croatia
4
Seismological Survey, Department of Geophysics, Faculty of Science, University of Zagreb, 10000 Zagreb, Croatia
*
Author to whom correspondence should be addressed.
Appl. Sci. 2020, 10(24), 8974; https://doi.org/10.3390/app10248974
Submission received: 19 November 2020 / Revised: 13 December 2020 / Accepted: 15 December 2020 / Published: 16 December 2020
(This article belongs to the Special Issue Evaluation of the Crustal Structure)

Abstract

:

Featured Application

The results from this study of the high-frequency attenuation confirm the effect of local structures on local attenuation and of deep structures on the attenuation at long distances. Additionally, it should be considered as a step towards the better analysis of seismic hazards for wider area of the city of Zagreb.

Abstract

The city of Zagreb (Croatian capital) is situated in the contact area of three major regional tectonic units: the SE Alps, NW Dinarides, and Tisza Unit in the southwestern margin of the Pannonian Basin. The Zagreb seismic zone encompasses the Medvednica Mountains and the city of Zagreb with its surrounding areas, which was struck by the strongest instrumentally recorded earthquake (M5.5) on 22 March 2020. The objective of this contribution is the estimation of the high-frequency attenuation spectral parameter kappa (κ) and its local site-specific component for the Zagreb (Croatia) seismic stations to which we were particularly encouraged after the scale of the damage after the Zagreb 2020 earthquake. We tested linear dependence of κ with epicentral distance using traditional linear least square regression, linear regression for data with errors, and constrained model at close distances to estimate near-site attenuation (κ0). Regression-estimated site kappa values at zero-distance are within the range of the uncertainty (±1 standard deviation) with constrained κ0 value as well within the range of existing global κ0 and VS30 (shear wave velocity in the top 30 m) values. Spatial distribution of κ within the Zagreb seismic zone shows that κ is not isotropic and high-frequency attenuation anisotropy is probably affected by local and regional geological variability, regional active faults and a complex tectonic structure in each direction.

1. Introduction

Attenuation of seismic waves is one of the key factors in seismic hazard assessment for earthquake-prone regions as well as being important for the quantification of earthquakes and plays a significant role in studies of seismic source and crustal structure [1]. The Fourier amplitude spectrum (FAS) of ground motion is influenced by source parameters, propagation path, and local site conditions as modelled by the Brune’s [2] theoretical omega-square source model. Hanks [3] was one of the first who observed the “crashing spectrum syndrome” in the acceleration spectrum of shear waves (S-waves) on strong-motion accelerograms recorded at close distances. The high-frequency band limitation parameter (fmax) was defined as the cut-off frequency at which the spectrum starts to decay very rapidly. Hanks [3] concluded that the fmax observed in acceleration FAS is controlled by the local site conditions, particularly by the subsurface geological structures below and near the site. One of the first uses of the term “site attenuation parameter” to model the high-frequency spectral attenuation was by Cormier [4]. Empirical spectral decay parameter kappa (κ) was introduced by Anderson and Hough [5] to describe the difference between the observed acceleration spectrum of S-waves and Brune’s [2] omega-square source model at the high-frequency part of the FAS. Anderson and Hough [5] observed a linear relation between the κ of the ground motion and the epicentral distance (Re) of the recording station. The zero-distance intercept κ0 (also called the near-site attenuation or site-kappa) represents the attenuation contribution to κ from subsurface geological structure beneath the site. The slope (κR) is related to the regional attenuation due to the horizontal propagation of S-waves through the crust below and near the site within a few kilometres (e.g., [5,6,7]). Over the last three decades, the near-site attenuation parameter κ0 has been used in a variety of applications. Particularly in the creation and calibration of ground-motion models (GMMs) based on stochastic simulations (e.g., [8,9,10,11]), host-to-target adjustments of GMMs (e.g., [12,13]) and site-specific ground response analysis using Random Vibration Theory (e.g., [14]) for critical facilities where the choice of seismological parameters play an important role.
On 22 March 2020 Zagreb was struck by the strongest ever instrumentally recorded earthquake (M5.5) that caused significant damage in the city itself. The seismological data were reliable enough for preliminary 3D interpretation of the rupture along a segment of an active NW verging thrust fault in the subsurface of the Medvednica Mountains [15]. The aim of this paper is a more reliable interpretation of near-site attenuation or site-kappa based on seismological data obtained up to now.
The objective of this contribution is to present the calculation of high-frequency attenuation spectral parameter κ and its local site-specific component κ0 for two seismological stations: Puntijarka-PTJ (situated on the top of Medvednica Mountains) and Zagreb-ZAG (situated in Zagreb city), using classical Anderson and Hough [5] approaches. The results from this study of the high-frequency attenuation will contribute to a better knowledge of the effect of local structures on local attenuation and of deep structures on the attenuation at long distances. Additionally, attenuation parameters (κ, κ0) should be considered as a step towards a better analysis of seismic hazard and finally towards seismic hazard assessment for the wider area of the city of Zagreb that has a population close to 1 million and the city’s strategic infrastructure.

2. Study Area: Geological Features and Seismicity

2.1. Geological Features of the Zagreb Area

The city of Zagreb (the Croatian capital) is situated in the contact area of three major regional tectonic units [16,17]: the SE Alps, NW Dinarides, and Tisza Unit in the southwestern margin of the Pannonian Basin (Figure 1a). Interaction of the units causes earthquakes in the upper crust [18] that are distributed predominantly along the regional active faults ([19], Figure 1b). The NW verging reverse fault system striking along the Medvednica Mountains is probably related to a major seismogenic thrust fault [15] in the wider city of Zagreb region, and is dissected by active transversal strike-slip faults (Figure 1b). A system of south-dipping longitudinal reverse faults has been mapped on the surface along the Medvednica Mountains ([20,21,22], Figure 1c), and interpreted in one of the latest tectonic models as the youngest (Pliocene to Quaternary) inverse structure ([19], Figure 1c). A master thrust could represent a basal detachment (décollement) of the system of steeper reverse faults striking along the mountain range. Although the frontal part of the thrust could be steeply inclined towards the surface along the northern margin of the Medvednica Mountains, or it could be buried below the Neogene Hrvatsko Zagorje basin ([15], Figure 1c).
Due to the Pliocene–Quaternary N–S directed shortening, Medvednica Mountains experienced approx. up to 2000 m of differential uplift and now exposes pre-Neogene and Neogene tectonic and stratigraphic units that are surrounded by Pliocene–Quaternary sediments [23]. According to the DEM-based morphometric analysis the ongoing tectonic uplift in Medvednica Mountains area is concentrated along the SW corner of the NW mountain front and along a narrow boundary zone that divides the Medvednica Mountains into the NE and SW regions. According to [24] this area is considered to be tectonically active, with low uplift rates of approx. 0.023 mm/y which is in good agreement with the 0.17–0.4 mm/y Quaternary uplift rate reported by [25] for the central part of Medvednica Mountains. During the recent rupture (March 2020) along a segment of an active NW verging thrust fault in the subsurface, the central part of the mountain was uplifted by up to 3 cm [15].
The mountain is considered as uplifted bedrock, composed of Paleozoic and Triassic metamorphic and volcanic rocks in the core, obducted ofiolitic mélange and overlying Cretaceous carbonate and flysch rocks. Miocene transgressive successions of the Pannonian basin unconformably cover the eroded Phanerozoic basement all around the mountain ([20,21,22], Figure 1c). Predominantly unconsolidated superficial Pliocene–Quaternary sediments (gravel, sand and clay) are up to 2000 m thick in the subsurface of Sava basin on the south and the Hrvatsko Zagorje basin on the north (Figure 1c), and pinch-out towards Medvednica Mt. ([20,21,22]. Thus, the seismic station Puntijarka (PTJ) is situated on the bedrock that can be considered as a firmly consolidated basement, while the seismic station Zagreb (ZAG) is situated on the Quaternary alluvial sediments of the Sava river that are mostly unconsolidated materials (Figure 1a).

2.2. Seismicity of the Zagreb Area

Several seismic zones (Zagreb, Novo Mesto-Krško, Karlovac-Metlika and Pokupsko-Petrinja) are situated on the wider Zagreb area as can be seen on Figure 2 (marked with coloured shadowing).
The most important one is the Zagreb seismic zone which encompasses the Medvednica Mountains and the city of Zagreb with its surrounding areas. Epicentre locations of the strongest earthquakes are mostly situated on the north-western slopes of the Medvednica Mountains. The strongest earthquake was on 9 November 1880, close to Kašina, in the village Planina, and is known as the “Great Zagreb earthquake”. This was the first Croatian earthquake for which the value of the focal depth (16 km) was determined based on macroseismic investigations. The analysis of the earthquake effects enabled the determination of the epicentral intensity (VIII °MCS). The earthquake itself is extremely well documented [26] due to extensive material damage. Of the 3670 buildings (Zagreb had around 30,000 inhabitants at the time) all were damaged and about 13% were destroyed. After 1900 the strongest event that happened in Zagreb area occurred on 22 March, 2020, 140 years after the “Great Zagreb earthquake” [15]. Its epicentre was 7 km north of the centre of Zagreb, in the vicinity of Markuševac and Čučerje, and the hypocentre was at a depth of 10 km. This M5.5 earthquake was felt with a maximum intensity of VII-VIII °MSK. Regarding other recent seismic events, prior to the Zagreb event of 2020 there was only a single strong earthquake in this area. The M5 event occurred in 1990, 3.5 km south of Kraljev Vrh, where the worst of the damage was observed.
The strongest earthquakes in the Novo Mesto-Krško seismic zone occurred mainly in the period up to 1900. The maximum intensity of these events did not exceed VIII °MCS. The strongest earthquakes (with the maximum intensity VIII °MCS) occurred in 1634 (Novo Mesto area) and 1917 (around Brežice). The strongest earthquake after 1900 was in 1974. It occurred approximately 15 kilometres north of Krško with the magnitude of 5.1.
Seismic zone Karlovac–Metlika encompasses the areas of Žumberačka gora and Samoborska gora together with Ozalj and Jastrebarsko. It is characterized by the occurrence of a large number of small earthquakes and smaller number of stronger ones. The majority of earthquakes (95%) that have occurred in this area have a magnitude of less than 3.0. Some authors have mentioned two historical earthquakes southeast of Metlika, within this seismic zone, with the intensity of IX °MCS, in 567 and 1097. However, the information that is available on these earthquakes is very unreliable. We will emphasize the earthquakes whose locations and intensities are known with a higher degree of reliability. These are two earthquakes of intensity VIII °MCS, in 1645, 6 km west of Ozalj and in 1699, with the epicentre in Metlika. In addition to these two events, four more occurred with intensities greater or equal to VII °MCS (in 1645, 1881, 1887 and 1974).
The locations of epicentres of strong earthquakes in the Pokupsko-Petrinja seismic zone stretch in the N-S direction. The strongest event here is one of the best-known earthquakes, not only in Croatia but also globally. It is the earthquake that occurred on 8 October, 1909, with the epicentre 9 km north of Pokupsko. Therefore, it is known as the Pokupsko earthquake. The magnitude of the earthquake was 5.8, with the focal depth of 14 km, and the effects that it caused were rated with a maximum intensity of VIII °MCS. The Pokupsko earthquake is one of the few historical earthquakes that are regularly referred to in seismological textbooks and other books on the history of science due to it’s study leading to important discoveries that have marked a turning point in the understanding of earthquakes and their effects. By analysing the earthquake, the great Croatian scientist and geophysicist Andrija Mohorovičić proved the existence of the discontinuity of velocity that separates the crust from the mantle of the Earth (the Mohorovičić discontinuity). The main Pokupsko earthquake was followed by a series of more than 50 aftershocks before the end of 1910. The strongest of which had a magnitude of 5.3, with no other earthquakes after 1910 exceeding M4.5.

3. Methods and Data

We applied Anderson and Hough’s [5] well-known method (AH84) for estimating κ by analysing the S-wave spectra in this study following Ktenidou et al. [7,11] guidelines. The total path attenuation of S-waves within the crust is separated into two attenuation parameters: the frequency-dependent quality factor Q(f) and the near-surface attenuation parameter κ (also termed site diminution parameter, κ0) as shown in Equation (1) where A(f,t) is acceleration spectrum that contains the effects of source, distance and local site effects. In Equation (1), t* is attenuation time [4], f is frequency, R is distance, β0 is shear wave velocity of the Earth’s medium:
A f ,     t = A 0 exp π f t * = A 0 exp π f R Q f β 0 + κ 0 = A 0 exp π κ f  
Anderson and Hough [5] observed a linear dependence between the calculated κ of the ground motion and the epicentral distance (Re) of the recording station and proposed a mathematical formula (Equation (2)) that treats κ as a function of Re. In Equation (2), the zero-distance intercept κ0 represents the attenuation contribution to κ from geological structure beneath the site (near-site attenuation or site-kappa), and the distance dependent part in term of the slope (κR) is related to the regional attenuation:
κ = κ 0 + κ R · R e
Value of κ gradually increases with distance, and degree of the slope κR depends on the local and regional geology. Since its introduction, general observation of Anderson and Hough [5] study that κ is a linear function of Re has proven to be good approximation as shown in the recent studies that estimated κ (e.g., [1,6,7,30,31,32,33]). In the last decade relationship between estimated κ0 and measured VS30 values were proposed; κ0 has lower values for sites on harder rocks (higher VS30 values) and higher κ0 values are obtained on softer rocks (e.g., [11]).
Two seismological stations included in this study are: Puntijarka (PTJ), located at the top of Medvednica Mountains and Zagreb (ZAG), located in the city area (Figure 1). A compiled ground motion data set is selected within ML ≥ 3.0, Re ≤ 150 km and a focal depth of h ≤ 30 km. Figure 3 evaluates the compiled ground motion dataset distribution of the epicentres (Re) and focal depth with magnitudes (ML) at each station. The number of recordings at each station depends not only on local seismicity and data selection that is the same for both stations, but also on the operational period of each station (from 2000) and usable frequency sampling rate. In this study we used 50 Hz seismograms recorded from 2004 to 2019 (PTJ, 127 recordings) and from 2007 to 2019 (ZAG, 92 recordings).
We calculated the parameter κ by using the classical Anderson and Hough [5] approach (Equations (1) and (2)) for all three components (north-south-NS, east-west-EW and vertical-Z) of weak motion seismograms with frequency sampling rate of 50 Hz. Figure 4 represents two examples of step-by-step κ calculation for seismograms recorded on ZAG and PTJ stations. The S-wave window (with a part of coda tail that cannot be avoided) is selected for each record with a minimum duration of 3 s and transformed via FFT to obtain FAS. The dropout of FAS at frequencies above 20 Hz was due to anti-alias filter. Therefore, FAS above 20 Hz (80% of the Nyquist frequency) was not considered in the κ calculation. We have used case-by-case evaluation in order to visually inspect the possible reasons of excluding data from the analysis (e.g., missing data, poor recording, strong resonance peaks, noise effects) that can significantly affect calculation of κ [7]. The high-frequency decay parameter κ is calculated from the slope of FAS in the linear–logarithmic space for the high-frequency range between f1 and f2. In most cases, f1 is picked as the lower bound of the high-frequency slope before the FAS starts to decrease rapidly (fmax) and is always picked to be higher than the corner frequency fc to exclude possible source contribution (e.g., [7,33]), whereas f2 is fixed to 20 Hz in all cases. We calculate corner frequency shown in Figure 4 based on theoretical FAS (black line, [10]) using known seismological parameters for each recording based on EQ catalogue (updated version first described in [27]). We adopted Q(f) value from [34] as Qc(f) = 78fc0.69 for PTJ and Qc(f) = 45fc0.92 for ZAG stations with preselected kappa value equal to 0.0 s. Afterwards, we used an empirically estimated kappa value using AH84 method (magenta fit line) to determine the Brune [2] theoretical FAS for each recording in order to compare how the high-frequency attenuation parameter kappa would fit within the full theoretical spectrum fit (black dashed line). This spectrum can be called the semi-empirical spectrum as most known empirical earthquake parameters are used to plot this spectrum. An exact match is impossible due to differences and errors in estimated seismological parameters. However, a good match between the semi-empirical spectrum and high-frequency kappa fitting is observed in most cases.

4. Results

In the present work we applied original the Anderson and Hough [5] linear formulation (Equation (2)) to a pair of individual κ values with epicentral distances Re for all records at each station. We estimated the value of site-specific (near-site) attenuation parameter κ0 based on proposed κ model as a function of epicentral distance. Calculated individual κ values for EW and NS components we combined into an average value of κhor for each recording. In certain cases where they differ significantly from each other (difference > 25%), the recording is excluded for further regression analysis to obtain the site kappa value (e.g., [7,11]). 81 usable pairs of κ and Re data for κ models were finally chosen (from the initial 92) for the ZAG station and 118 (from the initial 127) for the PTJ station.
In this study, both κ models (κhor and κver) as a function of epicentral distance are proposed to estimate site-specific parameters κ0hor and κ0ver using linear least-square regression (e.g., [7]). Both variables, κ and Re are imperfectly known and errors in Re could have impact on the final κ0 value and the slope of regression κR. Therefore, instead of using the traditional linear least-squares regression, we performed linear regression suitable for data with errors, following the method by York et al. [35]. This allowed us to test how the existence and correlation for the observational errors in two coordinates (Re and κ) affect values of κ0 and κR, and if there exists a significant difference regarding the standard linear regression.
Typically, we set the standard error for Re to vary ±2, 5 and 10 km and error in κ set to be ±1 or 2 standard deviations based on observed empirical data. A regression test showed that differences between standard and error-in-variables linear regression κ0 and κR values vary mostly between 1–5% (Table 1). Highest differences up to 9% are within standard error in Re ± 10 km and smallest below 1% within standard error in Re ±2 km with respect to ±1 or 2 standard deviations in κ. However, ±1 standard deviations in κ is too small to be consider representative as can be seen by data scatter in Figure 5. We choose to evaluate final κ0 and κR values using errors for epicentral distances to be in order of 5 km with errors in κ to be ±2 standard deviations as shown in Figure 5. Summarized results and differences between standard linear regression and errors-in-variables regression are shown in Table 1.
Estimation of individual kappa values is very sensitive as can be observed on Figure 4. This is particularly important to consider when kappa is estimated by different users and different computational procedures as described in [7]. For this reason, taking 5% uncertainty as a difference between standard least-square regression without consideration of errors in variables and error-in-variables, yield to site kappa value that is more conveniently estimated as shown in Table 1. With less data, large data scatter and lack of data at shorter epicentral distances, differences between two regression methods could be significant, and that can affect final κ0 and κR values. Less data and lack of data at shorter epicentral distances are related to the seismicity of an area and operational years of seismological stations.
However, large data scatter in κ and Re is not only sensitive to differences in methods and data, and to the local and regional characteristics of study area (the effect of distance and local site effects), but also to complex Q structure, different ray paths across faulting structure for different earthquakes [36,37] and anisotropic attenuation properties [1]. Therefore, we choose an area within about 20 km of the epicentre as near-field attenuation [38] to constrain κ0 value to κ value at shortest Re (Figure 6) using nearby records (hockey-stick model proposed by [36]). This enabled us to determine site kappa value affected primarily by upper local site condition that would not be influenced by changes in slope of κR related to Q; in order to minimize influence of regional effects (deeper local site effect + source and path effects, [32]) on κ0. Additionally, by restricting the distance range for kappa we ensure that local site attenuation at zero distance is overwhelmed by the path component at larger distances [36,37].
Figure 6 shows comparison of results from different methods to estimate κ0 for the PTJ and ZAG stations. It can be observed that κ0 values are constrained for shorter distances to catch mainly upper local site conditions and data ranges are similar within errors. κ0 values estimated from the extrapolation to zero distance (preferably using error-in-variables regression) are within the range of the uncertainty (±1 standard deviation) with a constrained κ0 value (Figure 6, Table 2). At larger distances, variations between empirical kappa values are scattered among similar distances due to heterogeneity along the paths between different sources and stations.
It is possible to compare estimated values of frequency-dependent Q(f) for the high-frequency range with frequency-independent Q estimated from κ [5,7,11,32]. The Q value is inversely proportional to slope κR as a regional attenuation contribution, Q(κR) = 1/β·κR (typical value of β = 3.5 km/s is used as an average shear wave velocity of the crust). To compare two independent attenuation studies, frequency-dependent attenuation, the Q(f) value, is adopted from [34] as Qc(f) = 78fc0.69 for the PTJ and Qc(f) = 45fc0.92 for ZAG stations for a time lapse equal to 30 s. For the high-frequency range 10–20 Hz this yields to Qc(f = 10–20 Hz) = 382–616 for PTJ and Qc(f = 10–20 Hz) = 374–708 for ZAG. Common regional effects Q(κR) averaged for high frequency attenuation and azimuthal changes, estimated from the slope κR for both components (horizontal and vertical) are: Q(κR) = 913–1120 for PTJ and Q(κR) = 1143–1348 for ZAG. Differences in the frequency independent Q(κR) are probably the result of higher local site attenuation effects at ZAG station compared to PTJ station, azimuthal differences and data quality between stations.
Regional Q(κR) slope variation within ±2 standard deviations (Figure 6) are shown based on Qc(f) increase with frequency for a different lapse time tL [34]. Comparing high-frequency coda attenuation values with frequency independent, Qc(f) and Q(κR) for both stations it can be seen that they are comparable (difference is 32–67%). However, different azimuthal regional effects are neglected within average Q values under the assumption that they are affected by the same regional characteristics. Q(κR) slope variation shown in Figure 6 could indicate influence of regional azimuthal data subsets attenuation effects. But also differences in the average shear wave velocity of the crustal structure at the contact of the Dinarides and the Pannonian Basin affect Q(κR) values. Large differences among different Q approaches can be explained by inherent errors of Q and κ measurement (often in the order of ±50%) and different attenuation methods in Q and κ calculation (different data, band-pass filters, time window length). This shows that frequency-dependent attenuation cannot be ruled out for κ [1,33].
As expected, site kappa values for PTJ and ZAG are different as these stations are situated in different local site characteristics (Figure 1, Table 2). In terms of local site conditions, estimated κ0 values for both stations compared to VS30 values ([39,40]; for PTJ: site type A (800 m/s) by EC8 [41] and for ZAG: site type B (360–800 m/s) by EC8) are within the range of existing κ0‒VS30 correlations [11,32]. It confirms that lower values of κ0 are observed for sites on harder rocks (lower attenuation) and higher κ0 values for sites on softer rocks (higher attenuation). Evaluation of the site-specific κ0 is very sensitive since the AH84 method requires high-magnitude events, something that is difficult to acquire when the local site is situated in a low-to-moderate seismicity area. Correlations between κ0‒VS30 [11,32] could be helpful to estimate κ0 for a certain target local site. However, both variables κ 0 and V S 30 have some uncertainties. Especially, the errors in V S 30 may even be significantly higher than the error in κ 0 (percentage-wise) due to numerous reasons (different geophysical methods, correlations, analysis, regions, etc.), as observed in [36]. The preferred approach should be estimating the site kappa value from earthquake recordings, which is occasionally difficult in low seismicity areas. The scarcity in short distances affects the estimation of site kappa and constraining to fixed value within errors could be helpful. In contrast, greater distances recordings control the slope of kappa regression where potential uncertainties in location could exists (error-in-variable regression is preferred) as well as stronger influences of regional attenuation effects [36].

5. Discussion

Local and regional geological and tectonic characteristics around each station are important to define primary effects on the κ distribution within their azimuthal area subsets [1,7,42] estimated κ from the vertical component of ground motion and observed that the κ v e r values are slightly lower than the average κ h o r , something that is also observed in our study. Generally, the vertical component of the ground motion is mainly controlled by the source effect and exhibits relatively less sediment-induced amplification than horizontal components (e.g., [43]). Under the assumption that the local site effects are more pronounced in the horizontal components than in the vertical components of ground motion, we present the spatial distribution of horizontal κ values (Figure 7) to determine if there exist different trends in the high-frequency regional attenuation between different azimuthal area subsets.
The lowest κ values are spatially distributed within a few kilometres around the stations due to near-site effects and their values matching the κ0 value for horizontal components (PTJ: 0.0283–0.0360 s, ZAG: 0.0411–0.0475 s), particularly using constrained κ0 value based on hockey-stick model [36]. Station PTJ is situated on the top of the Medvednica Mountains as a part of the Pannonian Basin–External Dinarides–Alps transition zone. The station site area is composed of bedrock Palaeozoic–Triassic ortometamorphites and parametamorphites. In the lowland Zagreb area, where station ZAG is situated, Miocene semi-consolidated rocks to recent unconsolidated Pliocene and Quaternary sediments of the rivers Sava to the south and Krapina are present (Figure 1). Compared to [1], κ0 values for Zagreb area are higher than those for Kvarner region stations (Brijuni: 0.0249–0.0362 s, Rijeka: 0.0212–0.0239 s and Novalja: 0.0225–0.0235 s). The Kvarner stations sites and surrounding area are composed mainly of carbonates and the lowest κ values are regionally stabilized for hard rocks [11,32,37].
In an opposite way, the addition of softer rocks, within a few kilometres around the stations increases κ values [11,30,32]. The κ regionalization model schematically illustrated by [32] proposed division of near-site attenuation effects into upper local site effects (correlation with VS30), deeper site effects along near-field regional path (constrained model) and regional path effects from source. The κ0 values for Zagreb stations (PTJ and ZAG) are similar to those of Ozalj station (0.0377–0.0412 s) that is situated in a zone consisting mainly of consolidated rocks that are covered by thin alluvial sediments along the near Kupa River valley [1]. According to the model illustrated by [32], surrounding areas of Hrvatsko Zagorje and Sava Basins, with sediments depth up to 2 km (Figure 1), have influence on the increase of the high frequency attenuation and local site attenuation due to the addition of the deeper site attenuation. The older and more competent carbonate rocks in the top few kilometres of the crust are expected to have a lower kappa [37] as the situation is in the Kvarner region [1], than younger and less competent Miocene softer rocks in the uppermost crust surrounding the Medvednica Mountains.
If we take a look at the gradual increase of κ with distance from the stations, the regional path effect from the source attributed to the κ is described by the slope regression κ R . It can be observed that the spatial κ distribution is not isotropic and different trends between estimated lower and higher attenuation of ground motion subsets are observed. According to [1], the source of anisotropy is most likely attributed to orientations of the cracks and fractures under the local tectonic stress field, waveguides along major faults and attenuation within fault zones, S-wave reflections from different parts of the shallower Moho discontinuity. Variations in observed κ distribution between lower and higher attenuation subset areas is clearly under influence of local and regional geological structures; to the north influenced by the Ivanščica Mt. and Kalnik Mt., to the south by Žumberak Mt., and in its centre by the Medvednica Mountains, that are distributed predominantly within regional active faults ([19], Figure 1) and main seismic zones (Figure 2). We limit spatial distribution of κ (Figure 7) within distance of 80–100 km from Zagreb area to avoid additional path complications, since ground motion ray paths from source to station show a wider range of Q (Figure 6, [37]), and to derive conclusions within seismic zones Novo Mesto-Krško, Karlovac-Metlika and Pokupsko-Petrinja (Figure 2), that influence seismic hazard of the Zagreb city area.
As pointed in [1], observed lower attenuation properties may be caused by S-wave reflection from different parts of the shallower Mohorovičić discontinuity, which is less than 25 km in the Pannonian basin and thickens towards the Dinarides [44]. However, lower values of kappa along the SW-NE striking Medvednica structure (Figure 7) are probably caused by the shallow subsurface to surface position of the metamorphic and volcanic core of the mountain (Figure 1b). The core is situated below the major detachment and, thus, probably has not undergone thin-skin deformations that additionally cracked the rocks above the detachment.
The attenuation of the earthquake ground motion is complex in nature, and high-frequency kappa physics is still unresolved [32,33,36]. The regional propagation difference in the transition zone between Dinarides and the Pannonian basin is observed from the kappa spatial distribution. It can be concluded that the regional difference in attenuation properties of the rocks in the transition zone between Dinarides and the Pannonian basin in this area are far from isotropic. In comparison to [1], the obtained results are similar and consistent. However, some differences are evident, pointing to effects such as local intrinsic attenuation anisotropy from different causes, e.g., scattering due to heterogeneity, fracturing, flow of fluids in rocks. The results from both studies taken together indicate a change in the attenuation properties from the Dinarides to the Pannonian basin.
The main question is how the high-frequency attenuation observed along the propagation path affects seismic hazard of the Zagreb area. As shown in Figure 2, Zagreb city is under the influence of the near-field Zagreb seismic zone and close seismic zones Novo Mesto-Krško, Karlovac-Metlika and Pokupsko-Petrinja. It is also situated in the contact area of three major regional tectonic units (Figure 1). On 22 March 2020, Zagreb was hit by the strongest earthquake since 1880 [15], 5.5 on the Richter scale, with a shallow focal depth of <10 km. It occurred at 06:24 local time and hit the Croatian capital Zagreb as well as two neighbouring counties, namely Zagreb County (Sava Basin) and Krapina-Zagorje County (Hrvatsko Zagorje Basin). The maximal intensity of VII-VIII °EMS-98 scale was observed close to the earthquake epicentral area, just 7 km north of the centre of Zagreb, a city with a population of close to one million. Earthquake was felt throughout Croatia (Figure 8), as well as in neighbouring countries (Slovenia, Bosnia and Herzegovina, Hungary). Attenuation of macroseismic field (Figure 8) can be possibly linked to the kappa spatial distribution (Figure 7) if the same physical mechanisms are considered [1]. If particular paths from Zagreb city are looked comparing Figure 7 and Figure 8 (Varaždin, Ivanščica Mt.-Ivanec, Križevci-Kalnik Mt., Hrvatsko Zagorje Basin, Sava Basin, Karlovac, Sisak), Zagreb M5.5 earthquake was felt more widely due to different high-frequency attenuation anisotropy effects (Figure 7). This shows that the local attenuation and the attenuation at long distances are influenced by local and regional geological variability, regional active faults and complex tectonic structure in each direction. When all this is taken together, they certainly plays significant role in seismic hazard of the Zagreb city area. Thus, this is a step towards a better definition of the input parameters for seismic hazard and risk assessment.

6. Conclusions

This study presents the estimation of high-frequency attenuation of the spectral parameter κ and its local site-specific component κ0 for two seismological stations within the Zagreb seismic zone: Puntijarka-PTJ (situated on the peak of the Medvednica Mountains) and Zagreb-ZAG (situated in the city of Zagreb).
Near-site attenuation kappa (or site kappa, κ0) we estimated using traditional linear least-square regression and the linear regression suitable for data with errors (their differences is taken as 5% uncertainty). Site kappa is estimated by restricting the distance range for kappa, to ensure that local site attenuation at zero distance is not overwhelmed by the path component for larger distances.
The main results and conclusions are:
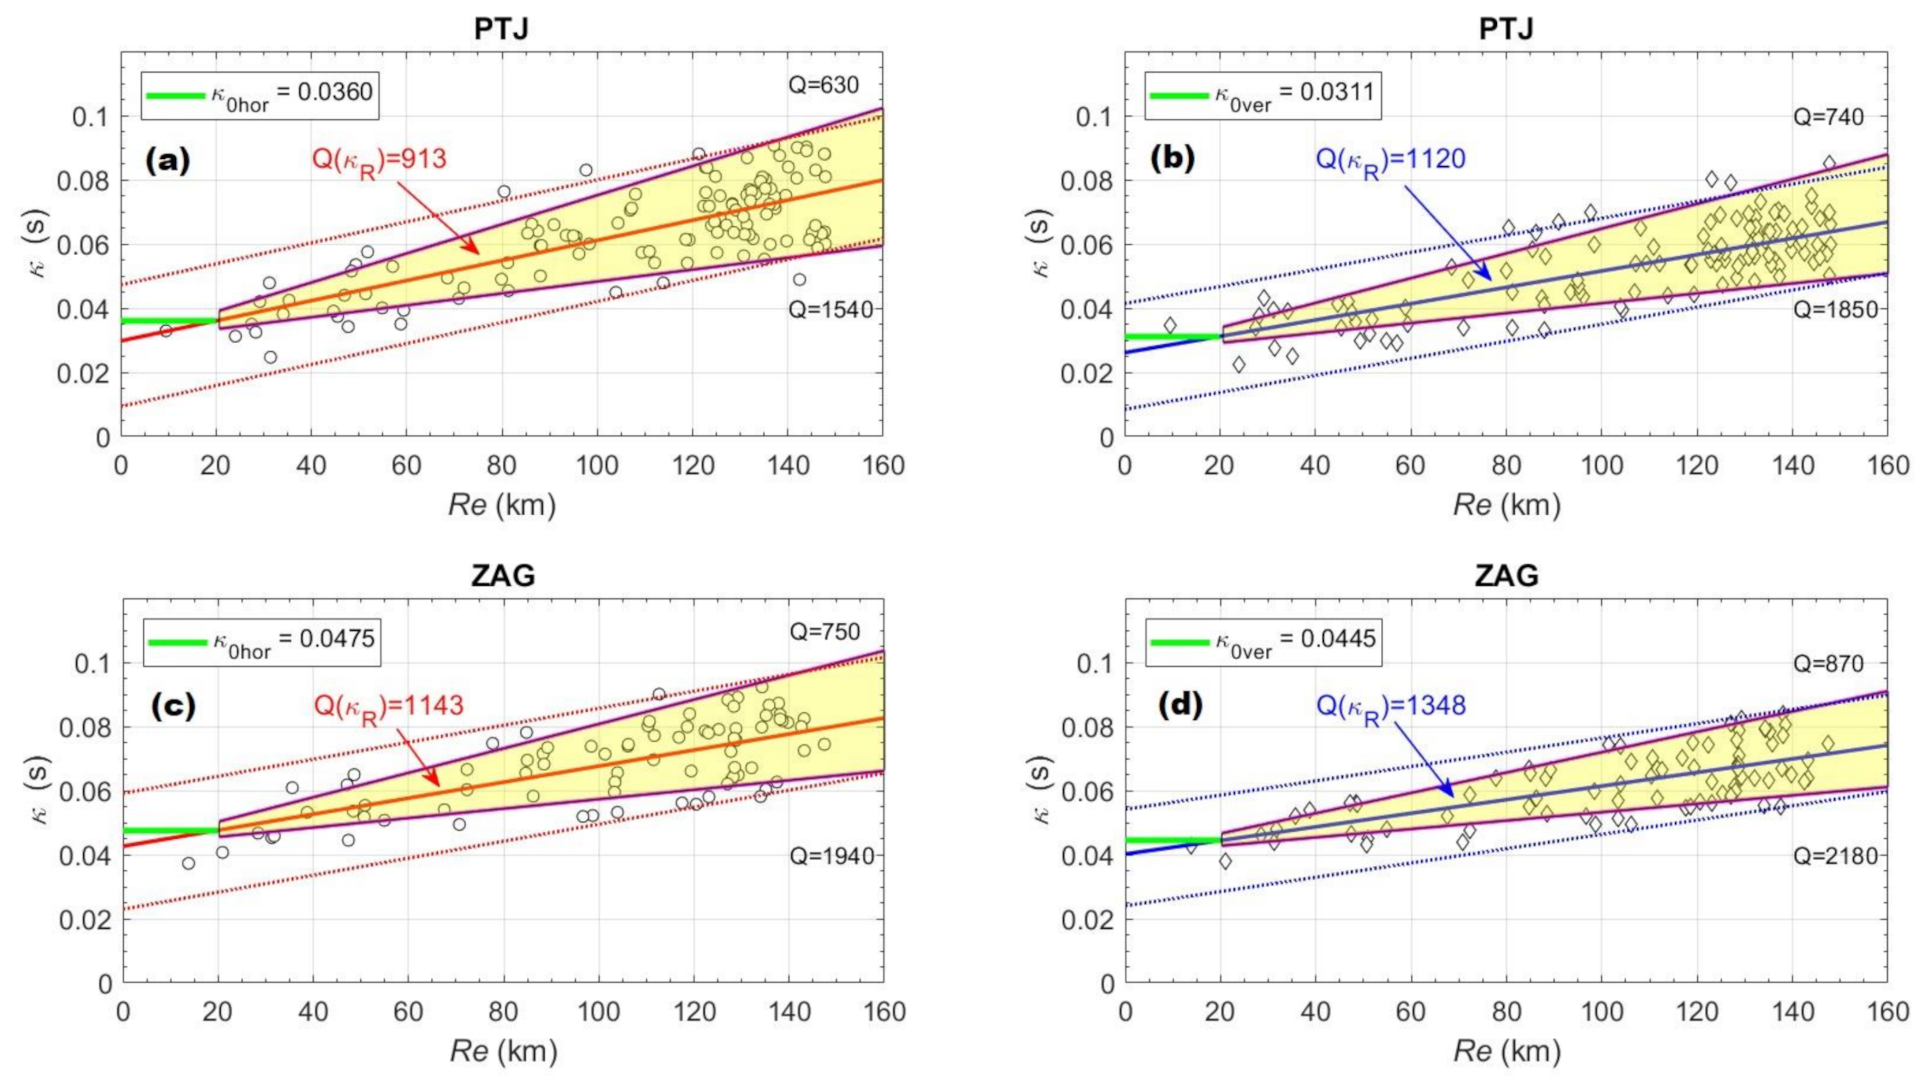
  • Site κ0 values estimated from the extrapolation to zero distance (using traditional linear regression and error-in-variables regression) are within the range of the uncertainty (±1 standard deviation) with a constrained κ0 value;
  • Estimated κ0 values for PTJ (0.0283–0.0360 s) and ZAG (0.0411–0.4750 s) correlated with VS30 values are within the range of existing κ0‒VS30 correlations, showing that κ0 has lower values for sites on harder rocks (lower attenuation) and higher κ0 values on softer rocks (higher attenuation);
  • Comparison of the high-frequency coda attenuation values with frequency independent, Qc(f) and Q(κR) for both stations can be considered comparable when looking at average values with the assumption that they are affected by the same regional characteristics;
  • The lowest κ values are spatially distributed within a few kilometres around the stations due to near-site effects;
  • Variations in observed κ distribution between lower and higher attenuation subset areas is clearly under the influence of local and regional geological structures that are distributed predominantly within regional active faults and complex tectonic structure.
Attenuation of seismic waves is one of the key factors in seismic hazard assessment. Additionally, it is important for quantification of earthquakes and plays a significant role in studies of seismic source and crustal structure. Thus, this study is a step towards the better defining of input parameters for seismic hazard and risk assessment for the wider area of the city of Zagreb.

Author Contributions

Conceptualization: D.S., S.M. and T.K.; methodology: D.S.; software: D.S.; validation: S.M. and T.K.; formal analysis: D.S.; investigation: D.S.; data curation: D.S.; writing—original draft preparation: D.S. and S.M.; writing—review and editing: S.M., T.K. and J.I.; visualization: D.S. T.K. and J.I.; supervision: S.M. and T.K.; project administration: S.M.; funding acquisition: S.M. and D.S. All authors have read and agreed to the published version of the manuscript.

Funding

This research received no external funding. The APC was funded by D.S.

Acknowledgments

The authors wish to thank to Ines Ivančić, Ivica Sović (macroseismic fieldwork) and the Croatian Seismological Survey, Department of Geophysics, Faculty of Science, University of Zagreb for the support with this study. The support is gratefully acknowledged. Copyright permission for using Figure 1 [19] obtained through Copyright Clearance Center’s RightsLink® service (order number: 4965220553234).

Conflicts of Interest

The authors declare no conflict of interest.

References

  1. Markušić, S.; Stanko, D.; Korbar, T.; Sović, I. Estimation of near-surface attenuation in the tectonically complex contact area of the northwestern External Dinarides and the Adriatic foreland. Nat. Hazards Earth Syst. Sci. 2019, 19, 2701–2714. [Google Scholar] [CrossRef] [Green Version]
  2. Brune, J.N. Tectonic stress and the spectra of seismic shear waves from earthquakes. J. Geophys. Res. 1970, 75, 4997–5009. [Google Scholar] [CrossRef] [Green Version]
  3. Hanks, T.C. fmax. Bull. Seismol. Soc. Am. 1982, 72, 1867–1879. [Google Scholar]
  4. Cormier, V.F. The Effect of Attenuation on Seismic Body Waves. Bull. Seismol. Soc. Am. 1982, 72, 169–200. [Google Scholar]
  5. Anderson, J.G.; Hough, S.E. A model for the shape of the Fourier amplitude spectrum of acceleration at high frequencies. Bull. Seismol. Soc. Am. 1984, 74, 1969–1993. [Google Scholar]
  6. Edwards, B.; Fäh, D.; Giardini, D. Attenuation of seismic shear wave energy in Switzerland. Geophys. J. Int. 2011, 185, 967–984. [Google Scholar] [CrossRef] [Green Version]
  7. Ktenidou, O.J.; Gélis, C.; Bonilla, L.F. A study on the variability of Kappa (κ) in a Borehole: Implications of the computation process. Bull. Seismol. Soc. Am. 2013, 103, 1048–1068. [Google Scholar] [CrossRef] [Green Version]
  8. Hanks, T.C.; McGuire, R.K. The character of high-frequency strong ground motion. Bull. Seismol. Soc. Am. 1981, 71, 2071–2095. [Google Scholar]
  9. Boore, D.M. Stochastic simulation of high-frequency ground motions based on seismological models of the radiated spectra. Bull. Seismol. Soc. Am. 1983, 73, 1865–1894. [Google Scholar]
  10. Boore, D.M. Simulation of Ground Motion Using the Stochastic Method. Pure Appl. Geophys. 2003, 160, 635–676. [Google Scholar] [CrossRef] [Green Version]
  11. Ktenidou, O.-J.; Cotton, F.; Abrahamson, N.A.; Anderson, J.G. Taxonomy of κ: A review of definitions and estimation approaches targeted to applications. Seismol. Res. Lett. 2014, 85, 135–146. [Google Scholar] [CrossRef]
  12. Biro, Y.; Renault, P. Importance and impact of host-to-target conversions for ground motion prediction equations in PSHA. In Proceedings of the 15th World Conference on Earthquake Engineering, Lisbon, Portugal, 24–28 September 2012. [Google Scholar]
  13. Delavaud, E.; Cotton, F.; Akkar, S.; Scherbaum, F.; Danciu, L.; Beauval, C.; Drouet, S.; Douglas, J.; Basili, R.; Sandikkaya, M.A.; et al. Toward a ground-motion logic tree for probabilistic seismic hazard assessment in Europe. J. Seismol. 2012, 16, 451–473. [Google Scholar] [CrossRef] [Green Version]
  14. Rathje, E.M.; Ozbey, M.C. Site-Specific Validation of Random Vibration Theory-Based Seismic Site Response Analysis. J. Geotech. Geoenviron. Eng. 2006, 132, 911–922. [Google Scholar] [CrossRef]
  15. Markušić, S.; Stanko, D.; Korbar, T.; Belić, N.; Penava, D.; Kordić, B. The Zagreb (Croatia) M5.5 earthquake on 22 March 2020. Geosciences 2020, 10, 252. [Google Scholar] [CrossRef]
  16. Tomljenović, B.; Csontos, L. Neogene-quaternary structures in the border zone between Alps, Dinarides and Pannonian Basin (Hrvatsko zagorje and Karlovac Basins, Croatia). Int. J. Earth Sci. 2001, 90, 560–578. [Google Scholar] [CrossRef]
  17. Schmid, S.M.; Bernoulli, D.; Fügenschuh, B.; Matenco, L.; Schefer, S.; Schuster, R.; Tischler, M.; Ustaszewski, K. The Alpine-Carpathian-Dinaridic orogenic system: Correlation and evolution of tectonic units. Swiss J. Geosci. 2008, 101, 139–183. [Google Scholar] [CrossRef] [Green Version]
  18. Herak, D.; Herak, M.; Tomljenović, B. Seismicity and earthquake focal mechanisms in North-Western Croatia. Tectonophysics 2009, 465, 212–220. [Google Scholar] [CrossRef]
  19. van Gelder, I.E.; Matenco, L.; Willingshofer, E.; Tomljenović, B.; Andriessen, P.A.M.; Ducea, M.N.; Beniest, A.; Gruić, A. The tectonic evolution of a critical segment of the Dinarides-Alps connection: Kinematic and geochronological inferences from the Medvednica Mountains, NE Croatia. Tectonics 2015, 34, 1952–1978. [Google Scholar] [CrossRef]
  20. Basch, O. Basic Geological Map 1:100 000, Sheet Ivanić-Grad; Institute of Geology: Zagreb, Croatia; Federal Geological Institute: Belgrade, Serbia, 1981. (In Croatian) [Google Scholar]
  21. Šikić, K.; Basch, O.; Šimunić, A. Basic Geological Map 1:100.000, Sheet Zagreb; Institute of Geology: Zagreb, Croatia; Federal Geological Institute: Belgrade, Serbia, 1977. (In Croatian) [Google Scholar]
  22. HGI. Geological Map of the Republic of Croatia in Scale 1:300.000; Hrvatski Geološki Institut—Croatian Geological Survey: Zagreb, Croatia, 1999; Available online: http://webgis.hgi-cgs.hr/gk300/default.aspx (accessed on 3 October 2020).
  23. Matoš, B.; Tomljenović, B.; Trenc, N. Identification of tectonically active areas using DEM: A quantitative morphometric analysis of Mt. Medvednica, NW Croatia. Geol. Q. 2014, 58, 51–70. [Google Scholar] [CrossRef] [Green Version]
  24. Vrabec, M. Style of post-sedimentary deformation in the Plio-Quaternary Velenje basin, Slovenia. Neues Jahrb. Geol. Paläontol. 1999, 8, 449–463. [Google Scholar]
  25. Kuk, V.; Prelogović, E.; Sović, I.; Kuk, K.; Šariri, K. Seismological and seismo-tectonical properties of the wider Zagreb area. Građevinar 2000, 52, 647–653. Zagreb (In Croatian) [Google Scholar]
  26. Torbar, J. Report on the Zagreb Earthquake of November 9, 1880; Book I; Yugoslav Academy of Sciences and Arts: Zagreb, Croatia, 1882; pp. 1–144. (In Croatian) [Google Scholar]
  27. Herak, M.; Herak, D.; Markušić, S. Revision of the earthquake catalogue and seismicity of Croatia, 1908–1992. Terra Nova 1996, 8, 86–94. [Google Scholar] [CrossRef]
  28. Ivančić, I.; Herak, D.; Markušić, S.; Sović, I.; Herak, M. Seismicity of Croatia in the period 2002–2005. Geofizika 2006, 23, 87–103. [Google Scholar]
  29. Ivančić, I.; Herak, D.; Herak, M.; Allegretti, I.; Fiket, T.; Kuk, K.; Markušić, S.; Prevolnik, S.; Sović, I.; Dasović, I.; et al. Seismicity of Croatia in the period 2006–2015. Geofizika 2018, 35, 69–98. [Google Scholar] [CrossRef]
  30. Van Houtte, C.; Drouet, S.; Cotton, F. Analysis of the origins of κ (kappa) to compute hard rock to rock adjustment factors for GMPEs. Bull. Seismol. Soc. Am. 2011, 101, 2926–2941. [Google Scholar] [CrossRef]
  31. Van Houtte, C.; Ktenidou, O.J.; Larkin, T.; Holden, C. Hard-site κ0 (kappa) calculations for Christchurch, New Zealand, and comparison with local ground-motion prediction models. Bull. Seismol. Soc. Am. 2014, 104, 1899–1913. [Google Scholar] [CrossRef] [Green Version]
  32. Ktenidou, O.J.; Abrahamson, N.A.; Drouet, S.; Cotton, F. Understanding the physics of kappa (κ): Insights from a downhole array. Geophys. J. Int. 2015, 203, 678–691. [Google Scholar] [CrossRef] [Green Version]
  33. Perron, V.; Hollender, F.; Bard, P.Y.; Gélis, C.; Guyonnet-Benaize, C.; Hernandez, B.; Ktenidou, O.J. Robustness of kappa (κ) measurement in low-to-moderate seismicity areas: Insight from a site-specific study in provence, France. Bull. Seismol. Soc. Am. 2017, 107, 2272–2292. [Google Scholar] [CrossRef]
  34. Dasović, I.; Herak, M.; Herak, D. Coda-Q and its lapse time dependence analysis in the interaction zone of the Dinarides, the Alps and the Pannonian basin. Phys. Chem. Earth 2013, 63, 47–54. [Google Scholar] [CrossRef]
  35. York, D.; Evenson, N.; Martinez, M.; Delgado, J. Unified equations for the slope, intercept, and standard errors of the best straight line. Am. J. Phys. 2004, 72, 367–375. [Google Scholar] [CrossRef]
  36. Ktenidou, O.J.; Silva, W.; Darragh, R.; Abrahamson, N.; Kishida, T. Squeezing kappa (κ) out of the transportable array: A strategy for using bandlimited data in regions of sparse seismicity. Bull. Seismol. Soc. Am. 2017, 107, 256–275. [Google Scholar] [CrossRef] [Green Version]
  37. Palmer, S.M.; Atkinson, G.M. The High-Frequency decay slope of spectra (kappa) for M ≥ 3.5 earthquakes on rock sites in Eastern and Western Canada. Bull. Seismol. Soc. Am. 2020, 110, 471–488. [Google Scholar] [CrossRef]
  38. Chung, D.H.; Bernreuter, D.L. The Effect of Regional Variation of Seismic Wave Attenuation on the Strong Ground Motion from Earthquakes; Technical Report: NUREG/CR-1655; UCRL-53004; INIS-XA-N-048; U.S. Nuclear Regulatory Commission: Washington, DC, USA, 1981. [Google Scholar]
  39. Allen, T.I.; Wald, D.J. Topographic Slope as a Proxy for Global Seismic Site Conditions (VS30) and Amplification around the Globe; U.S. Geological Survey Open-File Report 2007-1357; U.S. Geological Survey: Tallahassee, FL, USA, 2007; p. 69. [Google Scholar]
  40. Vs30 Models and Data–Earthquake Hazards Program–USGS. Available online: https://earthquake.usgs.gov/data/vs30/ (accessed on 24 March 2020).
  41. EN 1998-1 (2004) Eurocode 8: Design of Structures for Earthquake Resistance—Part 1: General Rules, Seismic Actions and Rules for Buildings (EN 1998-1:2004); European Committee for Standardization (CEN), European Union: Brussels, Belgium, 2004.
  42. Douglas, J.; Gehl, P.; Bonilla, L.F.; Ǵlis, C. A κ model for mainland France. Pure Appl. Geophys. 2010, 167, 1303–1315. [Google Scholar] [CrossRef] [Green Version]
  43. Reiter, L. Earthquake Hazard. Analysis: Issues and Insights; Columbia University Press: New York, NY, USA, 1990; p. 254. [Google Scholar]
  44. Stipčević, J.; Herak, M.; Molinari, I.; Dasović, I.; Tkalčić, H.; Gosar, A. Crustal Thickness Beneath the Dinarides and Surrounding Areas from Receiver Functions. Tectonics 2020, 37, 1–15. [Google Scholar] [CrossRef]
Figure 1. (a) Simplified tectonic map of the Alpine, Carpathian and Dinaric orogenic belts and the Pannonian basin. (b) Tectonostratigraphic map of the Medvednica Mountains and surrounding areas near the Alpine-Dinaridic junction. (c) Longitudinal (A) and transversal (B) cross-sections of the Medvednica Mountains (location on the Figure 1b). (from [19]). Location of seismological stations Puntijarka (PTJ-on the top of Medvednica Mountains) and Zagreb (ZAG-on the unconsolidated alluvial cover) are marked with yellow triangles.
Applsci 10 08974 g001aApplsci 10 08974 g001b
Figure 2. Spatial distribution of earthquake locations in the investigated area (373BC–2019, according to the Croatian Earthquake Catalogue-CEC, the updated version first described in [27]. Seismic zones are marked as: Zagreb-green, Novo Mesto-Krško-red, Karlovac-Metlika-blue and Pokupsko-Petrinja-yellow. Faults are marked with black lines [28,29].
Applsci 10 08974 g002
Figure 3. Statistics of the compiled ground motion dataset. (a) Re-ML distribution of recordings at PTJ and ZAG stations. (b) h-ML distribution of recordings at PTJ and ZAG stations.
Applsci 10 08974 g003
Figure 4. Example of κ calculation. (left) Station PTJ. ML = 4.2, Re = 34 km, NS component. (right) Station ZAG: ML = 3.5, Re = 128.5 km, EW component.
Applsci 10 08974 g004
Figure 5. Least-square linear regression of and Re data pairs. PTJ station: (a) horizontal model, (b) vertical model. ZAG station: (c) horizontal model, (d) vertical model. Fit regression line shown by thick lines. ±1 standard deviation-dashed lines. ±2 standard deviation-dotted lines. Vertical error-bars show the uncertainty of κ values and horizontal error-bars show uncertainty in epicentral distances with standard error set to ± 5 km.
Applsci 10 08974 g005
Figure 6. Comparison of results from different methods to estimate κ0. PTJ station: (a) horizontal model, (b) vertical model. ZAG station: (c) horizontal model, (d) vertical model. Thick green line indicates constrained κ0 value at shorter distances. Zero-distance regression line indicate the κ0 value estimated from Figure 5. Yellow range shows Q models for different slopes applied within ±2 standard deviations (dotted lines) at larger epicentral distances for a fixed κ0 value.
Applsci 10 08974 g006
Figure 7. Regional κ dependence around the PTJ and ZAG seismological stations shown as a spatial distribution of individual κ values and plotted using the natural-neighbour interpolation method. The red lines represent the possible seismogenic surface faults in Croatia. Possible active faults are marked with thick lines [28,29]. The Zagreb city area is marked with a thick black polygonal line and seismic zones Novo Mesto-Krško, Karlovac-Metlika, Pokupsko-Petrinja and Zagreb are marked with colours as shown in Figure 2. The M5.5 earthquake of 22 March 2020, with the epicentre 7 km north of the Zagreb city centre, is marked with a black star.
Applsci 10 08974 g007
Figure 8. A preliminary intensity map of the M5.5 earthquake of 22 March 2020 at 5:24 AM (UTC). The epicentre is 7 km north of Zagreb city centre and is marked with a black star.
Applsci 10 08974 g008
Table 1. Kappa regression model test using error-in-variables (method described in [35]) compared to linear least-square (LSE) regression with differences (in %).
PTJ Station
HORVER
κ0 (s)SE-κ0κR (skm−1)SE-κRκ0 (s)SE-κ0κR (skm−1)SE-κR
LSE →0.02830.00280.0003270.0000240.02490.00240.0002650.000021
Error SetYork et al. [35] Regression Test
±1 stdR = 2 km0.02870.00540.0003230.0000480.02520.00540.0002630.000048
R = 5 km0.02910.00530.0003190.0000470.02560.00530.0002590.000047
R = 10 km0.02980.00510.0003140.0000450.02610.00050.0002540.000046
Diff. %R = 2 km1.39 1.24 1.19 0.80
R = 5 km2.75 2.51 2.73 2.36
R = 10 km5.03 4.14 4.60 4.37
±2 stdR = 2 km0.02900.00270.0003210.0000230.02550.00270.0002610.000024
R = 5 km0.02980.00260.0003130.0000220.02610.00260.0002550.000023
R = 10 km0.03000.00240.0003110.0000210.02660.00250.0002500.000022
Diff. %R = 2 km2.41 1.87 2.35 1.57
R = 5 km5.03 4.47 4.60 4.37
R = 10 km5.67 5.14 6.39 6.04
ZAG Station
HORVER
κ0SE-κ0κRSE-κRκ0SE-κ0κRSE-κR
LSE →0.04110.00320.0002650.0000290.03910.00260.0002230.000024
Error SetYork et al. [35] Regression Test
±1 stdR = 2 km0.04140.00630.0002620.0000580.03930.00630.0002210.000058
R = 5 km0.04190.00620.0002560.0000570.03970.00620.0002170.000057
R = 10 km0.04260.00600.0002500.0000540.04020.00600.0002130.000055
Diff. %R = 2 km0.72 1.15 0.51 0.90
R = 5 km1.91 3.52 1.51 2.76
R = 10 km3.52 6.00 2.74 4.69
±2 stdR = 2 km0.04180.00310.0002580.0000290.03960.00310.0002180.000028
R = 5 km0.04260.00300.0002500.0000270.04020.00300.0002120.000027
R = 10 km0.04330.00290.0002440.0000260.04080.00290.0002060.000026
Diff. %R = 2 km1.67 2.71 1.26 2.29
R = 5 km3.52 6.00 2.74 5.19
R = 10 km5.08 8.61 4.17 8.25
Table 2. Summarized κ0 values estimated within different approaches compared with local site conditions based on the EC8 [41] site classification (based on approximation via correlation to topographic slope [39,40]. The range of the uncertainty with constrained κ0 value is set to ±1 standard deviation.
StationMethodHORVERVs30
EC8 Site Class
κ0 (s)SE-κ0κ0 (s)SE-κ0
PTJLSE0.02830.00280.02490.0024800 m/s
A
Error-in-variable regression0.02980.00260.02610.0026
Constrained κ00.03600.00970.03110.0084
ZAGLSE0.04110.00320.03910.0026360–800 m/s
B
Error-in-variable regression0.04260.00300.04020.0030
Constrained κ00.04750.00920.04450.0077
Publisher’s Note: MDPI stays neutral with regard to jurisdictional claims in published maps and institutional affiliations.

