Article

A Parametric Computational Study of RC Building Structures under Corner-Column Removal Situations

1
ICITECH, Universitat Politècnica de València, Camino de Vera s/n, 46022 Valencia, Spain
2
Department of Civil and Environmental Engineering, Brunel University London, Uxbridge UB8 3PH, UK
3
Department of Civil and Environmental Engineering, University of Surrey, Guildford GU2 7XH, UK
*
Author to whom correspondence should be addressed.
Appl. Sci. 2020, 10(24), 8911; https://doi.org/10.3390/app10248911
Submission received: 13 November 2020 / Revised: 30 November 2020 / Accepted: 9 December 2020 / Published: 14 December 2020
(This article belongs to the Special Issue Structural Reliability of RC Frame Buildings)

Abstract

:
Building progressive collapse is currently one of the hottest topics in the structural engineering field. Most of the research carried out to date on this topic has been focused on the structural analysis of the failure of one or more columns in a building to determine the Alternative Load Paths (ALPs) the structure can activate. Past research was mainly focused on extreme situations with high loads and large structural deformations and, to a lesser extent, research looked at lower loads used in design accidental situations, which requires a different set of assumptions in the analysis. This paper describes a study aimed at analysing accidental design situations in corner-column removal scenarios in reinforced concrete (RC) building structures and evaluating the available real ALPs in order to establish practical recommendations for design situations that could be taken into account in future design codes. A wide parametric computational analysis was carried out with advanced Finite Element (FE) models which the authors validated by full-scale tests on a purpose-built building structure. The findings allowed us to: (i) establish design recommendations, (ii) demonstrate the importance of Vierendeel action and (iii) recommend Dynamic Amplification Factors (DAFs) for design situations.

1. Introduction

Progressive collapse is one of the hottest topics in structural engineering [1,2]. In this field, many researchers have worked on independent-scenario approaches, considering the sudden removal of an element in buildings or bridges to study the consequences of an extreme event rather than studying the triggering causes of a progressive collapse. These approaches can demonstrate (or not) that the structure has a minimum level of robustness and highlight potential areas for improvement, extracting conclusions to increase the resilience of a structure against accidental actions. Research studies to date have concentrated on both computational simulations (e.g., [3,4,5,6,7,8,9,10,11,12,13,14,15,16]) and experimental analysis (e.g., [17,18,19,20,21,22,23,24,25,26,27,28]), together with studies of real events of progressive collapse [29,30,31,32].
Few experimental studies are available on reinforced concrete (RC) building structures, particularly on purpose built full-scale structures subjected to sudden removal of columns [28,33]. Most of the cases studied with sudden column removal have been on subassemblies, including cases involving internal and edge columns (e.g., Qian et al. [34]) and, to a lesser extent, on corner columns (e.g., [35]), although the columns in the latter case are more vulnerable to accidental events [28]. Due to the small number of tests on full-scale buildings, only a few of the computational models found in the literature have been fully validated.
The aim of this paper was thus to make a thorough parametric study based on a validated Finite Element (FE) analysis and high performance models of a purpose-built full-scale RC building structure under a corner-column removal situation experimentally tested in a previous work carried out by the authors [28]. This is part of the research significance and novelty of the paper, together with its focus on design accidental situations according to the actual load combinations established in the codes [36,37,38] so as to set: (i) Alternative Load Paths (ALPs) activated after the sudden loss of a corner-column, (ii) Dynamic Amplification Factors (DAFs) or Load Increase Factors (LIFs) and (iii) key aspects of building design and recommendations for achieving safe structures. This work is focused on predicting the response to failure of one of the members in the structure after column removal which could trigger progressive collapse; the propagation of failure after this point is not within the scope of this paper.
The paper is organised as follows: Section 2 contains a description of the study carried out, including the building and the test itself, the FE model, its validation and the parametric study. The results obtained are given in Section 3, while Section 4 contains the discussion on the activation of the ALPs and considers key aspects for the design of robust structures against corner-column removal situations and the definition of the DAFs and LIFs obtained in relation to the parameters studied. The main conclusions are given in Section 5.

2. Description of the Study

2.1. Description of the Building and Test

A full-scale RC building structure, purpose built for the experiment and previously analysed by Adam et al. [28] and Buitrago et al. [27], was used for the computational analysis and parametric study described here. The building consisted of two floors and 2 × 2 bays with 0.30 × 0.30 m2 columns and flat-slabs that were 0.20 m thick. The distance between column edges was 5 m and the floor-to-ceiling height was 2.8 m. B500S reinforcement steel bars (yield stress of 500 MPa) were used for the reinforcement of slabs and columns. The design of the building followed the requirements of Eurocodes [38,39,40]. A more detailed description of the reinforcement bars of the concrete elements can be found in Adam et al. [28]. Table 1 gives the concrete mechanical properties of slabs and columns obtained on the day of the test, which have been used in the FE model validation.
The building was subjected to a sudden corner-column removal [28]. In addition to the self-weight of the structure, a superimposed uniformly distributed load was considered on each floor. That load was equal to 5.3 kN/m2 and applied to a tributary area of 5 × 5 m2 on the corner bay where the column was to be removed. At the edges of this corner bay, a façade load of 0.56 kN/m was also applied on the first floor simulating the load of a hypothetical outer wall. The resulting load configuration represents a design load case under accidental scenarios [28,36]. Figure 1 contains a sketch and a photograph of the loads (in red in the sketch) and the building prepared for the test.

2.2. FE Model

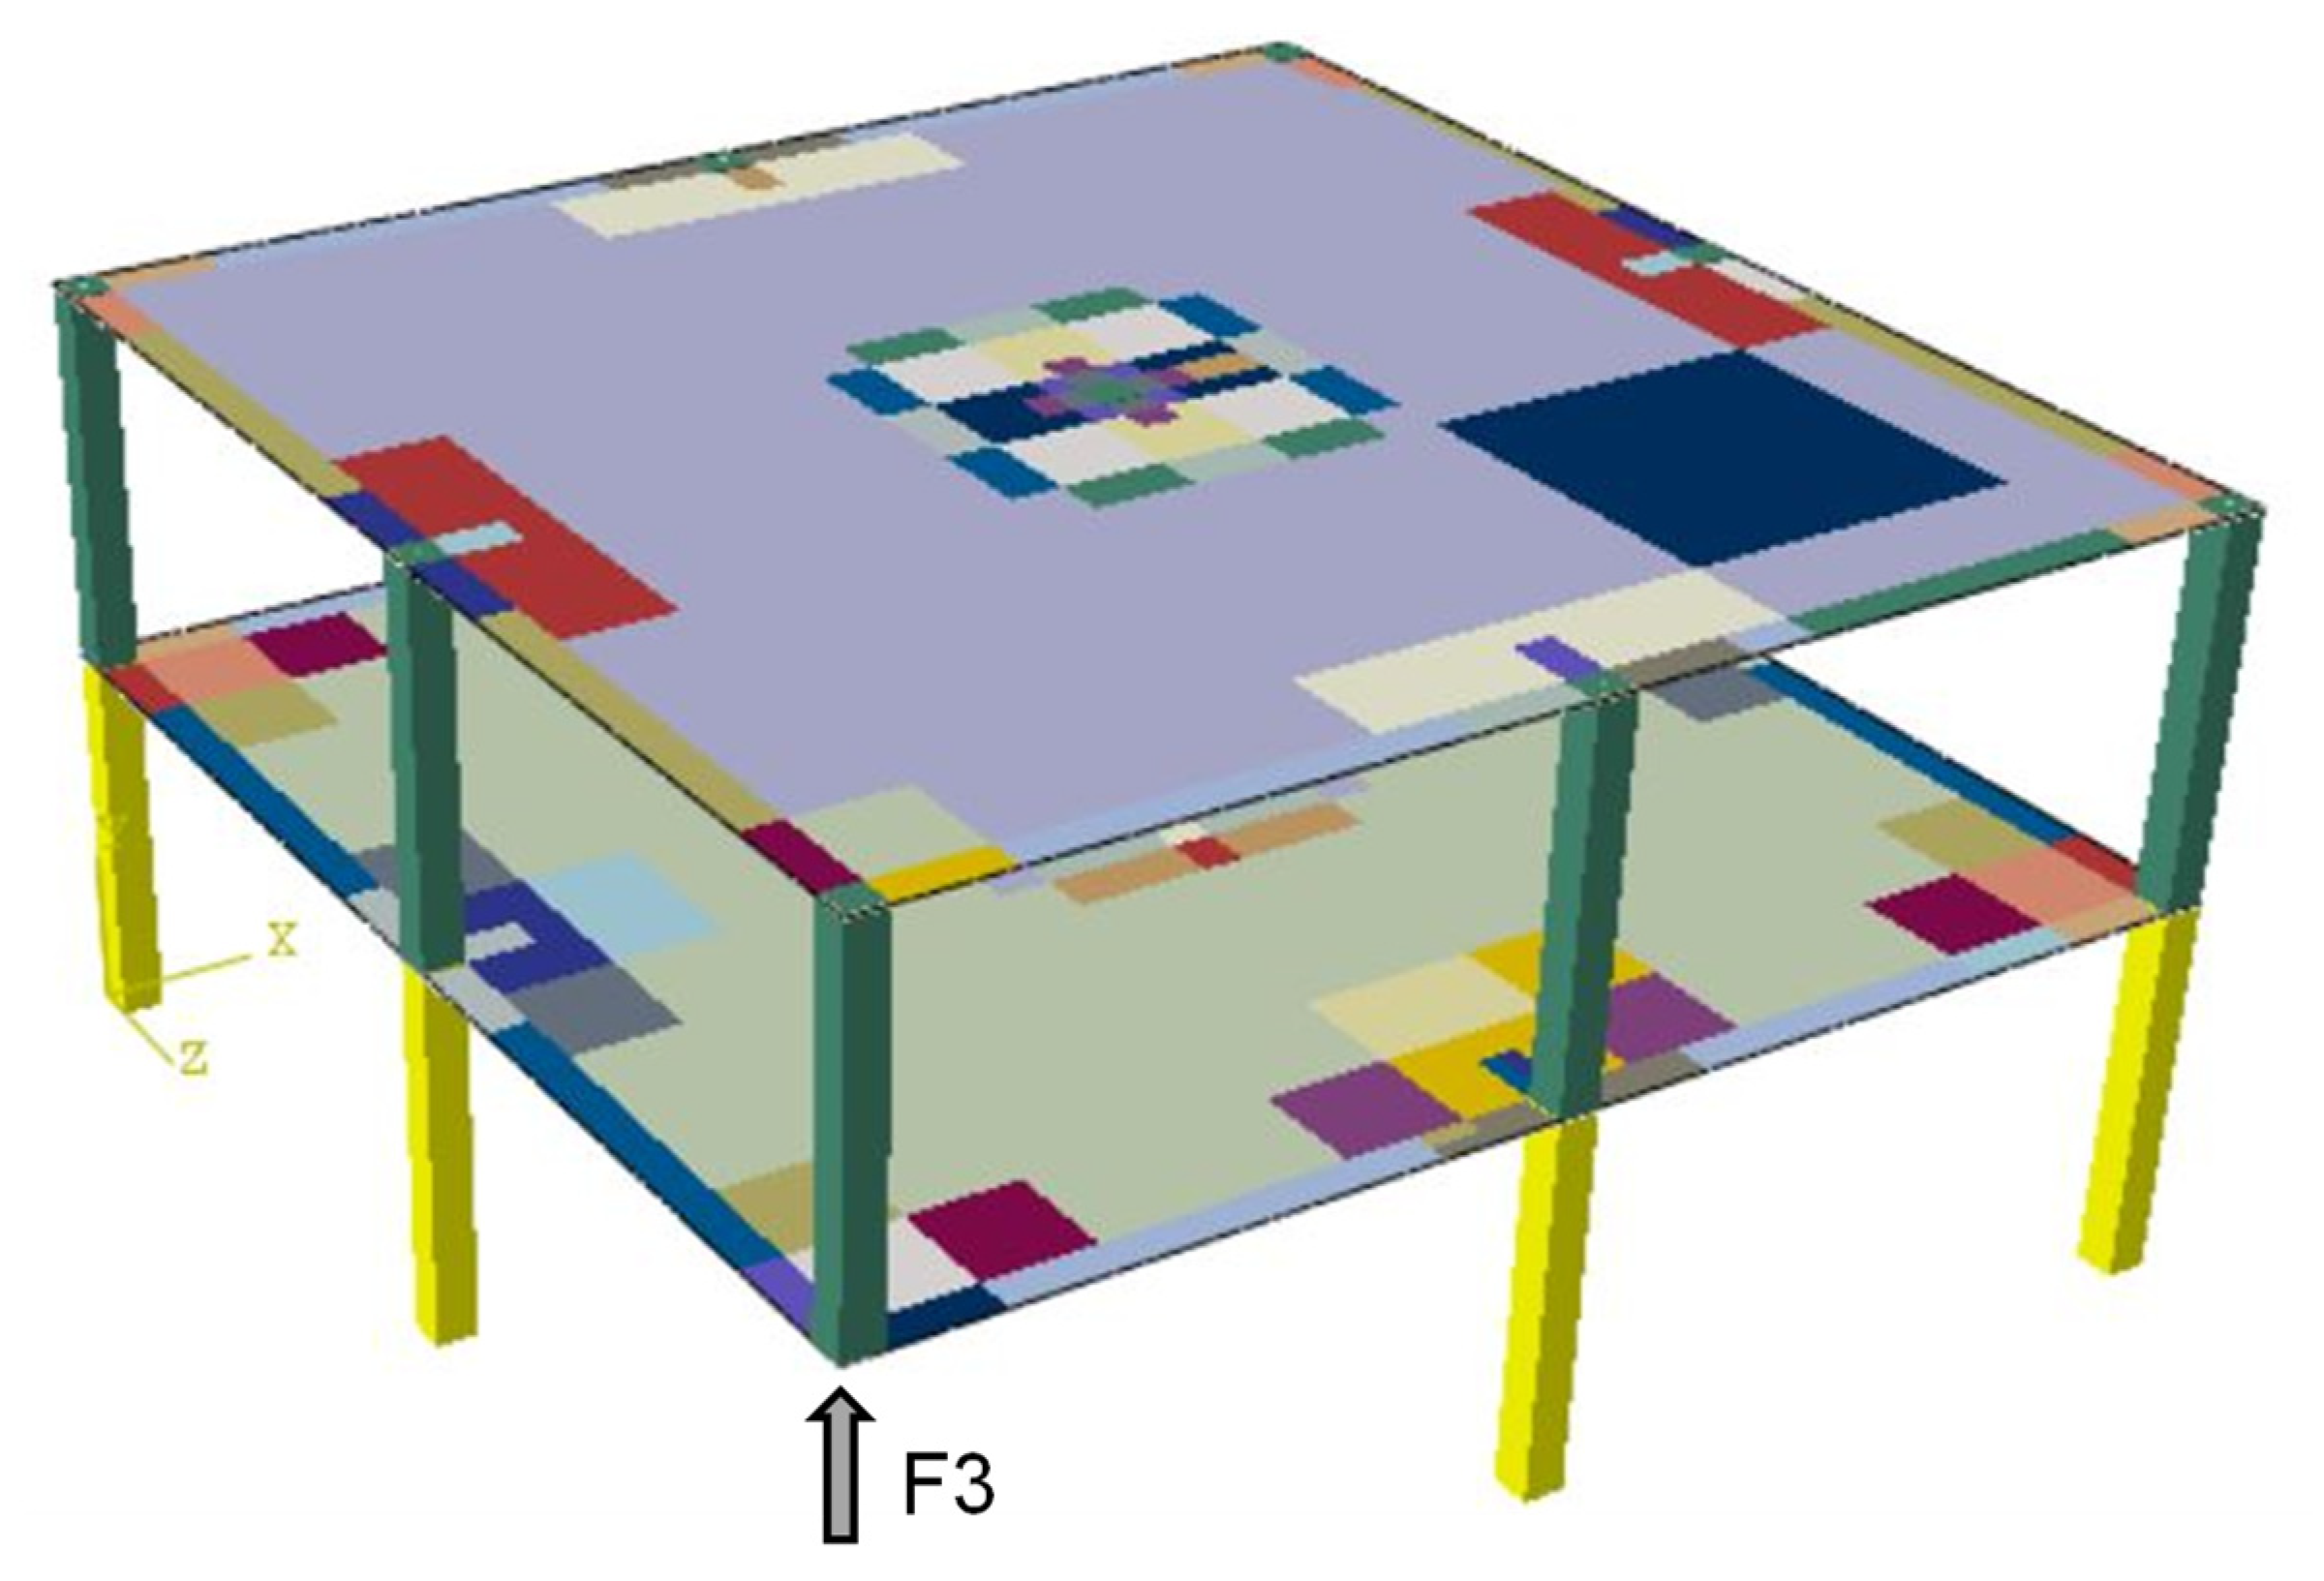
A Finite Element (FE) model was developed with the dimensions of the real building on ABAQUS/Explicit software [41]. Columns were modelled as beam elements (element B31 [41]) and slabs as area elements with hourglass control (element S4R [41]). The FE model considered non-linear slab concrete and steel reinforcement behaviour. For the sake of simplicity, the columns were modelled using a linear-elastic behaviour with an elastic modulus (see Table 1) and a Poisson ratio of 0.2. It should be noted at this point that the columns’ linear-elastic behaviour was supported by the lack of damage to these elements during the test. The ABAQUS concrete damage plasticity model [12,41,42,43,44,45] was used for the concrete in the slabs, including concrete cracking and crushing for tensile and compressive behaviour, respectively. Compression was defined from Eurocode 2 [40] considering the mechanical parameters given in Table 1. Concrete tension behaviour was defined by a bilinear softening stress-strain response after reaching its maximum tensile strength, fct (Table 1). This bilinear response was defined by an intermediate point with a strain of 5.5 × 10⁻⁴, stress equal to 0.33 fct and a final point with a strain of 25 × 10−4 and a stress equal to fct/100 [46]. Damage was also introduced in the model in terms of tension and compression damage [41] by defining two independent parameters, named dt and dc, respectively. Both parameters are used to identify the inelastic behaviour of concrete when subjected to tensile and compressive stresses in the presence of tensile cracking and compressive crushing, respectively. In both cases, multilinear relationships are assumed as it is considered in ABAQUS by default [41]. The rest of the parameters of the damage plasticity model, such as the dilatation angle, eccentricity, fb0/fc0 and K, were considered by default [41]. The steel reinforcement bars (yield stress of 500 MPa, Young modulus of 200,000 MPa and Poisson ratio of 0.3) were introduced in the slabs using perfect bond smeared layers [28]. The measured strain rate in the tests were lower than 1/s, as discussed in [13]. Strain rate values registered during the test with Digital Image Correlation (DIC) showed a peak strain rate value of 0.32/s, which in concrete structures is normally representative of small dynamic events such as earthquakes or heavy traffic. Micallef et al. [47] showed that, for values less than 10/s, this effect can be ignored as it was adopted in the FE analysis. Figure 2 shows the FE model that was developed.
The self-weight of the structure was automatically considered by the FE model based on the density of the materials (25 kN/m3 and 78.5 kN/m3 for concrete and steel, respectively). The superimposed experimental load was also modelled as uniform and line loads in the FE model. Fully-fixed boundary conditions were adopted for the bottom nodes of the ground columns, while nodes in the slab belonging to the intersections with the columns were coupled as plate constraints to ensure that all the nodes in these regions had rigid body displacements.
Dynamic non-linear mechanical and geometrical analyses (DNLA) using explicit calculations were performed for both FE validation and the subsequent parametric study. Rayleigh damping [41] was considered according to the values obtained experimentally, neglecting stiffness proportional damping and considering mass proportional damping [48], which is directly proportional to the damping coefficient (ζ = 7.3%; based on the test results [28]) and the fundamental period of the structure after column removal (T1 = 0.2785 s; based on the test results [28]). A preliminary step with static-linear analysis (SLA) was carried out to obtain the load of column P3 before its sudden removal. This force (F3) was then applied to the model prepared for the DNLA. The removed column (P3) was not modelled in this analysis (Figure 2) but was substituted by the equivalent force F3 obtained from the SLA. During DNLA, the concentrated load, F3, and the gravity loads (i.e., self-weight and superimposed loads) were increased gradually in the first step (from t = 0 s to t = 1 s) to obtain a stable response of the structure and zero vertical displacement in the position of the concentrated force, F3 (column P3 before column removal). In the second step, the concentrated force, F3, was gradually deactivated, as defined by the column removal time parameter. For the FE validation, this column removal time parameter was given a value of 0.1 s, i.e., the value obtained in the test [28]. The third step was defined until t = 2 s to analyse the dynamic non-linear structure response after the corner-column removal.

2.3. FE Model Validation

This section describes the validation of the FE model using experimental results [28] such as vertical and horizontal structural displacements, axial forces on columns and the structural damage after the column removal. It should be noted that the experimental measurements were obtained considering the column removal action only, so only displacement or force increments can be considered for comparison within experimental and numerical results.
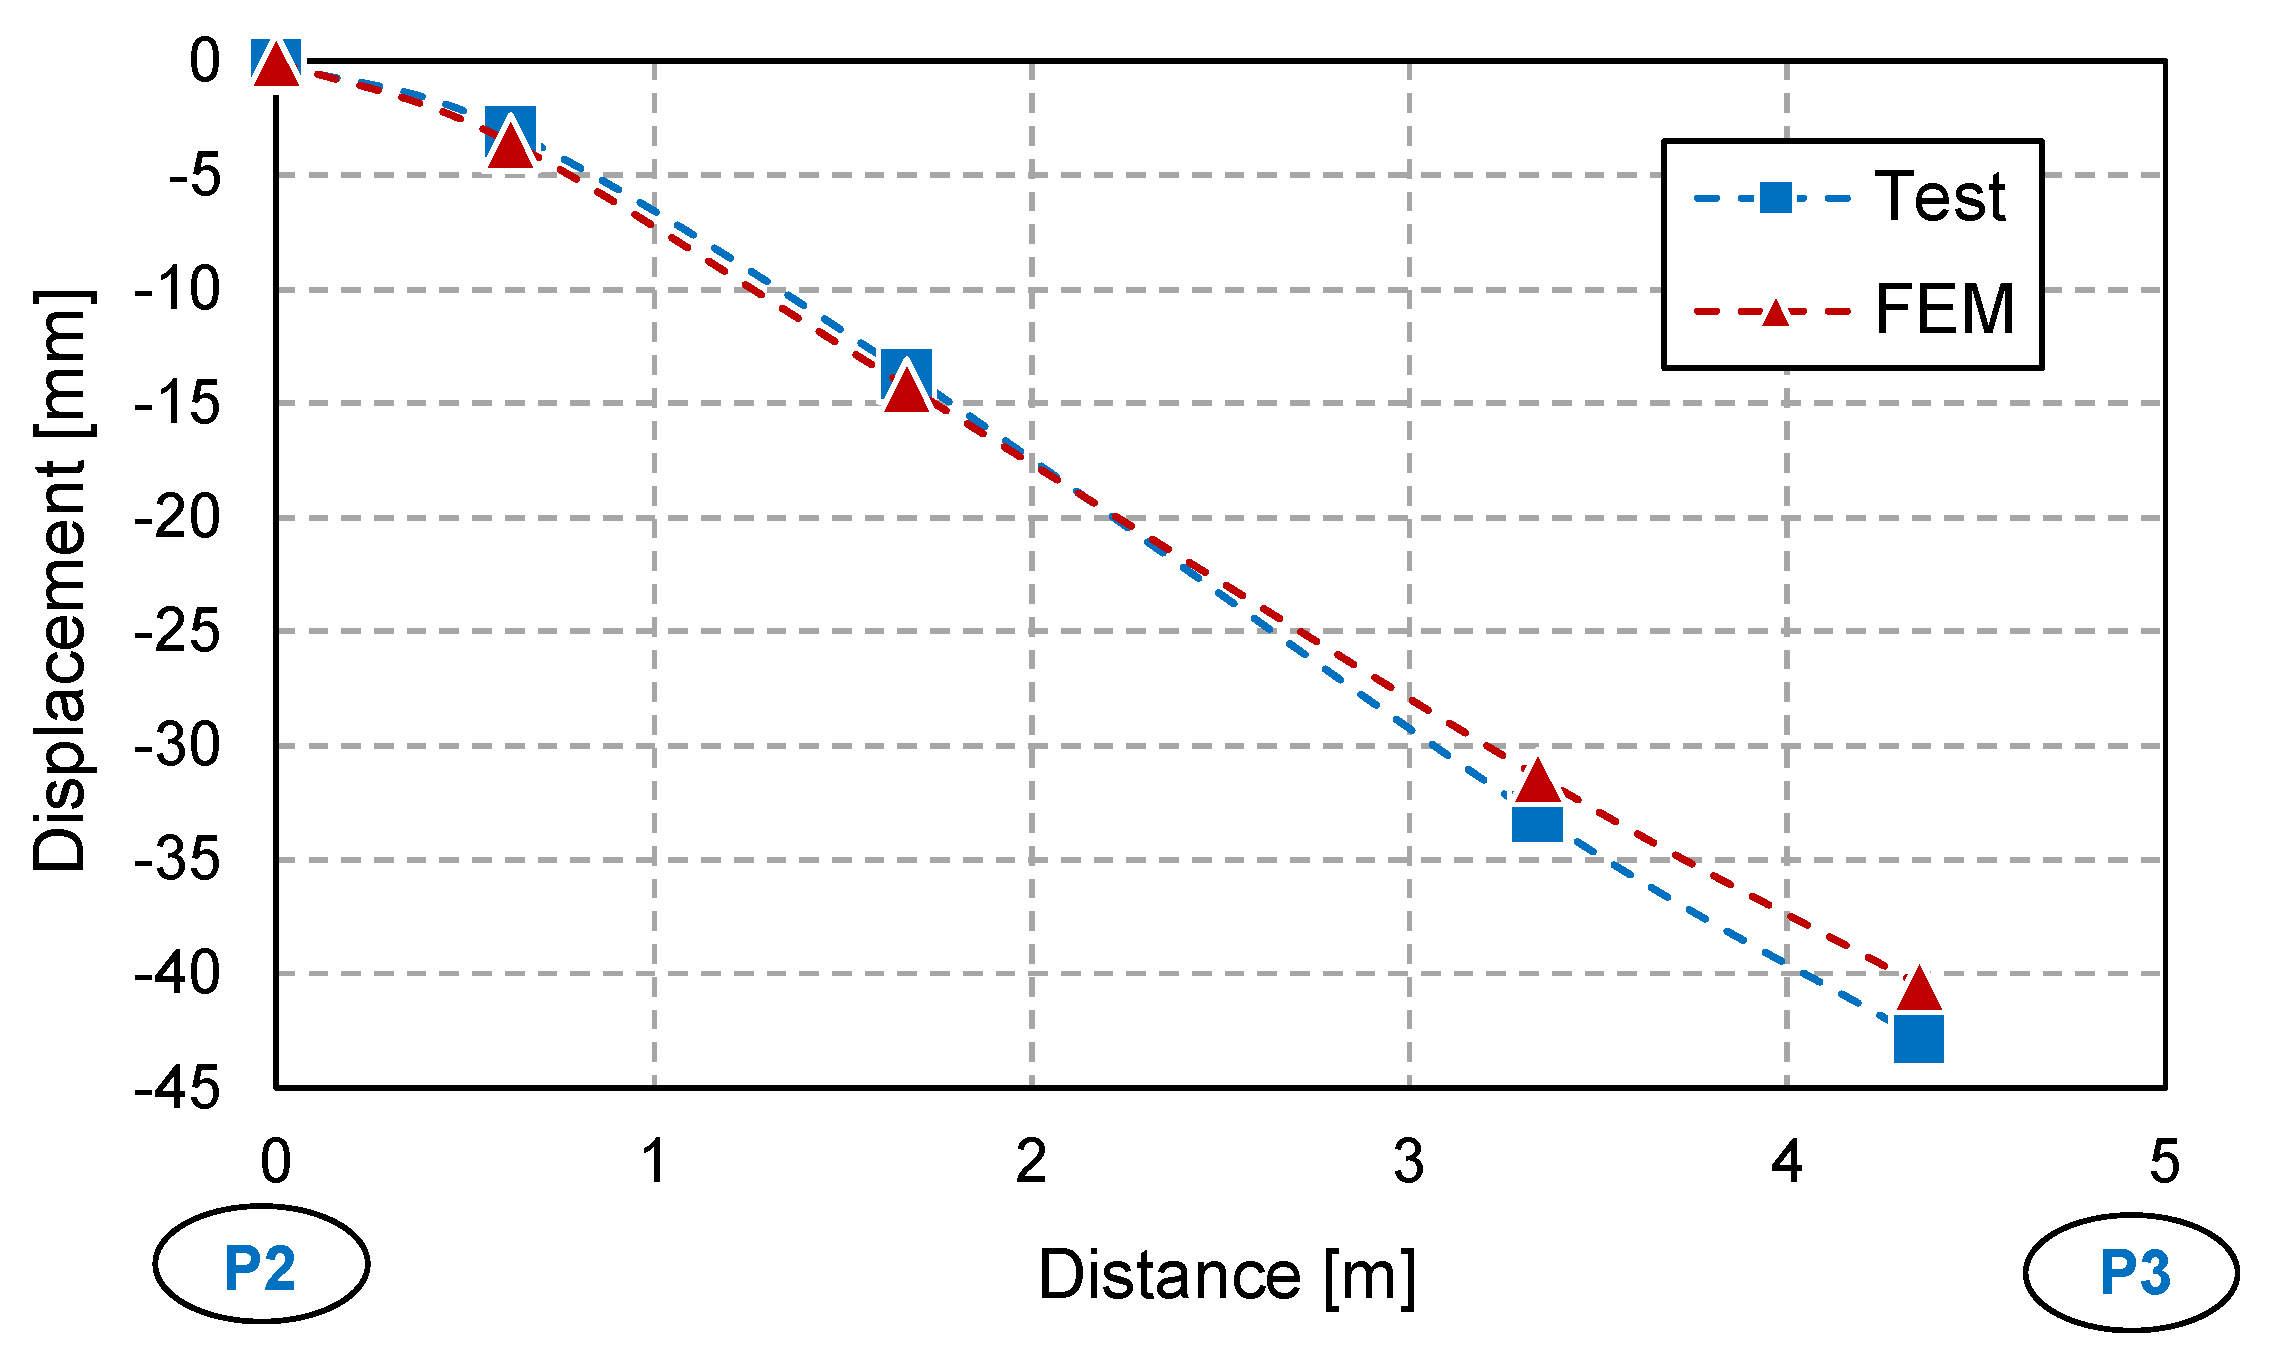
The vertical deformed shape of the first slab was measured during the test at 5 points along the corner-bay edge of the 1st floor slab connecting columns P2 and P3 (the column that was removed). Displacements were also measured at the same points in the FE model. As can be seen in Figure 3, the FE model precisely reproduced the vertical displacements.
The remaining or residual structural drift values were also compared in the test and the FE model. Figure 4 compares both sets of values. The FE model can be seen to match with the test results in the 1st slab and is slightly different in the 2nd slab. Nevertheless, the error is less than 1 mm, so the FE adequately reproduces the structural horizontal displacements.
The peak structural dynamic response values were also measured after removing the column in both the test and the FE model for the drift and the vertical displacement in the position of P3. The results are given in Table 2 and include the error involved. The FE model comes closer to the experimental residual values than the peak values, although these errors are quite low.
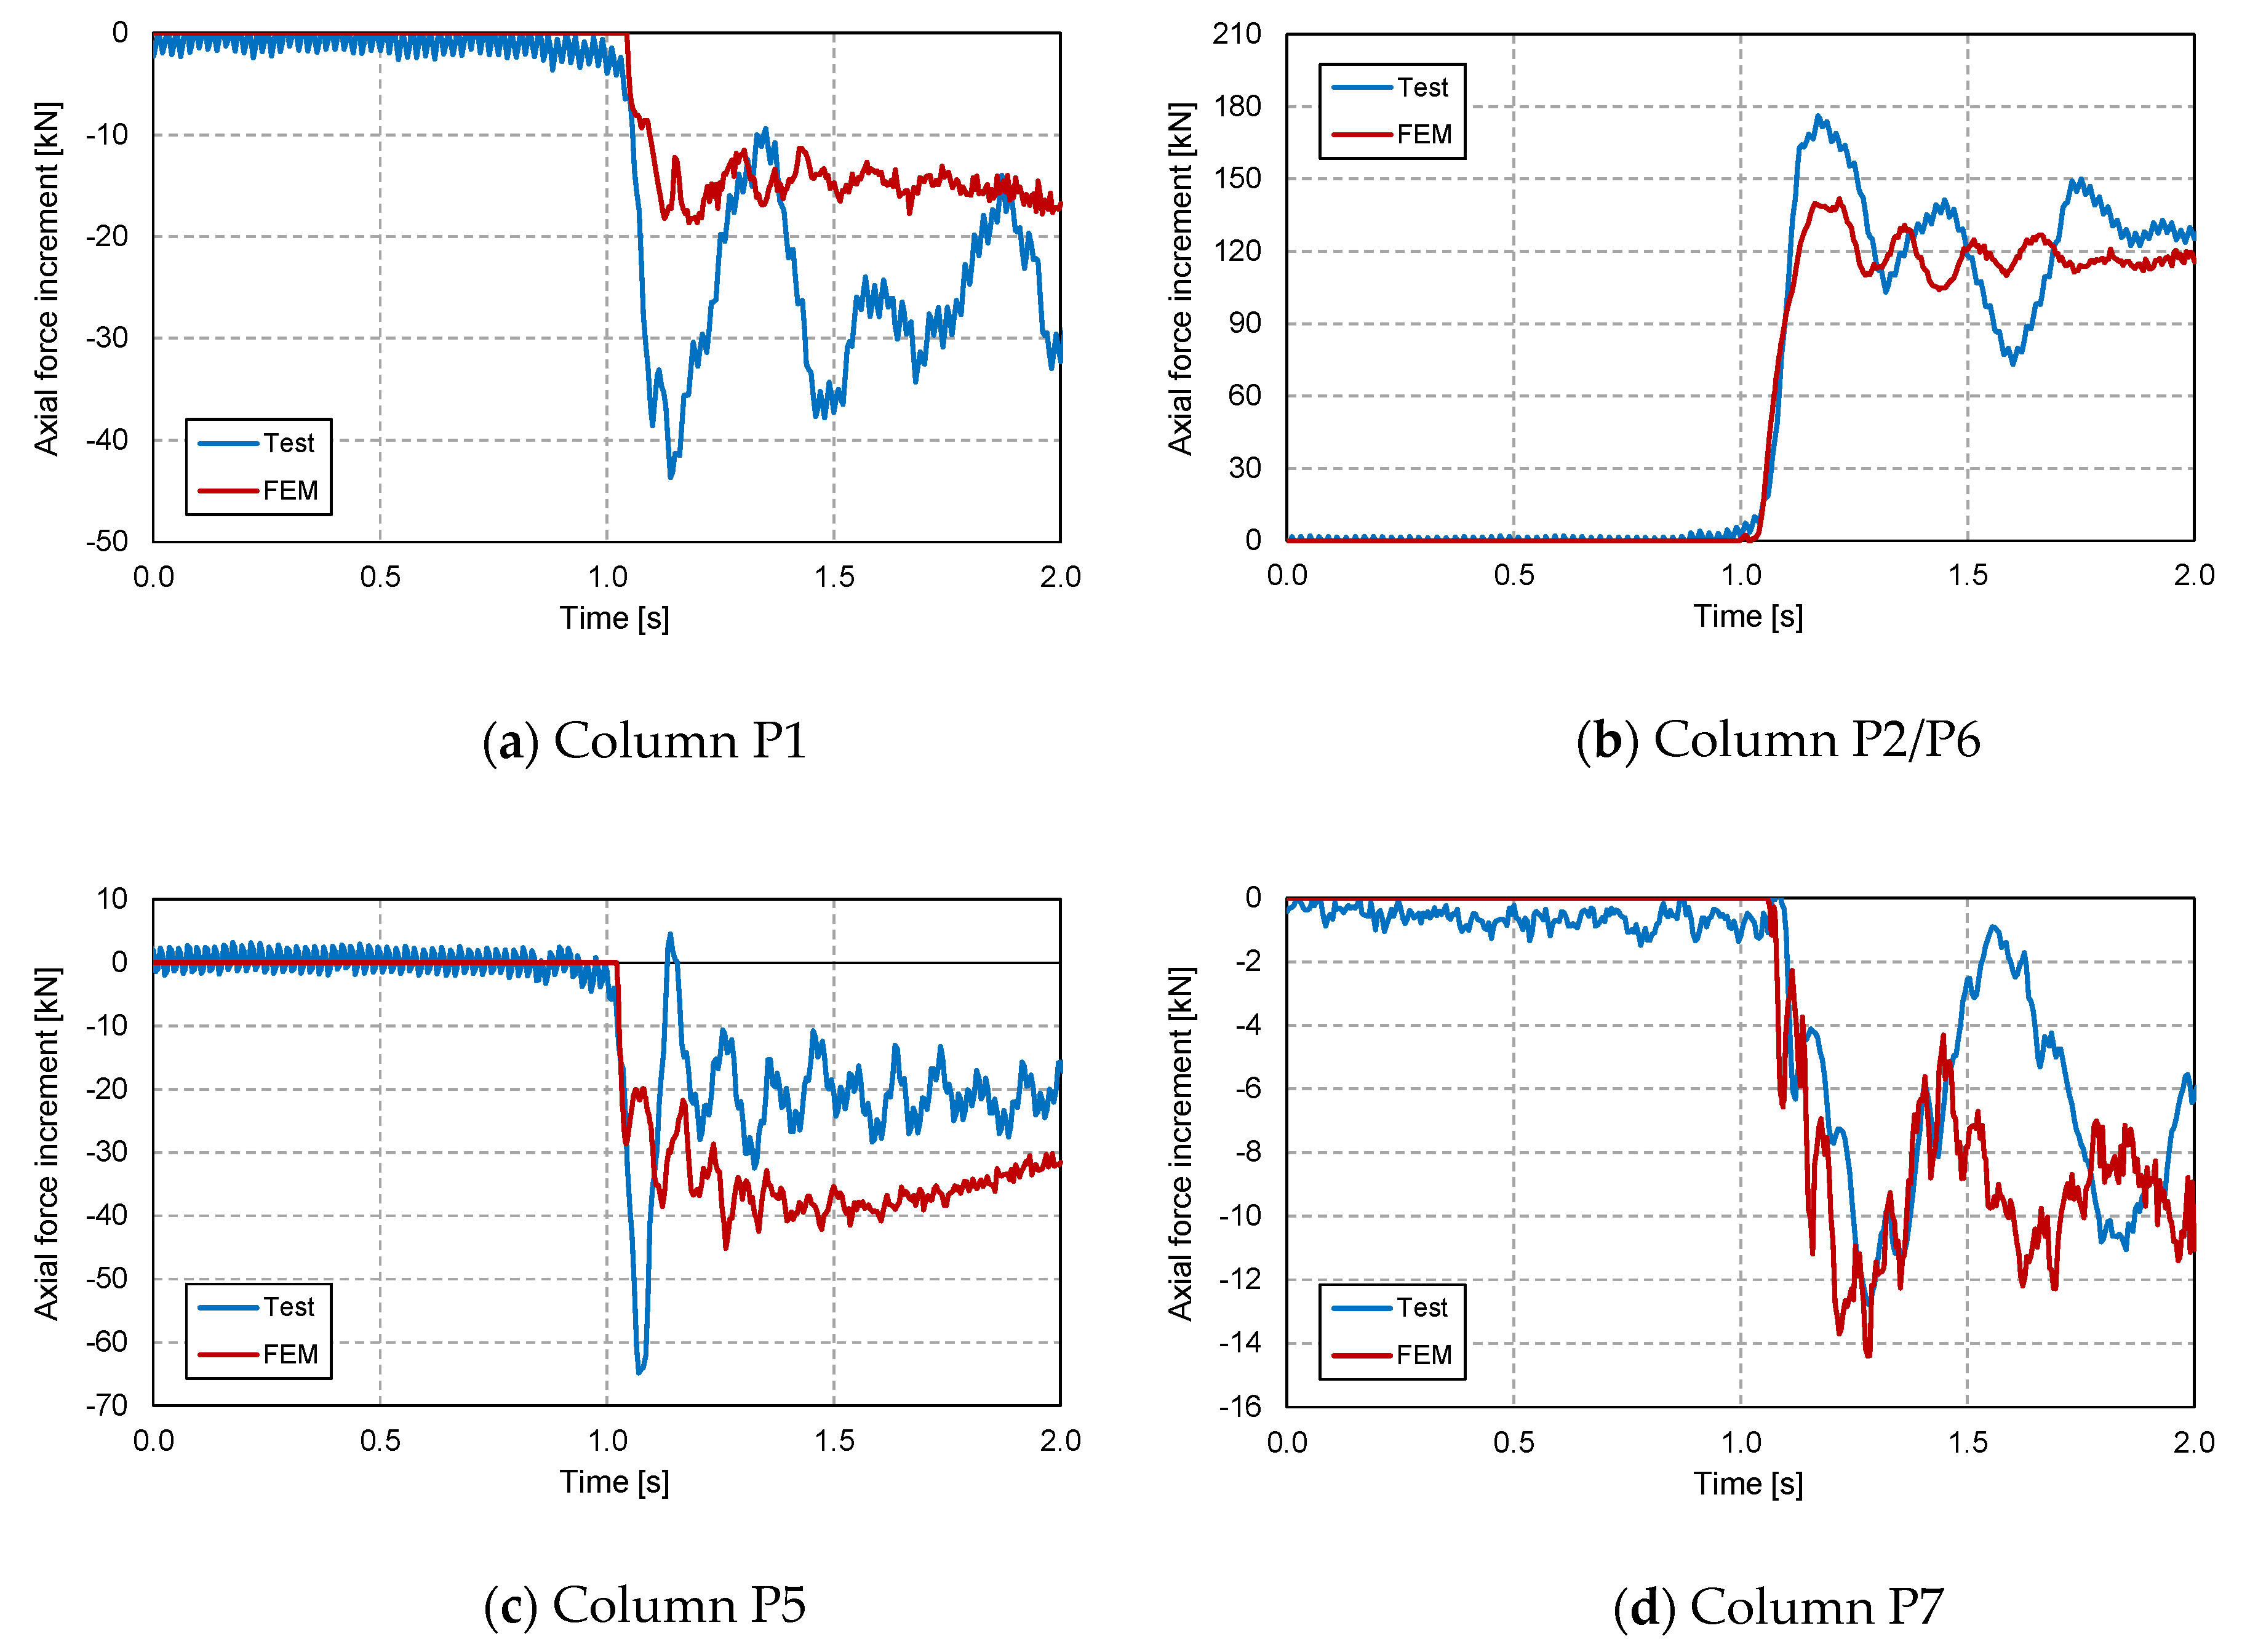
Figure 5 shows time-history comparisons between the axial force increments in the FE model (FEM) and the test for columns P1, P2/P6, P5 and P7. The comparison is shown from t = 0 s to t = 2 s, where t = 1 s is the start time of the column removal. Columns P2/P6 show a good correlation within experimental and numerical results. In this case, the average of these columns’ experimental values (P2/P6 = (P2 + P6)/2) was calculated for correct comparison with the numerical values. The removal of corner column P3 increased the compressive axial load in columns P2 and P6 and decreased it in columns P1, P5 and P7. The comparison between the experimental and the FE model shows a good correlation, reaching similar load values with a dynamic response. Particularly, this is reproduced more realistically in columns P2/P6, P5 and P7 than in column P1.
The level of damage sustained in the test was also compared with the FE model results. Figure 6 shows this comparison in terms of the computed damage in tension of the slabs and a picture of the cracks that appeared during the test.
The different comparisons generally show good correlation between the test and the FE model results for displacements, forces and slab tensile damage. Thus, the model might be considered validated for further parametric studies. Residual values show better estimates than peak values in respect of the test results, although both are good enough for the subsequent parametric analysis and have some implications in the discussion section (described in detail in Section 4.2).

2.4. Parametric Study

The parametric study analysed the influence of five different structural response parameters of the building under study. The results are given and discussed in the following sections. The five parameters considered were (i) tensile concrete strength (fct), (ii) flexural reinforcement ratio around the P2/P6 column-slab joint (ρ), (iii) number of floors (nf), (iv) column removal time (crt) and (v) the applied superimposed load (q). Ten different models were processed, establishing the model described in Section 2.3 as the reference model but considering the same tensile strength (2.0 MPa) for both slabs. Models built for the parametric study vary by only one parameter at a time. Three different fct values were considered: 2.0, 2.5 and 3.0 MPa, the lowest value being similar to the experimental one and adopting two higher levels. The flexural reinforcement ratio around the P2/P6 column-slab joint was approximately equal to 0.8%, which could be considered relatively high, so a value of 0.5% was also considered. The number of floors was also taken into account due to its possible influence in the Vierendeel action and the dynamic response, adding two and five extra levels to those of the test (i.e., four and seven floors). As the column removal time clearly affects the dynamic response of the structure, for this parameter, three extra levels were considered: 0.01 s, 0.05 s (both smaller than that in the test) and 0.2 s (higher than that in the test). The lower value is acceptable according to the limit of T/10 [36], where T (vibration period) was 0.28 s according to the experimental results. The applied superimposed load was also increased from 5.3 kN/m2 to 9 kN/m2, which represents the maximum design load for a Ultimate Limit State (ULS) in persistent and transient design situations and was also near the flexural capacity of the slab. Table 3 shows the parameter values in each model.

3. Results

This section presents the results obtained by the FE model. The numerical outcomes are organized in subsections, each one dealing with a specific result: vertical displacements, horizontal drift, vertical reactions in different columns and tensile damage maps in the building.

3.1. Vertical Displacement

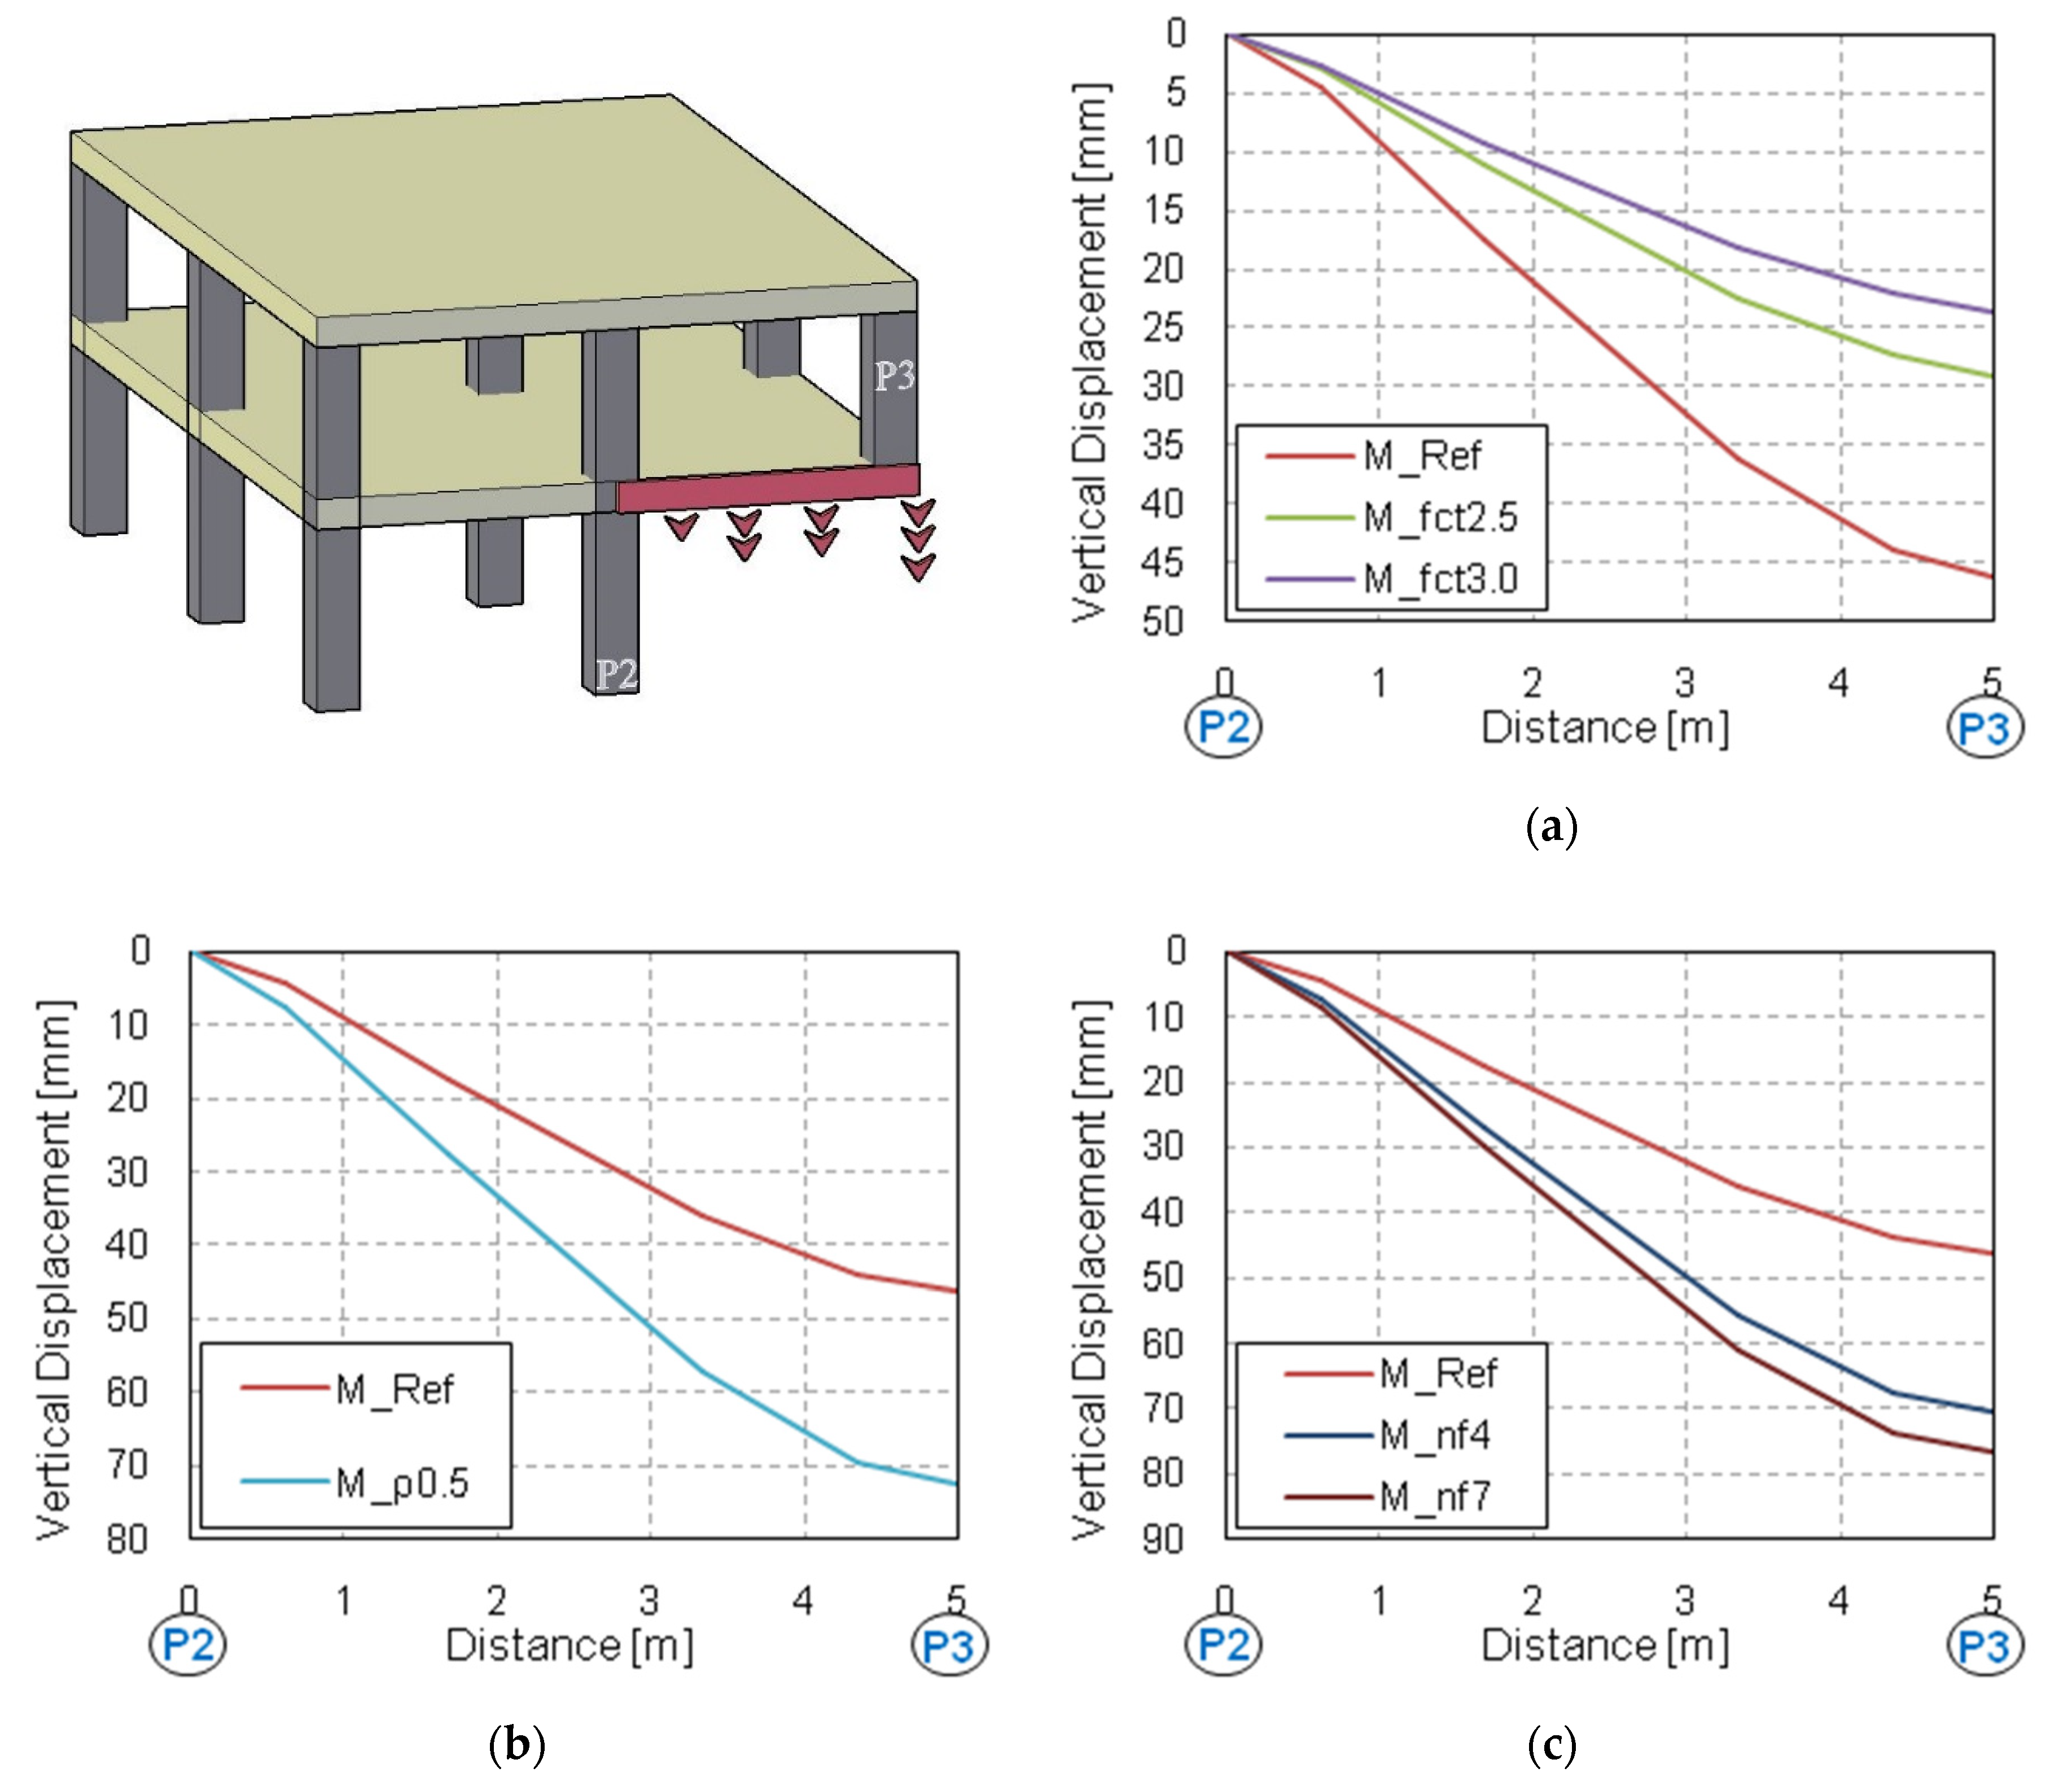
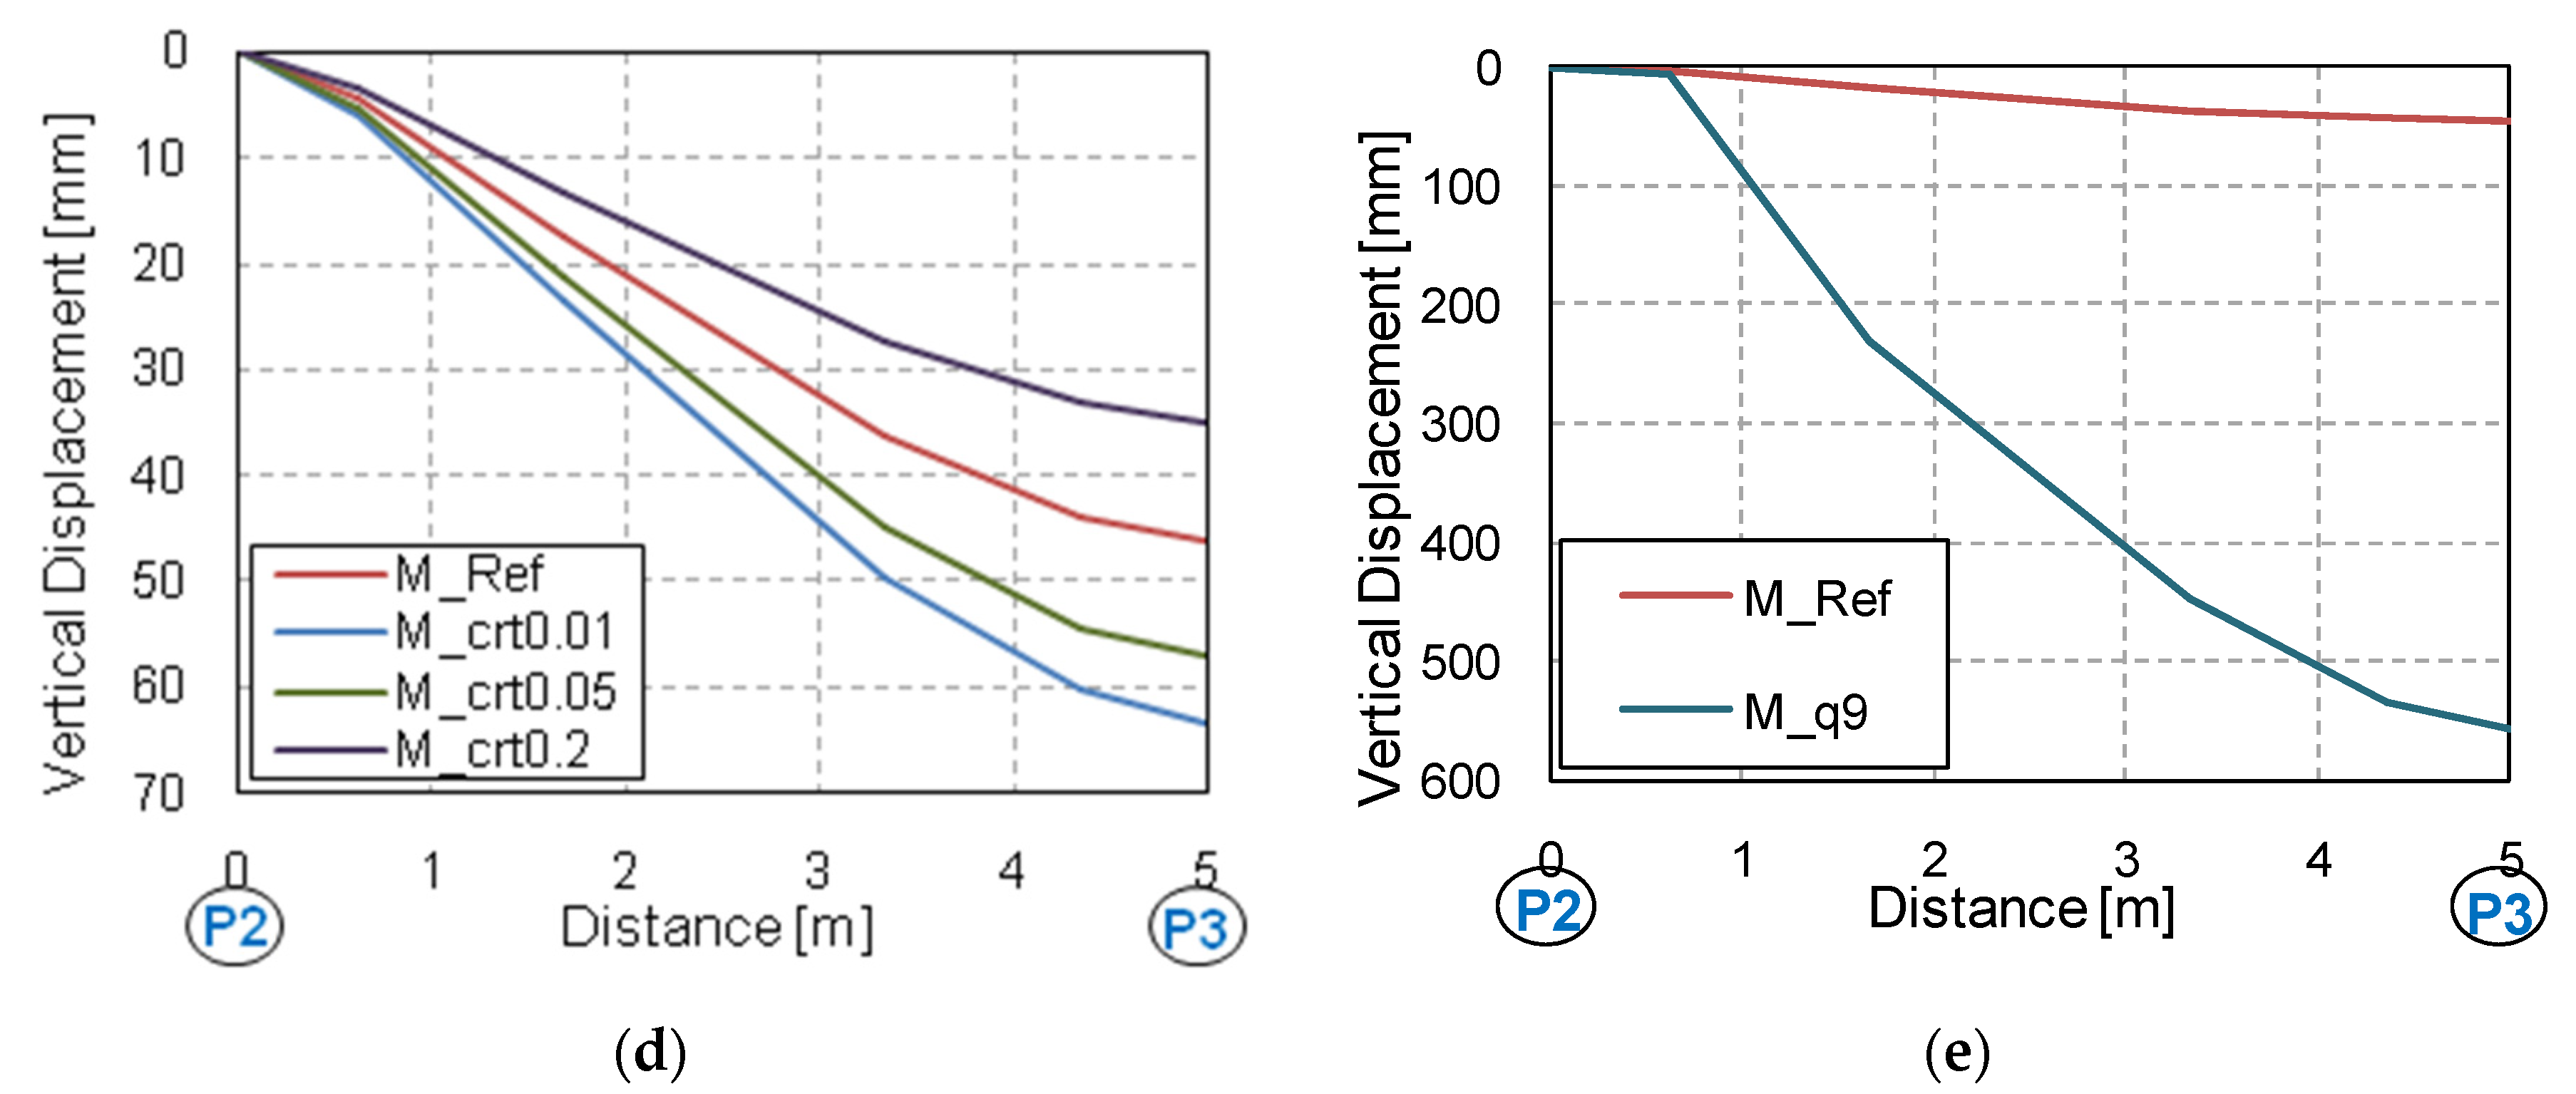
The deformed shape extracted from five points along the corner-bay edge of the 1st floor slab connecting columns P2 and P3 is depicted in Figure 7. As can be seen, the results are organized into five sets of simulations according to each parameter. It is worth mentioning that each group compares the FE outcomes obtained and the results provided by the reference Model (i.e., M_Ref). The deformed shapes shown in Figure 7 were obtained using the residual vertical displacements. Table 4 contains a summary of the peak and residual values obtained at these five points.
As expected, the deformed shapes depicted in Figure 7a–d present a similar trend of the vertical residual displacements with slight variations depending on the group of simulations. As an example, the results from the first group of simulations (i.e., obtained varying the tensile concrete strength) are depicted in Figure 7a and show a similar trend in slab deformation with a negligible reduction of vertical deformability due to the higher concrete tensile strength (and therefore lower tensile damage) experienced by the models during the simulations. Similar outcomes are visible in Figure 7b–d. In all those models, the maximum residual vertical displacement was lower than 100 mm, as seen in Table 5, which also gives a summary of the maximum vertical residual displacement in P3 and the corresponding increase/decrease percentages obtained in all models with respect to the reference model. The results shown in Figure 7e refer to the last group of simulations, in which the superimposed load was significantly higher than in the reference model and reached a value related to the ULS for flexure. The effect of the increased superimposed load is clearly visible in the deformation. As expected, this load yielded the corner-bay slab with a quasi-non-restricted residual vertical displacement of 550 mm in the position of column P3. This is also confirmed by the tensile damage maps given in Section 3.4. The distribution of the tensile damage throughout the building clearly shows the formation of a yielding mechanism. This case lead to large deflections (larger than the thickness), and this would normally lead to the activation of membrane actions.

3.2. Drift

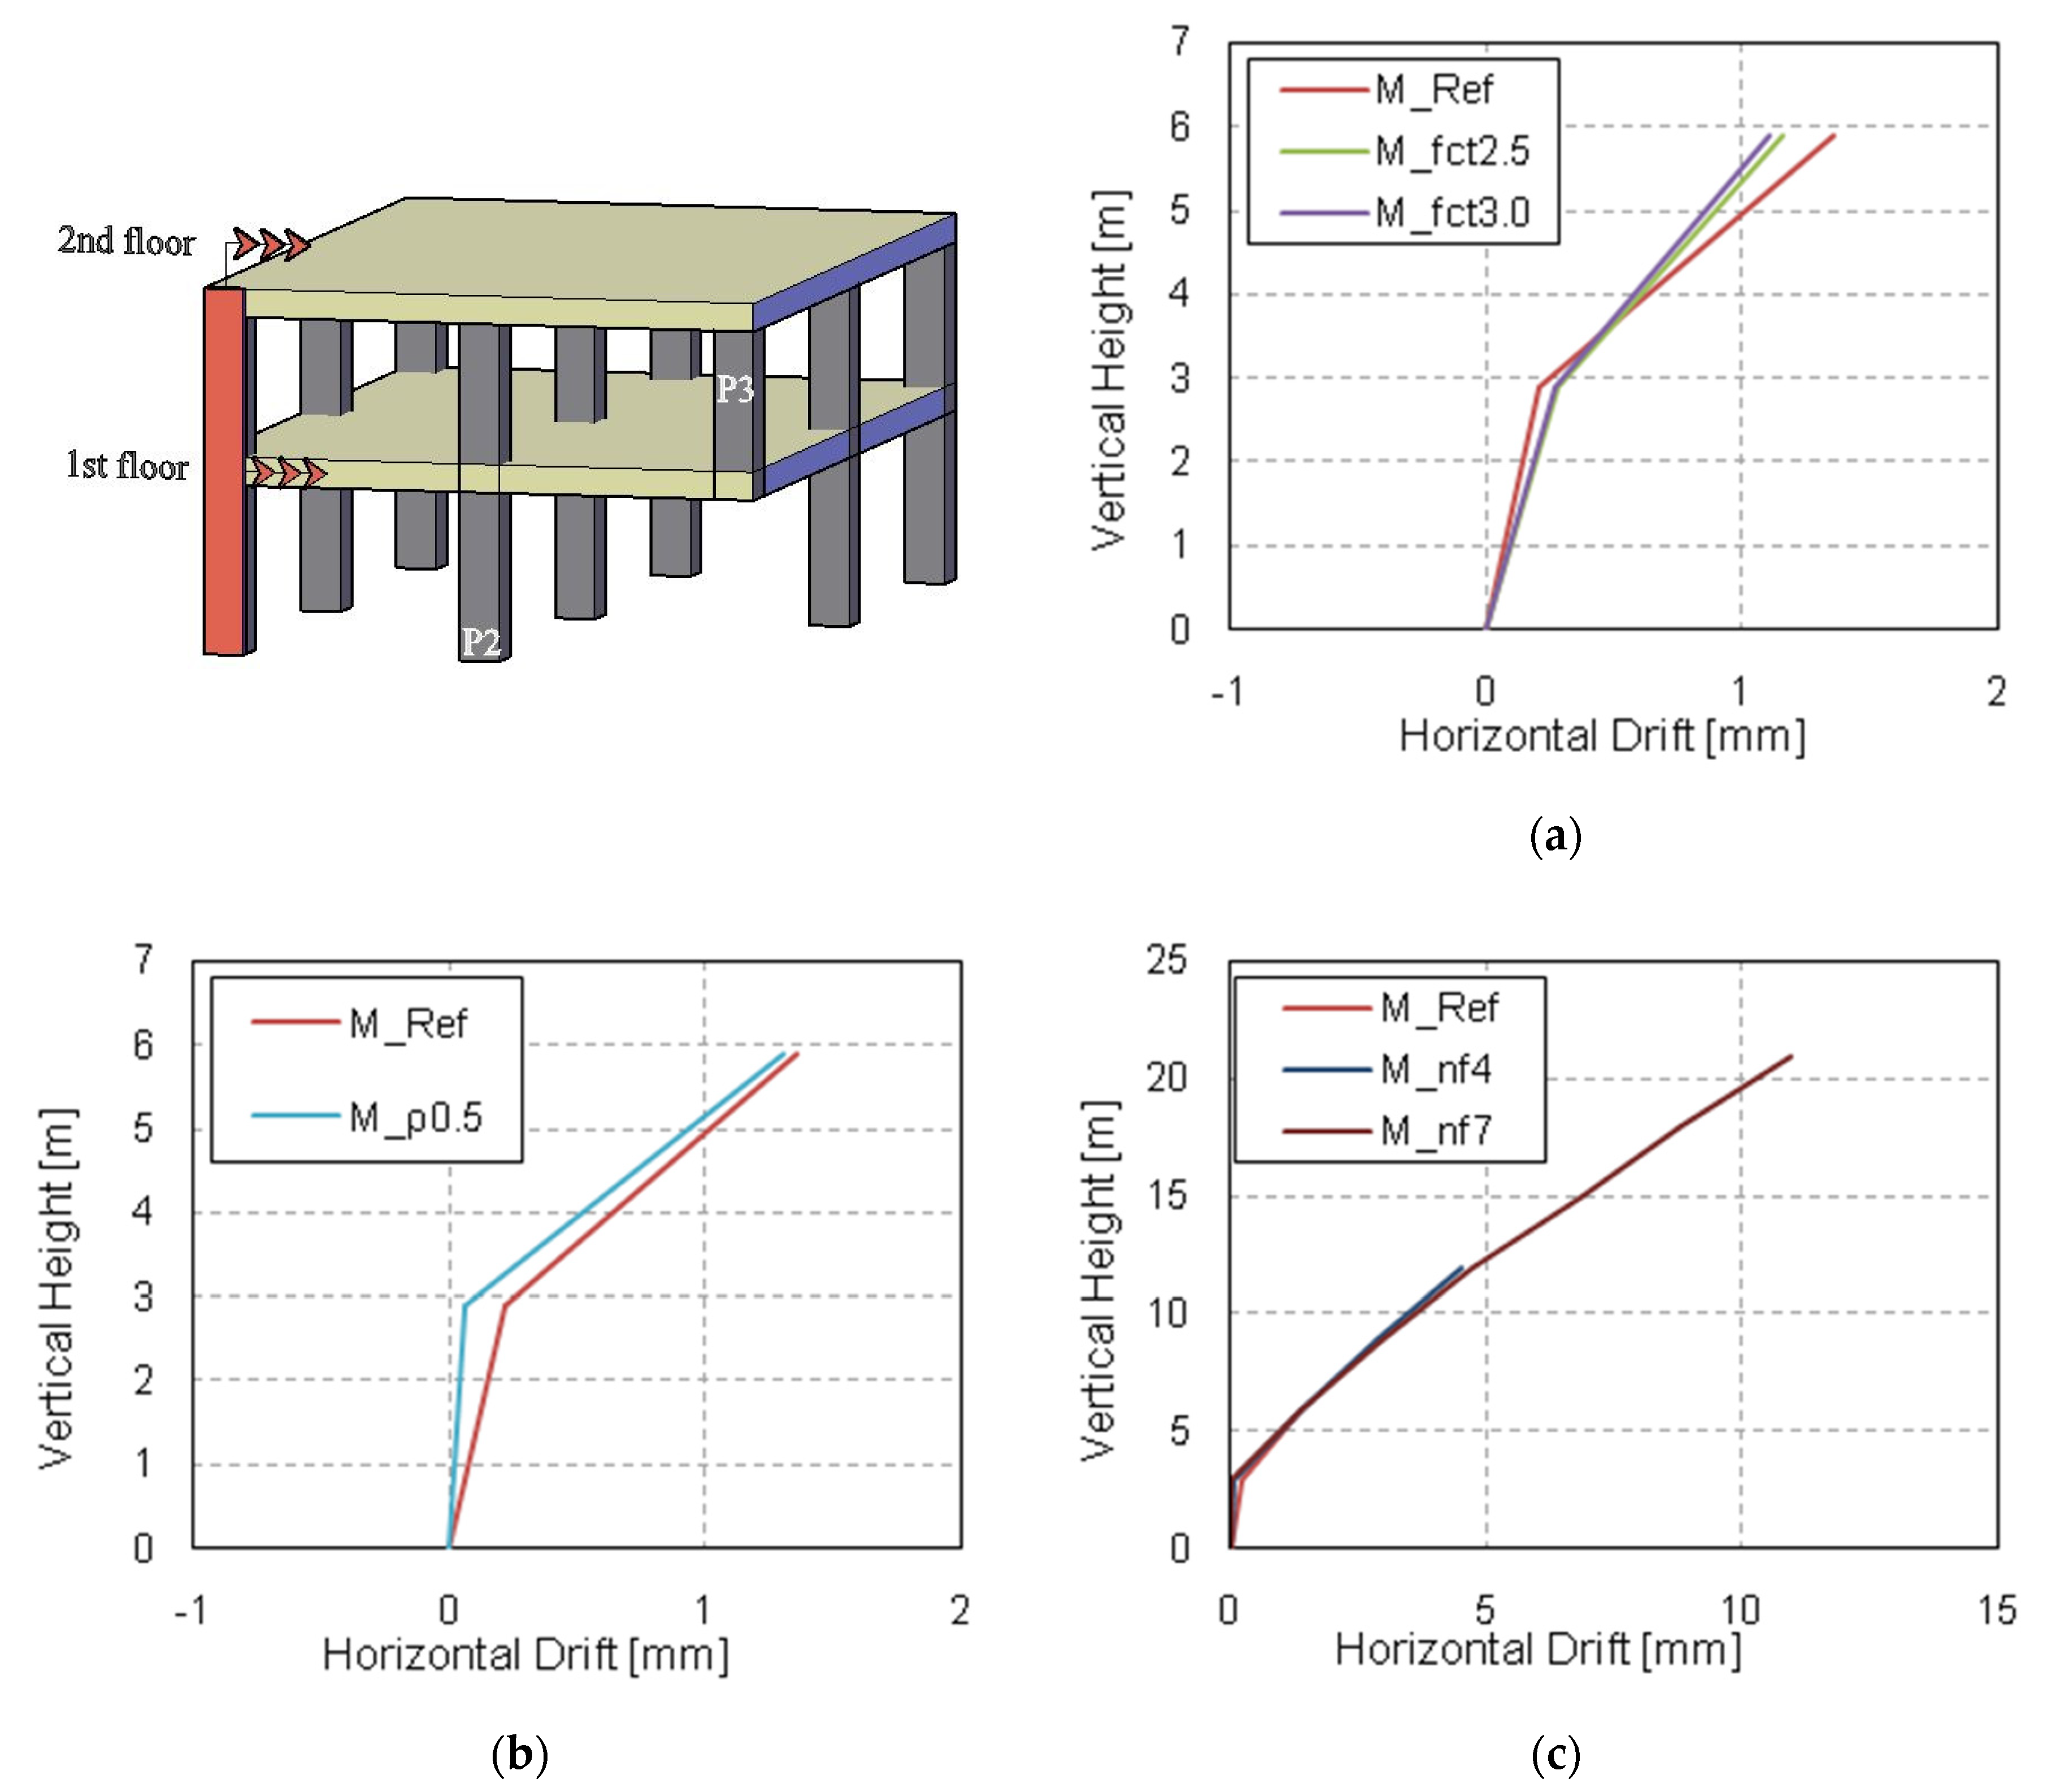
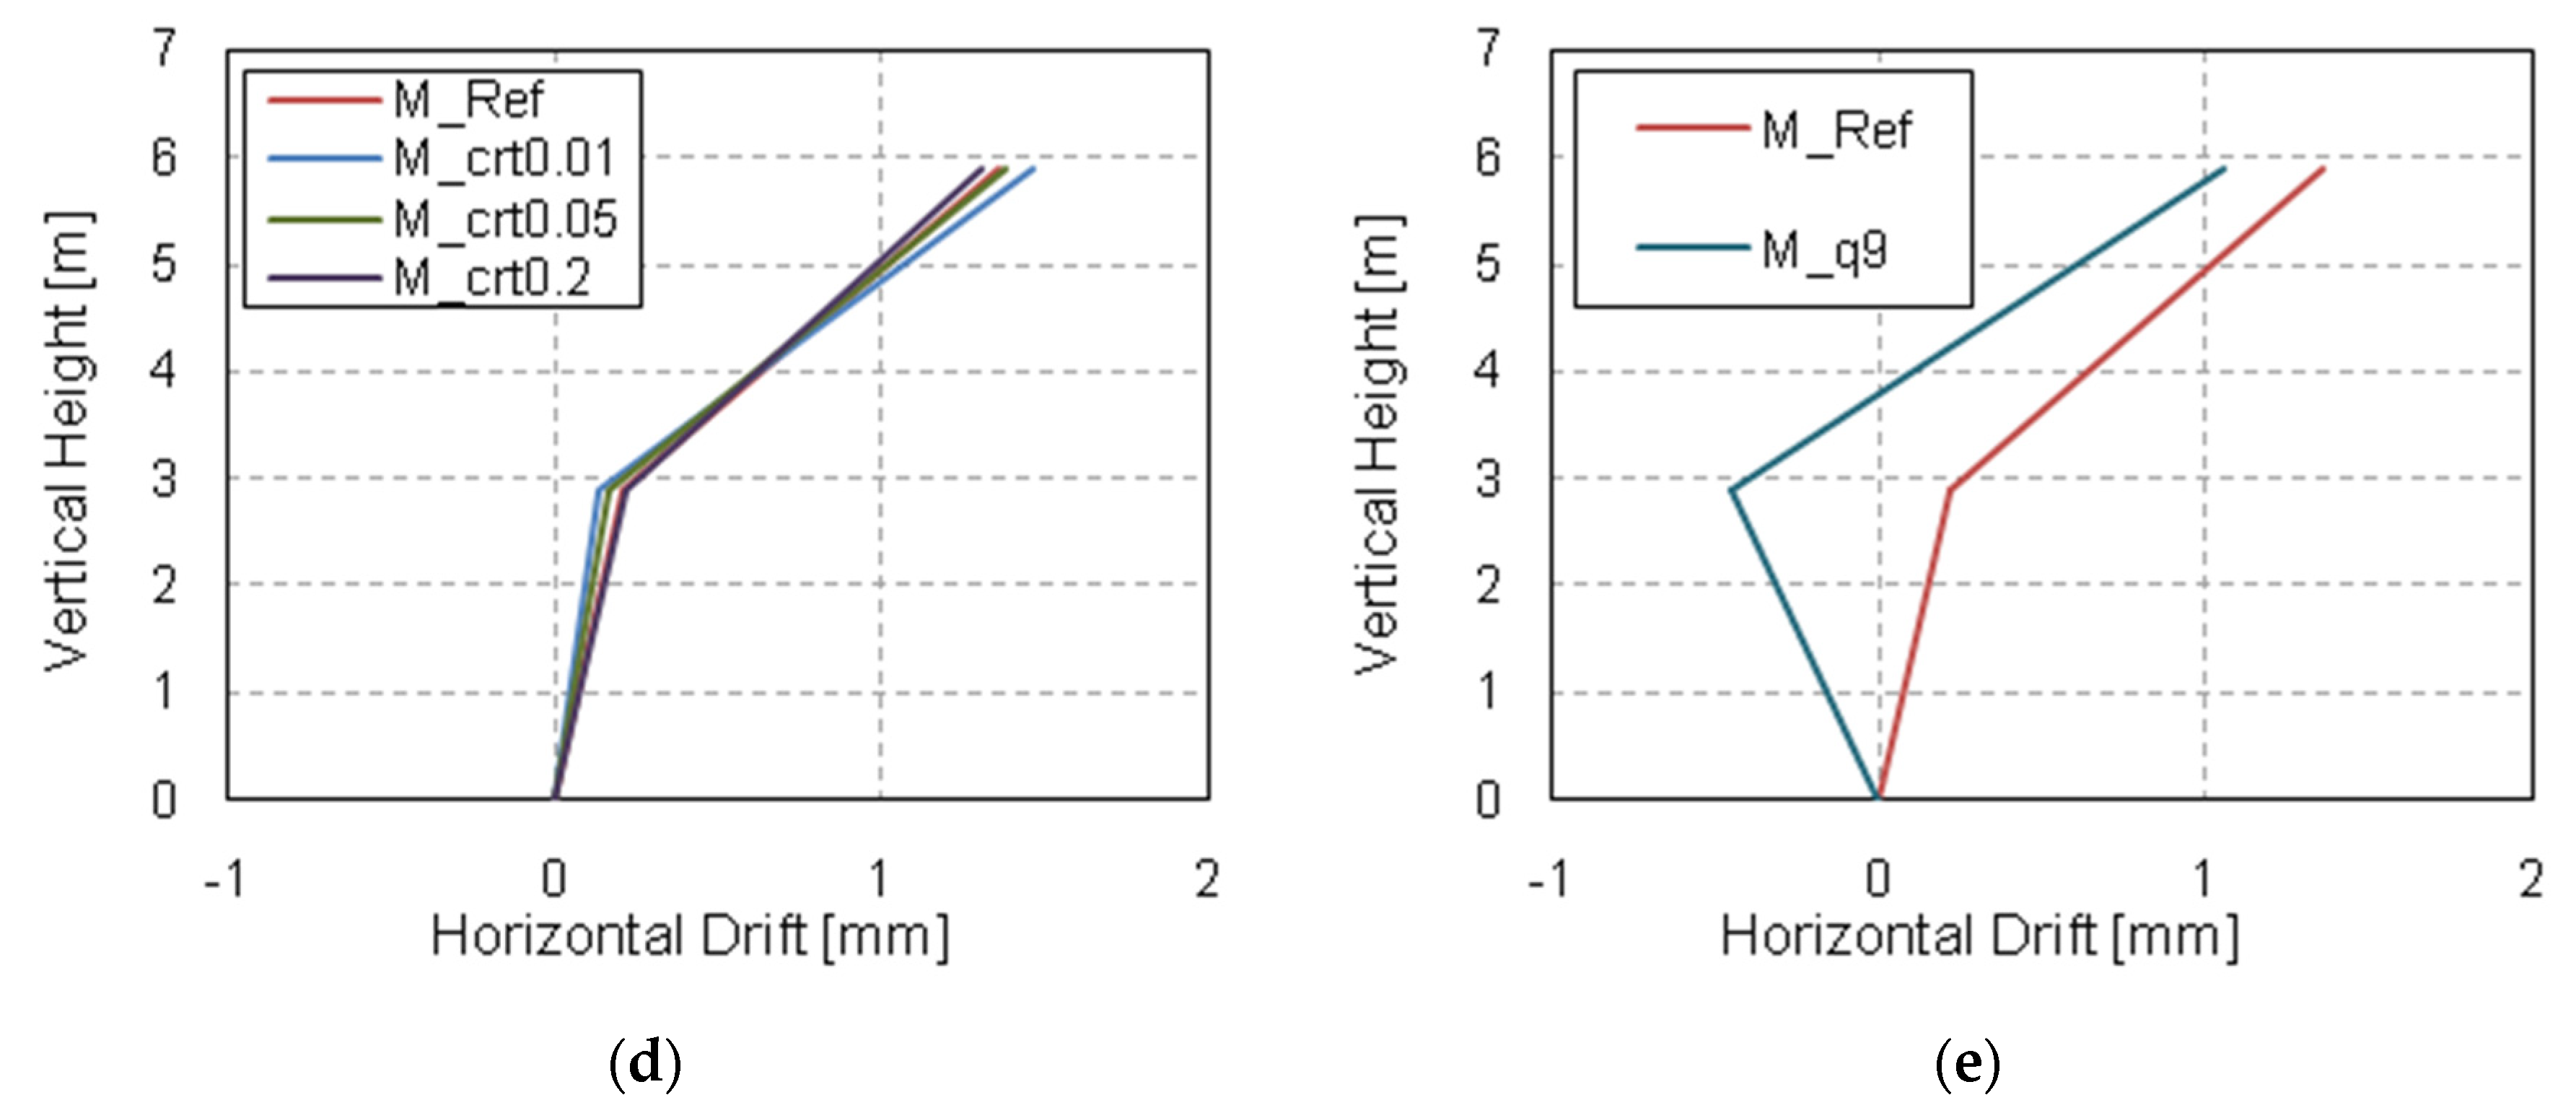
This subsection compares the lateral horizontal drifts obtained in each group of simulations and the reference model (i.e., M_Ref). Figure 8 depicts the numerical residual horizontal drift obtained by varying the concrete tensile strength (Figure 8a), flexural reinforcement ratio (Figure 8b), number of floors (Figure 8c), column removal time (Figure 8d) and superimposed load (Figure 8e). It is worth mentioning that positive horizontal displacements imply deformation of the building toward the removed column, as indicated in Figure 8. A summary of the peak and residual horizontal drift values obtained on each floor from all the models is given in Table 6.
The horizontal drift of the building obtained in each group is similar to the reference model, except for the last simulation (i.e., M_q9). The maximum horizontal drift obtained at the second-floor level in all the models is lower than 1.5 mm. The models with a higher number of floors showed a quite similar trend of the horizontal drift with respect to the reference model, but obviously a higher maximum horizontal displacement. In this set of simulations, the maximum top horizontal drift was 4.8 mm on the fourth floor (M_nf4) and 12.0 mm on the seventh (M_nf7). Results for cases with more than seven stories are not shown because the results were influenced by instability caused by the lack of bracing in the building [13].
A clearly different horizontal displacement trend was obtained in the last simulation (i.e., M_q9), in which the 1st floor experienced a negative drift of about 0.5 mm, while the 2nd floor reached a drift of around 1.0 mm. This result can be justified by the activation of in-plane effects related to the large vertical deflections. For such an amount of load and large deflections, the mechanical-linear assumption for columns could not be accurate. Additionally, punching will occur, so the modelling of the column-slab connection would need to be refined to consider post-punching behaviour.

3.3. Vertical Reactions in the Adjacent Columns

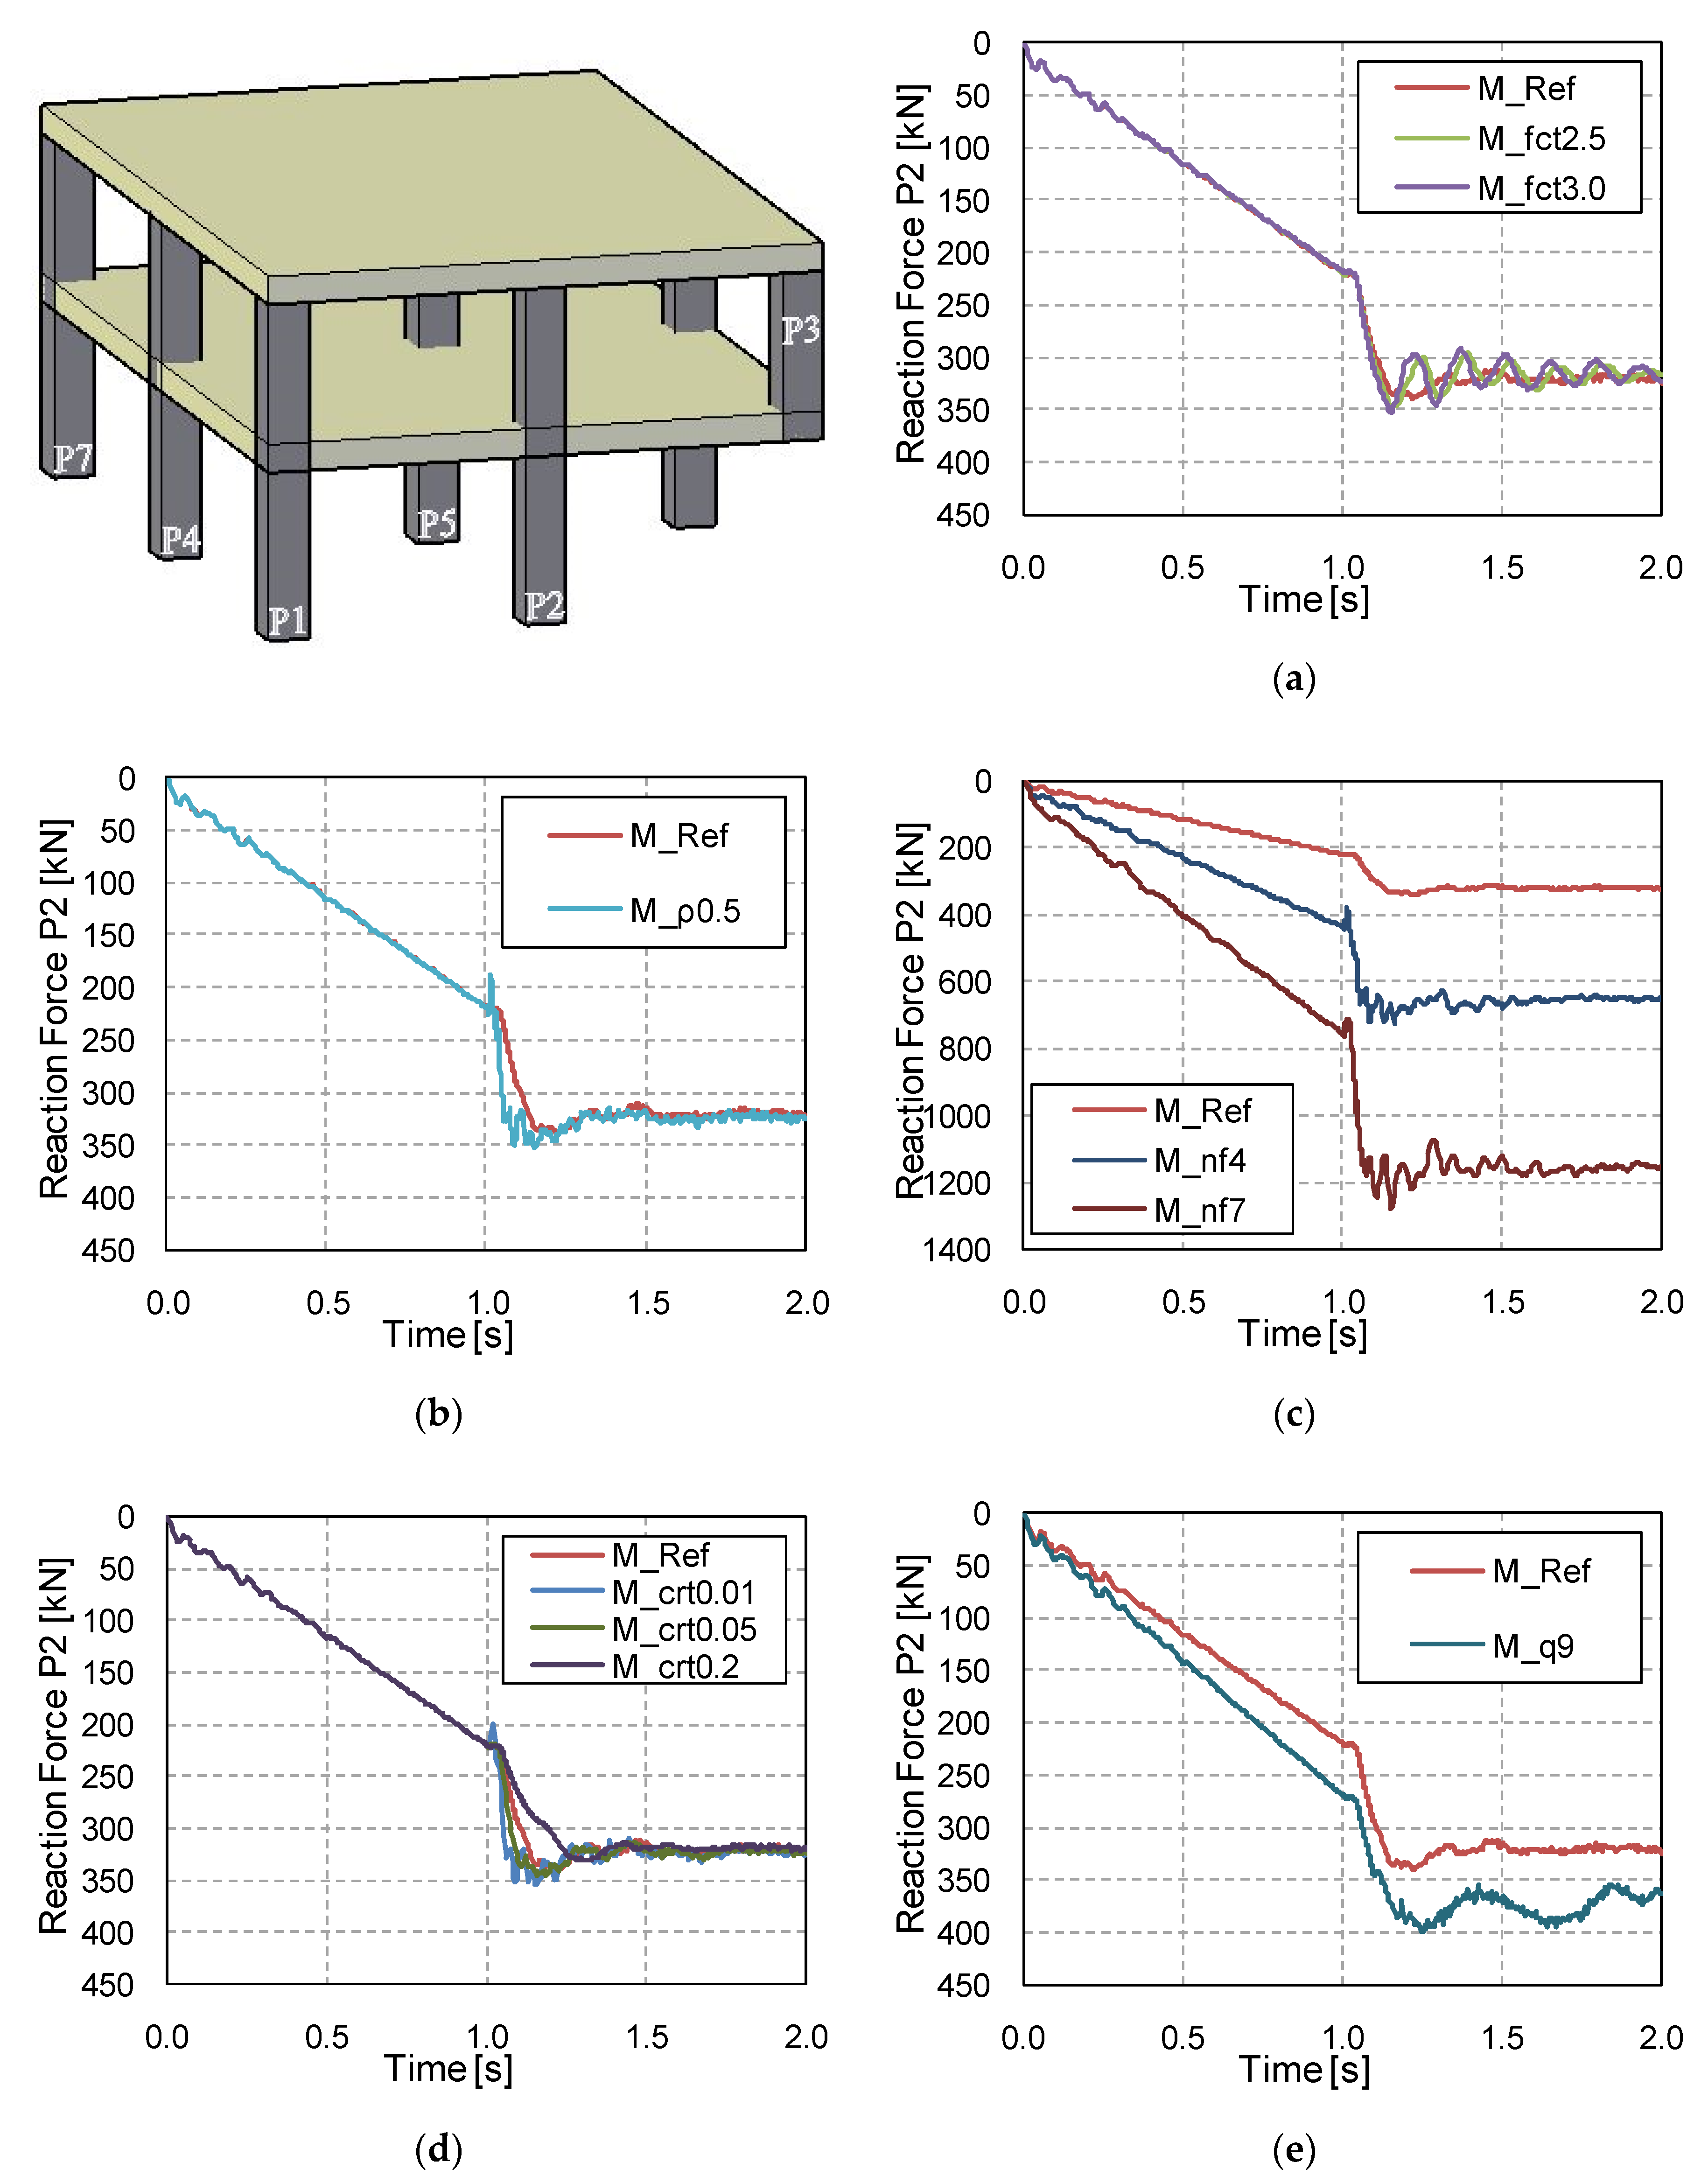
This section gives the vertical reaction forces in the adjacent column, P2, for each group of simulations (i.e., concrete tensile strength, flexural reinforcement ratio, number of floors, column removal time and superimposed load). The numerical reaction histories are depicted in Figure 9 from t = 0 s to t = 2 s. The results of columns P1, P4, P5 and P7 are reported in Appendix A, to which the reader is referred for further details. It is worth mentioning that from 0 s to 1 s the building supports gravity loads, while from 1 s to 2 s it undergoes the removal of ground floor column P3 and the subsequent free vibration phase.
As can be seen by comparing Figure 9a,b,d, the peak vertical reaction force in P2 is not influenced by varying the concrete’s mechanical properties, reinforcement ratio or column removal time, respectively. Each of these parameters influences the reaction force histories after the peak value. Higher concrete tensile strength reduces the formation of tensile damage in the structure and therefore extends the vibration of the building after the column removal (Figure 9a). A longer column removal time (Figure 9d) delays the peak value, but the results still reach the same peak and residual values. As expected, the application of higher superimposed loads and the higher number of floors modify the vertical reaction force in column P2, as can be seen in Figure 9c,e.
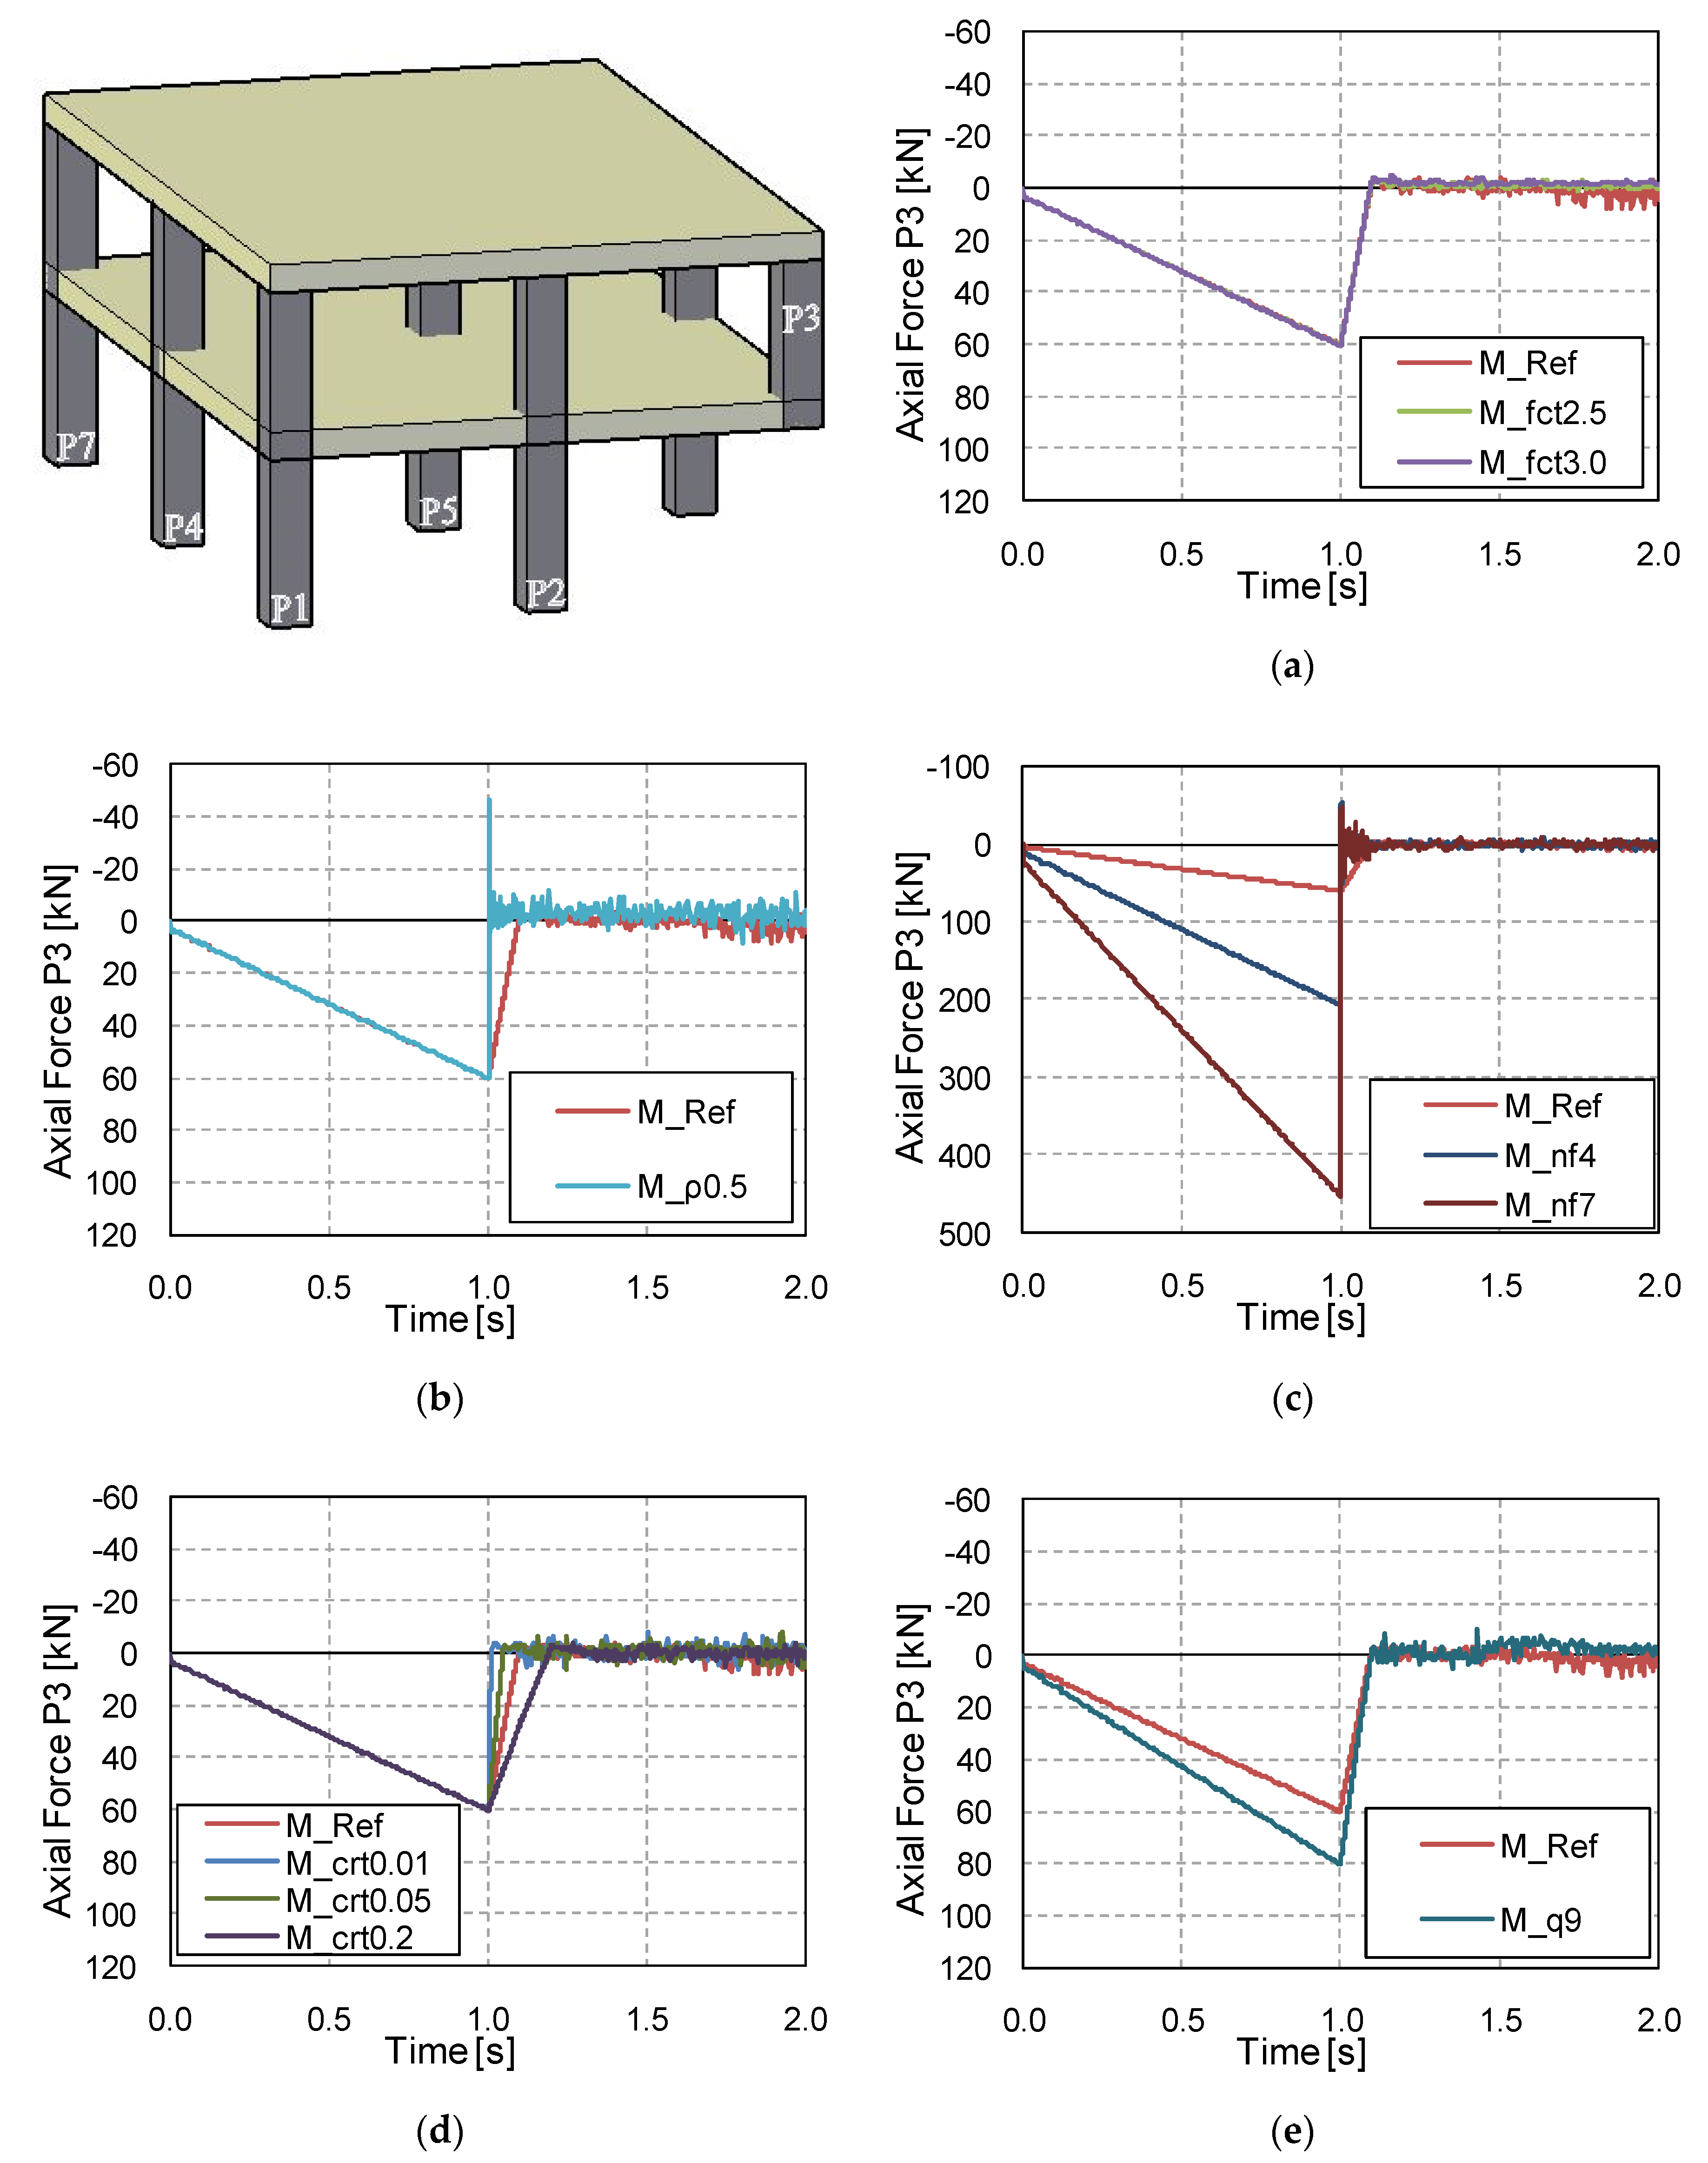
Figure 10 shows the axial force histories in the first-floor column P3 because it is a key element on the load redistribution of the load supported by the missing ground floor column, P3. As is clearly visible, the models behaved in two different ways: (i) from 0 s to 1 s and (ii) from 1 s to 2 s. In the first phase, all the models are subjected to compressive forces due to the application of the gravity loads, while in the second phase the column is subjected to the effect of the sudden removal of the ground floor column, and column P3 suddenly loses almost all its axial force.

3.4. Computed Tensile Damage Maps

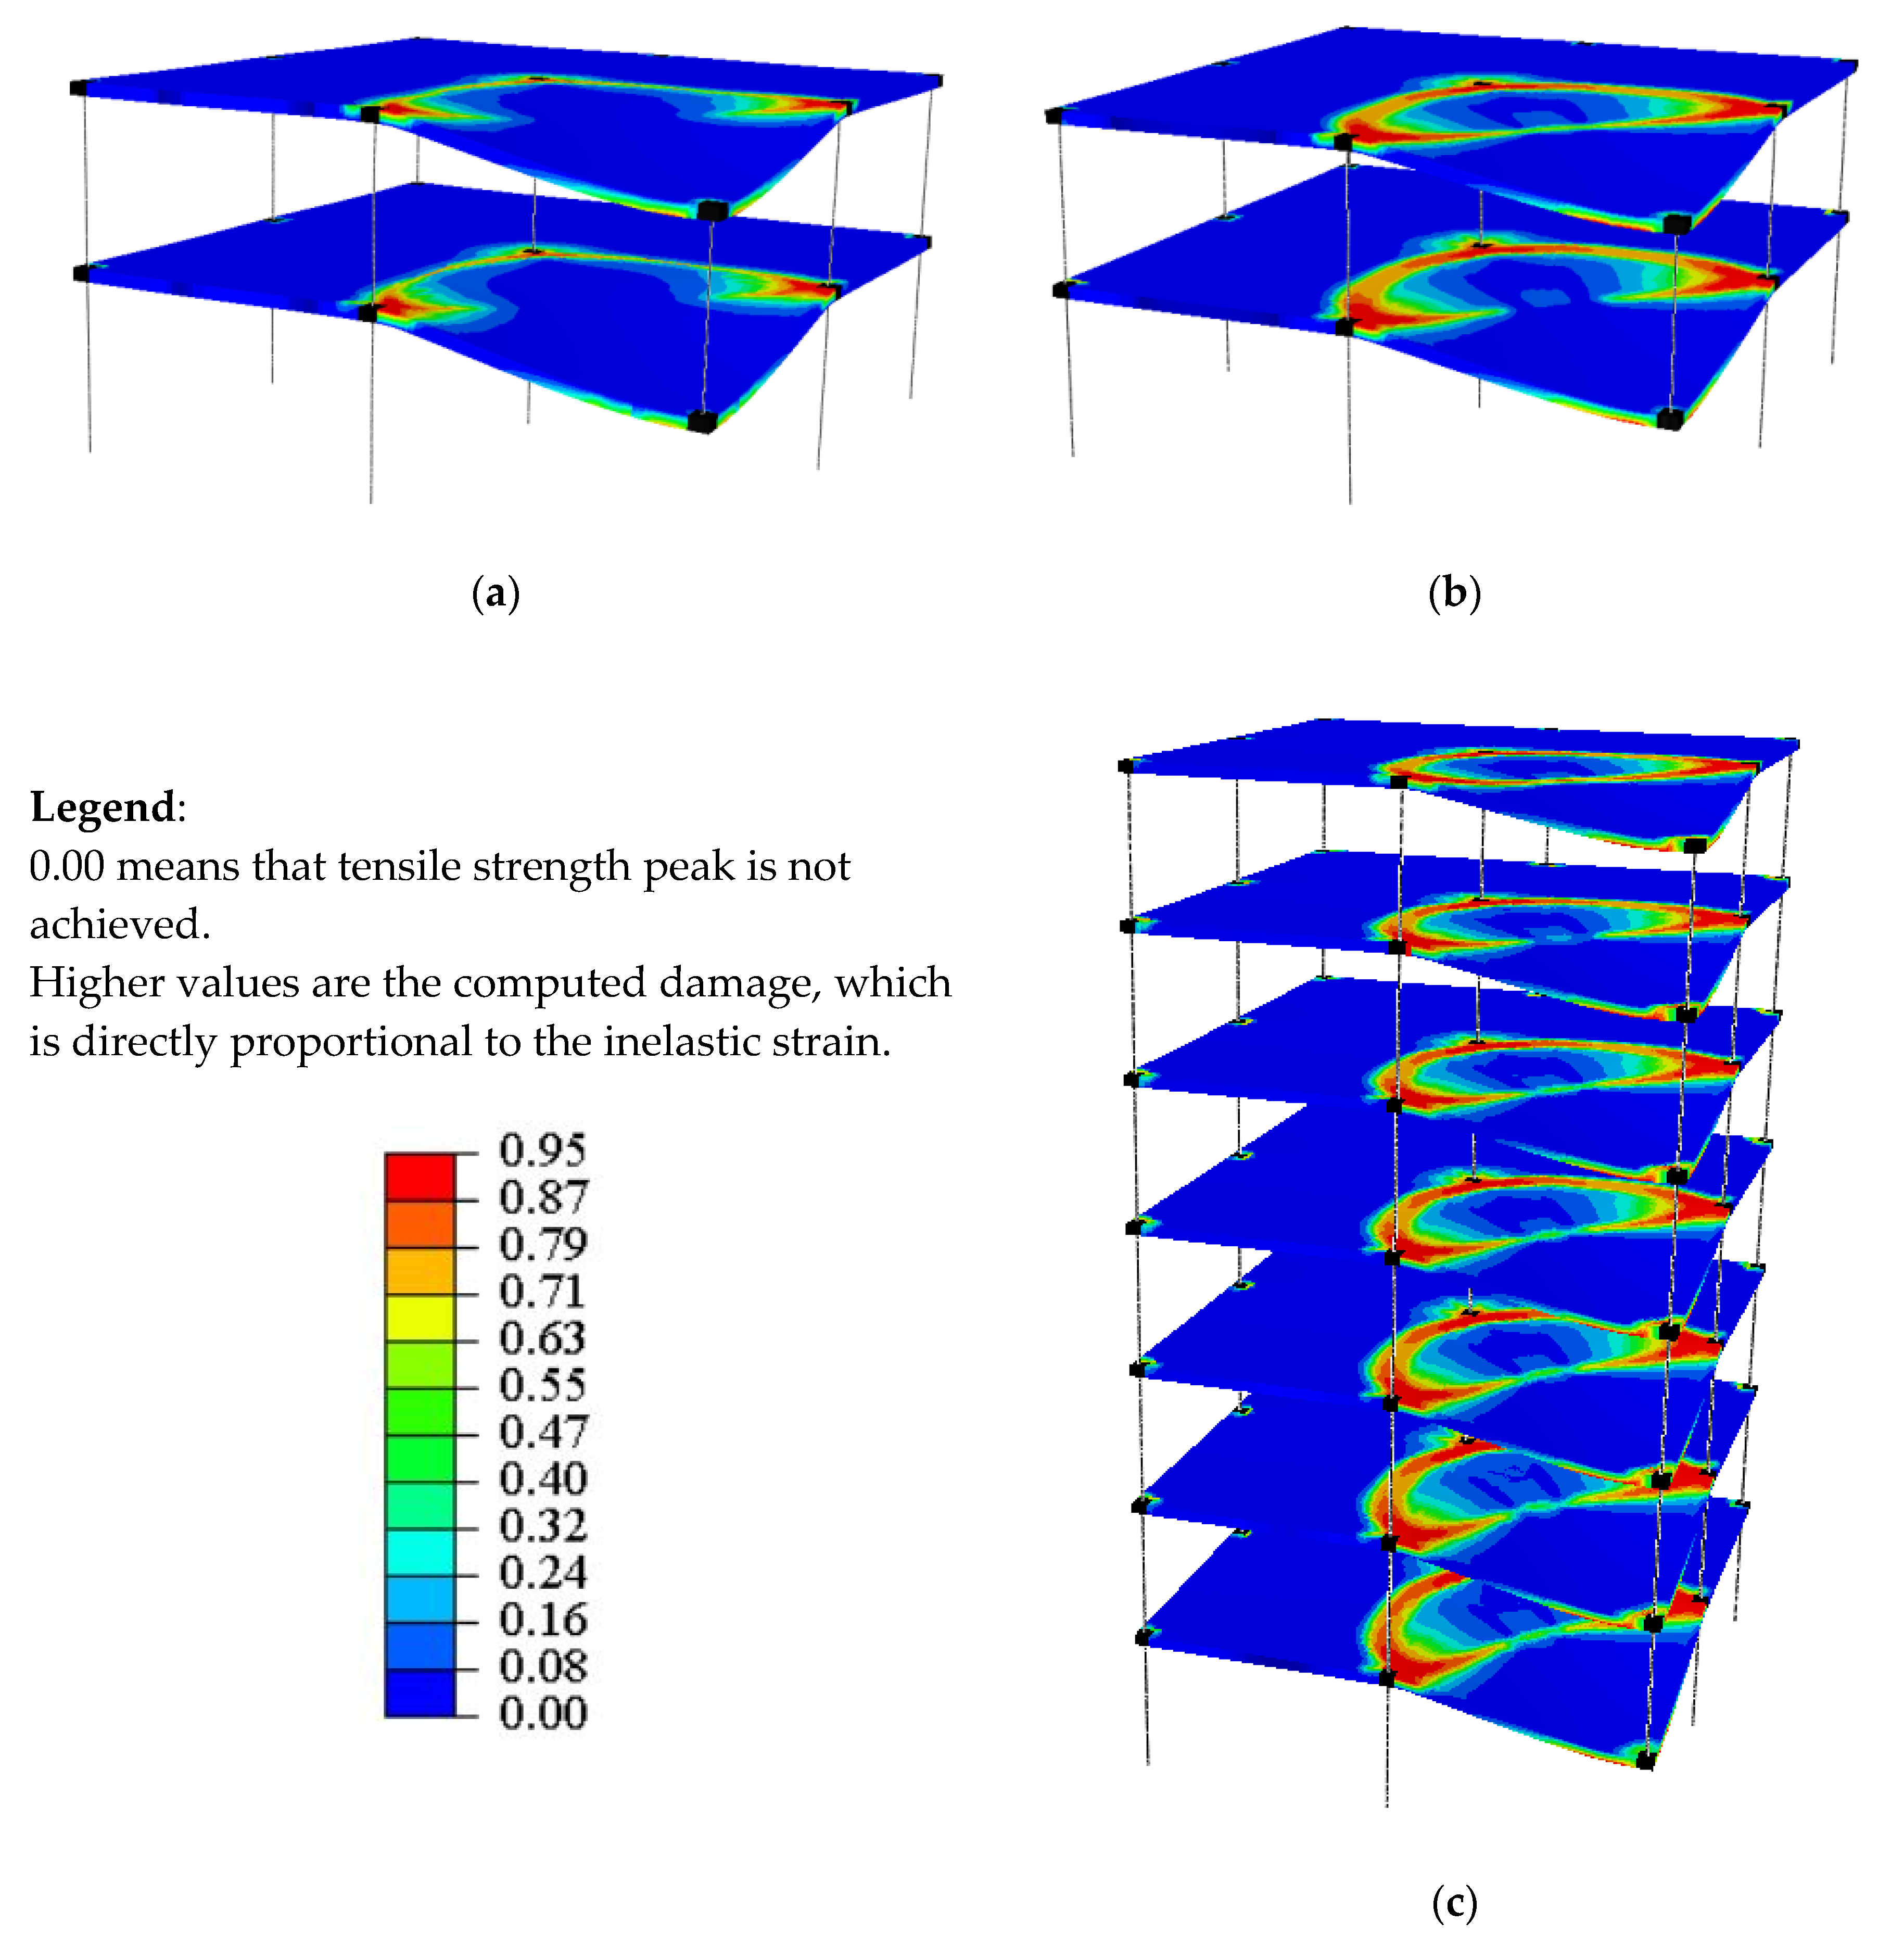
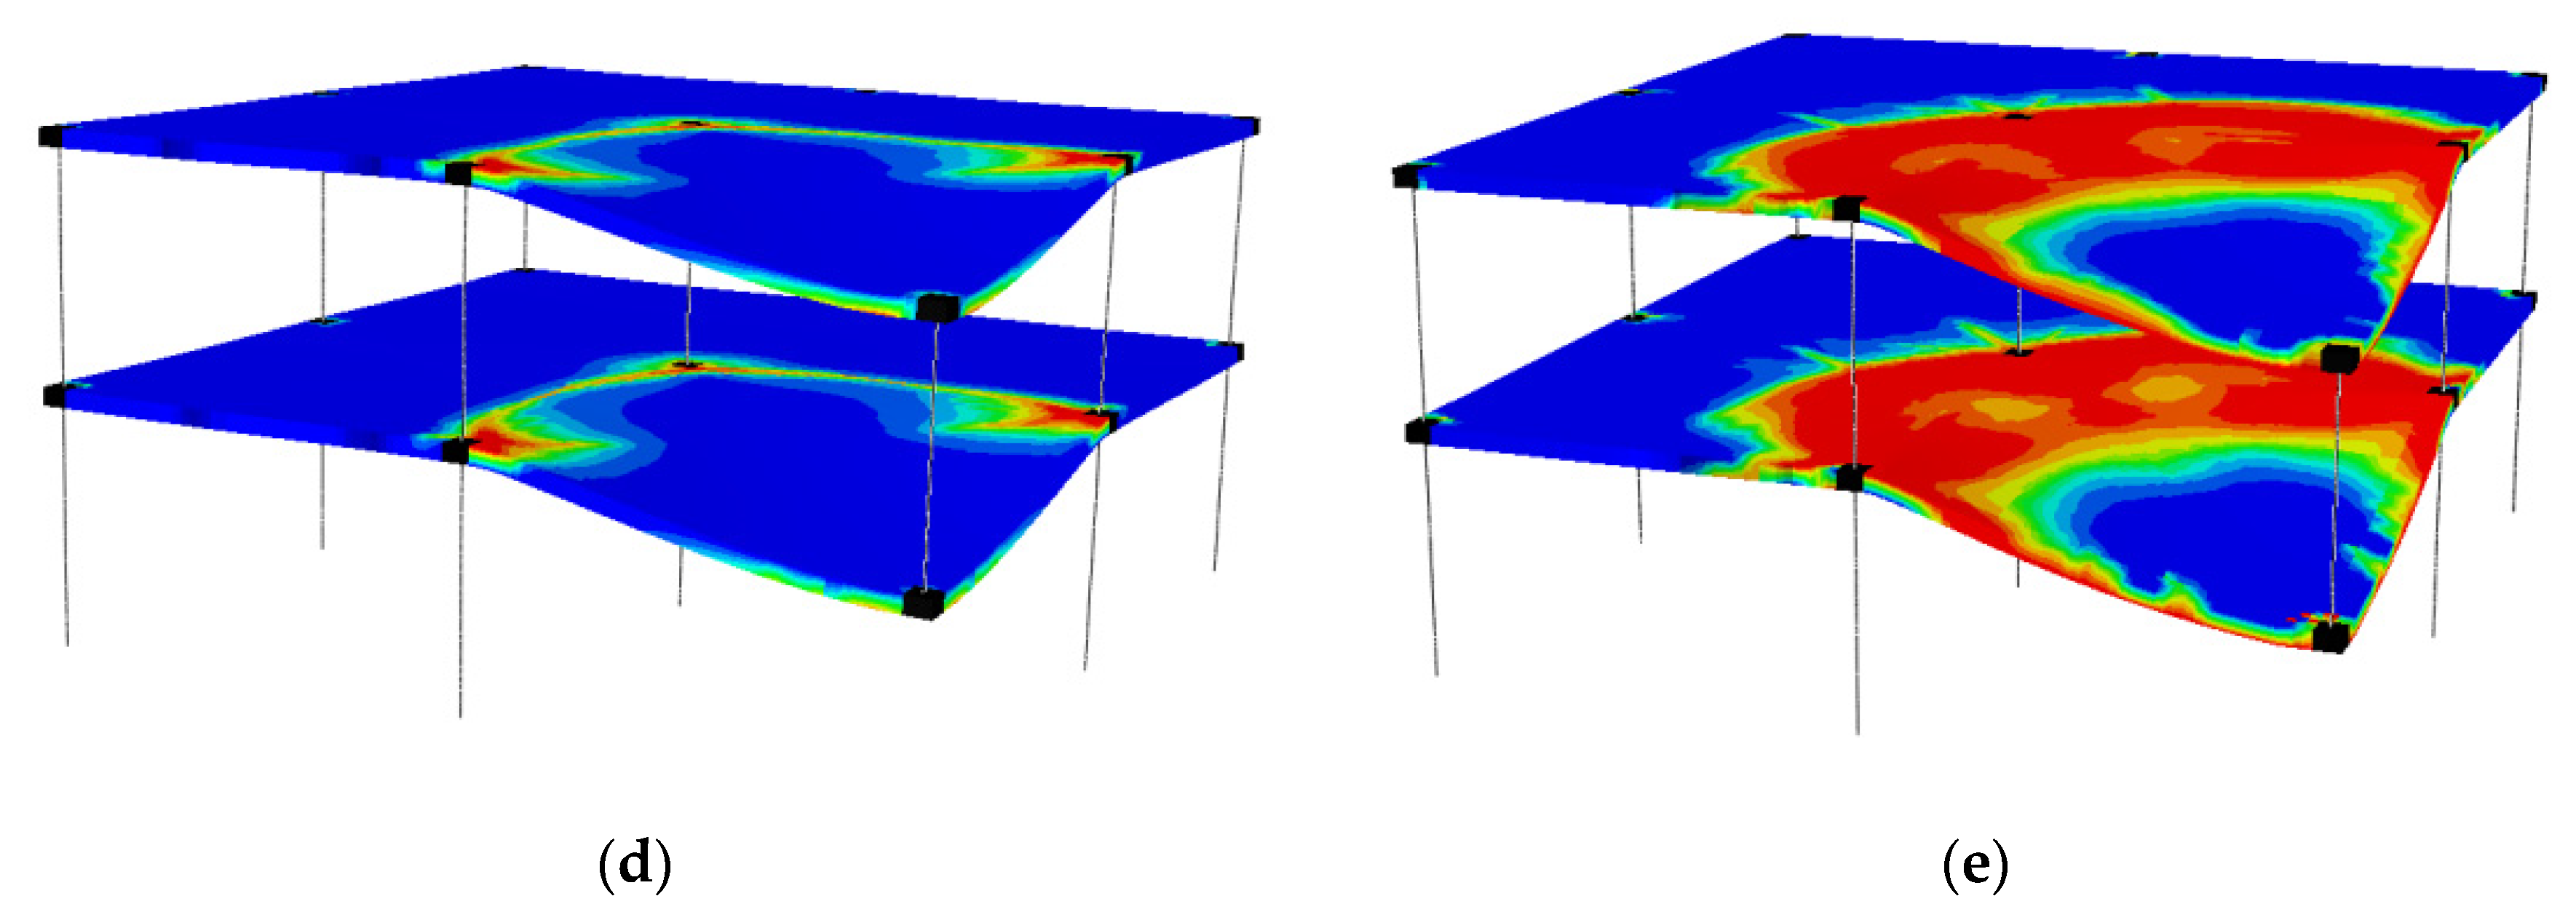
The computed tensile damage maps are given in this section for five selected models: M_fct2.5, M_ρ0.5, M_nf7, M_crt0.2 and M_q9. The results are depicted in Figure 11. The proposed maps are extracted from the models at t = 2 s (i.e., at the end of the simulations). The maps depicted are superimposed on the deformed shape of the building and show both the upper and lower tensile damage computed in the slabs. All the models present the formation of tensile damage on the upper surface of the 1st and 2nd floors close to columns P2/P6, in agreement with the formation of the yielding mechanism during the column removal. Similarly, the bottom surfaces of both floors experienced tensile damage around the removed column P3. This damage mechanism was observed in all the simulations regardless of the group of models. In model M_q9, the tensile damage reached the maximum propagation as it is a case of ULS load combination; at the end of the simulation, both floors were seriously damaged, with tensile damage on the upper surface connected to cracks on the lower surface. This could be explained by the complete failure of the slabs subjected to the column removal (see Figure 11e) considering the limitations of this model (i.e., failure of connections, elastic behaviour of columns).

4. Discussion

This section discusses and analyses the activation of ALPs and the variation of DAFs regarding the influence of different parameters.

4.1. Activation of Alternative Load Paths (ALPs)

When a corner column fails, the structure must be able to effectively activate ALPs to replace one of its main vertical load-bearing elements, and in this particular case only a limited number of ALPs can be activated, with the Vierendeel action or slab cantilever action being the most effective ones at low deflections [28]. However, there may be others, such as the contribution of masonry infill walls [27] (not studied in this work) or, to a lesser extent, membrane action [28]. To study the activation of the main ALPs and other key aspects of design accidental situations in the building under study, its behaviour was analysed before and after the sudden column removal.
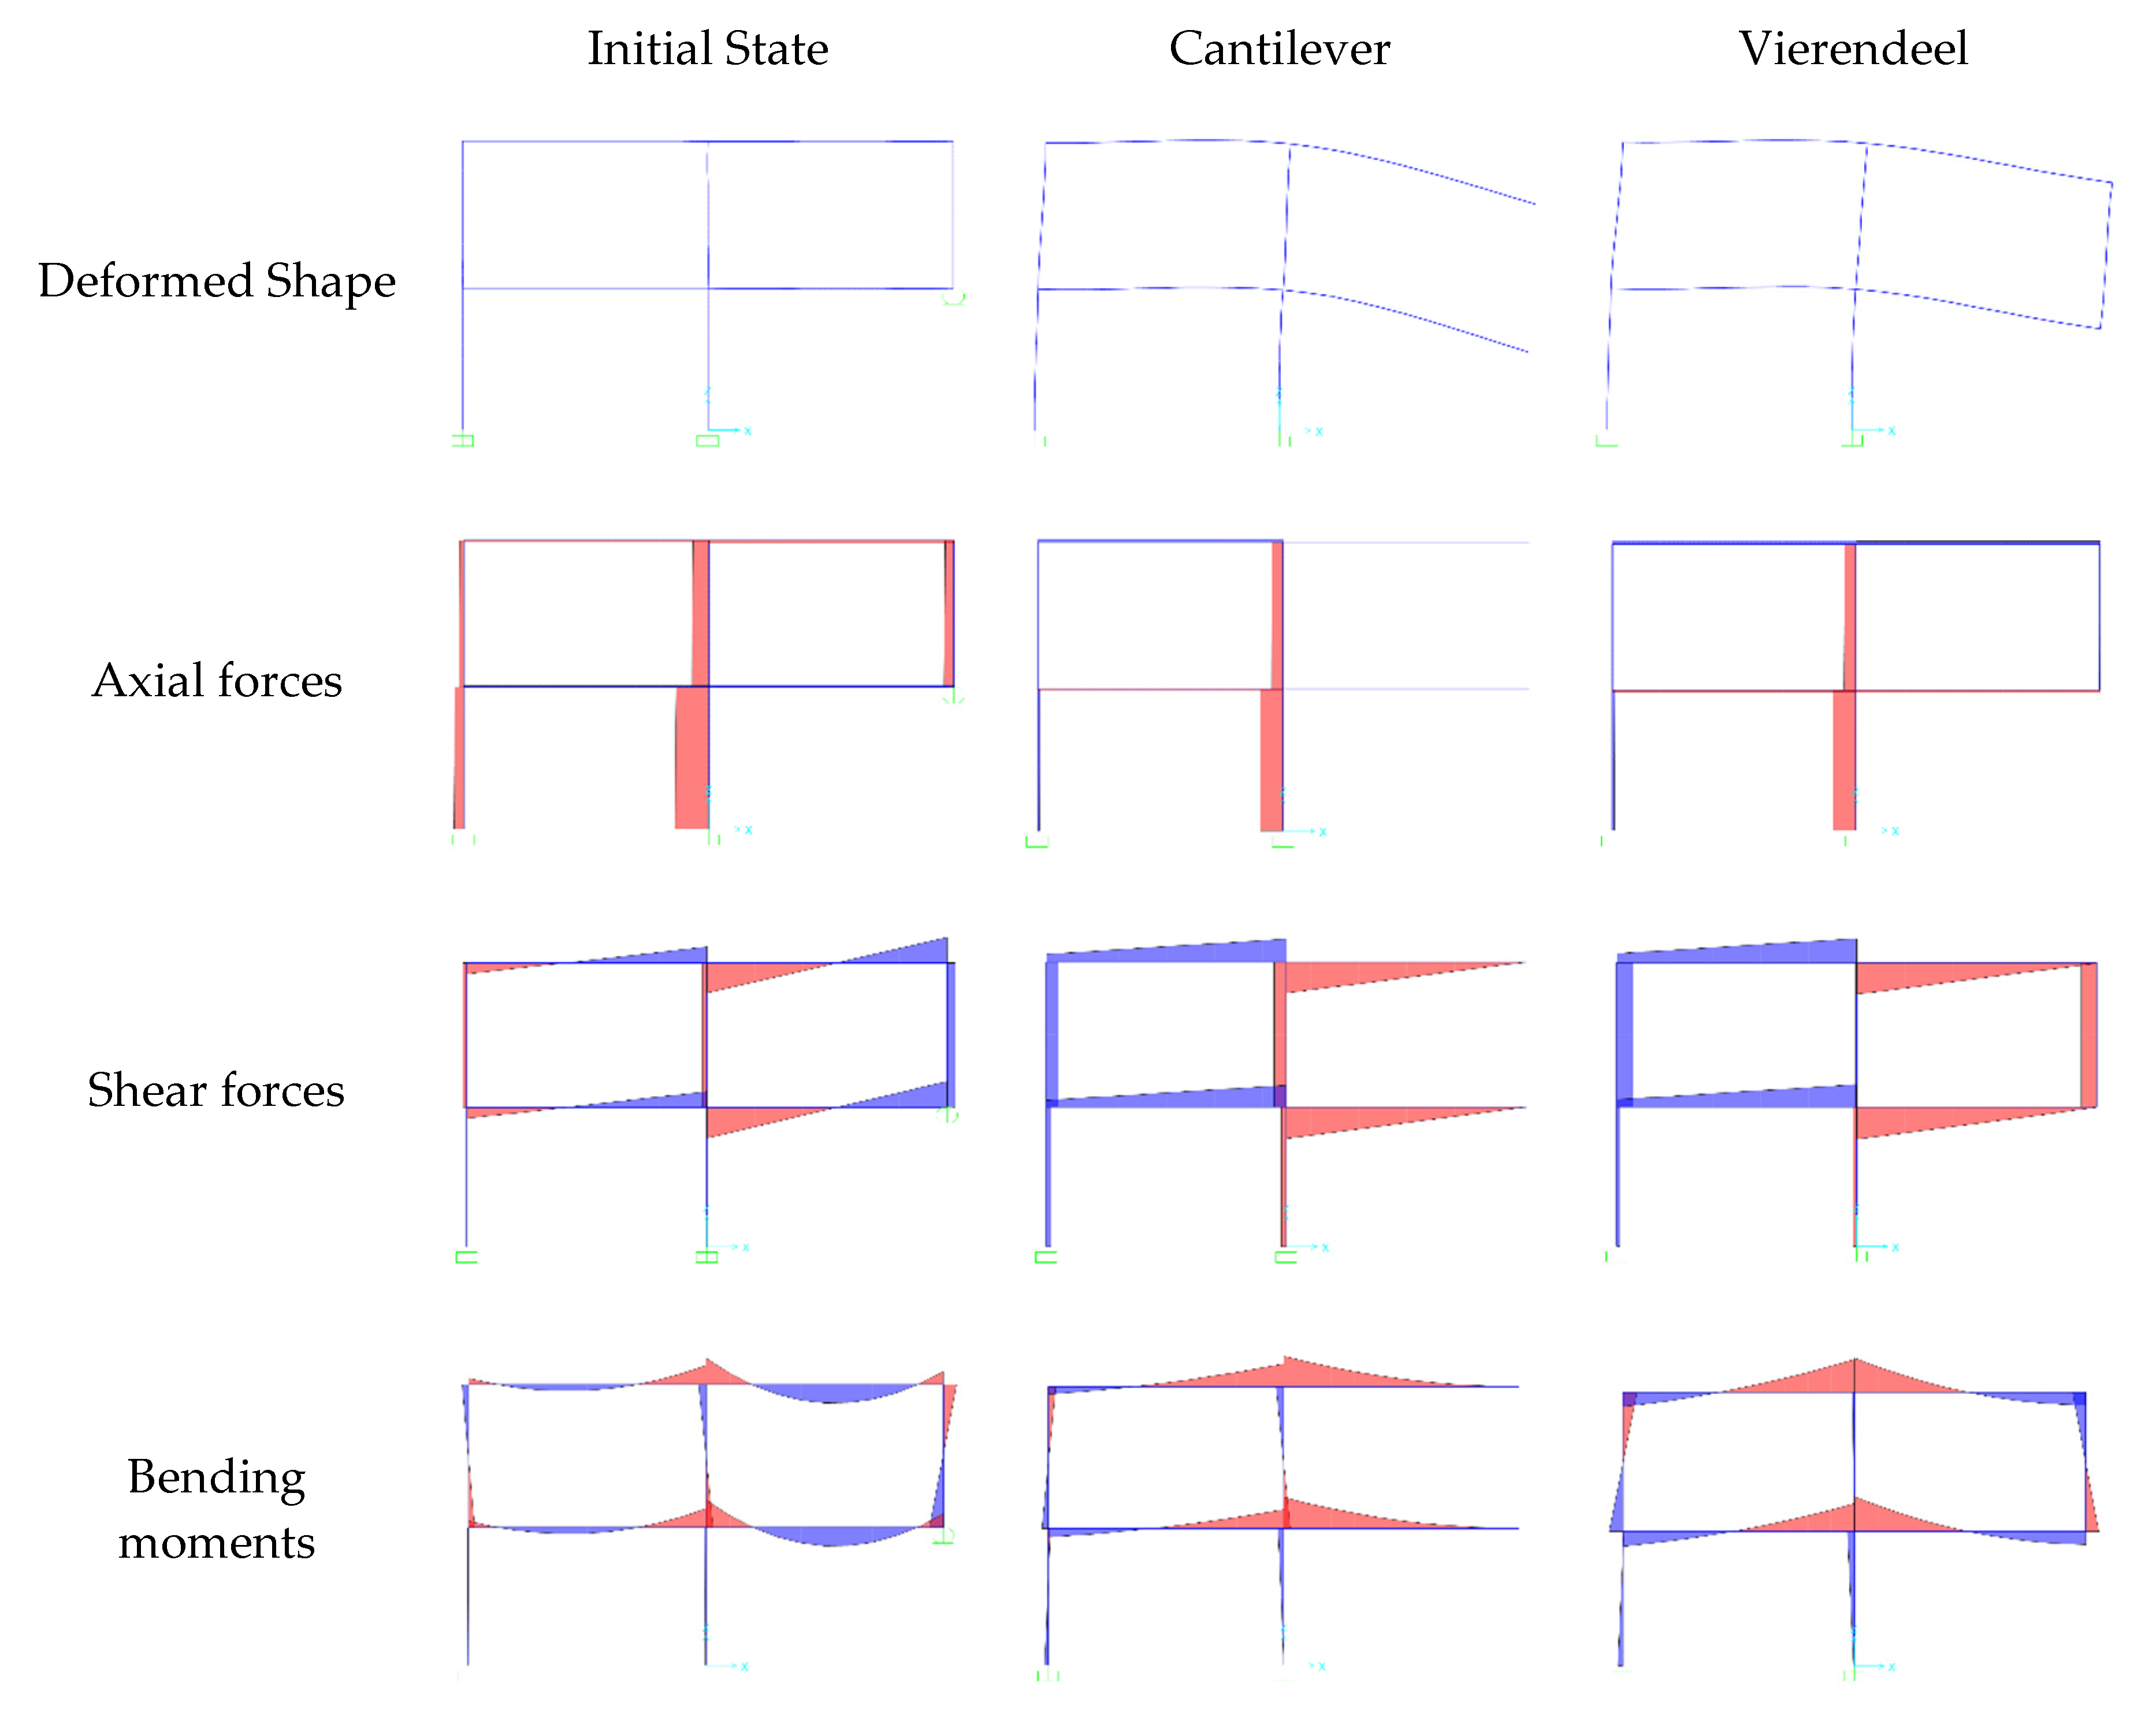
As part of the conception of the test, a computational simulation was carried out using software SAP2000 [49], which included modelling an equivalent frame corresponding to the façade frame from P1 to P3 of the building under study. Three different structural states were analysed. An initial state in which P3 was still functional and another two states after losing the column, where different ALPs might be activated: (i) cantilever action of slabs and (ii) Vierendeel action of the structure. Figure 12 gives the results obtained for the different states, showing the structural deformation, axial and shear forces and bending moments. Considerable differences were found in the deformed shape of the structure between the cantilever-type and Vierendeel-type behaviour. The former recorded an increase of 51% of the maximum deflection of slabs. However, the shear and bending moment demand of the column-slab joint near the column next to the removed one (around P2) presents a similar order of magnitude in all three states, always slightly higher after column removal (for further information, see Garzón-Roca et al. [13]). The most notable differences between the Vierendeel and initial or cantilever actions were found in the load distributions close to the missing column, P3; for example, the notable differences found in the slab moments in the corner bay and in the bending moments and shear forces of first-floor column P3.
From now on, the discussion will centre on the most important forces in the Vierendeel-type behaviour compared to the initial state and cantilever action in the models analysed in the parametric study, which also considered inertial effects.
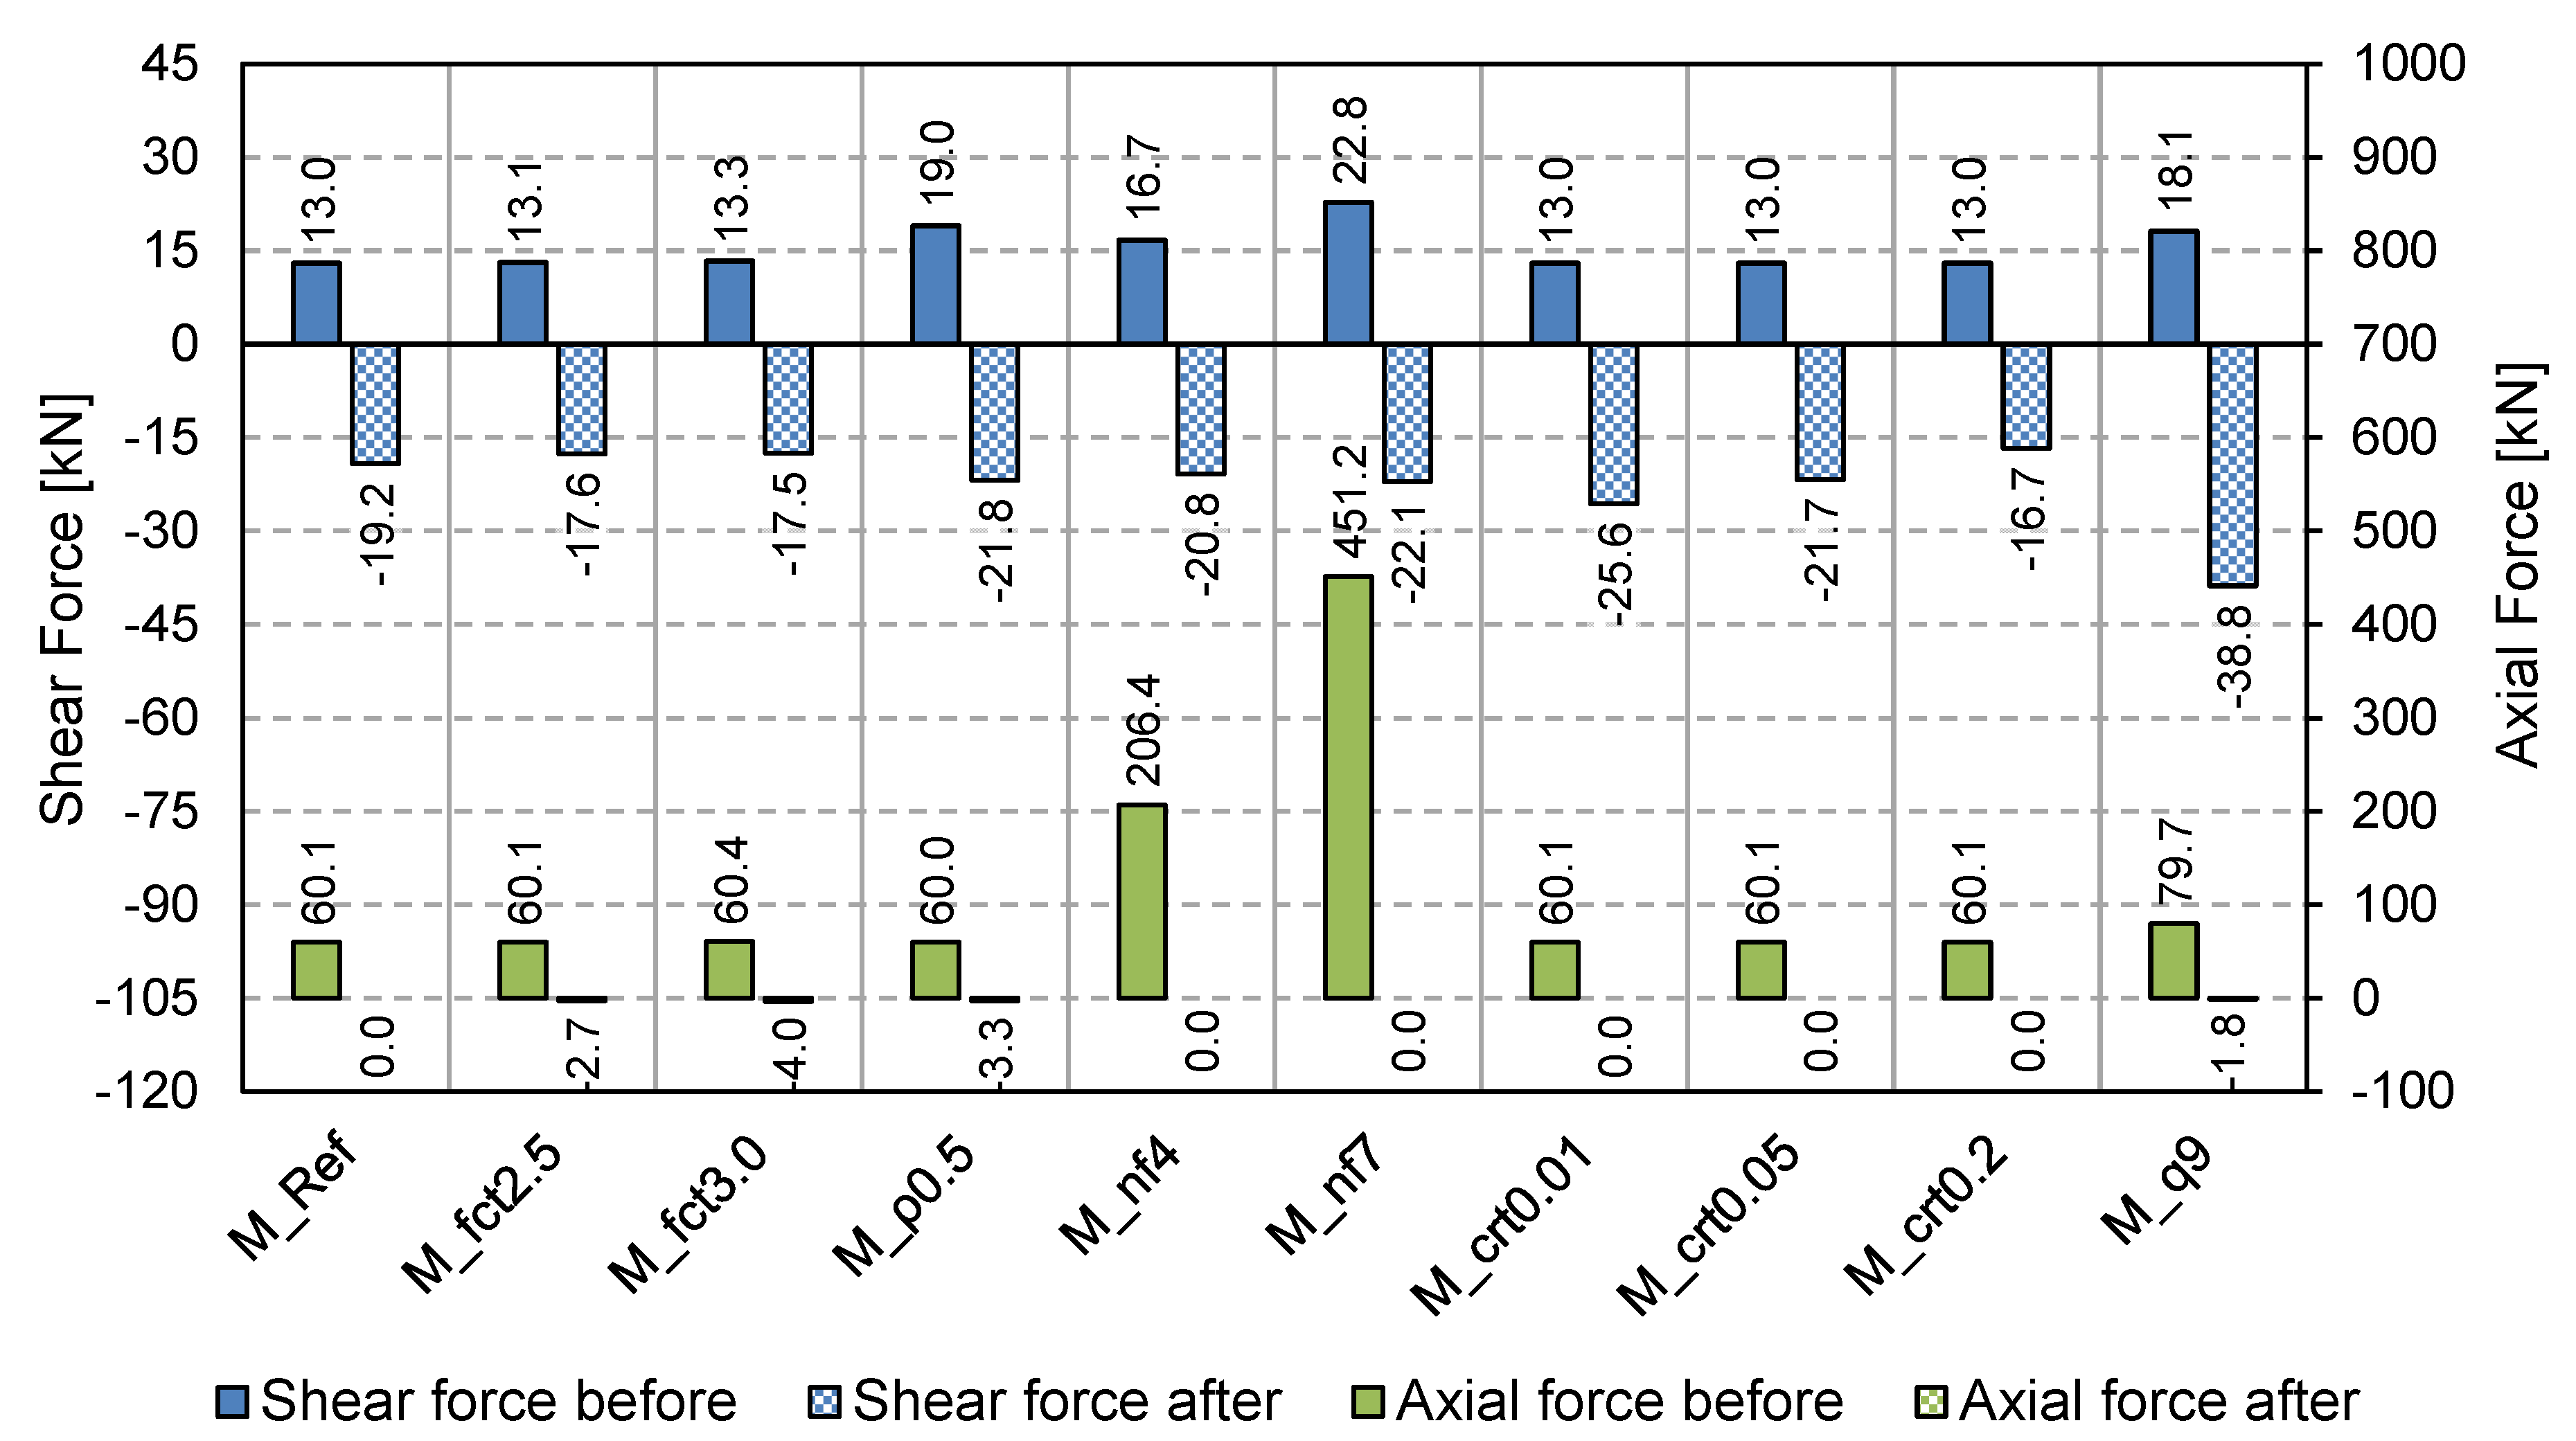
Shear forces activate slightly membrane-type behaviour in the slabs (as can be seen in the axial forces of the corner-bay slabs when Vierendeel behaviour is activated; see Figure 12). Figure 13 gives the shear and axial forces before and after column P3 removal for the ten models considered in the parametric study processed with dynamic non-linear effects in the ABAQUS software. The shear forces change their sign and their magnitude rises slightly, causing more or less participation of the compressive and tensile membrane in-plane action of the slabs. Axial forces drop to zero or change from compression to tension after column removal. Tension forces in the first-floor column P3, when they exist after column removal, are really small (less than 3.4% of the vertical tie design force for the column), but this can be totally different if infill masonry panels are considered [27], where tie forces in the column above the removed one play an important role as a part of the ALP regarding the infill panels. In this study, no significant differences were found in the different parameters considered.
The slab moments close to P3 have a completely different form to the design situation (Initial State; see Figure 12). While, in the design situation, there is a negative moment in the slabs close to P3; in the accidental situation after column removal, the sign of the moment is reversed. This is important because this type of accidental situation should be considered to be able to include the necessary reinforcement required to obtain a sufficiently robust structure. In this reinforcement zone in the initial state before column removal (design state for persistent and transient situations), only a minimum amount of reinforcement is required in the bottom layer grid, with a value of 1.8 cm2/m [40], while in accidental situations during Vierendeel-type action, the reinforcement required is considerably higher (see comments below).
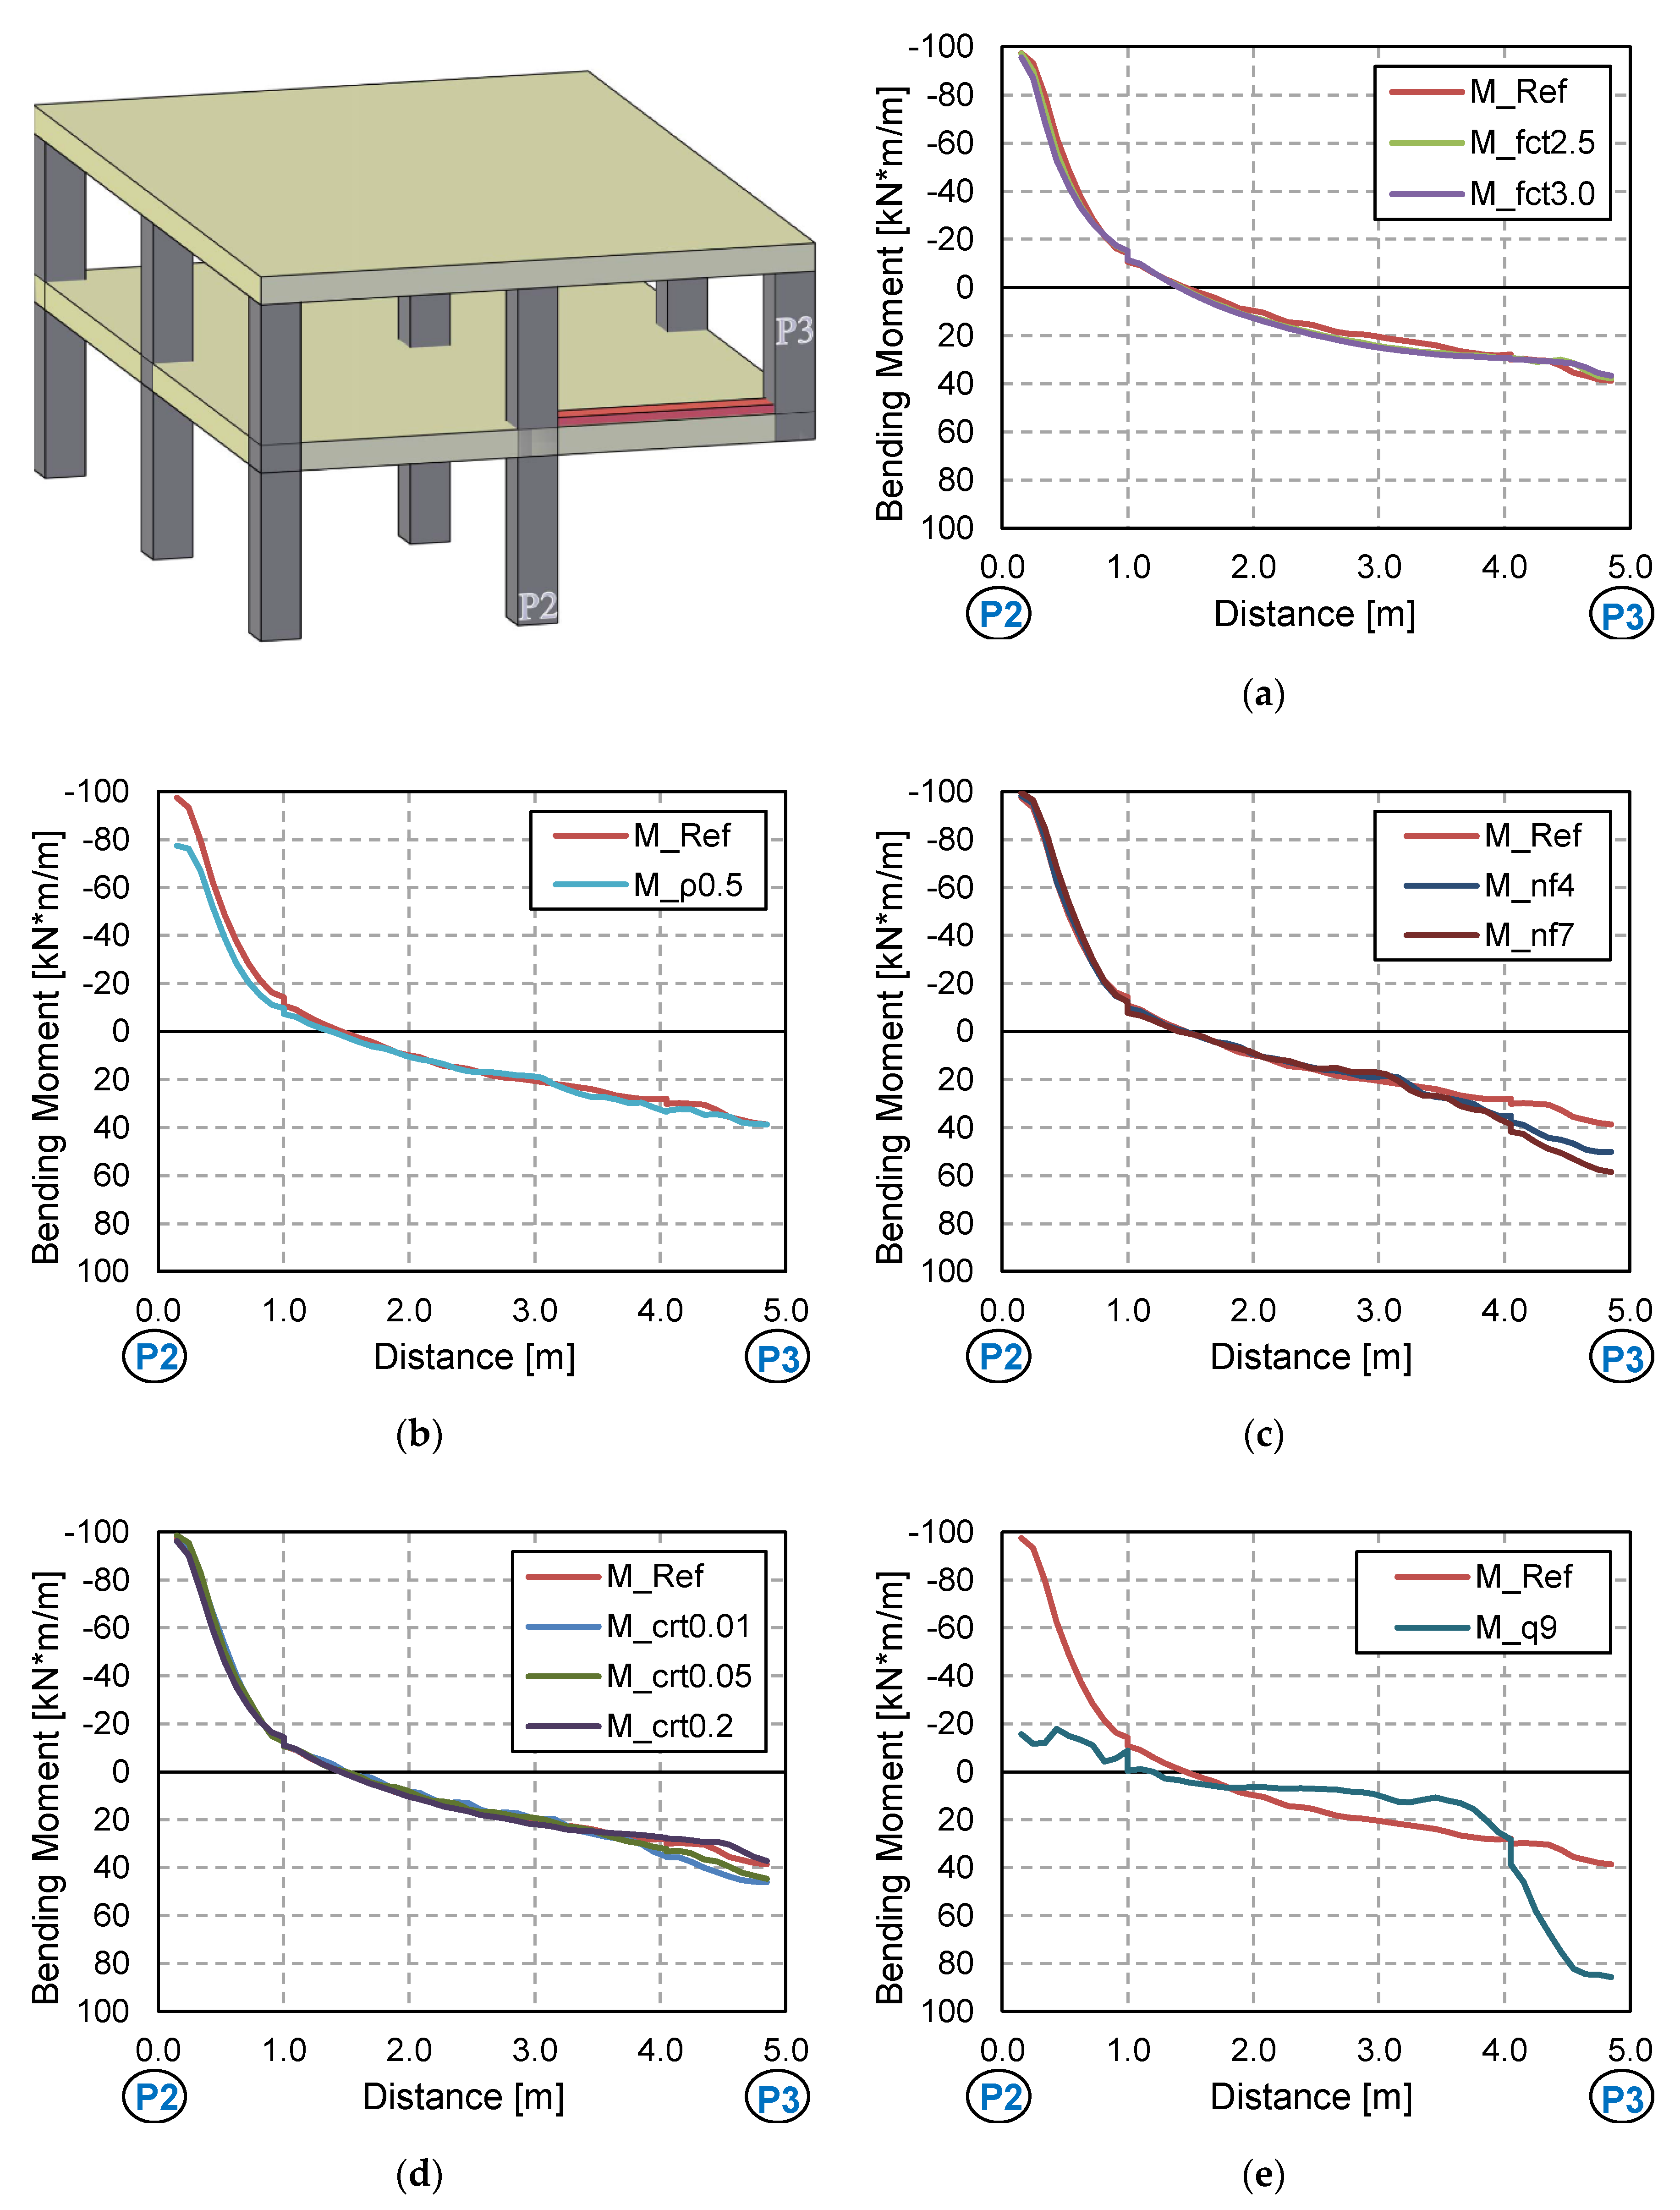
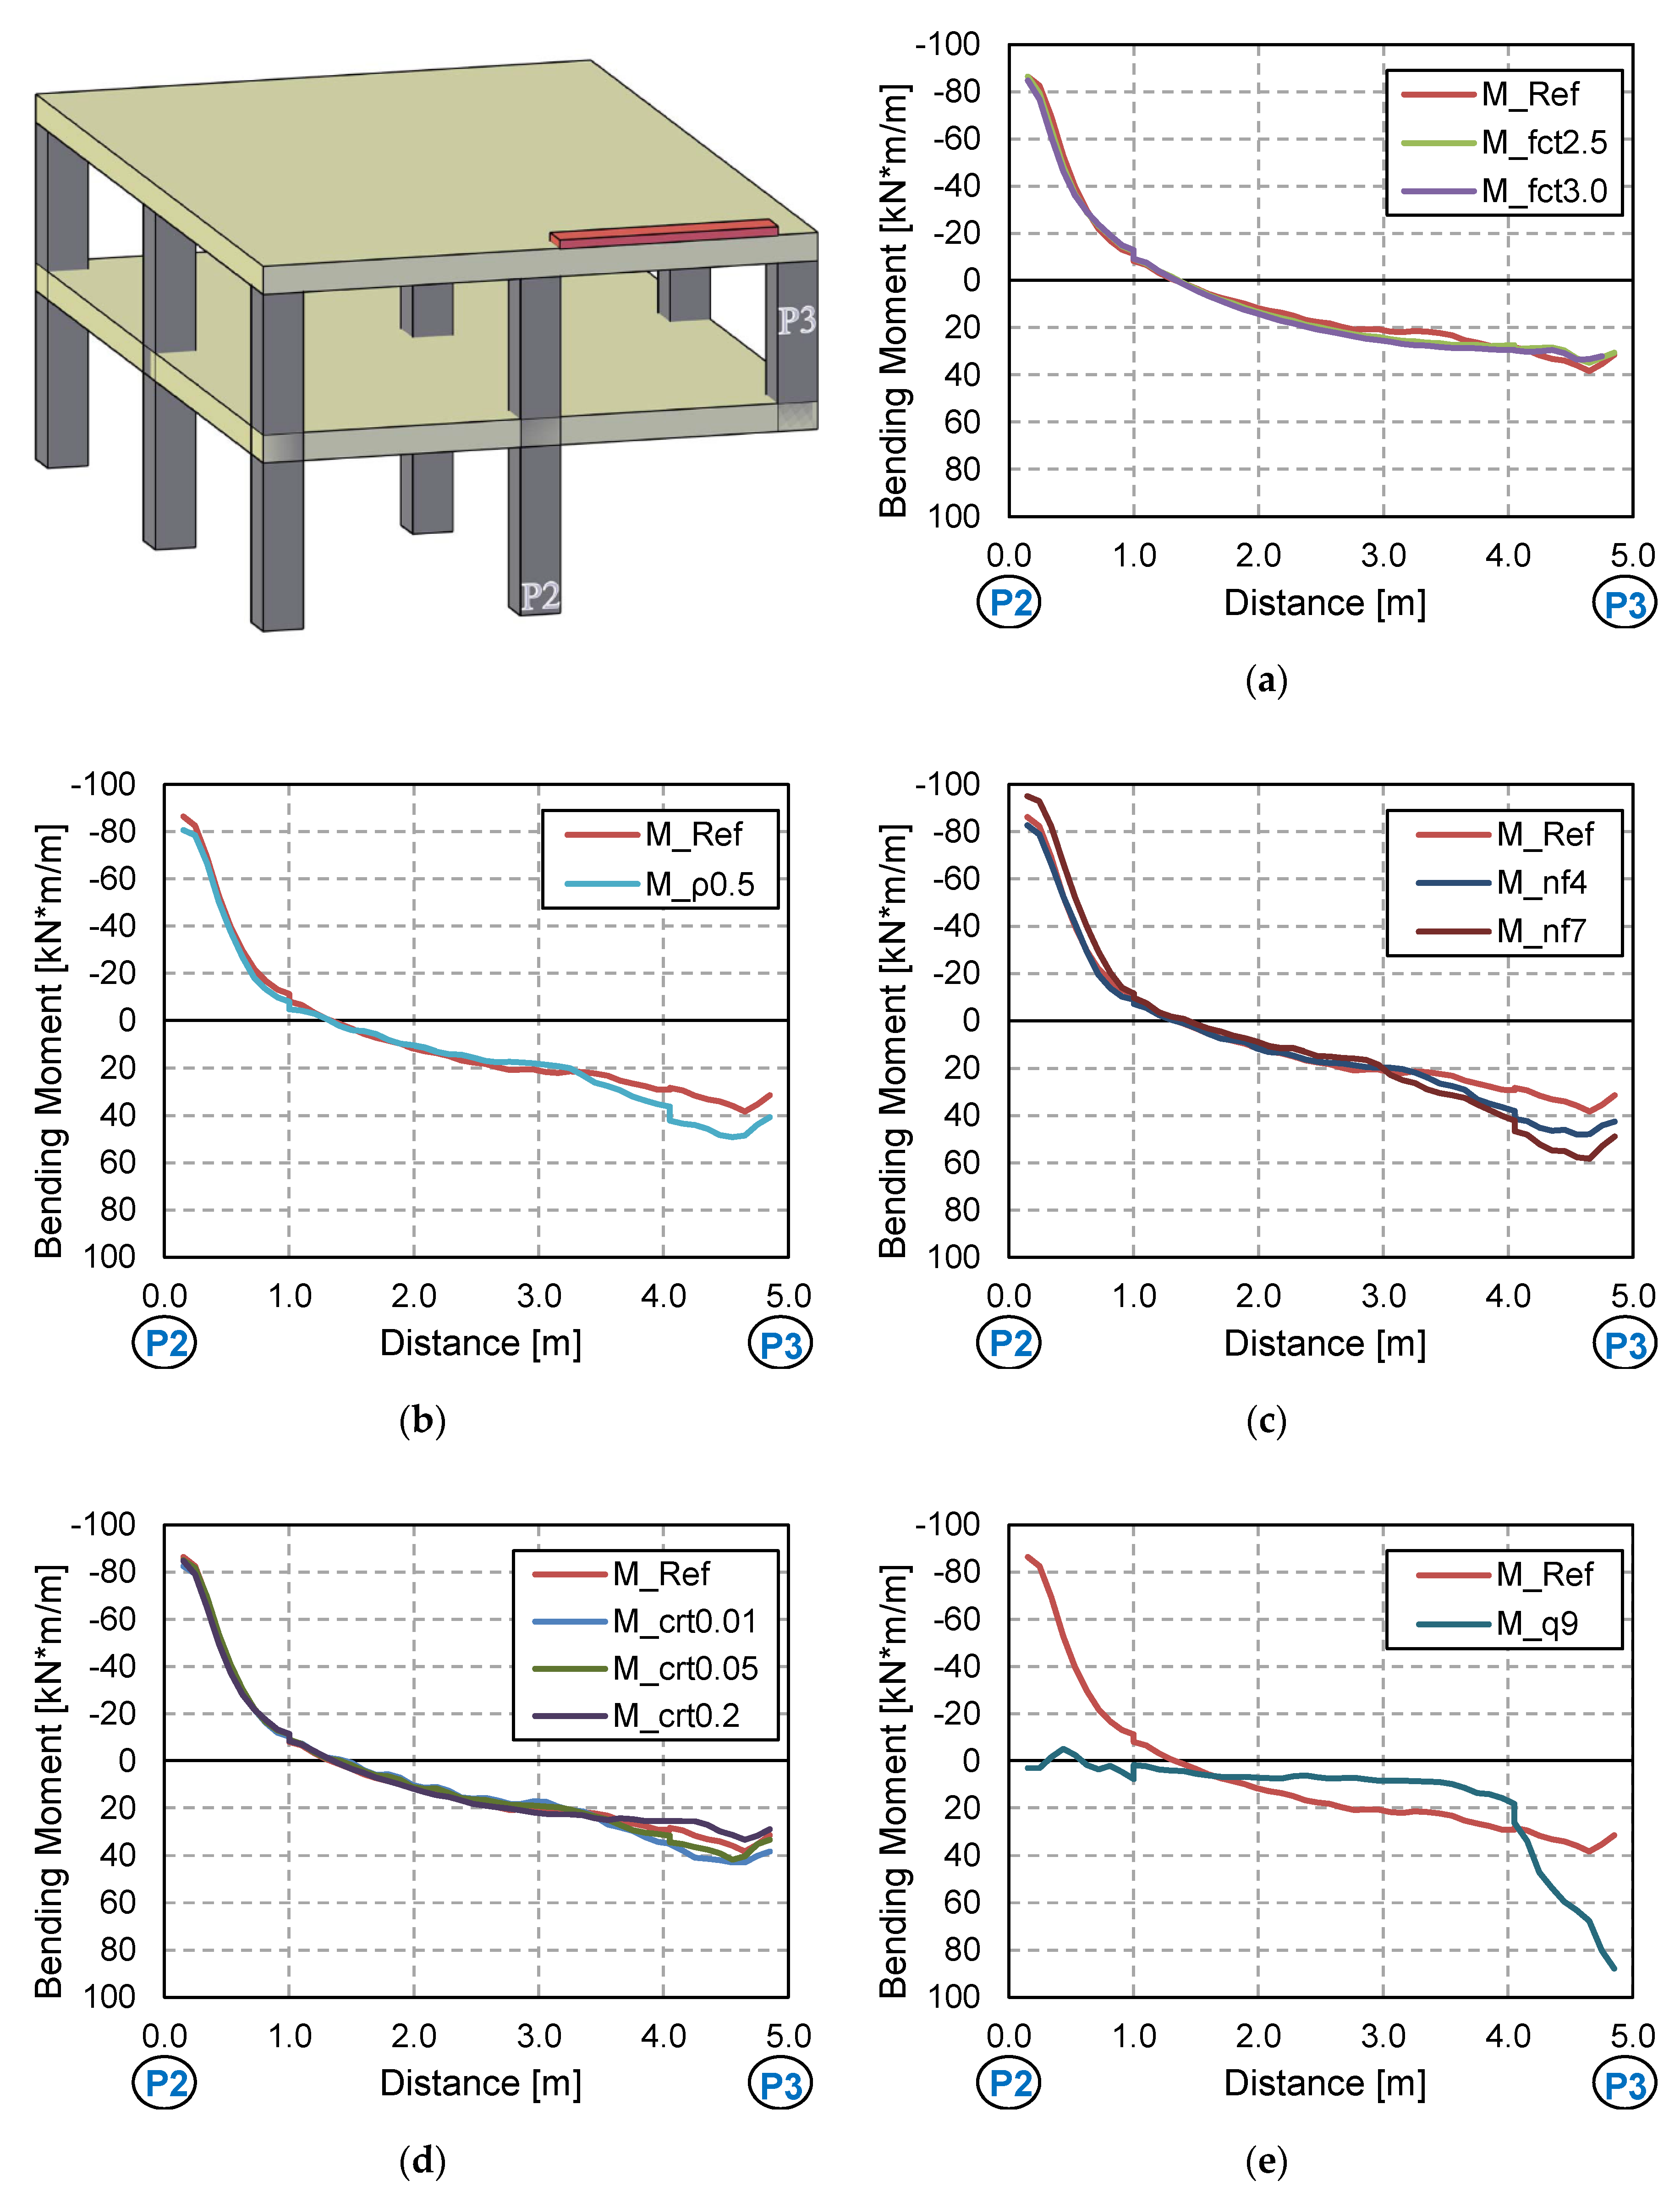
For the dynamic non-linear models processed in ABAQUS in the parametric study, Figure 14 and Figure 15 show the bending moments of the P2–P3 alignment for the first and second slabs, respectively, at the time where the maximum vertical displacement of the structure achieved the peak value. As can be seen, the bending moments have a negative value near P2 and a positive value near P3, this last ranging approximately from 40 kNm/m to 80 kNm/m. Considerably more reinforcement is required in the bottom layer grid near P3 for these cases than the minimum reinforcement of 1.8 cm2/m [40], being around 5.9 cm2/m, 9.1 cm2/m and 12.4 cm2/m for bending moments of 40 kN*m/m, 60 kN*m/m and 80 kN*m/m, respectively. The differences between the parameters, as shown in Figure 14 and Figure 15, are significant for the reinforcement ratio, number of floors and column removal time parameters. However, concrete tensile strength has no influence on the distribution of the analysed bending moments. The results of model M_q9 confirm that the structure yielded, because this model was that of the Ultimate Limit State (ULS) of the structure.

4.2. Dynamic Amplification and Load Increase Factors (DAFs and LIFs)

The scientific community and the international codes [36,37] proposed different types of factors to simplify building structure calculations in extreme events-accidental situations. These factors multiply the applied load to obtain an equivalent load to avoid more complex calculations such as those considering dynamic effects and non-linear material behaviour. The present study focused in two groups: (i) factors applied to simplified non-linear static calculations to address dynamic effects and (ii) factors applied to simplified linear static calculations that consider both material nonlinearities and dynamic effects. The former group of factors can be called Dynamic Amplification Factors (DAFs) [36], while the latter are called Load Increase Factors (LIFs) [27,37].
In this work, both DAFs and LIFs have been computed in the processed models for the parametric study, and both were determined for the displacements and the loads as suggested by codes (e.g., DoD [37]). In displacements, the DAFLD and LIFLD were computed as the difference in the maximum displacement on the top of the removed column (P3) between a static-nonlinear or static-linear and a dynamic-nonlinear FE model, respectively. In the forces, the DAFLF and LIFLF were computed as the difference in the axial force of columns P2/P6 between a static-nonlinear or static-linear and a dynamic-nonlinear FE model, respectively. Table 7 shows the results obtained.
DAFLD values in general were between 1.80 and 2.70, which can be considered consistent with test results, theoretical considerations and codes [27,28,37]. The lower values obtained within this range are related to stiffer models where the dynamic amplification was lower and where damping was higher; for a single degree of freedom system with 7.3% damping (test value), the theoretical DAFLD is 1.79, which is similar to that obtained in M_Ref. The low value of DAFLD in M_crt0.2 was due to the slow removal of the column (i.e., low dynamic amplification). The higher values obtained for DAFLD were predicted in models with parameter leading to higher deformations, accelerations and lower damping effects. In such cases, DAFLD was larger than 2, which could be justified on (a) undesired overly stiff numerical response predicted by the static nonlinear models and (b) valid theoretical considerations, i.e., as shown in [13], for a single degree of freedom system with nonlinear parabolic response and no damping, the DAFLD is larger than 2 (e.g., 10% or higher depending on the curvature of the parabola). The uncommonly high value of DAFLD in M_q9 was due to the formation of a yield line mechanism in the slab leading to development of plastic deflections captured in the dynamic nonlinear analysis. In this case, the values of DAFs and LIFs are strongly influenced by the flexural capacity of the slab, as shown by the yield lines in Figure 11e. It should be noted that values of LIFLD are always higher because material non-linear effects are included in the factor besides the dynamic effects.
The DAFLF and LIFLF values are not significantly different, and they are also relatively constant with changes in the parameters in the study. All the values are around 1.10, slightly inferior to the 1.20–1.30 which the authors obtained in previous studies [13,28] and which can be justified by (i) the fact that the present study considered experimental damping in the FE models and (ii) the small differences found in the reactions peak values between experimental and computational results. Model M_q9 again obtained a value of 1.00 because the load was exactly the yielding load. Model M_crt0.2 had a slightly lower value (1.04), again due to the slow removal of the column.

5. Conclusions

The work carried out included a wide parametric study conducted by advanced FE models validated by a purpose-built full-scale RC building structure subjected to a sudden corner-column removal scenario. The parameters included (i) tensile concrete strength (fct), (ii) flexural reinforcement ratio (ρ), (iii) number of floors (nf), (iv) column removal time (crt) and (v) the applied superimposed load (q). The influence of each parameter was studied on deflections, drifts, forces, damage, Alternative Load Paths (ALPs) and Dynamic Amplification and Load Increase Factors (DAFs and LIFs), for both displacements (DAFLD, LIFLD) and loads (DAFLF, LIFLF). From the results obtained, the following conclusions can be drawn:
  • The tensile concrete strength has a strong influence on the numerical predictions of displacements and structural damage. This affects the computed DAFLD, with low values of fct generally giving more realistic values of DAFLD. This parameter did not have a significant effect on the reactions/forces.
  • The same conclusions can be drawn for the influence of the flexural reinforcement ratio, although in this case it also had a significant influence on the member reaction/force values. However, this influence is not transferred to the computed DAFLF, which is not significantly influenced by this parameter.
  • The number of floors also has a clear influence on both vertical displacements and member reaction/forces. However, DAFLD and DAFLF are not influenced by this parameter.
  • Column removal time has a strong influence on vertical displacements and bending moments, although it barely affects the reaction forces’ peak and residual force values. Due to the wide variation found, it is always recommended to assume the worst possible case at the limit of the GSA recommendations [36] to establish a column removal time equal to a tenth of the structure’s fundamental period without the missing column (T/10).
  • The applied superimposed load had a strong influence on all the aspects studied. A comparison was made between a load combination for ULS and a common design accidental load. Results showed that considering a more aggressive scenario than a design accidental situation could result in making different and erroneous recommendations on the safe side, in some cases (e.g., excessive deflections or forces can be considered in a design accidental situation but this is a persistent and transient situation), but these recommendations would still be unsafe for the DAFLF (i.e., resulting in a lower value than in a design accidental situation).
  • The test and FE models in this paper showed that Vierendeel action was the main ALP of the structure for the particular case investigated, i.e., without infill walls and subjected to a design compliant corner-column removal situation. The rest of the column above the removed one acts as a key element in effectively activating this ALP. However, for this ALP to be safe, a series of reinforcement details should be in the design phase of the structure.

Author Contributions

Conceptualization, J.M.A., J.S. and M.B.; methodology, J.M.A., J.S., M.B., E.B. and J.G.-R.; software, E.B., M.B. and J.G.-R.; validation, E.B. and M.B.; formal analysis, M.B. and E.B.; investigation, J.M.A., J.S., M.B., E.B. and J.G.-R.; resources, J.M.A. and J.S.; data curation, E.B. and M.B.; writing—original draft preparation, M.B. and E.B.; writing—review and editing, J.M.A., J.S., M.B., E.B. and J.G.-R.; visualization, E.B. and M.B.; supervision, J.S. and J.M.A.; project administration, J.M.A. and J.S.; funding acquisition, J.M.A., J.S., M.B. and E.B. All authors have read and agreed to the published version of the manuscript.

Funding

This research was funded by Fundación BBVABecas Leonardo a Investigadores y Creadores Culturales 2017; the Spanish Ministry of Economy, Industry and Competitiveness, grant number BIA2017-88322-R-AR; Generalitat Valenciana/Fons Social Europeu, grant number APOSTD/2019/101 and Universitat Politècnica de València, grant number PAID-10-17. This work is also part of the project “Extension of theoretical models against progressive collapse for tall and supertall concrete buildings”, funded by the Engineering Physical Science Research Council (EPSRC) of the UK as part of an Impact Acceleration Account (IAA) held at the University of Surrey (grant number EP/K008153/1), and a continuation of two research projects also funded by EPSRC of the UK (grant ref: EP/K503939 and grant ref: EP/K008153/1).

Acknowledgments

The authors would also like to express their gratitude to Daniel Tasquer, for his technical support during the tests, and to Juan J. Moragues and Pedro A. Calderón for their invaluable cooperation.

Conflicts of Interest

The authors declare no conflict of interest. The funders had no role in the design of the study, in the collection, analyses, or interpretation of data in the writing of the manuscript or in the decision to publish the results.

Appendix A

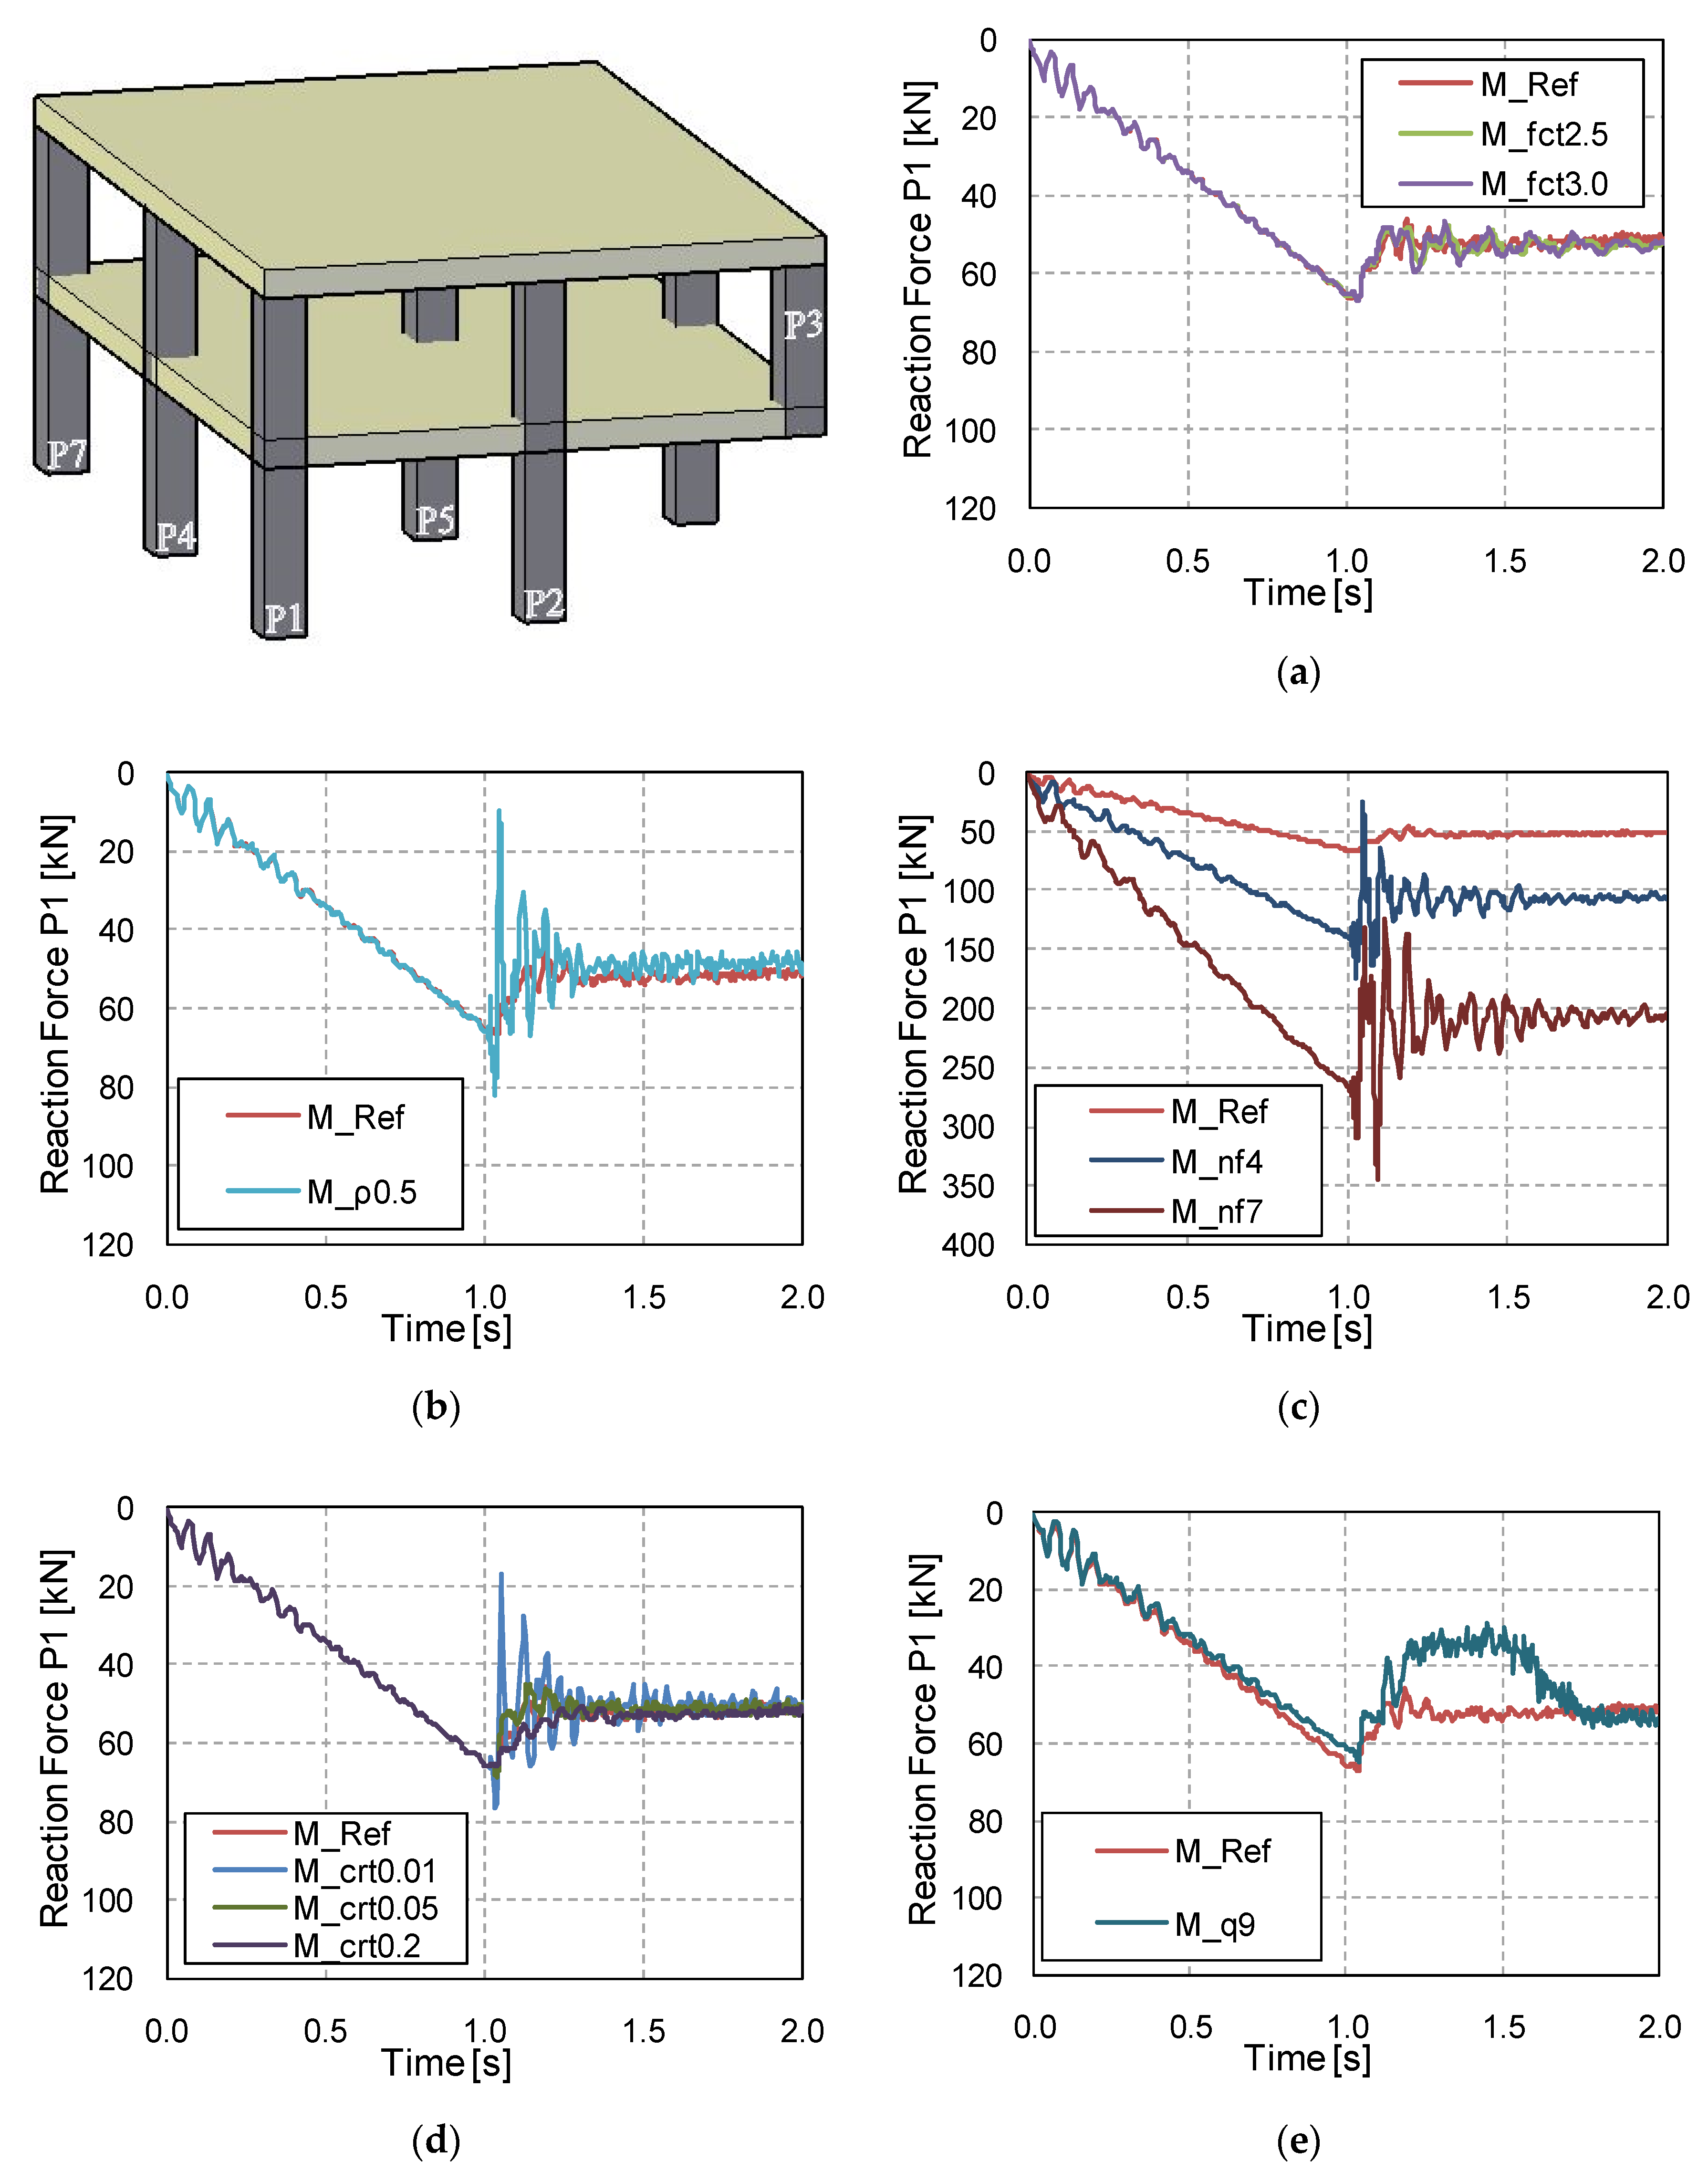
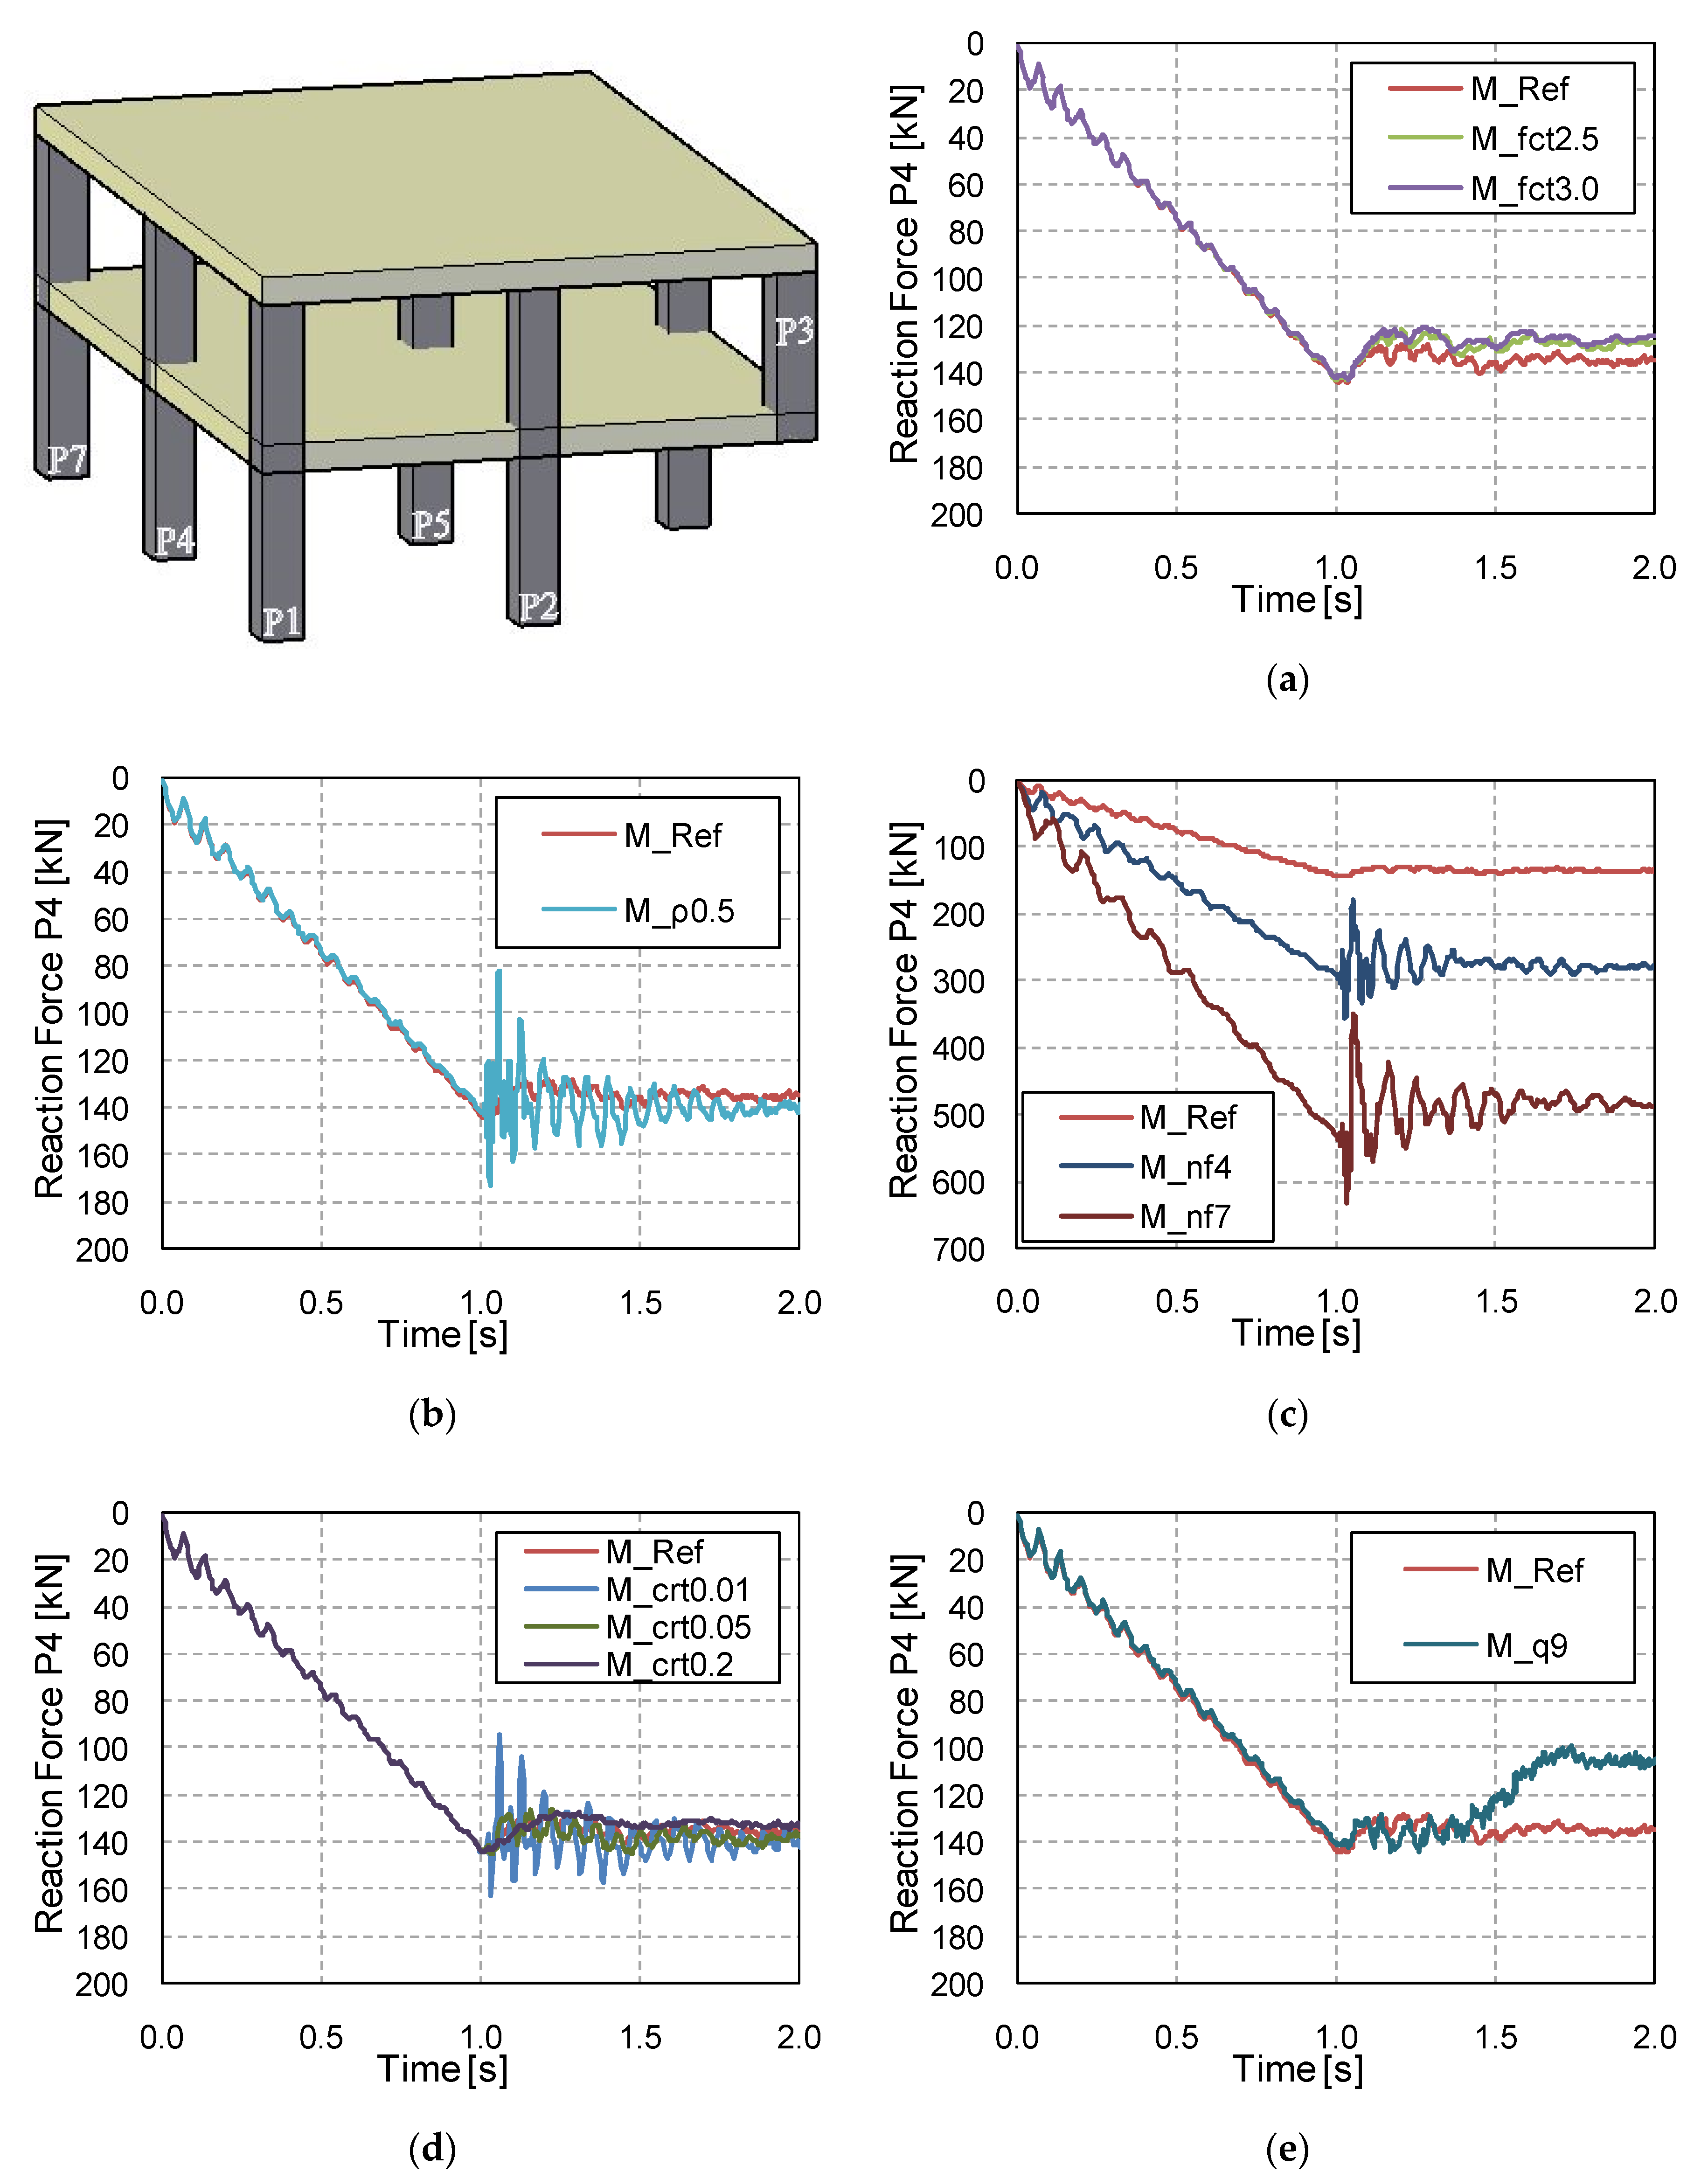
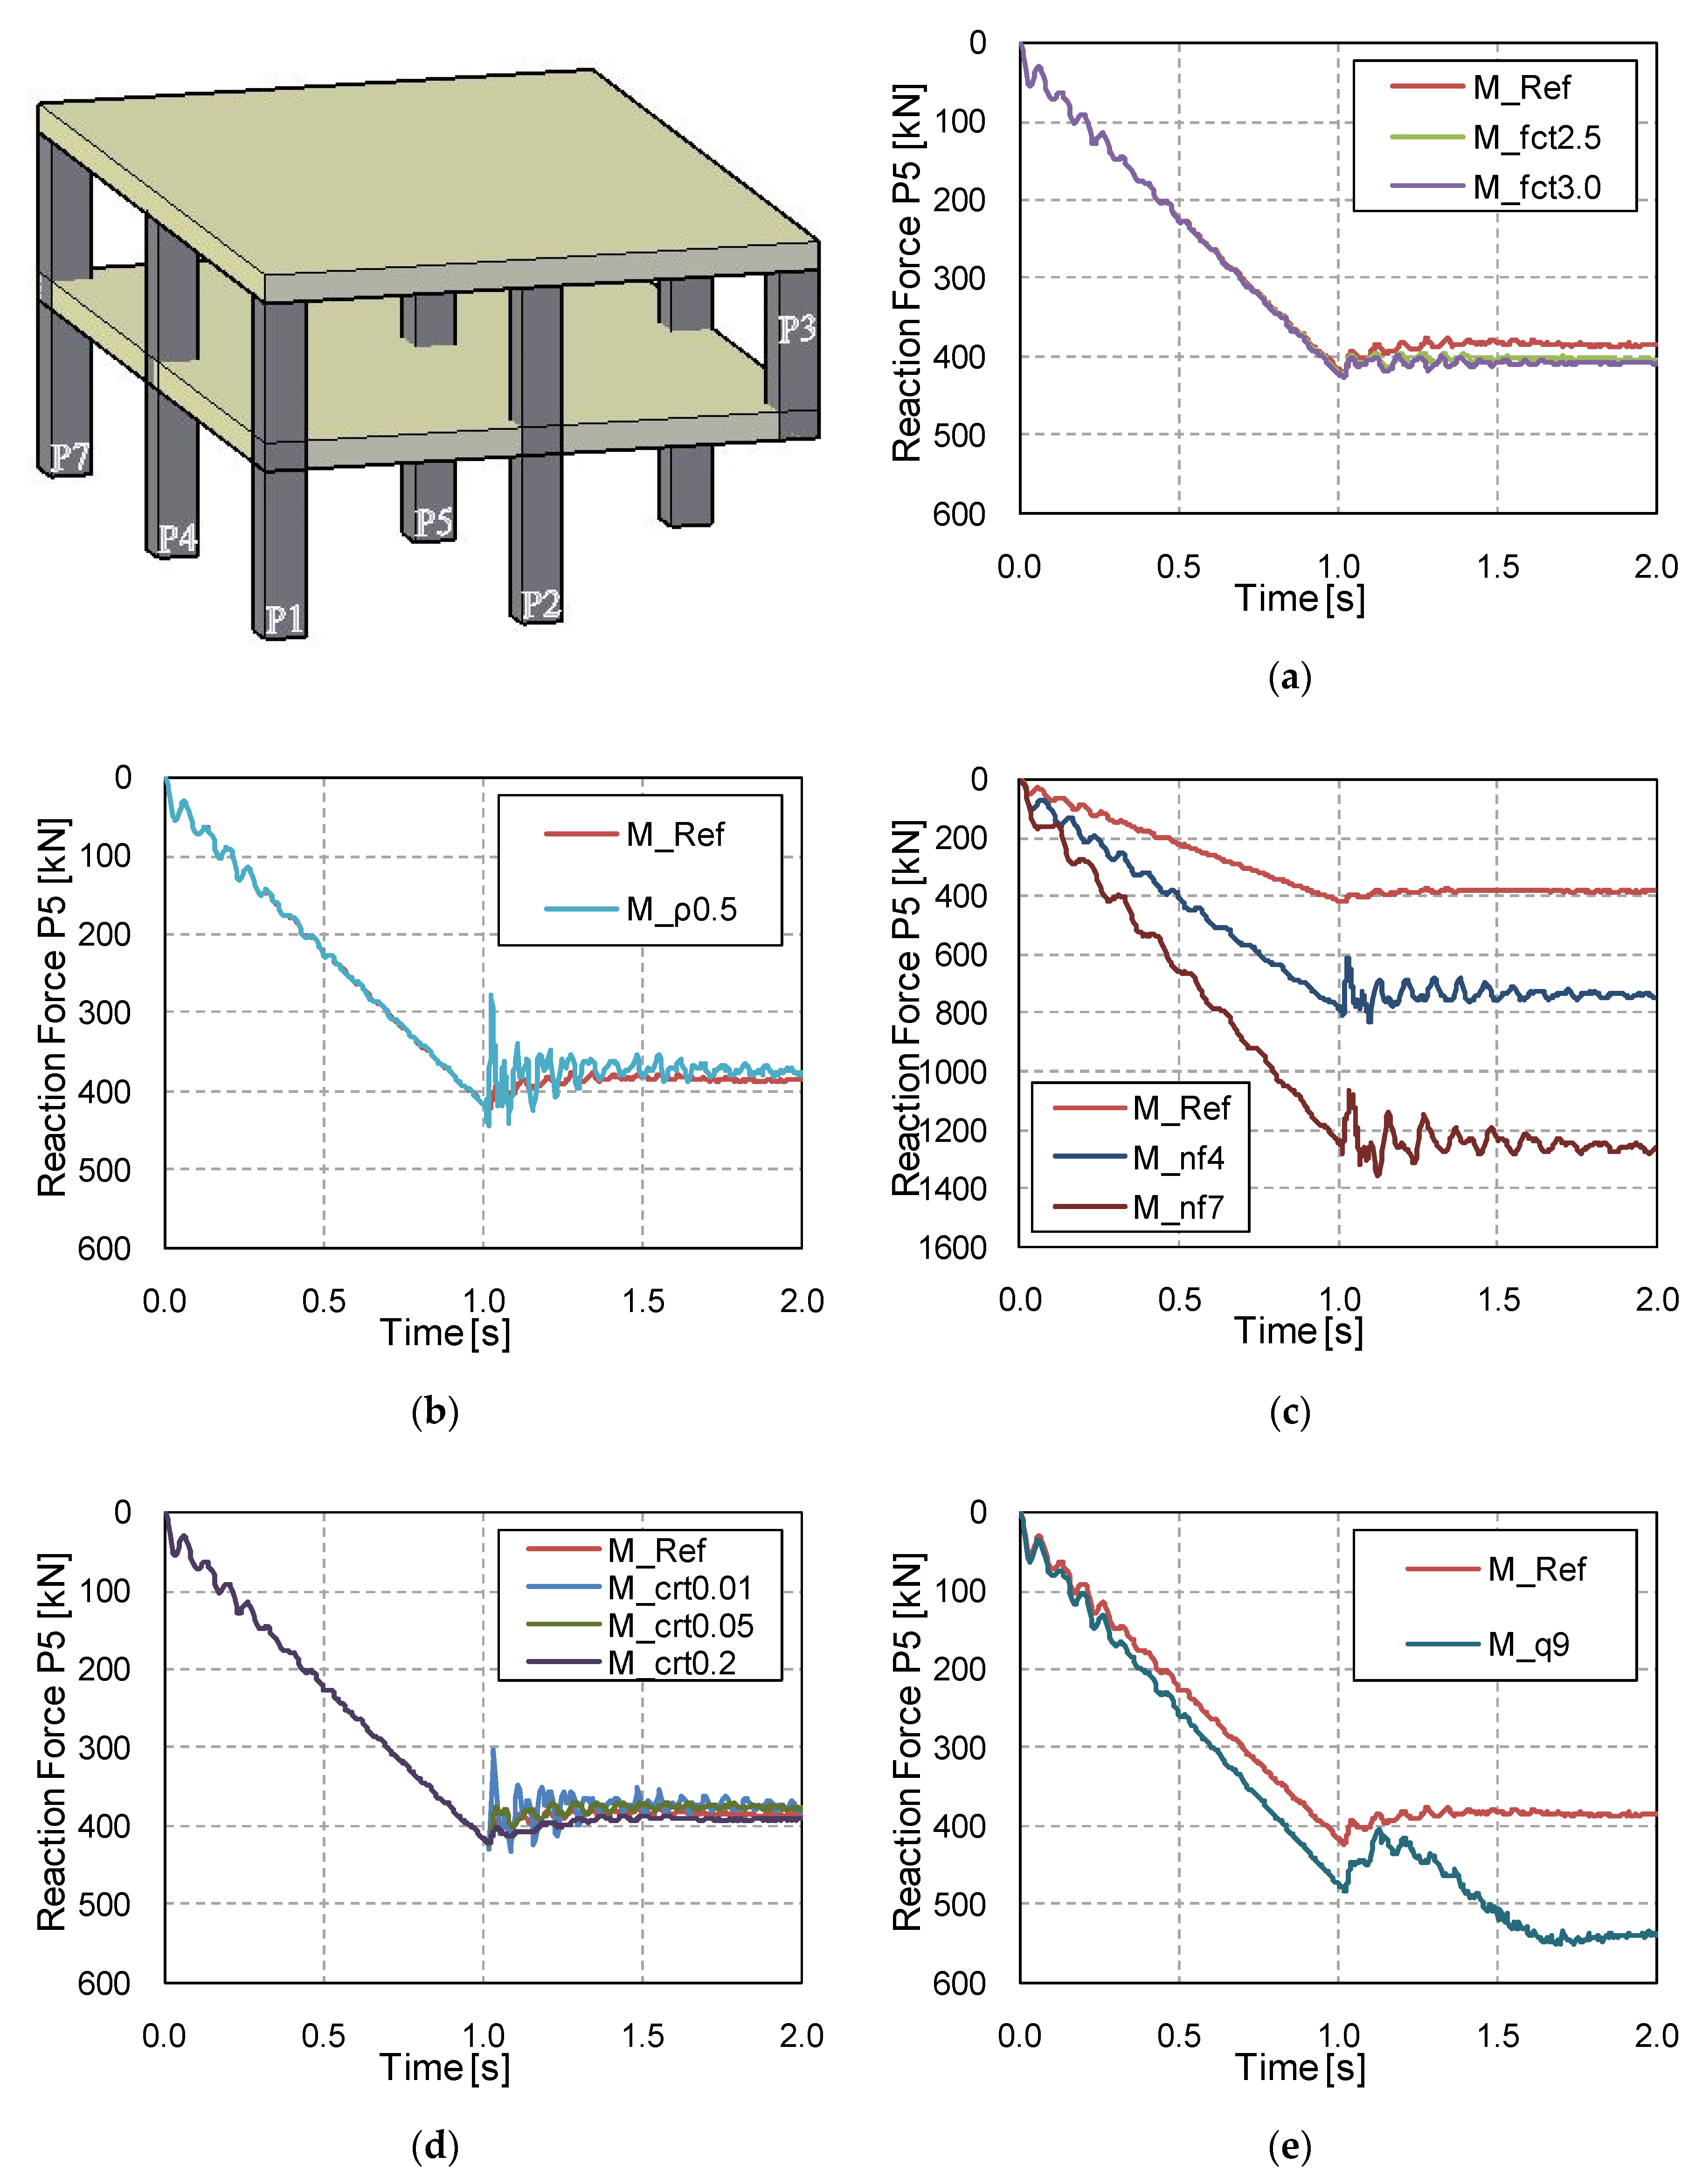
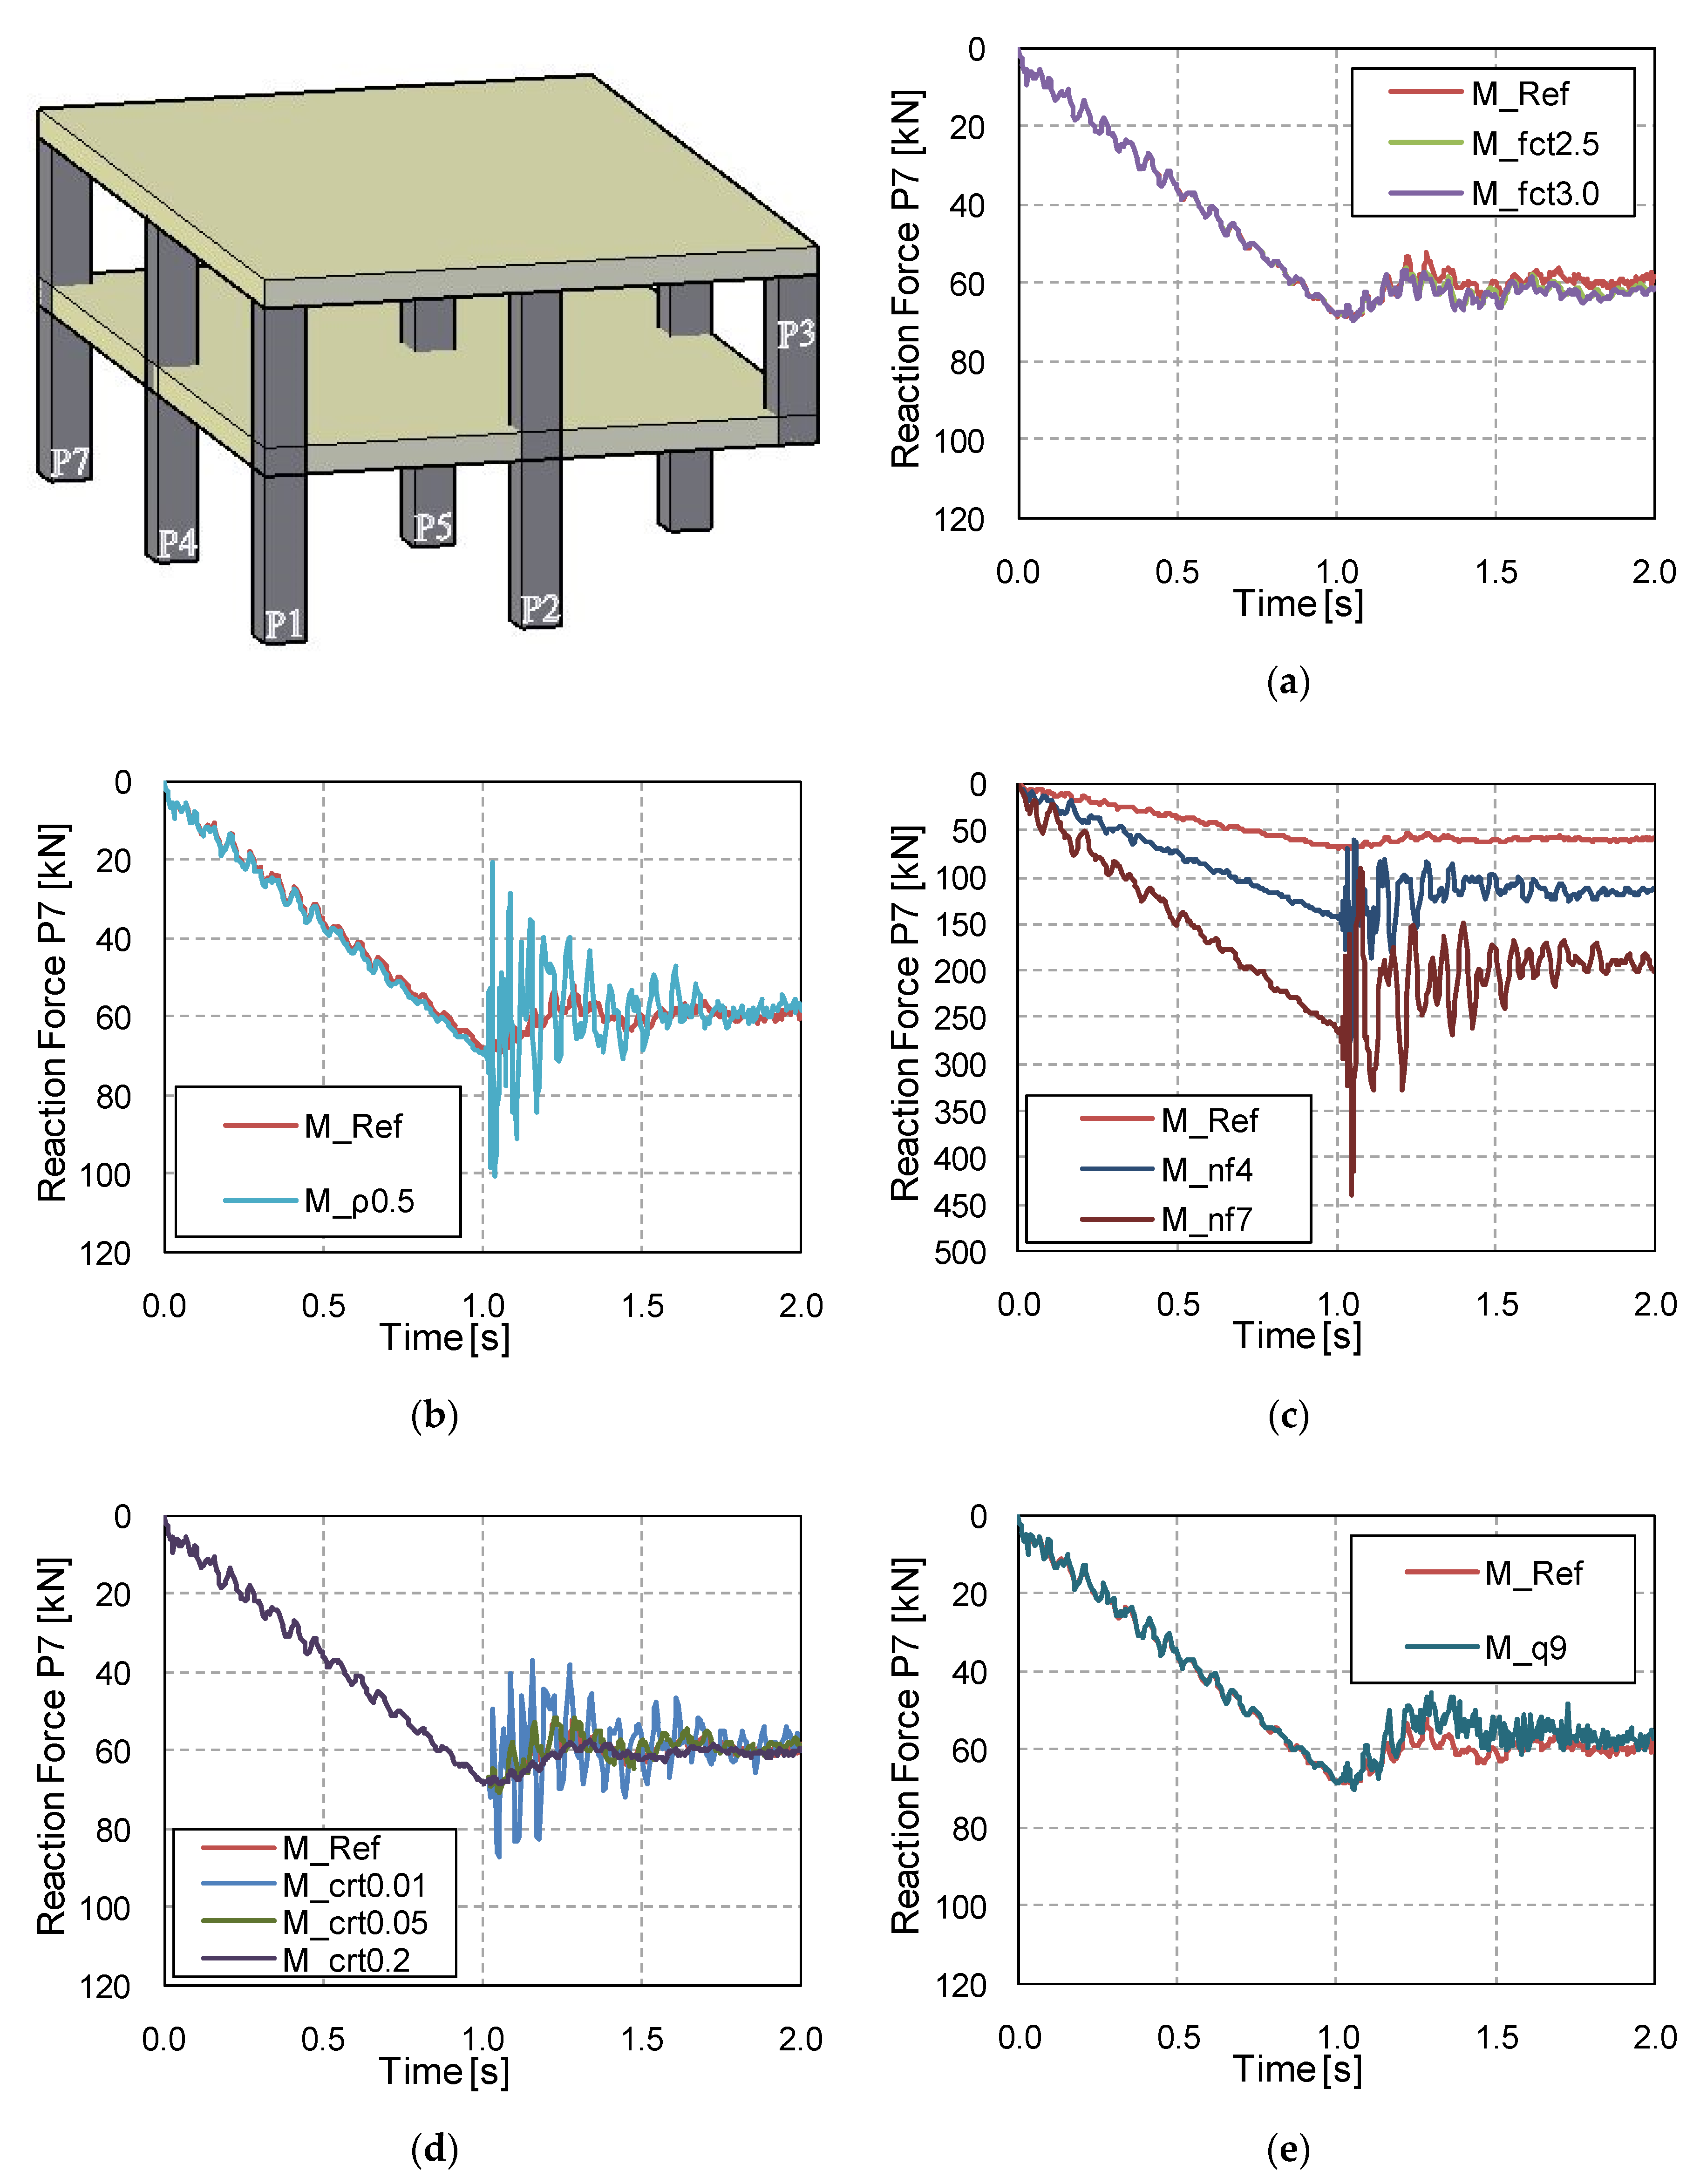
This section is devoted to the presentation of additional results obtained in columns P1, P4, P5 and P7 of the building. The numerical results are subdivided into five groups of simulations. In detail, the reaction force obtained in columns P1, P4, P5 and P7 are depicted in Figure A1, Figure A2, Figure A3 and Figure A4, respectively.
Figure A1. Numerical reaction in P1 obtained by varying (a) concrete tensile strength, (b) flexural reinforcement ratio, (c) number of floors, (d) column removal time and (e) superimposed load. Positive values indicate compression.
Applsci 10 08911 g0a1
Figure A2. Numerical reaction in P4 obtained by varying (a) concrete tensile strength, (b) flexural reinforcement ratio, (c) number of floors, (d) column removal time and (e) superimposed load. Positive values indicate compression.
Applsci 10 08911 g0a2
Figure A3. Numerical reaction in P5 obtained by varying (a) concrete tensile strength, (b) flexural reinforcement ratio, (c) number of floors, (d) column removal time, and (e) superimposed load. Positive values indicate compression.
Applsci 10 08911 g0a3
Figure A4. Numerical reaction in P7 obtained by varying (a) concrete tensile strength, (b) flexural reinforcement ratio, (c) number of floors, (d) column removal time and (e) superimposed load. Positive values indicate compression.
Applsci 10 08911 g0a4

References

  1. Adam, J.M.; Parisi, F.; Sagaseta, J.; Lu, X. Research and practice on progressive collapse and robustness of building structures in the 21st century. Eng. Struct. 2018, 173, 122–149. [Google Scholar] [CrossRef]
  2. Kiakojouri, F.; De Biagi, V.; Chiaia, B.; Sheidaii, M.R. Progressive collapse of framed building structures: Current knowledge and future prospects. Eng. Struct. 2020, 206, 110061. [Google Scholar] [CrossRef]
  3. Stephen, D.; Lam, D.; Forth, J.; Ye, J.; Tsavdaridis, K.D. An evaluation of modelling approaches and column removal time on progressive collapse of building. J. Constr. Steel Res. 2019, 153, 243–253. [Google Scholar] [CrossRef]
  4. Eren, N.; Brunesi, E.; Nascimbene, R. Influence of masonry infills on the progressive collapse resistance of reinforced concrete framed buildings. Eng. Struct. 2019, 178, 375–394. [Google Scholar] [CrossRef]
  5. Zhang, L.; Li, H.; Wang, W. Retrofit strategies against progressive collapse of steel gravity frames. Appl. Sci. 2020, 10, 4600. [Google Scholar] [CrossRef]
  6. De Biagi, V.; Kiakojouri, F.; Chiaia, B.; Sheidaii, M.R. A simplified method for assessing the response of RC frame structures to sudden column removal. Appl. Sci. 2020, 10, 3081. [Google Scholar] [CrossRef]
  7. Yu, J.; Luo, L.; Li, Y. Numerical study of progressive collapse resistance of RC beam-slab substructures under perimeter column removal scenarios. Eng. Struct. 2018, 159, 14–27. [Google Scholar] [CrossRef]
  8. Bermejo, M.; Santos, A.P.; Goicolea, J.M. Development of Practical Finite Element Models for Collapse of Reinforced Concrete Structures and Experimental Validation. Shock Vib. 2017, 1–9. [Google Scholar] [CrossRef] [Green Version]
  9. Fu, Q.; Tan, K.-H. Numerical study on steel-concrete composite floor systems under corner column removal scenario. Structures 2019. [Google Scholar] [CrossRef] [Green Version]
  10. Kolchunov, V.; Fedorova, N.; Savin, S.; Kovalev, V.; Iliushchenko, T. Failure simulation of a RC multi-storey building frame with prestressed girders. Mag. Civ. Eng. 2019, 92, 155–162. [Google Scholar] [CrossRef]
  11. Mucedero, G.; Perrone, D.; Brunesi, E.; Monteiro, R. Numerical Modelling and Validation of the Response of Masonry Infilled RC Frames Using Experimental Testing Results. Buildings 2020, 10, 182. [Google Scholar] [CrossRef]
  12. Tohidi, M.; Janby, A. Finite-Element Modeling of Progressive Failure for Floor-to-Floor Assembly in the Precast Cross-Wall Structures. J. Struct. Eng. 2020, 146, 04020087. [Google Scholar] [CrossRef]
  13. Garzón-Roca, J.; Sagaseta, J.; Buitrago, M.; Adam, J.M. Dynamic punching assessment of edge columns after sudden corner column removal. ACI Struct. J. 2020. [Google Scholar]
  14. Olmati, P.; Sagaseta, J.; Cormie, D.; Jones, A.E.K. Simplified reliability analysis of punching in reinforced concrete flat slab buildings under accidental actions. Eng. Struct. 2017, 130, 83–98. [Google Scholar] [CrossRef] [Green Version]
  15. Buitrago, M.; Sagaseta, J.; Adam, J.M. Avoiding failures during building construction using structural fuses as load limiters on temporary shoring structures. Eng. Struct. 2020, 204, 109906. [Google Scholar] [CrossRef]
  16. Buitrago, M.; Sagaseta, J.; Adam, J.M. Effects of sudden failure of shoring elements in concrete building structures under construction. Eng. Struct. 2018, 172, 508–522. [Google Scholar] [CrossRef] [Green Version]
  17. Joshi, D.D.; Patel, P.V. Experimental study of precast dry connections constructed away from beam–column junction under progressive collapse scenario. Asian J. Civ. Eng. 2019, 20, 209–222. [Google Scholar] [CrossRef]
  18. Ma, F.; Gilbert, B.P.; Guan, H.; Xue, H.; Lu, X.; Li, Y. Experimental study on the progressive collapse behaviour of RC flat plate substructures subjected to corner column removal scenarios. Eng. Struct. 2019, 180, 728–741. [Google Scholar] [CrossRef]
  19. Yang, T.; Han, Z.; Deng, N.; Chen, W. Collapse responses of concrete frames reinforced with BFRP bars in middle column removal scenario. Appl. Sci. 2019, 9, 4436. [Google Scholar] [CrossRef] [Green Version]
  20. Faridmehr, I.; Baghban, M.H. An overview of progressive collapse behavior of steel beam-to-column connections. Appl. Sci. 2020, 10, 6003. [Google Scholar] [CrossRef]
  21. Qian, K.; Li, B. Strengthening and Retrofitting Precast Concrete Buildings to Mitigate Progressive Collapse Using Externally Bonded GFRP Strips. J. Compos. Constr. 2019, 23, 1–15. [Google Scholar] [CrossRef]
  22. Lin, K.; Lu, X.; Li, Y.; Guan, H. Experimental study of a novel multi-hazard resistant prefabricated concrete frame structure. Soil Dyn. Earthq. Eng. 2019, 119, 390–407. [Google Scholar] [CrossRef]
  23. Qian, K.; Liang, S.-L.; Feng, D.-C.; Fu, F.; Wu, G. Experimental and Numerical Investigation on Progressive Collapse Resistance of Post-Tensioned Precast Concrete Beam-Column Subassemblages. J. Struct. Eng. 2020, 146, 04020170. [Google Scholar] [CrossRef]
  24. Zhou, Y.; Hu, X.; Pei, Y.; Hwang, H.-J.; Chen, T.; Yi, W.; Deng, L. Dynamic load test on progressive collapse resistance of fully assembled precast concrete frame structures. Eng. Struct. 2020, 214, 110675. [Google Scholar] [CrossRef]
  25. Alshaikh, I.M.H.; Bakar, B.H.A.; Alwesabi, E.A.H.; Akil, H.M. Experimental investigation of the progressive collapse of reinforced concrete structures: An overview. Structures 2020, 25, 881–900. [Google Scholar] [CrossRef]
  26. Buitrago, M.; Bertolesi, E.; Calderón, P.A.; Adam, J.M. Robustness of steel truss bridges: Laboratory testing of a full-scale 21-metre bridge span. Structures 2021. [Google Scholar] [CrossRef]
  27. Buitrago, M.; Bertolesi, E.; Sagaseta, J.; Calderón, P.A.; Adam, J.M. Robustness of RC building structures with infill masonry walls: Tests on a purpose-built building. Eng. Struct. 2021, 226, 111384. [Google Scholar] [CrossRef]
  28. Adam, J.M.; Buitrago, M.; Bertolesi, E.; Sagaseta, J.; Moragues, J.J. Dynamic performance of a real-scale reinforced concrete building test under corner-column failure scenario. Eng. Struct. 2020, 210, 110414. [Google Scholar] [CrossRef]
  29. Osteraas, J.D. Murrah building bombing revisited: A qualitative assessment of blast damage and collapse patterns. J. Perform. Constr. Facil. 2006, 20, 330–335. [Google Scholar] [CrossRef]
  30. Bažant, Z.P.; Le, J.-L.; Greening, F.R.; Benson, D.B. What Did and Did Not Cause Collapse of World Trade Center Twin Towers in New York? J. Eng. Mech. 2008, 134, 892–906. [Google Scholar] [CrossRef]
  31. Sasani, M.; Kazemi, A.; Sagiroglu, S.; Forest, S. Progressive Collapse Resistance of an Actual 11-Story Structure Subjected to Severe Initial Damage. J. Struct. Eng. 2011, 137, 893–902. [Google Scholar] [CrossRef]
  32. Pearson, C.; Delatte, N. Ronan Point Apartment Tower Collapse and its Effect on Building Codes. J. Perform. Constr. Facil. 2005, 19, 172–177. [Google Scholar] [CrossRef] [Green Version]
  33. Xiao, Y.; Kunnath, S.; Li, F.W.; Zhao, Y.B.; Lew, H.S.; Bao, Y. Collapse Test of Three-Story Half-Scale Reinforced Concrete Frame Building. ACI Struct. J. 2015, 112, 429–438. [Google Scholar] [CrossRef]
  34. Qian, K.; Weng, Y.H.; Li, B. Impact of two columns missing on dynamic response of RC flat slab structures. Eng. Struct. 2018, 177, 598–615. [Google Scholar] [CrossRef]
  35. Feng, P.; Qiang, H.; Ou, X.; Qin, W.; Yang, J. Progressive Collapse Resistance of GFRP-Strengthened RC Beam–Slab Subassemblages in a Corner Column–Removal Scenario. J. Compos. Constr. 2019, 23, 1–15. [Google Scholar] [CrossRef]
  36. GSA. Alternate Path Analysis & Design Guidelines for Progressive Collapse Resistance; General Services Administration: Washington, WA, USA, 2013.
  37. DoD. Design of Buildings to Resist Progressive Collapse (UFC 4-023-03); Department of Defense: Washington, WA, USA, 2009.
  38. EN 1991-1-7. Eurocode 1: Actions on Structures—Part 1-7: General Actions—Accidental Actions; CEN: Brussels, Belgium, 2006. [Google Scholar]
  39. EN 1990. Eurocode: Basis of Structural Design; CEN: Brussels, Belgium, 2002. [Google Scholar]
  40. EN 1992-1-1. Eurocode 2: Design of Concrete Structures—Part 1-1: General Rules and Rules for Buildings; CEN: Brussels, Belgium, 2004. [Google Scholar]
  41. ABAQUS v16.4. Theory Manual; Dassault Systèmes: París, French, 2016. [Google Scholar]
  42. Zhou, Y.; Chen, T.; Pei, Y.; Hwang, H.-J.; Hu, X.; Yi, W.; Deng, L. Static load test on progressive collapse resistance of fully assembled precast concrete frame structure. Eng. Struct. 2019, 200, 109719. [Google Scholar] [CrossRef]
  43. Gao, S.; Guo, L. Progressive collapse analysis of 20-storey building considering composite action of floor slab. Int. J. Steel Struct. 2015, 15, 447–458. [Google Scholar] [CrossRef]
  44. Wang, F.; Yang, J.; Shah, S. Effect of Horizontal Restraints on Progressive Collapse Resistance of Precast Concrete Beam-Column Framed Substructures. KSCE J. Civ. Eng. 2020, 24, 879–889. [Google Scholar] [CrossRef]
  45. Zhang, H.; Shu, G.; Pan, R. Failure Mechanism of Composite Frames Under the Corner Column-Removal Scenario. J. Fail. Anal. Prev. 2019, 19, 649–664. [Google Scholar] [CrossRef]
  46. LS-DYNA. Theory Manual; LSTC: Livermore, CA, USA, 2012. [Google Scholar]
  47. Micallef, K.; Sagaseta, J.; Fernández Ruiz, M.; Muttoni, A. Assessing punching shear failure in reinforced concrete flat slabs subjected to localised impact loading. Int. J. Impact Eng. 2014, 71, 17–33. [Google Scholar] [CrossRef] [Green Version]
  48. Chen, X.; Duan, J.; Li, Y. Mass proportional damping in nonlinear time-history analysis. In Proceedings of the 3rd International Conference on Material, Mechanical and Manufacturing Engineering (IC3ME), Guangzhou, China, 27–28 June 2015; pp. 567–571. [Google Scholar]
  49. SAP2000. Theory Manual; Computers & Structures Inc.: California, CA, USA, 2020. [Google Scholar]
Figure 1. Sketch and photograph of the building prepared for the sudden corner-column removal.
Applsci 10 08911 g001
Figure 2. Finite Element (FE) model without the ground floor column P3 (column removed). Colours represent sections with different amounts of reinforcement according to the building details [28].
Applsci 10 08911 g002
Figure 3. Comparison of the residual vertical deformed shape of the first floor between P2 and P3 in the experimental test [28] and FE model.
Applsci 10 08911 g003
Figure 4. Comparison of the residual horizontal displacement/drift of the structure between the test [28] and the FE model. Positive values indicate horizontal displacement towards the removed column.
Applsci 10 08911 g004
Figure 5. Comparison of the test [28] and FE model for the axial force increments in columns P1, P2/P6, P5 and P7. Positive values indicate compression.
Applsci 10 08911 g005
Figure 6. Comparison of the tensile damage (DAMAGET) between the FE model and test [28].
Applsci 10 08911 g006
Figure 7. Numerical residual deformed shapes along 1st floor corner-bay slab between P2 and P3 obtained by varying (a) concrete tensile strength, (b) flexural reinforcement ratio, (c) number of floors, (d) column removal time and (e) superimposed load. Positive values indicate downward displacements.
Applsci 10 08911 g007aApplsci 10 08911 g007b
Figure 8. Numerical residual horizontal drift obtained by varying (a) concrete tensile strength, (b) flexural reinforcement ratio, (c) number of floors, (d) column removal time and (e) superimposed load.
Applsci 10 08911 g008aApplsci 10 08911 g008b
Figure 9. Numerical reaction in P2 obtained by varying (a) concrete tensile strength, (b) flexural reinforcement ratio, (c) number of floors, (d) column removal time and (e) superimposed load. Positive values indicate compression.
Applsci 10 08911 g009
Figure 10. Numerical axial force in P3 (first floor) obtained by varying (a) concrete tensile strength, (b) flexural reinforcement ratio, (c) number of floors, (d) column removal time and (e) superimposed load. Positive values indicate compression.
Applsci 10 08911 g010
Figure 11. Computed tensile damage at t = 2 s obtained for (a) M_fct2.5, (b) M_ρ0.5, (c) M_nf7, (d) M_crt0.2 and (e) M_q9.
Applsci 10 08911 g011aApplsci 10 08911 g011b
Figure 12. Conceptualisation of static column removal effects (deformed shape, axial and shear forces and bending moments) of the building under study in design situations before (initial state) and after (cantilever and Vierendeel) column removal.
Applsci 10 08911 g012
Figure 13. Shear and axial force of first floor column P3 before and after column removal for the different models. Positive axial force values indicate compression.
Applsci 10 08911 g013
Figure 14. Influence of different parameters on bending moments from P2 to P3 in the first slab: (a) tensile strength, (b) flexural reinforcement ratio, (c) number of floors, (d) column removal time, (e) superimposed load.
Applsci 10 08911 g014
Figure 15. Influence of different parameters on bending moments from P2 to P3 in the second slab: (a) tensile strength, (b) flexural reinforcement ratio, (c) number of floors, (d) column removal time, (e) superimposed load.
Applsci 10 08911 g015
Table 1. Mechanical properties of concrete for columns and slabs.
Mechanical PropertyElementResult [MPa]
Compressive strength(fc)1st slab30.5
2nd slab31.1
Tensile strength(fct)1st slab2.44
2nd slab1.83
Elastic Modulus(E)Ground floor columns29,275
1st slab28,810
1st floor columns29,403
2nd slab33,119
Table 2. Comparison of the peak and residual values of maximum vertical displacement and drift between the test [28] and the FE model.
ComponentValueTestFE ModelError [mm]
Maximum vertical displacement [mm]Peak−48.1−41.96.2
Residual−42.8−40.52.3
Drift [mm]Floor 1Peak1.400.840.56
Residual0.400.380.02
Floor 2Peak4.802.342.46
Residual2.401.530.87
Table 3. Parametric study.
ModelParameters
fct [MPa] 1ρ1nfcrt [s]q [kN/m2] 1
Reference (M_Ref)2.00.8%20.15.3
M_fct2.52.50.8%20.15.3
M_fct3.03.00.8%20.15.3
M_ρ0.52.00.5%20.15.3
M_nf42.00.8%40.15.3
M_nf72.00.8%70.15.3
M_crt0.012.00.8%20.015.3
M_crt0.052.00.8%20.055.3
M_crt0.22.00.8%20.25.3
M_q92.00.8%20.19.0
1 Considered equal for slabs 1 and 2.
Table 4. Vertical displacement peak and residual values obtained at five points on the 1st floor slab from P2 edge to P3 edge. Units in mm.
ModelDistance [m]
0.621.673.334.355
PeakResidualPeakResidualPeakResidualPeakResidualPeakResidual
M_Ref4.474.3917.6117.3836.6036.0944.4643.8446.8846.18
M_fct2.53.142.9711.8411.1724.1022.5129.3327.3331.3229.02
M_fct32.742.549.999.1620.1518.2424.4522.0626.2023.63
M_ρ0.57.547.4827.7827.6457.3557.2069.8369.4672.8572.48
M_nf47.2097.1726.9626.7856.0955.5368.0967.5371.2370.41
M_nf78.378.2629.9429.6361.6360.8274.5473.5577.7176.52
M_crt0.016.056.0023.7023.6050.1449.7260.4560.1363.4263.32
M_crt0.055.485.3921.6221.3845.2844.7355.0654.3357.8356.99
M_crt0.23.443.3913.4413.2727.6127.2333.5033.0335.6235.11
M_q95.325.32230.7230.7446.80446.80533.54533.54556.30556.30
Table 5. Percentage increase/decrease in maximum residual vertical displacements.
ModelVertical Displacement in P3 [mm]Increase/Decrease [%]
M_Ref46.18-
M_fct2.529.02−37.2%
M_fct3.023.63−48.8%
M_ρ0.572.4857.0%
M_nf470.4152.5%
M_nf776.5265.7%
M_crt0.0163.3237.1%
M_crt0.0556.9923.4%
M_crt0.235.11−24.0%
M_q9556.301104.7%
Table 6. Residual and peak horizontal drift values obtained in each floor for each model. Units in mm.
ModelFloor
1st Floor2nd Floor
PeakResidualPeakResidual
M_Ref0.610.211.991.36
M_fct2.50.730.281.851.16
M_fct30.710.271.761.11
M_ρ0.50.450.061.951.30
M_nf40.410.072.051.37
M_nf70.160.011.581.35
M_crt0.010.630.142.141.46
M_crt0.050.620.162.061.38
M_crt0.20.530.221.701.30
M_q9−0.74−0.461.571.05
Table 7. Dynamic Amplification Factors (DAFs) and Load Increase Factors (LIFs) for displacements (DAFLD and LIFLD) and forces (DAFLF and LIFLF).
ModelStatic
Nonlinear
Static
Linear
Dynamic
Nonlinear
DAFLDLIFLDDAFLFLIFLF
Max. Disp.
[mm]
Axial Force P2/P6 [kN]Max. Disp.
[mm]
Axial Force P2/P6 [kN]Max. Disp.
[mm]
Axial Force P2/P6 [kN]
M_Ref25.6317.414.1317.346.9340.11.833.331.071.07
M_fct2.520.6316.014.1317.331.3346.41.522.221.101.09
M_fct3.018.4316.114.1317.326.2351.41.421.861.111.11
M_ρ0.526.9317.914.1317.272.7350.62.705.161.101.11
M_nf427.8645.015.2649.670.3720.72.534.631.121.11
M_nf730.71138.818.11152.177.71267.42.534.291.111.10
M_crt0.0125.6317.414.1317.363.4352.62.484.561.111.11
M_crt0.0525.6317.414.1317.357.8343.62.264.101.081.08
M_crt0.225.6317.414.1317.335.6330.51.392.521.041.04
M_q976.3411.418.7399.3556.8398.67.3029.780.971.00
Publisher’s Note: MDPI stays neutral with regard to jurisdictional claims in published maps and institutional affiliations.