Feature Application
CO2 diffusivity of concrete is a key material parameter for predicting the carbonation rate of concrete under atmosphere. Therefore, this study was to develop a method for predicting the diffusivity with mixing proportion conditions and hydration degree of cement. In the future, the diffusivity prediction model developed in this study is expected to be combined with carbonation model and used to construct various scenarios of service life prediction of concrete structures.
Abstract
Carbonation of cementitious materials is one of main causes of reinforcement corrosion and CO2 diffusivity influenced by microstructural characteristics of the cementitious materials is a decisive parameter for the carbonation rate. This study focused on establishing a multifactor functional model to calculate the CO2 diffusivity of carbonated cementitious materials. Because CO2 gas flows through carbonated zone, it is necessary to estimate CO2 diffusivity of carbonated concrete. Many factors on the CO2 diffusivity, such as the diffusivity in vapor, tortuosity, microstructural characteristics of cement paste, contribution of aggregate, and reduction of porosity due to carbonation, were considered. Apparent and effective CO2 diffusivity were calculated according to the absence or presence of moisture in the pore system of concrete, and the results were compared with previous research.
1. Introduction
Concrete contains a lot of calcium hydroxide in pores because the hydration reaction of C3S (3CaO∙SiO2) and C2S (2CaO∙SiO2) abundantly in cement. This can help maintain a strong alkaline environment with pH 12.5 to 13.0 in pore solution and thus reinforcement embedded in the concrete can be well protected from corrosion. If CO2 gas in the atmosphere diffuses into concrete, however, all the available calcium hydroxide is consumed due to the reaction of the carbonation. Calcium carbonate is produced from this reaction and causes a decrease in pH of pore solution to a level where the passive layer of reinforcement embedded in concrete breaks down. Carbonation may not be harmful for the concrete itself, however, reinforcement corrosion can occur immediately if the pH of the pore water drops below 11.5. As a result, carbonation can precipitate reinforcement corrosion, which ultimately reduces long-term durability performance of concrete. Thus, calculating carbonation rate is very important for predicting service life of the reinforced concrete and CO2 diffusivity is a crucial parameter for the carbonation rate.
By the way, molecular diffusion and advection through porous media are the main driving force on the penetration of harmful substances such as chloride ions, CO2 or O2 gas, and so on [1,2,3]. For carbonation of concrete, once CO2 gas flow through pore of the materials, CO2 gas is dissolved in pore solution and reacts with cement hydrates. Diffusivity stands for flow rate of harmful substances and CO2 diffusivity of cementitious material must be defined for predicting long-term durability. Most studies have obtained only chloride diffusivity of cementitious materials [4,5,6]. From decades of practical experience and theoretical considerations, however, it is well known that carbonation of concrete is one of main causes of deterioration of concrete [7]. Since the long-term performance of concrete structure is greatly dependent on reaction and the migration rate of CO2 gas in concrete, the CO2 diffusivity plays a key part in designing and estimating concrete structures under crowded urban area with high CO2 gas.
Meanwhile, diffusivity of cementitious materials depends on time because ongoing cement hydration of cement can lead to significant densification of pore system of the cementitious materials [8]. Moreover, diffusivity of concrete is affected by various factors such as (a) pore structure system with the type of cement; (b) all mixing proportional properties of concrete; (c) interfacial transition zone between cement paste and aggregate; (d) environmental conditions such as temperature and humidity, and so on. Therefore, it is difficult to define the diffusivity of concrete systematically.
In fact, in recent decades, various methodologies for defining the diffusivity of concrete have been proposed from empirical solution to computational model [5,6]. Practical and realistic model can be realized by means of a simple formulation with affecting multi-factors. However, the relationship between each factor and the diffusivity or interference effect was not clear in previous research [9,10]. CO2 diffusivity of concrete has a functional relationship with the pore system of cement paste during the time when the diffusion of CO2 takes place through already carbonated concrete. It is usually assumed that carbonation front progresses after all Ca(OH)2 has been transformed. It is important to examine knowledge about the diffusion properties of the carbonated concrete. Carbonation process is assumed to consist of a diffusion of CO2 through carbonated zone to a front where all of the CO2 is assumed by reaction with cement hydrates. The gradient for the diffusion process is the concentration gradient of free CO2 from surface concrete to carbonation depth, as shown in Figure 1. According to the figure, CO2 concentration is zero at the carbonation front, while CO2 gas reacts with cement hydrates at carbonation zone and CO2 gas does not exist at noncarbonated zone. This implies that CO2 flows through the carbonation zone by carbonation rate depicted with CO2 diffusivity, reaches the noncarbonated zone, and reacts with the cement hydrates. Therefore, CO2 diffusivity should be estimated, based on the microstructure characteristics and changed system of microstructure due to carbonation.
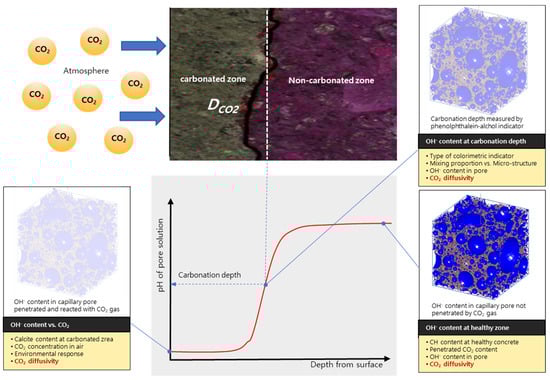
Figure 1.
Importance of CO2 diffusivity as a decisive parameter for controlling carbonation rate of concrete. In this figure, the degree of carbonation of concrete is expressed as the hydroxyl concentration of cement hydrates. In the carbonated area, the pH of the pore solution is greatly reduced, and the rate depends on CO2 concentration in the atmosphere as an environment response. For noncarbonated area, it has an original pH value. The border between the two areas can be determined by spraying a phenolphthalein-alcohol indicator and this also can be influenced by OH− content. The CO2 diffusivity is a material parameter that can make all these decisions.
This study suggests a comprehensive model for the apparent and the effective CO2 diffusivity of concrete, based on the previous research [4]. It was investigated how much pore solution in the concrete reduces the CO2 diffusivity due to pore blocking at each stage of cement hydration. In particular, the difference in the CO2 diffusivity between carbonated concrete and noncarbonated concrete was examined. The approach of this study is expected to be useful in the development of integrated carbonation model at each hydration stage of cement in the future.
2. Modeling of CO2 Diffusivity
2.1. Formulation of CO2 Diffusivity of Concrete
Among the models for estimating chloride diffusivity of concrete, practical multifunctional approaches have been proposed [9,10]. However, the solutions could not clearly provide the mutual interference effect between the diffusivity and affecting factors on element function. This study was conducted as an applied study essential for predicting carbonation, based on the author’s previous work [4]. Model for oxygen diffusivity was established with the approach [11].
Concrete is a random composite material composed of two phases, cement paste and aggregate. Thus, diffusivity of concrete (Dconc) can be expressed as a contribution function of cement paste (Dcp) and aggregate (Dagg), respectively:
Dconc = F (Dcp, Dagg)
Main functions of diffusivity of cement paste consists of diffusivity in vapor, F(Do(T)), microstructure characteristics, F(Stmicro), tortuosity, F(), disturbed diffusion, F(H). The combination of these factors can be described in Equation (2) and theoretical formulation of CO2 diffusivity was constructed with the approach as a reference [4]. The schematic diagram was elaborated in Figure 2.

Figure 2.
Model of CO2 diffusivity with four multifunction (modified from [4]).
2.2. CO2 Diffusivity in Vapor
The first term of Equation (2), (a) F(Do), means CO2 diffusivity in vapor. CO2 gas can flow through bulk pore which is not filled with solution. Diffusion theory on gases is theoretically established from kinetic molecular theory [12]. Fuller et al. suggested the diffusivity D in vapor has a function of both temperature and pressure [13]. They suggested gaseous diffusivity in vapor:
in which, Dv: vapor diffusivity, T: temperature, Ma, Mb: molecular weight of components a and b, P: total pressure. According to this equation, the value of CO2 diffusivity is approximately 0.16 cm2/s in the air pore system of concrete.
2.3. Microstructure Characterization of Cement Paste
2.3.1. Pore Structural Properties in Cement Paste
The second term of Equation (2), (a) F(Stmicro), means microstructure effect of cement paste. Pore volume and the size distribution are the main factors to characterize fluid transportation through porous media in terms of microstructural characteristics. Porosity distribution function was suggested by Maekawa et al. [14]:
where,
dVp = Br exp(‒Br) d lnr
- Vp: volumetric fraction of pore with distribution up to pore radius, r,
- B: a peak point of porosity distribution on a logarithmic scale.
If ln r replaces x, r is substituted for exp(x). Equation (4) is derived as:
With increasing degree of hydration, the pore volume decreases, mainly at the cost of the volume of the larger pores. Thus, total porosity (Vp) was calculated by HYMOSTRUC [15] for each hydration step, numerical simulation program for cement hydration. A peak point of porosity distribution B was back calculated from Equation (5).
2.3.2. Tortuosity
To account of the winding streamline of CO2 gas, tortuosity factor was suggested in previous work of author [4]. Although it makes sense to regard the morphology of cement core as a circular shape, it is assumed to be a square to simplify the fluid streamline [16]. The difference is reflected with shape functional ratio between circle and square and thus, average streamline of tortuosity was depicted as:
For depicting flow complexity through cement paste, CO2 diffusivity has a function with 2, as shown in Equation (2).
2.3.3. Pore Blocking Due to Moisture
Diffusivity is significantly influenced by relative humidity in cementitious materials [17]. Because gas cannot penetrate through pore water, amount of capillary water should be reflected in estimating effective diffusivity. During the hydration process, capillary pores are gradually emptied until a thermodynamic equilibrium is reached. The effective pore volume () of the gaseous inflow is equivalent to the volumetric fraction of vapor, which means the remaining air pore fraction depending on the degree of saturation (Sr) in system [18]:
The pore system vs. degree of saturation is illustrated in Figure 3. The remaining amount of the pore water and volume of pore system were calculated with hydration process. The pore structure system of the material is filled with vapor and pore water. If concrete is assumed to be an infinite material, moisture from outdoor environment is less easy to mobilize and moisture evaporation due to external heat should be ignored. Thus, the amount of pore water can be regarded as the amount of capillary water.
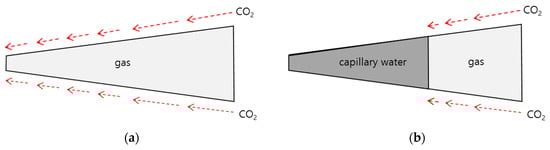
Figure 3.
Comparison of CO2 apparent diffusivity and CO2 effective diffusivity. (a) Apparent pore system; (b) Effective pore system.
Pore system of cementitious materials consists of space filled with pore water (Vw) and remaining space with vapor (Vg):
Vp = Vw + Vg
Following capillary water consumed due to ongoing cement hydration [15], amount of pore water also can be expressed as:
in which, ρi: specific mass of i, α: degree of hydration.
Therefore, volumetric fraction of gas (Vg) vs. the volume of the cement paste (Vcp) can be expressed as:
Therefore, the CO2 diffusivity can be divided into two diffusivities; (a) apparent diffusivity of the condition described in Figure 3a, ignoring the moisture and considering the total pores; (b) effective diffusivity of the condition described in Figure 3b, considering the effective pores through which moisture is excluded from the total pores and gas can penetrate. The calculation result was shown in Figure 4.

Figure 4.
Volumetric fraction of gas and capillary water in pore system.
2.4. Disturbed Diffusion
The fourth term of Equation (2), (d) F(H), can express hindered diffusion due to interaction of substance and narrow path between pore walls. As the molecular diameter of the harmful substances approaches the pore wall, the transport of the harmful substances through the pore should be disturbed by the narrow pore wall. The function of the disturbed diffusion is described as [19]:
Two correction factors, and , are related to the reduced pore diameter :
where,
- ds: kinetic diameter (3.34 × 10⁻⁸ cm for CO2 gas).
- dpore: diameter of pore,
The first correlation factor, based on geometrical arguments, can be expressed as:
in which, td means a twice thickness of adsorbed layer. The second correlation factor can be expressed as Renkin equation:
The effect is effective to depict disturbed diffusion rate due to consequence of narrow pore diameter and collision of CO2 gaseous molecules to each other.
2.5. Effect of Aggregate
The above methods are influencing factors for obtaining the CO2 diffusivity of the cement paste. Concrete consists of cement paste and aggregate. Effective medium theory (EMT) is used to change diffusivity of composite materials with two phases [20,21]. EMT pertains to analytical modeling that describes the macroscopic properties of composite materials and can be a solution on concentration gradients between phases of the materials. The diffusivity of composite material with two phases can be expressed as:
where,
- D1, D2: the diffusivities in two phases,
- V1, V2: the volumetric fractions of the two phases,
- V1 = 1 − V, V2 = V,
- C1, C2: the mass concentrations in the different zones,
- , the distribution of substances between the phases,
- ,
- .
In EMT theory, the neighborhood region in the multiphase materials is assumed to be a uniform medium. This means that there should exist no correlation between different regions [21]. Diffusivity of cement paste was calculated from multifunctional model described in Section 2.3 and Section 2.4, depending hydration stage of cement. The CO2 diffusivity of aggregate was regarded as a constant to be 1 × 10⁻¹¹ cm2/s [22].
2.6. Porosity Reduction Due to Carbonation
Carbonation of concrete greatly affects changes of pore structure system, which is inevitably connected to the rate of CO2 diffusion through carbonated concrete. The change of pore structure system in concrete due to carbonation was limited to OPC concrete, in this study. Papadakis et al. proposed the following equation, based on the ratio of the volume of Ca(OH)2 and CSH in concrete before carbonation to calcium carbonate after carbonation [23]:
where,
- : porosity of concrete after carbonation,
- : porosity of concrete before carbonation.
Decreased porosity due to carbonation () is approximately equal to:
in which, and are equivalent to 3.85 × 10⁻⁶ m3/mol, 15.39 × 10⁻⁶ m3/mol, respectively. Although the concrete is carbonated, the pores of the aggregate remain the same and the pores of the cement paste change. Therefore, changed pores, calculated by Equation (16), was reinputted into Equation (5) to characterize the pore system of carbonated cement paste.
Based on the above analysis, the CO2 diffusivity of concrete before and after carbonation was calculated, and the mixing conditions of concrete used in the calculation are shown in Table 1.

Table 1.
Mixing condition of concrete used for calculation.
3. Results and Discussion
3.1. CO2 Diffusivity of Concrete before Carbonation
Figure 5 represents apparent and effective CO2 diffusivity of noncarbonated concrete with time and the difference means the effect of moisture content on CO2 diffusivity. Three points should be discussed. Firstly, for concrete with a high w/c ratio, the diffusivity was high, and the difference between apparent diffusivity and effective diffusivity was also large. This is coincided with experiment study of Nokken et al. [24]. This would be because high degree of cement hydration and high densification due to microstructure development with elapsed time for cement paste with a high w/c ratio. Secondly, all concrete showed that the CO2 diffusivity decreased significantly until 28 days because the microstructural densification of the concrete is greatly developed until 28 days. The trend continued because of the ongoing reaction of cement hydration. The trend of the reduction lasted even at long term; however, the reduction rate has become modest. Thirdly, the effective CO2 diffusivity was considerably smaller than the apparent diffusivity. It can be seen that pore closing due to moisture has great influence on the CO2 diffusivity. The work has good agreement with Yoon’s work that carbonation rate of concrete exposed to the outdoor environment was greatly decreased due to raining [25].
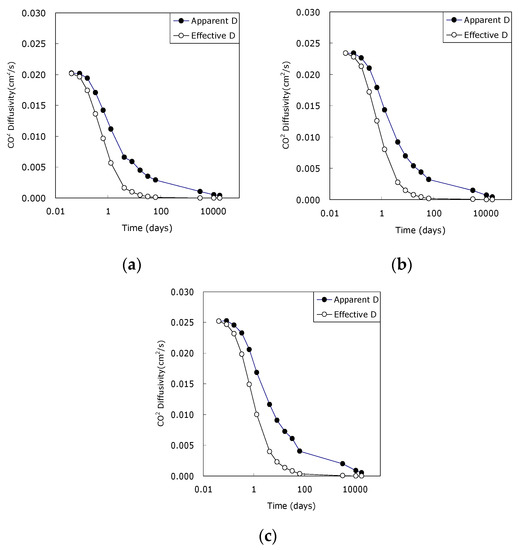
Figure 5.
Apparent and effective CO2 diffusivity of noncarbonated concrete. (a) w/c 0.45; (b) w/c 0.50; (c) w/c 0.55.
The CO2 diffusivity is a material parameter that directly reflects the carbonation rate. If concrete is exposed to high CO2 concentrations at early ages, carbonation can threaten concrete significantly. Therefore, extending the curing period could be a good solution in controlling the carbonation rate effectively.
Figure 6 illustrates the ratio of the effective diffusivity and the apparent diffusivity of concrete with w/c ratio. The apparent diffusivity decreases with time because of only development of microstructure of cement paste, while the effective diffusivity decreases with time because of remained amount of pore water after consumption due to cement hydration as well as the microstructural development. For this reason, the difference between two diffusivities was not significant at the beginning of age; however, the difference was obvious with elapsed time. The ratio had decreased significantly to the level of 0.1 to 0.2 after 28 days. At early ages, the difference between two diffusivities was not high because cement was not sufficiently unhydrated and pore was highly filled with water. However, the difference between two diffusivities was clearly noticed with elapsed time because water was continuously consumed by the hydration reaction of cement as it became hydrated. Therefore, it is very important to consider water content in estimating gaseous diffusivity of cementitious materials.
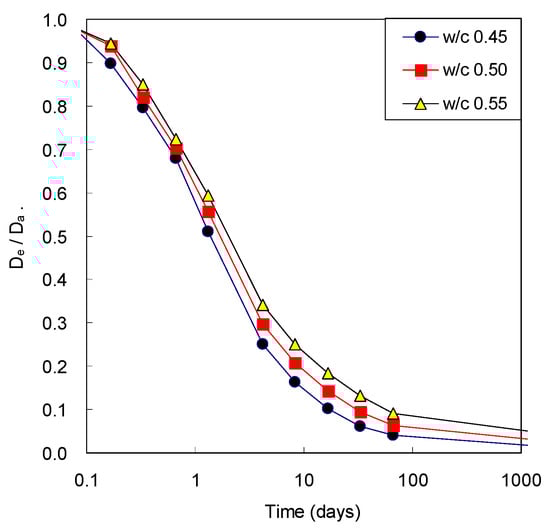
Figure 6.
Comparison of effective CO2 diffusivity of concrete (De) and apparent CO2 diffusivity (Da) before carbonation.
3.2. CO2 Diffusivity of Concrete after Carbonation
Figure 7 shows the result of estimating CO2 diffusivity of carbonated concrete with w/c ratio. The result reflected the reduction of pore due to carbonation. Among the four main functions of Equation (2), (a) CO2 diffusivity in bulk fluid is constant because it has nothing to do with cementitious material. However, (b) pore structural characterization; (c) tortuosity of streamline, and (d) disturbed effect are influenced by carbonation. That is, the carbonation of concrete can make the flow characteristics of the fluid more complicated by reducing the pore system of the concrete. In particular, the CO2 diffusivity of early carbonated concrete decreased significantly. However, carbonation leaded to the reduction of CO2 diffusivity of concrete regardless of age, and this tendency was obvious for all concrete.
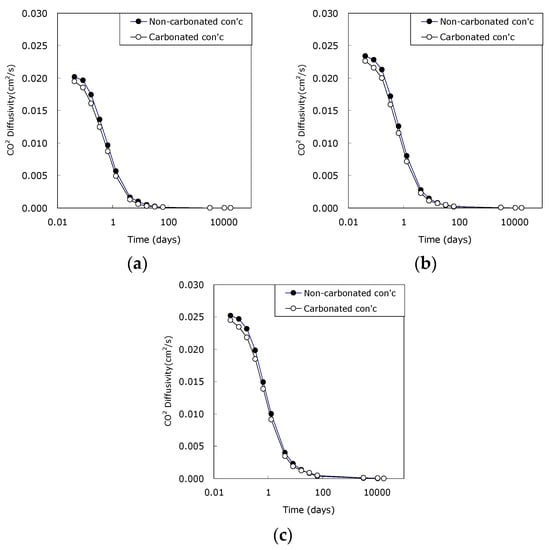
Figure 7.
Effect of carbonation on CO2 effective diffusivity. (a) w/c 0.45; (b) w/c 0.50; (c) w/c 0.55.
Saeki et al. suggested that chloride diffusivity of OPC concrete was significantly decreased after carbonation, while blended concrete showed different results depended on admixture type or the replacement ratio [26]. That is, chloride diffusivity of concrete with fly ash decreased, while that of concrete with granulated blast furnace slag increased. As Ca(OH)2 is transferred to CaCO3 due to carbonation, the microstructure characteristics of the concrete is bound to change because of the difference in molar volumetric expansion of the two materials [27]. However, this is not the case for all concrete and pore of carbonated concrete with blast furnace slag rather increased [28].
Figure 8 illustrates the difference between effective CO2 diffusivity and apparent diffusivity of concrete after carbonation. Like the comparative ratio in Figure 5, the ratio of carbonated concrete showed a similar trend.
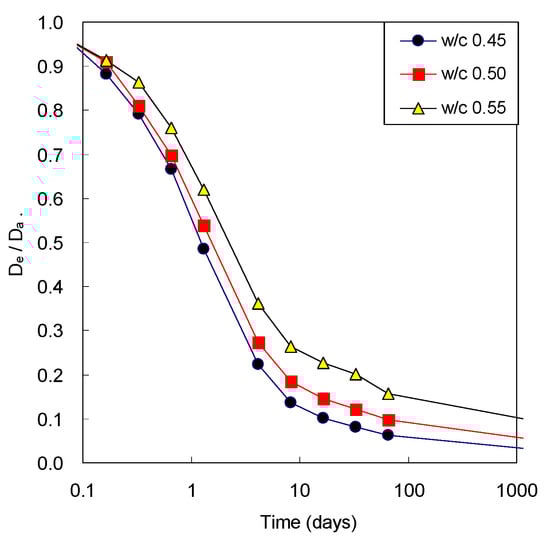
Figure 8.
Comparison of effective CO2 diffusivity of concrete (De) and apparent CO2 diffusivity (Da) after carbonation.
Figure 9 shows the result of comparing the diffusivity concrete before and after carbonation. The ratio of the two diffusivities decreased as time passed. and the width of the w/c ratio decreased with elapsed time. In concrete with a high w/c ratio, the trend of decreasing the diffusivity due to carbonation with time was pronounced. Carbonation led to reducing the effective diffusivity of concrete to the level of 47~69%. This reduction ratio tended to decrease as w/c ratio of concrete was low and time elapsed.
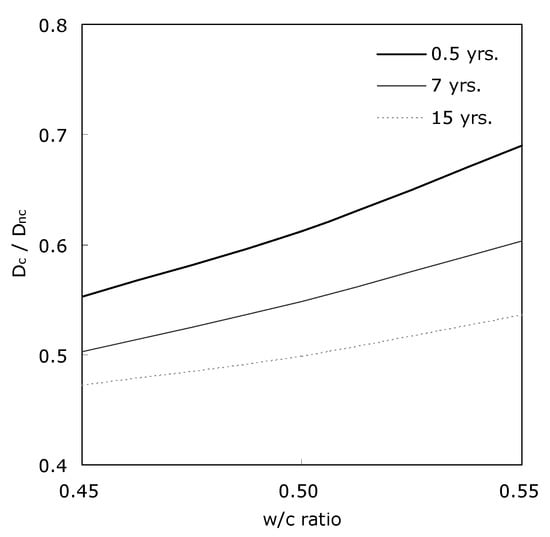
Figure 9.
Effective CO2 diffusivity (Dc) of carbonated concrete vs. effective CO2 diffusivity (Dnc) before carbonation.
Based on all results above, this study is believed to be useful in expressing the CO2 diffusivity as a function of the mixing conditions of concrete and degree of cement hydration. As a material parameter plays a decisive role in the accuracy of durability design system for concrete structures, CO2 diffusivity with time is very important to calculate the service life of the concrete in detail. This work will be combined with the system in the future.
3.3. Comparison with Previous Research
The rate of gas penetration depends largely on the saturation of concrete. The rate of gas penetration decreased if concrete is more than 50% RH [17]. The diffusivity was constant if concrete is exposed to condition with less than 60% RH. That is, the diffusivity decreased significantly when RH exceeded 60% [16]. The result was similar to the experiment of Martin et al. [29]. They studied the CO2 diffusivity of porous media, not concrete, and the diffusivity greatly decreased as RH exceeded around 55%. The apparent and the effective CO2 diffusivity of concrete cured for 28 days was calculated to be in the range of 3.5 × 10⁻³ to 6.1 × 10⁻³ cm2/s, 2.1 × 10⁻⁴ to 8.3 × 10⁻⁴ cm2/s, respectively. In particular, the effective diffusivity of carbonated concrete matched with the limit suggested by CEB 1990 Model Code [30].
In this study, the diffusivity of concrete was estimated from the individual diffusivities of cement and aggregate. The effect of Interfacial Transition Zone (ITZ) at aggregate surface on gas diffusion was not considered. Although the effect of ITZ on the durability of concrete is well known, research on the effect of the CO2 diffusivity is rare. In the future, it is necessary to study the CO2 diffusivity of concrete with three phases, cement paste, aggregate, and ITZ and the influence of carbonation on the porosity of ITZ.
4. Conclusions
CO2 diffusivity is a decisive material parameter for estimating a carbonation rate of concrete and quantifying durability performance of infrastructure. A comprehensive model with multifunctional factors such as diffusivity bulk fluid, pore structural characteristics, streamline of tortuosity in the pore system, hindrance effect, and volumetric contribution of cement paste and aggregate, was modified to estimate the diffusivity. Apparent and effective CO2 diffusivities were suggested in terms of the effect of pore water on diffusivity. Because CO2 diffusivity is a material parameter in the area from surface concrete to carbonation depth, the CO2 diffusivity of concrete was calculated after carbonation.
(1) For concrete before carbonation, CO2 diffusivity did not have a constant value, and it continuously decreased with the degree of cement hydration. The trend also maintained a clear trend depending on w/c ratio of concrete. Above all, the trend of decreasing CO2 diffusivity was more pronounced until 28 days. The reduction rate gradually became more modest over time. The decreasing trend of the diffusivity of concrete with w/c ratio over time also showed the same. The difference between apparent and effective diffusivity was not significant at beginning of age, however, the difference was obvious with elapsed time.
(2) As a result of comparing the CO2 diffusivity of carbonated concrete and noncarbonated concrete, carbonation significantly reduced CO2 diffusivity at the early age. Since carbonation of concrete greatly reduced the pore structural system, it resulted in a significant reduction in the CO2 diffusivity to the level of 47~69% compared to that of noncarbonated concrete. However, this reduction ratio showed a trend of decreasing over time as well.
Author Contributions
I.-S.Y. conceived and designed outline of this study; I.-S.Y. performed modeling; I.-S.Y. and C.-H.C. analyzed the outcome; I.-S.Y. and C.-H.C. wrote the paper. All authors have read and agreed to the published version of the manuscript.
Funding
This research was supported by NRF (2018R1D1A1B07042819) and Korea Basic Science Institute (National Research Facilities and Equipment Center) grant funded by the Korean Ministry of Education (grant No. 2020R1A6C1020263).
Conflicts of Interest
The authors declare no conflict of interest.
References
- Geotechnical Practice for Waste Disposal. In Geotechnical Practice for Waste Disposal; Springer Science and Business Media LLC.: Berlin, Germany, 1993; Volume 3, pp. 159–181.
- Collin, M.; Rasmuson, A. Mathematical Modeling of Water and CO2 Transport in Layered Soil Covers for Deposits of Pyritic Mine Tailings. In Proceedings of the GAC-MAC Annual Meeting: Acid Mine Drainage Designing for Closure, Vancouver, BC, Canada, 10–12 May 1990; pp. 311–333. [Google Scholar]
- Yanful, E.K. CO2 Diffusion through Soil Covers on Sulphatic Mine Tailings. J. Geotechn. Eng. ASCE 1993, 119, 1207–1228. [Google Scholar] [CrossRef]
- Yoon, I.-S. Simple approach to calculate chloride diffusivity of concrete considering carbonation. Comput. Concr. 2009, 6, 1–18. [Google Scholar] [CrossRef]
- Patel, R.A.; Phung, Q.T.; Seetharam, S.C.; Perko, J.; Jacques, D.; Maes, N.; De Schutter, G.; Ye, G.; Van Breugel, K. Diffusivity of saturated ordinary Portland cement-based materials: A critical review of experimental and analytical modelling approaches. Cem. Concr. Res. 2016, 90, 52–72. [Google Scholar] [CrossRef]
- Garboczi, E.J.; Bentz, D.P. Multiscale Analytical/Numerical Theory of the Diffusivity of Concrete. Adv. Cement Based Mater. 1998, 8, 77–88. [Google Scholar] [CrossRef]
- Kropp, J.E.; Hilsdorf, H.K. (Eds.) Performance Criteria for Concrete Durability; RILEM Report 12; E & FN Spon: New York, NY, USA, 1997; pp. 24–25. [Google Scholar]
- Luciano, J.; Miltenberger, M. Prediction of Chloride Diffusion Coefficient from Concrete Mixture Properties. ACI Mater. J. 1999, 96, 698–703. [Google Scholar]
- Xi, Y.; Bažant, Z.P. Modeling Chloride Penetration in Saturated Concrete. J. Mater. Civ. Eng. 1999, 11, 58–65. [Google Scholar] [CrossRef]
- Saetta, A.V.; Scotta, R.V.; Vitaliani, R.V. Analysis of Chloride Diffusion into Partially Saturated Concrete. ACI Mater. J. 1993, 90, 441–451. [Google Scholar] [CrossRef]
- Yoon, I.-S. Comprehensive Approach to Calculate Oxygen Diffusivity of Cementitious Materials Considering Carbonation. Int. J. Concr. Struct. Mater. 2018, 12, 16. [Google Scholar] [CrossRef]
- Bird, R.B.; Stewart, W.E.; Lightfoot, E.N. Transport Phenomena; John Wiley & Sons: New York, NY, USA, 1960; p. 780. [Google Scholar]
- Fuller, E.N.; Schettler, P.D.; Giddings, J.C. A New Method of Prediction of Binary Gas-Phase Diffusion Coefficients. Ind. Eng. Chem. 1966, 58, 19–27. [Google Scholar] [CrossRef]
- Maekawa, K.; Chaube, R.; Kishi, T. Modeling of Concrete Performance: Hydration, Microstructure Formation and Mass Transport; E & FN Spon: New York, NY, USA, 1999. [Google Scholar]
- Van Breugel, K. Simulation of Hydration and Formation of Structures in Hardening Cement-Based Materials. Ph.D. Thesis, Delft University of Technology, Delft, The Netherlands, 1991. [Google Scholar]
- Bo-Ming, Y.; Jian-Hua, L. A Geometry Model for Tortuosity of Flow Path in Porous Media. Chin. Phys. Lett. 2004, 21, 1569–1571. [Google Scholar] [CrossRef]
- Houst, Y.; Wittmann, F.H. The Diffusion of Carbon Dioxide and Chloride in Aerated Concrete. Available online: infoscience.epfl.ch/record/120484/files/YH_15.pdf (accessed on 11 December 2020).
- FORGE. Results of the Rests on Concrete, Technical Report CIEMAT/DMA/2G207/1/12; Euratom 7th Framework Program Project: Madrid, Spain, 2011. [Google Scholar]
- McEligoi, D. Fundamentals of momentum, heat and mass transfer. Int. J. Heat Mass Transf. 1970, 13, 1641. [Google Scholar] [CrossRef]
- Davis, H.T. The Effective Medium Theory of Diffusion in Composite Media. J. Am. Ceram. Soc. 1977, 60, 499–501. [Google Scholar] [CrossRef]
- Tatlier, M.; Tatlıer, M.; Erdem-Şenatalar, A. Estimation of the effective diffusion coefficients in open zeolite coatings. Chem. Eng. J. 2004, 102, 209–216. [Google Scholar] [CrossRef]
- Elphick, S.C.; Dennis, P.F.; Graham, C.M. An Experimental Study of the Diffusion of CO2 in Quartz and Albite Using an Overgrowth Technique. Contrib. Mineral. Petrol. 1986, 92, 322–330. [Google Scholar] [CrossRef]
- Papadakis, V.G.; Vayenas, C.G.; Fardis, M.N. Physical and Chemical Characteristics Affecting the Durability of Concrete. ACI Mater. J. 1991, 88, 186–196. [Google Scholar] [CrossRef]
- Nokken, M.; Boddy, A.; Hooton, R.; Thomas, M. Time dependent diffusion in concrete—Three laboratory studies. Cem. Concr. Res. 2006, 36, 200–207. [Google Scholar] [CrossRef]
- Yoon, I.-S.; Çopuroğlu, O.; Park, K.-B. Effect of global climatic change on carbonation progress of concrete. Atmospheric Environ. 2007, 41, 7274–7285. [Google Scholar] [CrossRef]
- Saeki, T. Chloride ions diffusivity and micro-structure of concrete made with mineral admixtures. In Proceedings of the ConcreteLife’06—International RILEM-JCI Seminar on Concrete Durability and Service Life Planning: Curing, Crack Control, Performance in Harsh Environments, Dead sea, Israel, 14–16 March 2006; pp. 129–135. [Google Scholar] [CrossRef]
- Ngala, V.; Page, C. Effects of carbonation on pore structure and diffusional properties of hydrated cement pastes. Cem. Concr. Res. 1997, 27, 995–1007. [Google Scholar] [CrossRef]
- De Ceukelaire, L.; Van Nieuwenburg, D. Accelerated carbonation of a blast-furnace cement concrete. Cem. Concr. Res. 1993, 23, 442–452. [Google Scholar] [CrossRef]
- Martin, V.; Aubertin, M.; Bussiere, B.; Mbonimpa, M.; Dagenais, A.; Gosselin, M. Measurement of CO2 Consumption and Diffusion in Exposed and Covered Reactive Mine Tailings. In Proceedings of the 7th International Conference on Acid Rock Drainage, American Society of Minding and Reclamation, Lexington, KY, USA, 26–30 March 2006; pp. 1156–1169. [Google Scholar]
- Comite Euro-International du Beton. CEB-FIP Model Code 1990; Bulletin d’Information, No.195; Comite Euro-International du Beton: Lausanne, Switzerland, 1990. [Google Scholar]
Publisher’s Note: MDPI stays neutral with regard to jurisdictional claims in published maps and institutional affiliations. |
© 2020 by the authors. Licensee MDPI, Basel, Switzerland. This article is an open access article distributed under the terms and conditions of the Creative Commons Attribution (CC BY) license (http://creativecommons.org/licenses/by/4.0/).