Article

Effect of Uncertainties in Material and Structural Detailing on the Seismic Vulnerability of RC Frames Considering Construction Quality Defects

1
Department of Architectural Engineering, Keimyung University, Daegu 42601, Korea
2
MIRAE Structural Engineering, Seoul 05836, Korea
*
Author to whom correspondence should be addressed.
Appl. Sci. 2020, 10(24), 8832; https://doi.org/10.3390/app10248832
Submission received: 15 November 2020 / Revised: 4 December 2020 / Accepted: 8 December 2020 / Published: 10 December 2020
(This article belongs to the Special Issue Structural Reliability of RC Frame Buildings)

Abstract

:
This paper evaluates the effect of construction quality defects on the seismic vulnerability of reinforced concrete (RC) frames. The variability in the construction quality of material properties and structural detailing is considered to assess the effect on the seismic behavior of RC frames. Concrete strength and yield strength of the reinforcement are selected as uncertain variables for the material properties, while the variabilities in the longitudinal reinforcement ratio and the volumetric ratio of transverse reinforcement are employed for structural detailing. Taking into account the selected construction quality uncertainties, the sensitivity analysis of the seismic vulnerability of the RC frames is performed and the impact of significant parameters is assessed at the global and local levels. This extensive analytical study reveals that the seismic vulnerability of the selected RC frame is particularly sensitive to concrete strength and the volumetric ratio of transverse reinforcement.

1. Introduction

Seismic design and construction technologies have improved considerably over the years, but unexpected earthquake damage to reinforced concrete (RC) structures continues to occur. In previous earthquakes (e.g., the Chi-Chi earthquake in Taiwan (1999), Maule earthquake in Chile (2010), and Pohang earthquake in South Korea (2017)), many researchers have attributed the undesired failures in some RC structures to construction quality defects, including poor quality materials and inadequate reinforcement details [1,2,3]. Typical types of failures due to poor construction practices during earthquake loads include: (i) brittle shear failure of columns and/or beams due to insufficient shear reinforcement [4,5], and (ii) buckling of longitudinal bars or shear failure in beam–column joints due to inadequate spacing or lack of transverse stirrups [6,7,8]. In particular, the Pohang earthquake (Mw 5.4) was the most damaging event in South Korea due to the relatively shallow depth (7 km) and the location in the Pohang basin which consists of non-marine to deep marine sedimentary strata. The most structural damage was caused by poor construction practices of piloti-type low-rise RC buildings and schools. As shown in Figure 1, the failure of many RC columns in the seismically designed buildings was observed due to excessive concrete cover, the inclusion of drainage pipes in the column members, the inadequate spacing of the shear reinforcement, or the poor anchorage of ties.
The seismic vulnerability of RC structures can increase significantly due to the uncertainties of material strengths and section properties caused by construction practices. All construction processes, including manufacturing, transporting, and pouring, can affect the quality of the material, and aging can degrade its strength. The shear and flexural strengths of members can be also significantly reduced due to the wide tie spacing and the cover thickness, respectively.
Many studies have been published concerning the sensitivity of the seismic demand or fragility to the modeling parameters of RC structures. In the literature, materials, modeling strategies, and geometric configuration have been considered as uncertain variables and their tangible impact on seismic vulnerability has been revealed through sensitivity and reliability analyses [9,10,11,12]. For example, Kim and Han [4] analyzed the sensitivity of concrete strength, yield strength, and damping ratio on the seismic response of staggered wall structures. The Tornado Diagram Method (TDM) and First Order Second Moment (FOSM) method were employed to assess the sensitivity of modeling uncertainties. It was concluded that the sensitivity of each material uncertainty could depend on the ground motion intensity, while damping ratio variation could be more sensitive regardless of its intensity. In addition to structural variables, the effect of ground motion was evaluated as well [13,14,15,16]. Padgett and DesRoches [15] showed that the seismic vulnerability of bridge components could be notably affected by the uncertainty in ground motion rather than geometric or modeling uncertainties. Both Lee and Mosalam [13] and Kwon and Elnashai [14] carried out sensitivity analyses of uncertainties in materials, structural properties, and ground motion for RC frames through the FOSM method. It was reported that the uncertainty in seismic loads is more important than uncertain structural variables in terms of the effects on the vulnerability of the analyzed structures. However, a very limited number of studies have investigated the effect of construction quality defects on the seismic vulnerability of RC structures. For instance, Rajeev and Tesfamariam [17] evaluated the effect of construction quality variability on the seismic behavior of a six-story RC structure. The variabilities in the construction quality accounting for the material and structural detailing were categorized into three levels, ‘poor’, ‘average’, and ‘good’. Analytical results concluded that the probability seismic demand model and fragility of the selected structure are quite sensitive to the construction quality variability.
This study evaluates the seismic vulnerability of RC frames considering construction quality defects that may occur in various environments. In this study, the construction quality is assumed to be related to material uncertainty (such as concrete strength and yield strength of the reinforcement) and structural detailing uncertainty (such as longitudinal reinforcement ratio and the volumetric ratio of transverse reinforcement), based on field observations from recent earthquakes. The impact of the significant parameters is also assessed at the global and local levels through the sensitivity analysis of the seismic fragility of the selected uncertain variables.

2. Selected Structure and Modelling Parameters

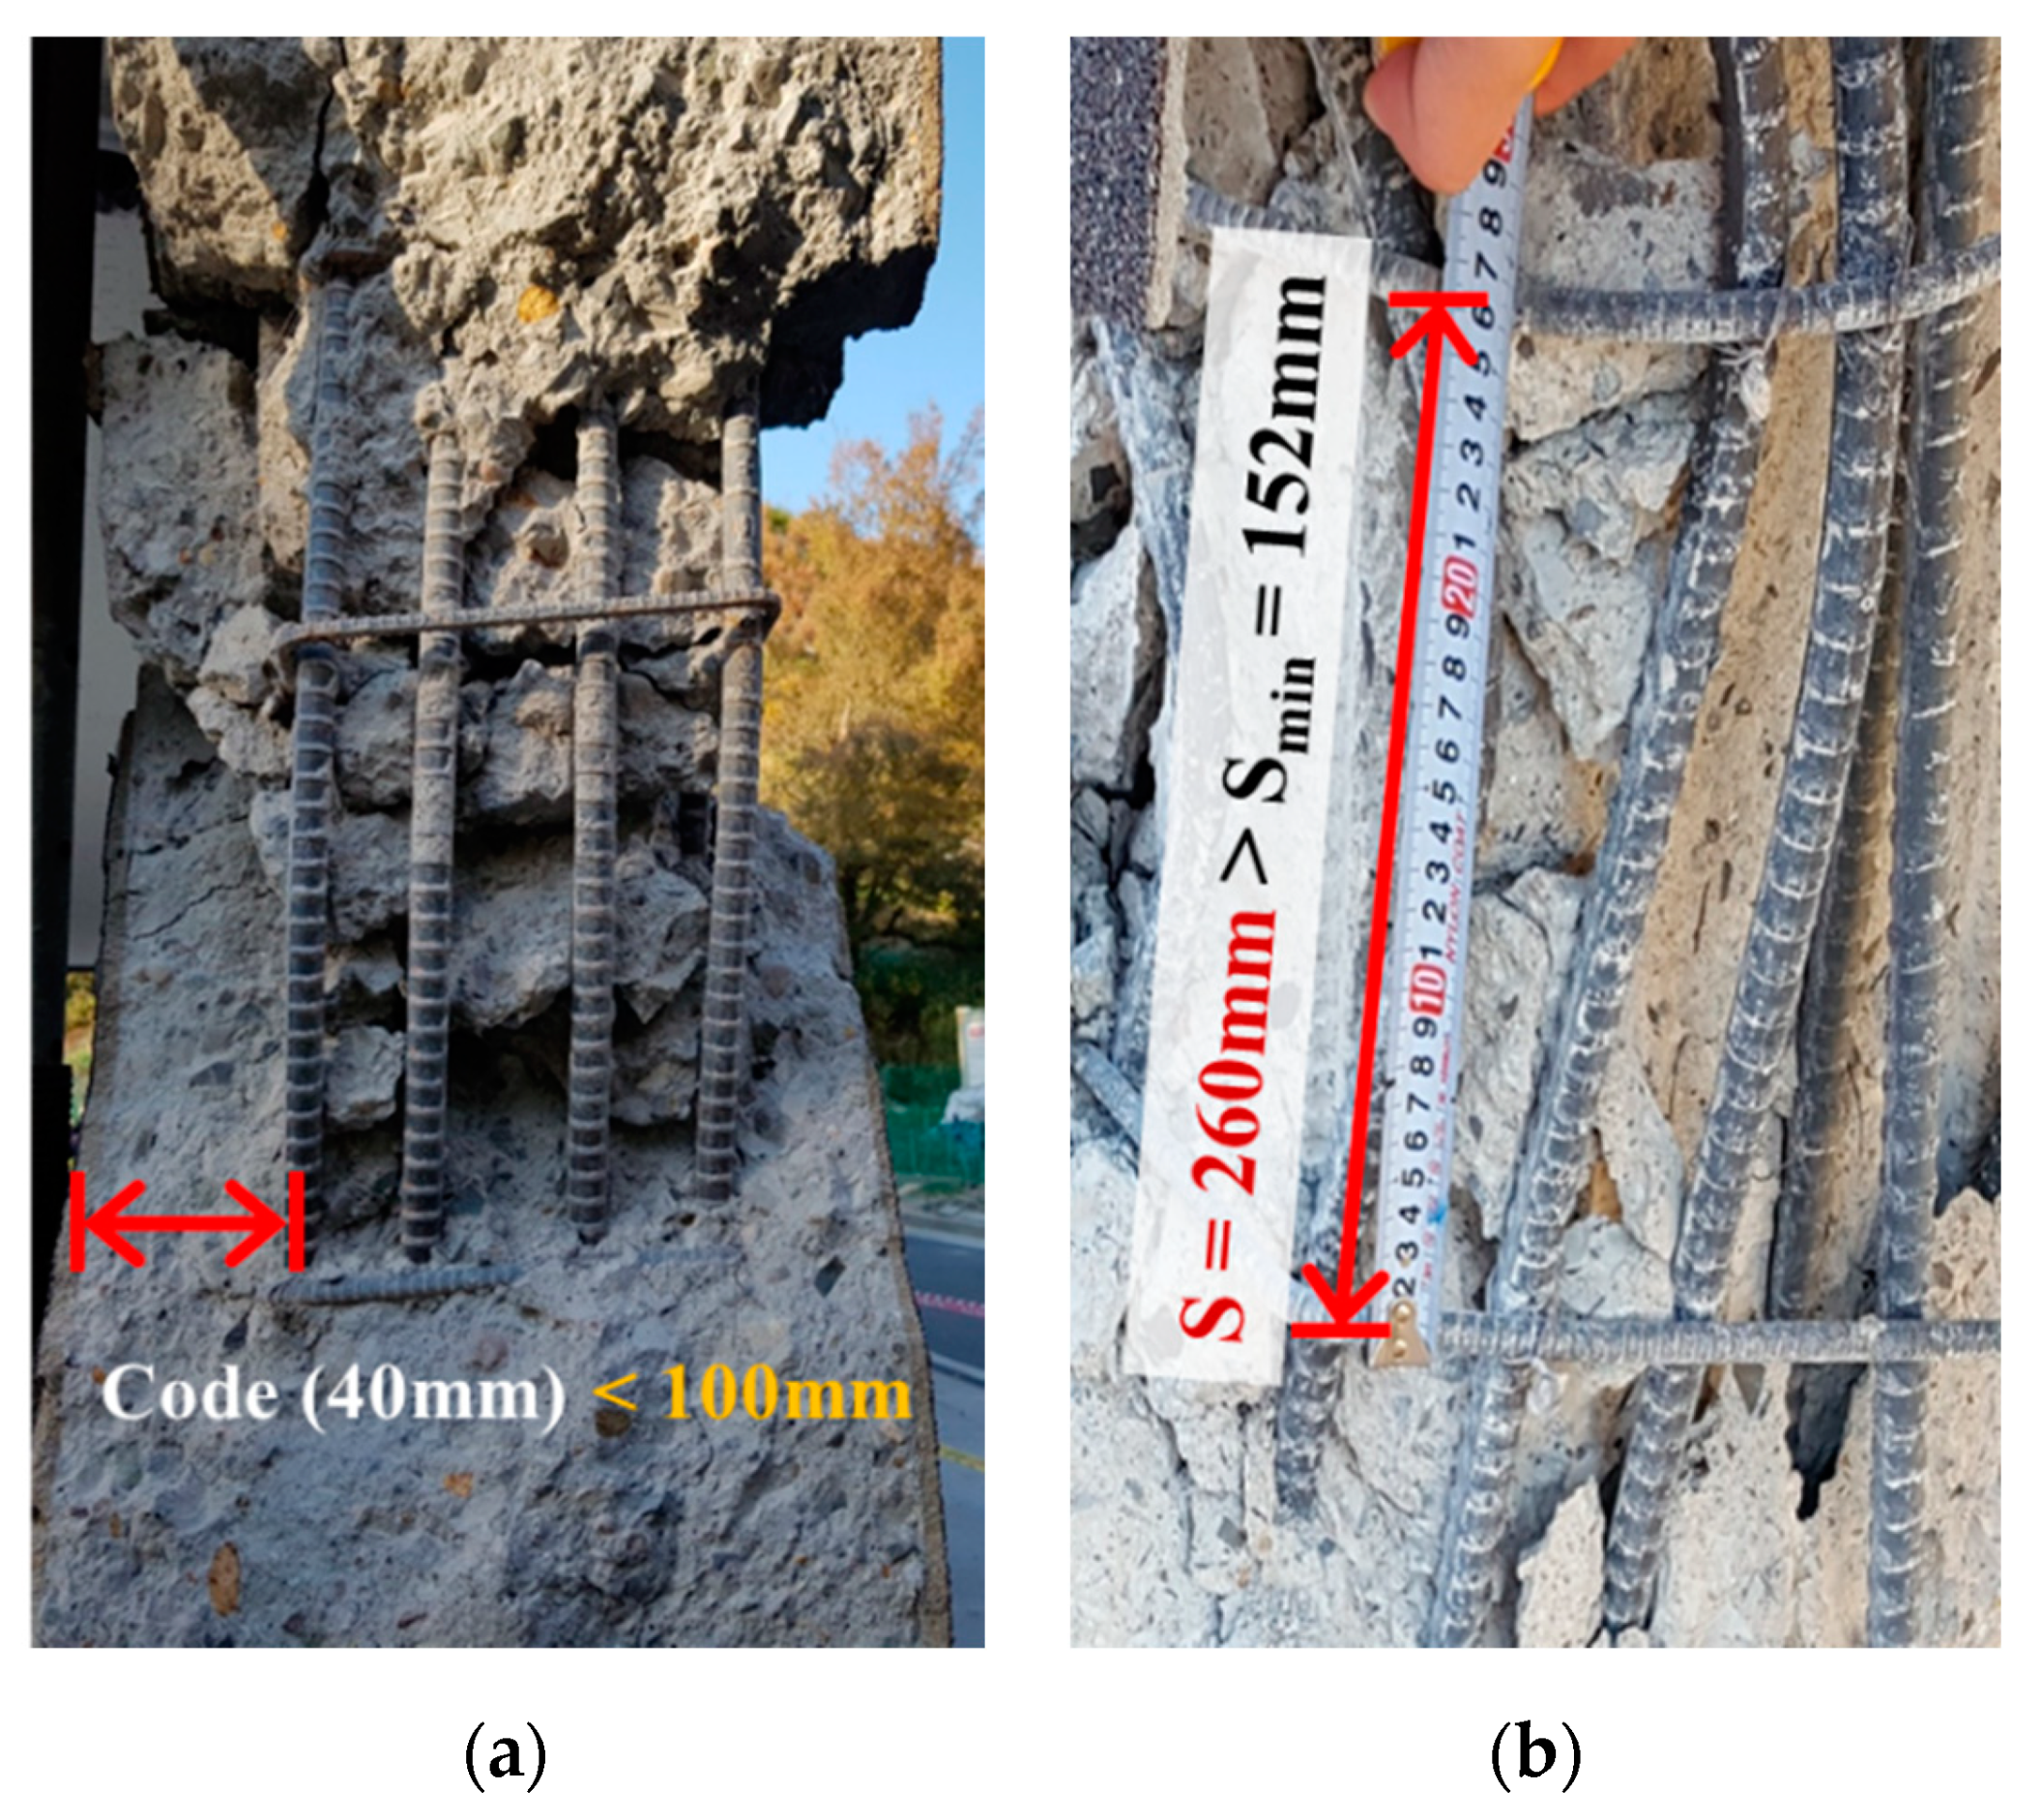
2.1. Description of Seclected Structure

The main objective of this study is to estimate the effect of construction quality defects on the seismic vulnerability of RC structures. To achieve this objective, the reference structure should be realistic and simple enough to conduct parametric studies. To fulfill these requirements, the school building shown in Figure 2 is considered to assess the seismic performance of RC structures with construction quality uncertainty. The selected structure complies with the 1980s Standard Drawings for School Buildings provided by the Ministry of Education, South Korea. Most of the school buildings damaged due to the Pohang Earthquake were constructed around the 1980s. The plan view and elevation of the selected structure are given in Figure 2 and the analyzed frame is shaded in Figure 2a. The section details of the selected columns and girders are shown in Figure 3. For example, the cross section of the column on the first floor is 400 mm × 400 mm with eight longitudinal reinforcements, and two types of girders with cross sections of 350 mm × 600 mm and 350 mm × 450 mm are used.

2.2. Uncertain Parameters and Structural Modelling

Taking into account the inadequate construction practices of school buildings built in the 1980s and damaged by the Pohang Earthquake, the effects of material properties and structural details on the seismic performance of the selected structure were evaluated. The compressive strength of concrete ( f c ) and yield strength of the reinforcement ( f y ) were considered as variables for the material uncertainty, while the longitudinal reinforcement ratio ( ρ l ) and volumetric ratio of transverse reinforcement ( ρ w ) were selected as variables for the structural details.
As shown in Table 1, five cases for each variable were considered and thus, a total of 17 analytical models were obtained. The reference names listed in Table 1 were defined by considering the name and value of an uncertain variable. For example, CS18 is the analytical model with a concrete strength of 18MPa. Note that the analytical models of CS24, YS400, LR2.00, and TR0.33 are identical and used as the reference structural model with a median value of each variable. It was assumed that the column section was 400 × 400 mm, and D10 with a yield strength of 400 MPa was used as shear reinforcement. In addition, the analytical variables for the longitudinal rebar ratios were considered by increasing and decreasing the cross-sectional area of eight reinforcements. Numerical models of RC structures with uncertain variables were implemented and analyzed using the OpenSees software package [18], which is a finite element analysis platform. To take into account the spread of plasticity along with the element, the RC frame members were modeled by the Displacement-Based Beam-Column Element with the material constitutive laws of Concrete02 and Steel01 for concrete and steel, respectively, as shown in Figure 4. For the confined concrete, the confinement effect on the strength and strain was considered by utilizing the formulae developed by Mander et al. [19].

3. Limit States and Input of Ground Motions

3.1. Limit States and Response Measure

An interstory drift ratio is considered as a global failure criterion, and thus the interstory drift ratio of each structure from a nonlinear pushover analysis with the loading profile of the first mode shape was estimated. Three limit states associated with the desired structural performance levels were defined: serviceability, damage control, and collapse prevention [20]. The serviceability level is defined when longitudinal reinforcement reaches yielding and the damage control level is defined when concrete strain reaches the maximum confined stress. The collapse prevention level is defined when concrete strain reaches the ultimate confined strain that is suggested by the Eurocode 8 [21]. More details can be found elsewhere.
Figure 5 shows the estimated interstory drift ratios corresponding to the limit states of each analytical model. It was observed that drift ratios corresponding to the damage control and collapse prevention levels increased significantly with an increase in concrete strength. For example, for the collapse prevention level, the drift ratios for the models with concrete strengths of 18 MPa and 30 MPa were 1.31% and 1.95%, respectively. Thus, the drift ratio increased by 48.9%. In addition, the notable increase in the drift ratio associated with the collapse prevention level can be found as the volumetric ratio of transverse reinforcement increases. The TR0.23 and TR0.54 models reach drift ratios of 1.26% and 2.14%, respectively (an increase of 69.8%). However, a minor variation in the drift ratio corresponding to the serviceability level was observed for all cases. Compared to the variation of the concrete compressive strength and volumetric ratio of transverse reinforcement, the effect of the yield strength of reinforcement and longitudinal reinforcement ratio on the drift limit was minimal.

3.2. Input Ground Motions

Earthquake ground motion records from 50 stations were selected to conduct nonlinear dynamic analyses of the selected structures. The ground motion set was collected from the Pacific Earthquake Engineering Research Center (PEER) strong motion database. Various levels of ground motion of magnitudes (Mw) 5–6 and hypo-central distances of 5–60 km were selected as tabulated in Table 2. Note that spectral intensity (SI) is defined by Housner as the integral of the pseudo-velocity spectra over the period range from 0.1 to 2.5 s [22]. Figure 6 shows the response acceleration spectra of selected records, which are evenly distributed from 0.01 g and 2.00 g at the fundamental period of the reference structure.

4. Seismic Vulnerability and Sensitivity Analysis

4.1. Development of Fragility Curve and Sensitivity Analysis

This research evaluates the seismic vulnerability of the old-school type RC structure, and analyzes the sensitivity to uncertain material and sectional properties. The seismic vulnerability analysis is defined as the conditional probability that the response of the structure exceeds the limit state function. The reliable seismic vulnerability curve is generated using the Probabilistic Seismic Demand Model (PSDM), which performs a regression analysis of the relationship between the Engineering Demand Parameter (EDP) and Intensity Measure (IM) as shown in Equation (1):
S D = a I M b
where SD: median value of structural demand corresponding to EDP, a and b: regression coefficients of structural demands calculated from a nonlinear dynamic analysis. In this research, the ground motion intensity, IM, is defined as spectral acceleration (Sa), and the seismic response of the RC structure, EDP, is defined as an interstory drift ratio at the global response level and shear demand of column at the local response level. The PSDM performs linear regression by converting to the logarithmic function as shown in Equation (2):
ln ( S D ) = ln ( a ) + b · ln ( I M )
The defined structural demand and limit state function are assumed to be log-normally distributed. Thus, seismic vulnerability is expressed as the lognormal distribution as shown in Equation (3):
P [ D > C | I M ] = Φ [ ln ( a I M b / S c ) β d | I M 2 + β c 2 ] = Φ [ ln ( I M ) λ ξ ]
where Φ[·]: the standard normal cumulative distribution function, Sc: median values of limit states, βc: the dispersion of limit states, βd|IM: the standard deviations of demand for IM, λ: the logarithmic median values of vulnerability, ξ: the dispersion of vulnerability. βc is generally 0.25–0.35.
The sensitivity analysis was performed using the Tornado Diagram Analysis (TDA) method to evaluate the effect of uncertain variables on the structural response of the constructed analytical models. The TDA method can be used if the uncertainty range of the input parameters is known. It is a deterministic sensitivity analysis tool that evaluates the impact of uncertain variables. Many researchers have adopted the TDA method to assess the effect of uncertain models and to determine important variables [23,24]. Therefore, the sensitivity index of this research has been investigated using lower and upper bounds, named the swing, in the exceedance probability of seismic vulnerability corresponding to the analytical result of each uncertain model. The relative sensitivity of each variable, (f′c, fy ρl, and ρw), has been evaluated by comparing the seismic vulnerability curves considering all uncertain parameters using the collected swing for each damage level.

4.2. Effect on Global Response

Figure 7 presents the seismic vulnerability curves of the selected RC structures and sensitivity swings for each uncertain variable. The solid line of each limit state shown in Figure 6 indicates the fragility curve derived by considering all EDPs of each modeling group (e.g., the CS, YS, LR, and TR models detailed in Table 1). For example, in the case of the CS models, all of the structural responses from five RC frame models with different concrete strengths were considered to be the EDPs, and the single fragility curve for the CS models was derived. The dotted line indicates the fragility curve of the reference model. In particular, the seismic vulnerability of each group’s models was analyzed by comparing it with that of the reference model.
As shown in Figure 7a, the seismic vulnerability of the CS models, which considers the uncertainty of concrete strength, increased slightly at the lower value of Sa, when compared with that of the reference model. However, it decreased at the higher value of Sa. Figure 7 also clearly indicates that the sensitivity swings at the damage control and collapse prevention levels of the CS models were higher than those of other groups. For example, for the CS model, the exceedance probability at an Sa of 1.5 g of the collapse prevention state varied from 0.31 to 0.77, resulting in a swing of 0.46. However, the corresponding swings of the YS and LR models were 0.06 and 0.05, respectively. Thus, the impact of concrete strength on the structural response was significant when compared with other variables. In addition, the width of the sensitivity swing of the CS models increased as the limit state changed from the serviceability to collapse prevention level.
Figure 7b shows the seismic vulnerability of the YS group, which considers the varying yield strength of longitudinal reinforcement. The sensitivity swings for the fragility curves of the YS model were significantly lower than those of the CS models at the collapse prevention level. Conversely, their swings were higher than those of other groups at the serviceability level. This is because the serviceability level is defined when a longitudinal reinforcement reaches yielding, and thus it is significantly affected by the yield strength variability. Furthermore, it was observed that the sensitivity swings of LR models are notably lower than other groups except the serviceability level, indicating less impact on the seismic vulnerability of RC frames (Figure 7c).
The fragility curves of TR models, which are associated with the variability in the volumetric ratio of transverse reinforcement, are illustrated in Figure 7d. The results indicate the high sensitivity of the selected uncertain variable to the seismic vulnerability of the TR models at the damage control and collapse prevention level. The swing at an Sa of 1.5 g of the collapse prevention level is 0.4, which indicates a significant impact on the structural response. In particular, the overall trend of their sensitivity swings is similar to those of the CS models.
Figure 8 shows the relative sensitivity of material properties and structural details on the seismic vulnerability curve at each limit state. The relative sensitivity is estimated as the ratio of the sensitivity swing of each variable to the sum. In all cases, the sensitivity of concrete strength was high at very low Sa, and those of the serviceability, damage control, and collapse prevention states decreased until the Sa reached 0.5 g, 0.78 g, and 1.15 g, respectively. After that, it was observed that the sensitivity of concrete strength dominated, particularly for the damage control and collapse prevention limit states. In addition, the sensitivity of the volumetric ratio of transverse reinforcement was notably high as it reached 0.4 at an Sa of 1.5 g for the collapse prevention limit state. The corresponding relative sensitivities of concrete strength, yield strength of rebar, and longitudinal rebar ratio were 0.47, 0.07, and 0.06. This is because the maximum confined stress and ultimate confined strain are mainly affected by the volumetric ratio of transverse reinforcement, along with concrete strength. Note that the damage control level is defined at the maximum confined stress and the collapse prevention level is defined at the ultimate confined strain. Therefore, Figure 8 clearly shows that seismic vulnerability was significantly affected by the concrete strength and volumetric ratio of transverse reinforcement, while the effect of the variability of longitudinal reinforcement was rather insignificant. It can be concluded that securing the concrete strength quality and code-conforming stirrup spacing is very important to prevent the jeopardy of structural safety.

4.3. Effect on Member Response

The prototype structure of this study is an old school building reflecting the inadequate construction practices of South Korea in the 1980s. The seismic vulnerability of this structure may increase due to the attainment of member level limit states. The shear demand and capacity of a RC column were monitored to assess the seismic vulnerability at the local level. Shear demand was used as an EDP, while the shear capacity was selected as a limit state function. Regarding the shear capacity of the RC column, the shear strength model by ACI 318-19 [25] was utilized.
Figure 9 compares the fragility curves at the global and local levels of the selected structure. The exceedance probability of the serviceability limit state at the global level was always higher than that of the shear failure state at the local level, which means the shear failure of the RC column does not occur until the longitudinal reinforcement yields. On the contrary, the exceedance probability of the shear failure state was higher than that of the damage control limit state until Sa reaches 0.64 g. Note that the design spectral acceleration in the Korean Building Code [26], corresponding to the fundamental period of the reference structure, was 0.64 g as shown in Figure 9. For the spectral acceleration of 0.64 g, the exceedance probability of the serviceability state was 83.5%, while those of the damage control and shear failure limit states were 30.7% and 30.9%, respectively. In addition, Figure 9 clearly indicates that the likelihood of shear failure of RC members was much higher than reaching the collapse prevention limit at the global level. Hence, local failure may occur before the structural instability on the system level occurs, and thus the effect of construction quality defects on the shear vulnerability of RC members should be considered for the selected structure.
For each uncertain variable shown in Table 1, Figure 10 illustrates the fragility curve for the local failure state and its sensitivity swing. Compared with other variables, it was observed that the effect of the variability in the concrete strength ( f c ) on the vulnerability curve was insignificant at the local level as opposed to the global level. However, variabilities in the yield strength ( f y ) and longitudinal reinforcement ratio ( ρ l ) notably affect the local failure mode as shown in Figure 10b,c. These variables are related to the moment capacity of the RC column. The RC column with low yield strength and longitudinal reinforcement ratio attains the ultimate flexural strength before reaching the shear capacity, resulting in a low probability of shear failure. Figure 10d clearly shows that the most significant effect on the shear vulnerability is due to the volumetric ratio of transverse reinforcement ( ρ w ), which is one of the governing parameters for the ductility and shear capacity of RC columns. For example, in the fragility curve for ρ w , the exceedance probability at Sa of 1.0 g varied from 0.29 to 0.66, resulting in a swing of 0.37, and the corresponding swing in the fragility curve for f c , f y , and ρ l were 0.03, 0.25, and 0.25.
This observation can be confirmed in Figure 11, which shows the relative sensitivity on the shear vulnerability curve for the selected uncertain variables. For instance, at an Sa of 1.0 g, the relative sensitivities of rebar yield strength, longitudinal rebar ratio, and volumetric ratio of stirrup were 0.28, 0.28, and 0.41. Thus, these three parameters affect the shear vulnerability almost equally. Therefore, it could be inferred that quality control on these three parameters is essential to avoid the shear failure of RC columns.

5. Summary and Conclusions

The sensitivity of the fragility curve of an RC frame to material properties and structural detailing to the fragility curve of an RC frame was evaluated in this paper. The selected uncertain variables considering the possible construction quality defects were concrete strength, yield strength of rebar, longitudinal reinforcement ratio, and volumetric ratio of transverse reinforcement. The vulnerability curve for each limit state at the global and local levels was derived from the extensive nonlinear dynamic analyses with 17 RC frame models. The results of the sensitivity analysis identify the uncertain variables that most significantly affected the seismic response of the selected structures. The important findings are summarized below.
It was observed that the fluctuation of the vulnerability curves was significant at the damage control and collapse prevention limit states when concrete strength was considered as an uncertain variable. The magnitude of this fluctuation, named swing, was much higher than those of models with uncertainties related to the longitudinal reinforcement. The swing of the fragility curves with the uncertainty in the volumetric ratio of transverse reinforcement also increased notably. These results are clearly confirmed through relative sensitivity analysis. Thus, the seismic vulnerability at the global level was found to be particularly sensitive to the concrete strength and the volumetric ratio of transverse reinforcement.
The selected structure was identified to be susceptible to failure at the system level as well as the member level. Thus, the impact of the selected uncertain variables on the shear vulnerability of an RC column was assessed at the local level. It was observed that the shear vulnerability was very sensitive to the rebar yield strength, longitudinal rebar ratio, and volumetric ratio of stirrups. Particularly, the most significant effect on shear vulnerability was due to the volumetric ratio of the transverse reinforcement.
In conclusion, the seismic vulnerability of the selected RC frame was mainly affected by variability in concrete strength and the volumetric ratio of the transverse reinforcement. Therefore, securing the proper construction quality of these parameters is critical for the reliable seismic performance of an RC frame.

Author Contributions

Conceptualization, S.K. and S.J.K.; methodology, S.K.; investigation, S.K. and T.M.; writing—original draft preparation, S.K.; writing—review and editing, S.J.K.; supervision, S.J.K. All authors have read and agreed to the published version of the manuscript.

Funding

This research was supported by a grant (20DRMS-B146826-03) from the Development of Customized Contents Provision Technology for Realistic Disaster Management Based on Spatial Information Program, funded by the Ministry of the Interior and Safety of the Korean government.

Conflicts of Interest

The authors declare no conflict of interest.

References

  1. Tsai, K.C.; Hsiao, C.P.; Bruneau, M. Overview of building damages in 921 Chi-Chi earthquake. Earthq. Eng. Eng. Seismol. 2000, 2, 93–108. [Google Scholar]
  2. Elnashai, A.S.; Gencturk, B.; Kwon, O.S.; Hashash, Y.M.; Kim, S.J.; Jeong, S.H.; Dukes, J. The Maule (Chile) earthquake of February 27, 2010: Development of hazard, site specific ground motions and back-analysis of structures. Soil Dyn. Earthq. Eng. 2012, 42, 229–245. [Google Scholar] [CrossRef]
  3. Park, S.H.; Kim, S.; Kim, S.J.; Chang, C.; Yang, J.M. Performance evaluation of RC columns with an aramid fiber reinforced permanent form. J. Korean Soc. Adv. Compos. Struct. 2019, 10, 1–7. [Google Scholar]
  4. Chen, L.; Lu, X.; Jiang, H.; Zheng, J. Experimental investigation of damage behavior of RC frame members including non-seismically designed columns. Earthq. Eng. Eng. Vib. 2009, 8, 301–311. [Google Scholar] [CrossRef]
  5. Azam, R.; Soudki, K.; West, J.S.; Noël, M. Strengthening of shear-critical RC beams: Alternatives to externally bonded CFRP sheets. Constr. Build. Mater. 2017, 151, 494–503. [Google Scholar] [CrossRef]
  6. Chalioris, C.E.; Favvata, M.J.; Karayannis, C.G. Reinforced concrete beam-column joints with crossed inclined bars under cyclic deformations. Earthq. Eng. Struct. Dyn. 2008, 37, 881–897. [Google Scholar] [CrossRef]
  7. Lu, X.; Urukap, T.H.; Li, S.; Lin, F. Seismic behavior of interior RC beam-column joints with additional bars under cyclic loading. Earthq. Struct. 2012, 3, 37–57. [Google Scholar] [CrossRef] [Green Version]
  8. Chalioris, C.E.; Bantilas, K.E. Shear strength of reinforced concrete beam-column joints with crossed inclined bars. Eng. Struct. 2017, 140, 241–255. [Google Scholar] [CrossRef]
  9. Kim, J.; Han, S. Sensitivity analysis for seismic response of reinforced concrete staggered wall structures. Mag. Concr. Res. 2013, 65, 1348–1359. [Google Scholar] [CrossRef] [Green Version]
  10. D’Ayala, D.; Meslem, A. Derivation of analytical fragility functions considering modelling uncertainties. In Proceedings of the 11th International Conference on Structural Safety and Reliability—ICOSSAR13, New York, NY, USA, 16–20 June 2013. [Google Scholar]
  11. Pang, Y.; Wu, X.; Shen, G.; Yuan, W. Seismic fragility analysis of cable-stayed bridges considering different sources of uncertainties. J. Bridge Eng. 2014, 19, 04013015. [Google Scholar] [CrossRef]
  12. Moon, D.S.; Lee, Y.J.; Lee, S. Fragility analysis of space reinforced concrete frame structures with structural irregularity in plan. J. Struct. Eng. 2018, 144, 04018096. [Google Scholar] [CrossRef]
  13. Lee, T.H.; Mosalam, K.M. Seismic demand sensitivity of reinforced concrete shear-wall building using FOSM method. Earthq. Eng. Struct. Dyn. 2005, 34, 1719–1736. [Google Scholar] [CrossRef]
  14. Kwon, O.S.; Elnashai, A. The effect of material and ground motion uncertainty on the seismic vulnerability curves of RC structure. Eng. Struct. 2006, 28, 289–303. [Google Scholar] [CrossRef]
  15. Padgett, J.E.; DesRoches, R.F. Sensitivity of seismic response and fragility to parameter uncertainty. J. Struct. Eng. 2007, 133, 1710–1718. [Google Scholar] [CrossRef] [Green Version]
  16. Pan, H.; Tian, L.; Fu, X.; Li, H. Sensitivity of the seismic response and fragility estimate of a transmission tower to structural and ground motion uncertainties. J. Constr. Steel Res. 2020, 167, 105941. [Google Scholar] [CrossRef]
  17. Rajeev, P.; Tesfamariam, S. Effect of construction quality variability on seismic fragility of reinforced concrete building. In Proceedings of the Ninth Pacific Conference on Earthquake Engineering Structure Building and Earthquake-Resilient Society, Auckland, New Zealand, 14–16 April 2011. [Google Scholar]
  18. Open System for Earthquake Engineering Simulation. Available online: https://opensees.berkeley.edu (accessed on 1 July 2018).
  19. Mander, J.B.; Priestley, M.J.; Park, R. Theoretical stress-strain model for confined concrete. J. Struct. Eng. 1988, 114, 1804–1826. [Google Scholar] [CrossRef] [Green Version]
  20. Kim, S.; Kim, S.J.; Chang, C. Analytical assessment of the effect of vertical ground motion on RC frames designed for gravity loads with various geometric configurations. Adv. Civil. Eng. 2018. [Google Scholar] [CrossRef]
  21. Eurocode 8: Design of Structures for Earthquake Resistance-Part 1: General Rules, Seismic Actions and Rules for Buildings; EN 1998-1; CEN: Brussels, Belgium, 2004.
  22. Casolo, S. A numerical study on the cumulative out-of-plane damage to church masonry façades due to a sequence of strong ground motions. Earthq. Eng. Struct. Dyn. 2017, 46, 2717–2737. [Google Scholar] [CrossRef]
  23. Kim, J.; Park, J.H.; Lee, T.H. Sensitivity analysis of steel buildings subjected to column loss. Eng. Struct. 2011, 33, 421–432. [Google Scholar] [CrossRef]
  24. Hammad, A.; Moustafa, M.A. Modeling sensitivity analysis of special concentrically braced frames under short and long duration ground motions. Soil Dyn. Earthq. Eng. 2020, 128, 105867. [Google Scholar] [CrossRef]
  25. ACI 318-19. Building Code Requirements for Structural Concrete and Commentary; American Concrete Institute: Indianapolis, IN, USA, 2019. [Google Scholar]
  26. Seismic Building Design Code (KDS 41 17 00); Korean Design Standard; Ministry of Land: Seoul, Korea, 2019.
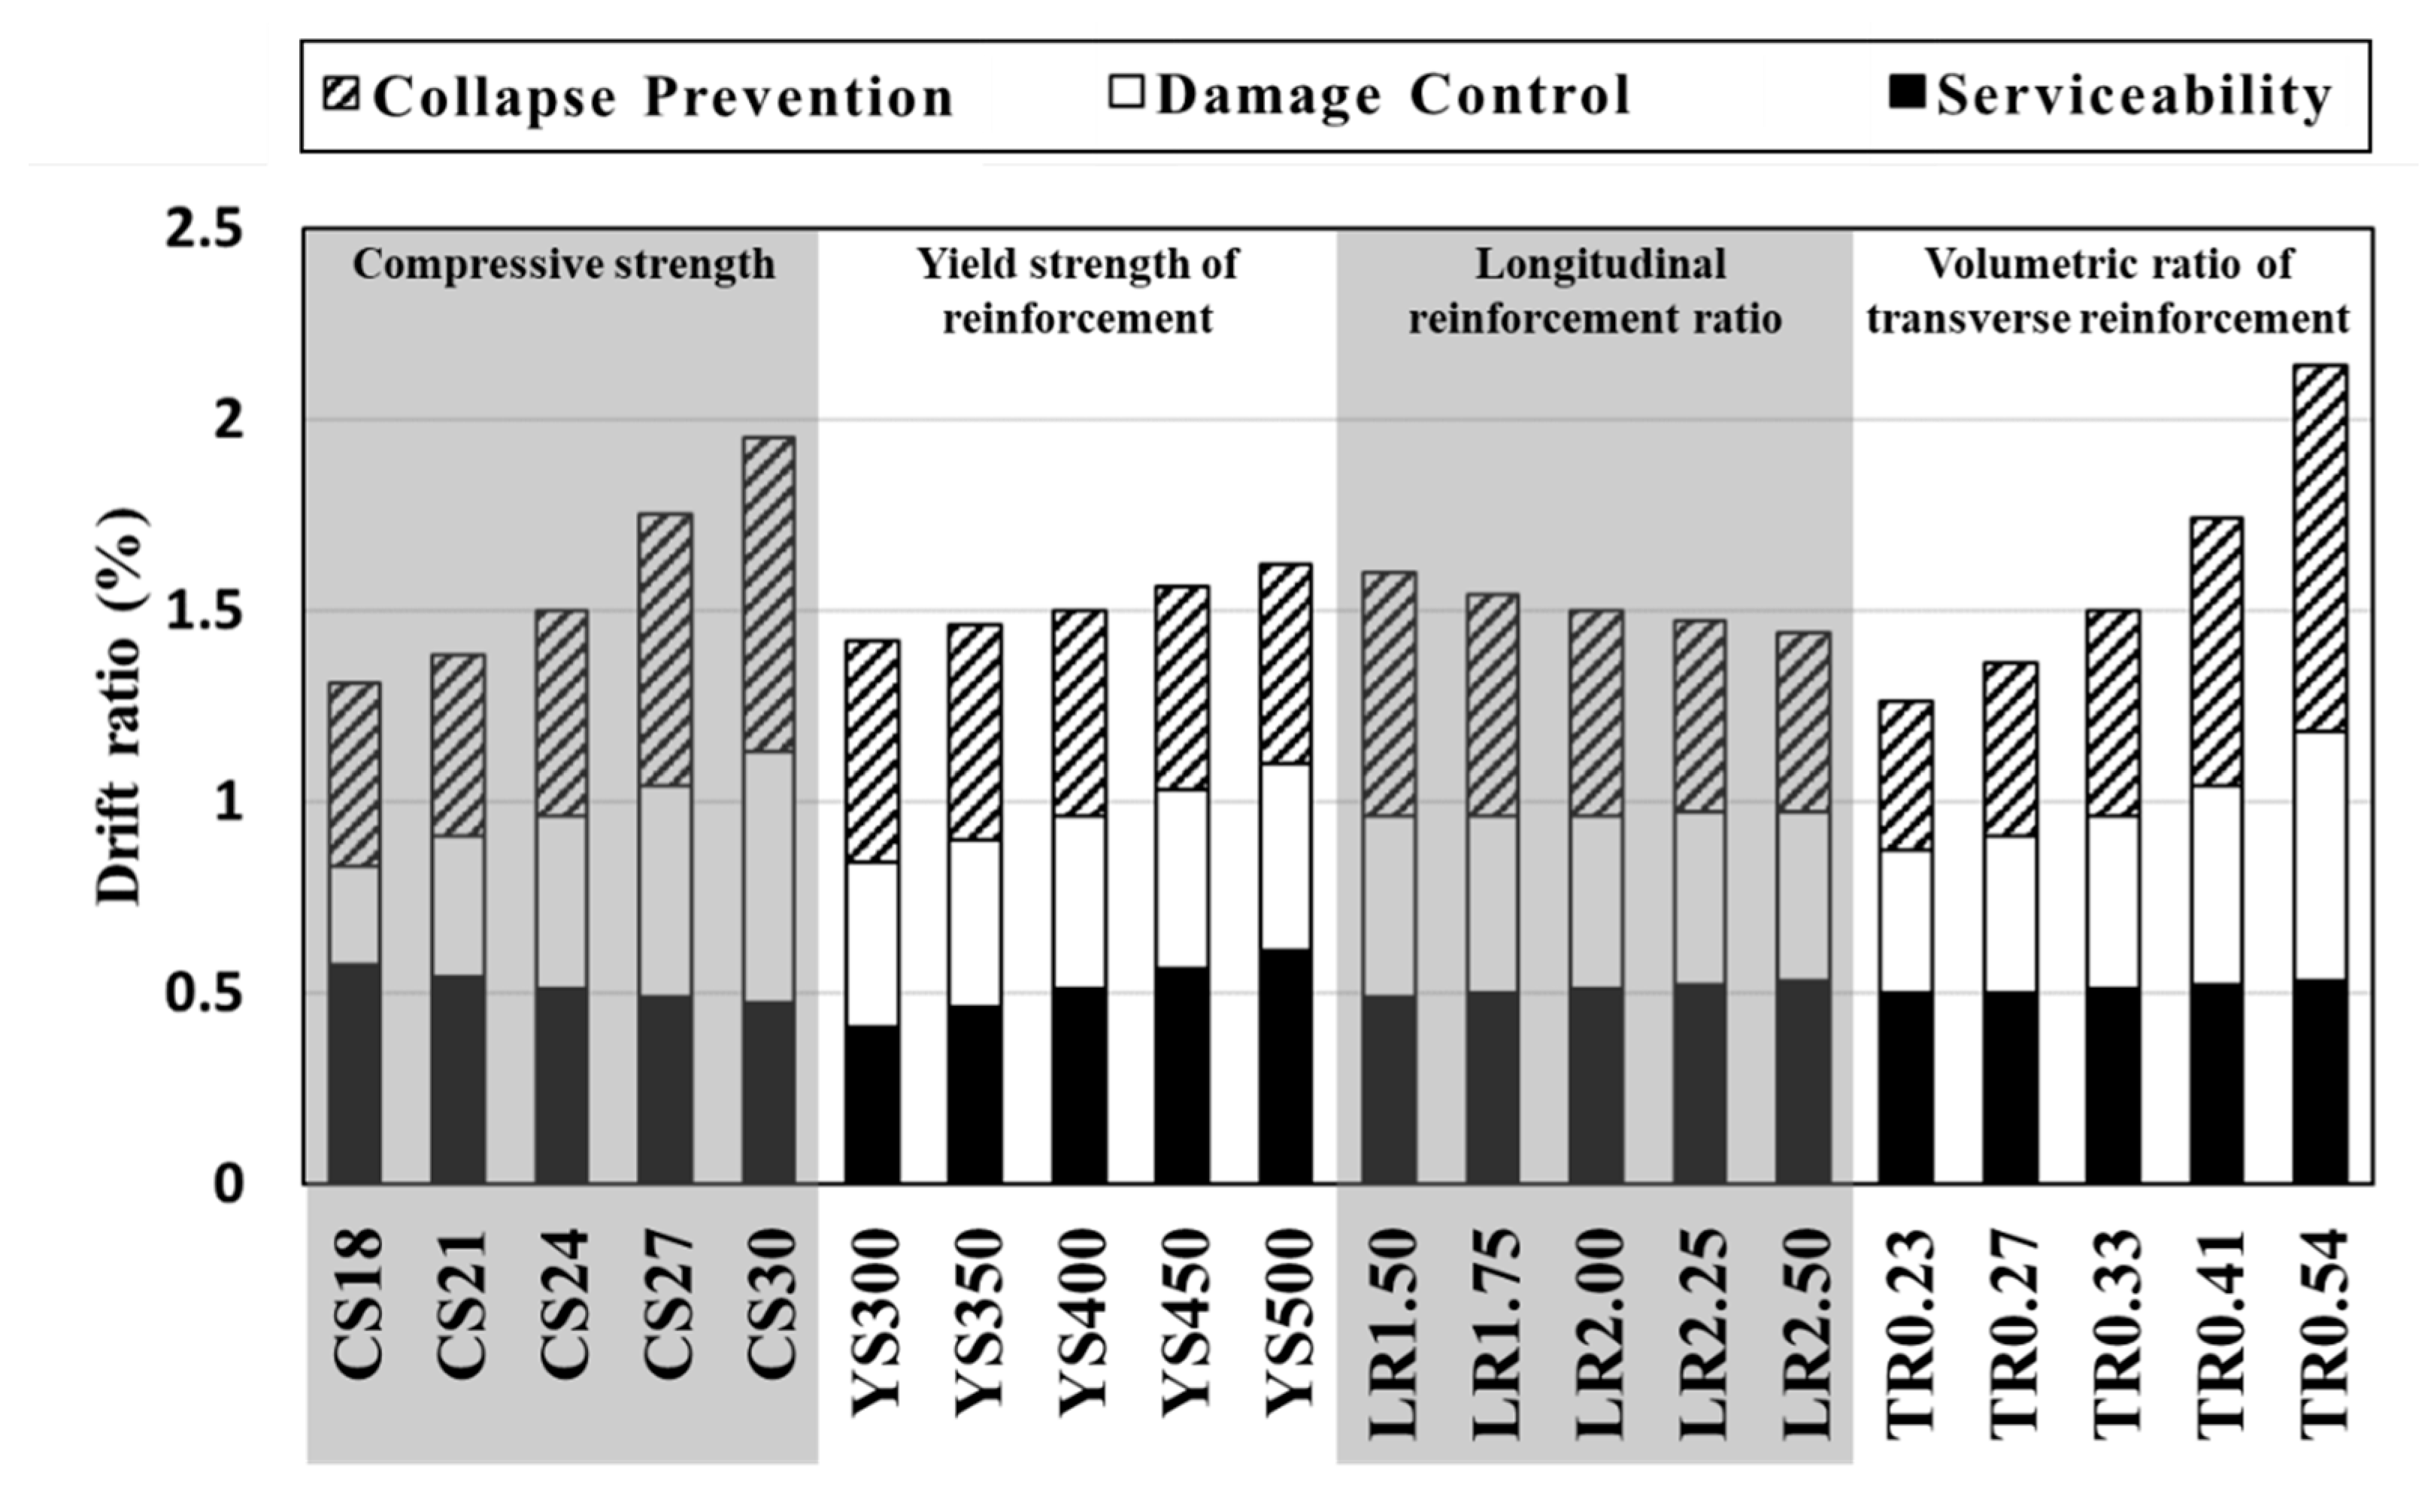
Figure 1. Structural damage due to inadequate construction after the Pohang Earthquake (2017): (a) excessive clear cover; (b) wide stirrup spacing (S is the observed spacing and Smin is the minimum spacing specified by the design code).
Applsci 10 08832 g001
Figure 2. Plan view and elevation of the selected reinforced concrete (RC) structure (unit: mm): (a) plan; (b) elevation.
Applsci 10 08832 g002
Figure 3. Section details of selected members (unit: mm): (a) column; (b) girder 1; (c) girder 2.
Applsci 10 08832 g003
Figure 4. Material constitutive laws in OpenSees [18]: (a) Steel01; (b) Concrete02.
Applsci 10 08832 g004
Figure 5. Interstory drift ratio corresponding to the limit states of each structure.
Applsci 10 08832 g005
Figure 6. Response spectrum of selected ground motion records.
Applsci 10 08832 g006
Figure 7. The sensitivity swing of the seismic vulnerability curve at each the limit state in the global level: (a) concrete strength; (b) yield strength; (c) longitudinal reinforcement ratio; (d) volumetric ratio of transverse reinforcement.
Applsci 10 08832 g007
Figure 8. Relative sensitivity of uncertain variables on vulnerability curves: (a) serviceability; (b) damage control; (c) collapse prevention.
Applsci 10 08832 g008aApplsci 10 08832 g008b
Figure 9. Seismic vulnerability curves at the global and local levels.
Applsci 10 08832 g009
Figure 10. Sensitivity swing for shear vulnerability curves: (a) concrete strength; (b) yield strength; (c) longitudinal reinforcement ratio; (d) volumetric ratio of transverse reinforcement.
Applsci 10 08832 g010aApplsci 10 08832 g010b
Figure 11. Shear vulnerability curve and relative sensitivity.
Applsci 10 08832 g011
Table 1. Uncertainty of material properties and structural details.
Reference NameMaterialStructural Details
Concrete   Strength ,   f c ( MPa ) Yield   Strength   of   Longitudinal   Reinforcement ,   f y ( MPa ) Longitudinal   Reinforcement   Ratio ,   ρ l ( % ) Volumetric   Ratio   of   Transverse   Reinforcement ,   ρ w ( % )
CS18184002.000.33
CS2121
CS2424
CS2727
CS3030
YS300243002.000.33
YS350350
YS400400
YS450450
YS500500
LR1.50244001.500.33
LR1.751.75
LR2.002.00
LR2.252.25
LR2.502.50
TR0.23244002.000.23
TR0.270.27
TR0.330.33
TR0.410.41
TR0.540.54
Table 2. Selected ground motions.
EarthquakeMwStationFault Distance (km)Peak Ground Acceleration (g)Peak Ground Velocity (cm/s)SI (cm)
Northern Calif-01 (1941)6.40Ferndale City Hall44.600.125.9417.17
Hollister-01 (1961)5.60Hollister City Hall19.500.068.0134.41
Parkfield (1966)6.19Cholame–Shandon Array #59.580.4425.0482.97
Temblor pre-196915.900.3622.1652.03
Northern Calif-05 (1967)5.60Ferndale City Hall28.700.2512.5326.05
Lytle Creek (1970)5.33Santa Anita Dam42.500.051.702.96
San Fernando (1971)6.61LA—Hollywood Stor FF22.700.2321.7179.17
Lake Hughes #1219.300.3816.3637.83
Managua Nicaragua (1972)6.24Managua ESSO14.060.3729.06114.55
5.20Managua ESSO24.980.2625.4090.69
Hollister-03 (1974)5.14Hollister City Hall9.390.095.3715.23
Friuli Italy-01 (1976)6.50Tolmezzo15.800.3622.8473.29
Coyote Lake (1979)5.74Coyote Lake Dam—S.W. Abut.6.130.1411.7531.75
Gilroy Array #29.020.1910.2740.30
Imperial Valley-06 (1979)6.53Aeropueto Mexicli0.340.3142.79163.01
Bonds Corner2.660.6046.75174.57
EC County Center FF7.310.2138.42142.52
El Centro Array #1112.500.3736.00138.68
El Centro Array #47.050.4839.62178.08
El Centro Array #83.860.6154.49183.80
El Centro Differential Array5.090.3575.54147.36
Holtville Post Office7.500.2653.11109.12
Imperial Valley-07 (1979)5.01El Centro Array #412.100.2312.6118.89
El Centro Array #511.20.2211.1120.33
El Centro Array #610.30.1613.9130.09
Imperial Valley-08 (1979)5.62Westmorland FireSta9.760.1111.9532.17
Livermore-02 (1980)5.42Antioch—510 GSt32.100.116.9115.58
San Ramon Eastman Kodak18.200.2822.9660.97
Anza (Horse Canyon, 1980)5.19Borrego Air Ranch40.600.053.256.88
Mammoth Lake-02 (1980)6.06Mammoth Creek4.670.3216.3236.80
5.69Convict Creek9.460.1611.6241.12
Mammoth Lakes H.S.9.120.3924.1642.74
5.91Convict Creek12.400.2319.8270.09
Westmorland (1981)5.90Brawley Airport15.400.1612.6747.60
Parachute Test Site16.700.2355.55124.18
Westmorland Fire Station6.500.3844.12179.55
Morgan Hill (1984)6.19Anderson Dam (Downstream)3.260.4225.4164.07
Gilroy Array #712.000.197.3320.03
Halls Valley3.480.1612.7747.78
N. Palm Springs (1986)6.06North Palm Springs4.040.6965.99204.23
Chalfant Valley-01 (1986)5.77Zack Brothers Ranch6.390.2723.5353.78
Superstition Hills-02 (1987)6.54Poe Road (temp)11.100.4841.17122.36
Superstition Mtn Camera5.610.5823.9569.31
Loma Prieta (1989)6.93Corralitos3.850.6555.97156.52
Big Bear-01 (1992)6.46Big Bear Lake—Civic Center8.300.5534.5172.38
Kobe Japan (1995)6.90Nishi-Akashi7.080.4846.82147.48
Dinar Turkey (1995)6.40Dinar3.360.3345.32209.69
Parkfield-02 CA (2004)6.00Parkfield—Fault Zone 32.730.3822.9574.22
Parkfield—Fault Zone 72.670.2318.5382.44
Parkfield—Fault Zone 83.950.5722.0445.72
Publisher’s Note: MDPI stays neutral with regard to jurisdictional claims in published maps and institutional affiliations.

