Article

Seismic Upgrading of Existing Reinforced Concrete Buildings Using Friction Pendulum Devices: A Probabilistic Evaluation

Department of Structural, Geotechnical and Building Engineering (DISEG), Politecnico di Torino, 10129 Turin, Italy
*
Author to whom correspondence should be addressed.
Appl. Sci. 2020, 10(24), 8980; https://doi.org/10.3390/app10248980
Submission received: 27 November 2020 / Revised: 13 December 2020 / Accepted: 14 December 2020 / Published: 16 December 2020
(This article belongs to the Special Issue Structural Reliability of RC Frame Buildings)

Abstract

:
In many countries around the world a huge number of existing reinforced concrete (RC) structures have been realized without account for seismic detailing, even if they are located in areas subjected to high seismicity. In this context, several passive seismic protection techniques have been developed and applied to retrofit these structures such as, for an example, seismic isolation. The aim of this work is to characterize in probabilistic terms the seismic performance of a framed RC building retrofitted by means of sliding friction pendulum (FPS) devices. Specifically, the response of an existing RC building located in a high seismicity area in Italy is investigated. After the description of the main available information about the structure, a non-linear numerical model has been defined by means of fiber-elements approach. Then, non-linear dynamic analyses considering multiple recorded ground motions with the three accelerometric components have been carried out to assess the seismic response of the building with and without the retrofitting intervention composed of FPS isolators. Finally, the results are processed to achieve a probabilistic assessment of the seismic performance of the retrofitting intervention.

1. Introduction

Nowadays, in many countries such as Italy, the assessment of existing structures and infrastructures [1] is a relevant issue and particular care should be pointed out to areas with a high seismic hazard. In fact, during the 60s and 70s many of today’s existing reinforced concrete (RC) buildings were built without any seismic criterion or with poor detailing in comparison to the current codes [2]. In fact, most of the existing constructions, in particular RC buildings, have been designed to withstand mainly gravity loads. In this context, the seismic assessment is very important to define the best retrofitting solution in order to upgrade the performance level of existing structures in line with modern codes and safety requirements [3] within the performance-based seismic design [4,5].
In order to improve the response to seismic actions of existing RC buildings, over the years, the isolation system with friction pendulum (FP) devices have turned out to be one of the most efficient solutions [6]. Contextually, in the literature and in practice alternative strategies and philosophies aimed to improve the seismic response of buildings, in general, are proposed and discussed [7,8,9,10]. With particular reference to RC-framed buildings, the main advantages of the use of FPS devices relate to the achievement of a value of the isolation period which does not depend from the mass of the superstructure, to the post-event self-recentering response and to the energy dissipation capacity [11,12]. In the literature, several studies have been devoted to the proper modelling of the FP bearing response investigating also the influence of main parameters able to describe their behaviour [13].
The evaluation of structural reliability of structural systems equipped with base isolation solution has been widely investigated [14] also considering random seismic excitations [15]. Similarly, referring both to 3D RC structures and to equivalent models, deterministic [16] and seismic reliability [17,18,19] analyses have been carried out. Specifically, in [17,18,19] the seismic reliability-based design (SRBD) approach has been proposed as a strategy to define some important design parameters for base-isolated systems.
The aim of this work is to investigate the influence of the retrofitting intervention composed of single-concave friction pendulum devices on the seismic response on an existing reinforced concrete building located in central Italy, which is widely recognized as an area characterized by a very high seismicity. After the characterization of the geometrical features and material properties according to the “knowledge levels” approach [2], a non-linear numerical model of the structure has been defined using a fiber-approach. Then non-linear dynamic analyses have been carried out considering multiple recorded ground motions with the three accelerometric components, scaled to the design seismic intensity [2], to assess the seismic response of the building with and without the retrofitting intervention composed of the FP isolators.
The results from the non-linear dynamic analysis have been useful to evaluate the effectiveness of the retrofitting technique in probabilistic terms adopting a log-normal probabilistic model for the output variables expressed as both the interstory drift index and horizontal relative displacement of the FP devices. Finally, the probabilities of exceedance of the different values of the output variables are evaluated.

2. Behavior of Single-Concave Friction Pendulum Bearings

Friction pendulum (FP) devices have been widely adopted to retrofit existing buildings in areas characterized by a high seismicity [1,16,17]. Specifically, the FP devices are able to realize a disconnection between the superstructure and the foundations of the building and to absorb the major part of the displacement demand with reference to seismic response of the global structural system. Moreover, the FP devices allow a significant level of energy dissipation by means of a frictional mechanism which develops on the concave sliding surfaces [12,18,19,20].
With particular reference to single-concave FP bearings, these are devices able to support vertical actions and transfer horizontal actions by means of an articulated slider which slides on a concave surface having curvature radius R and radius in plan r [17]. One of the main advantages associated to the use of single-concave FP bearings is that the fundamental period of the base-isolated structural system Tis depends only on the radius of curvature of the concave sliding surface R, according to the following expression:
T i s = 2 π R / g
where g is the gravity acceleration.
In line with the assumption of small angles between the vertical and the normal direction of the concave sliding surface of the single-concave FP devices, the bearing restoring force fb(t) expressed as a function of time t applies [12]:
f b ( t ) = W R u b ( t ) + μ d ( t ) W sgn ( d u b ( t ) d t )
where W = Mg denotes the total vertical load on the bearing, M is the mass on the bearing; ub(t) denotes the horizontal projection of the displacement of the pivot point of the slider with respect to the ground; μd(t) represents the sliding dynamic friction coefficient; sgn(dub(t)/dt) denotes the sign function of the sliding velocity dub(t)/dt. The response of the FP device can be reproduced by means of a non-linear hysteretic model according to [21] and in line with Figure 1. The hysteretic model representing the FP behavior can be characterized by the following three parameters: the characteristic strength Qd = μdW; the post-elastic stiffness denoted as K2 = W/R; the elastic stiffness K1 that can be set as 51 times larger than the post-elastic stiffness K2 according to [21].
On the basis of the experimental investigations of [22,23], the non-linear dependence of the dynamic friction coefficient μd(t) on the sliding velocity dub(t)/dt can be expressed using the following expression:
μ d ( t ) = μ f a s t ( μ f a s t μ s l o w ) exp ( α | d u b ( t ) d t | )
where μfast and μslow are the friction coefficient at high and nearly-zero sliding velocity dub(t)/dt, respectively; α is a constant that regulates the rate of change of the friction coefficient μd(t) with velocity in the transition from its maximum and minimum values. The model so far described is adopted in order to reproduce the response of the single-concave FP bearings when used to retrofit the existing RC building herein investigated. Representative values for the dynamic friction coefficient may be found in the technical reports from manufacturers (e.g., [24]).

3. Description of the Case Study: An Existing RC Building

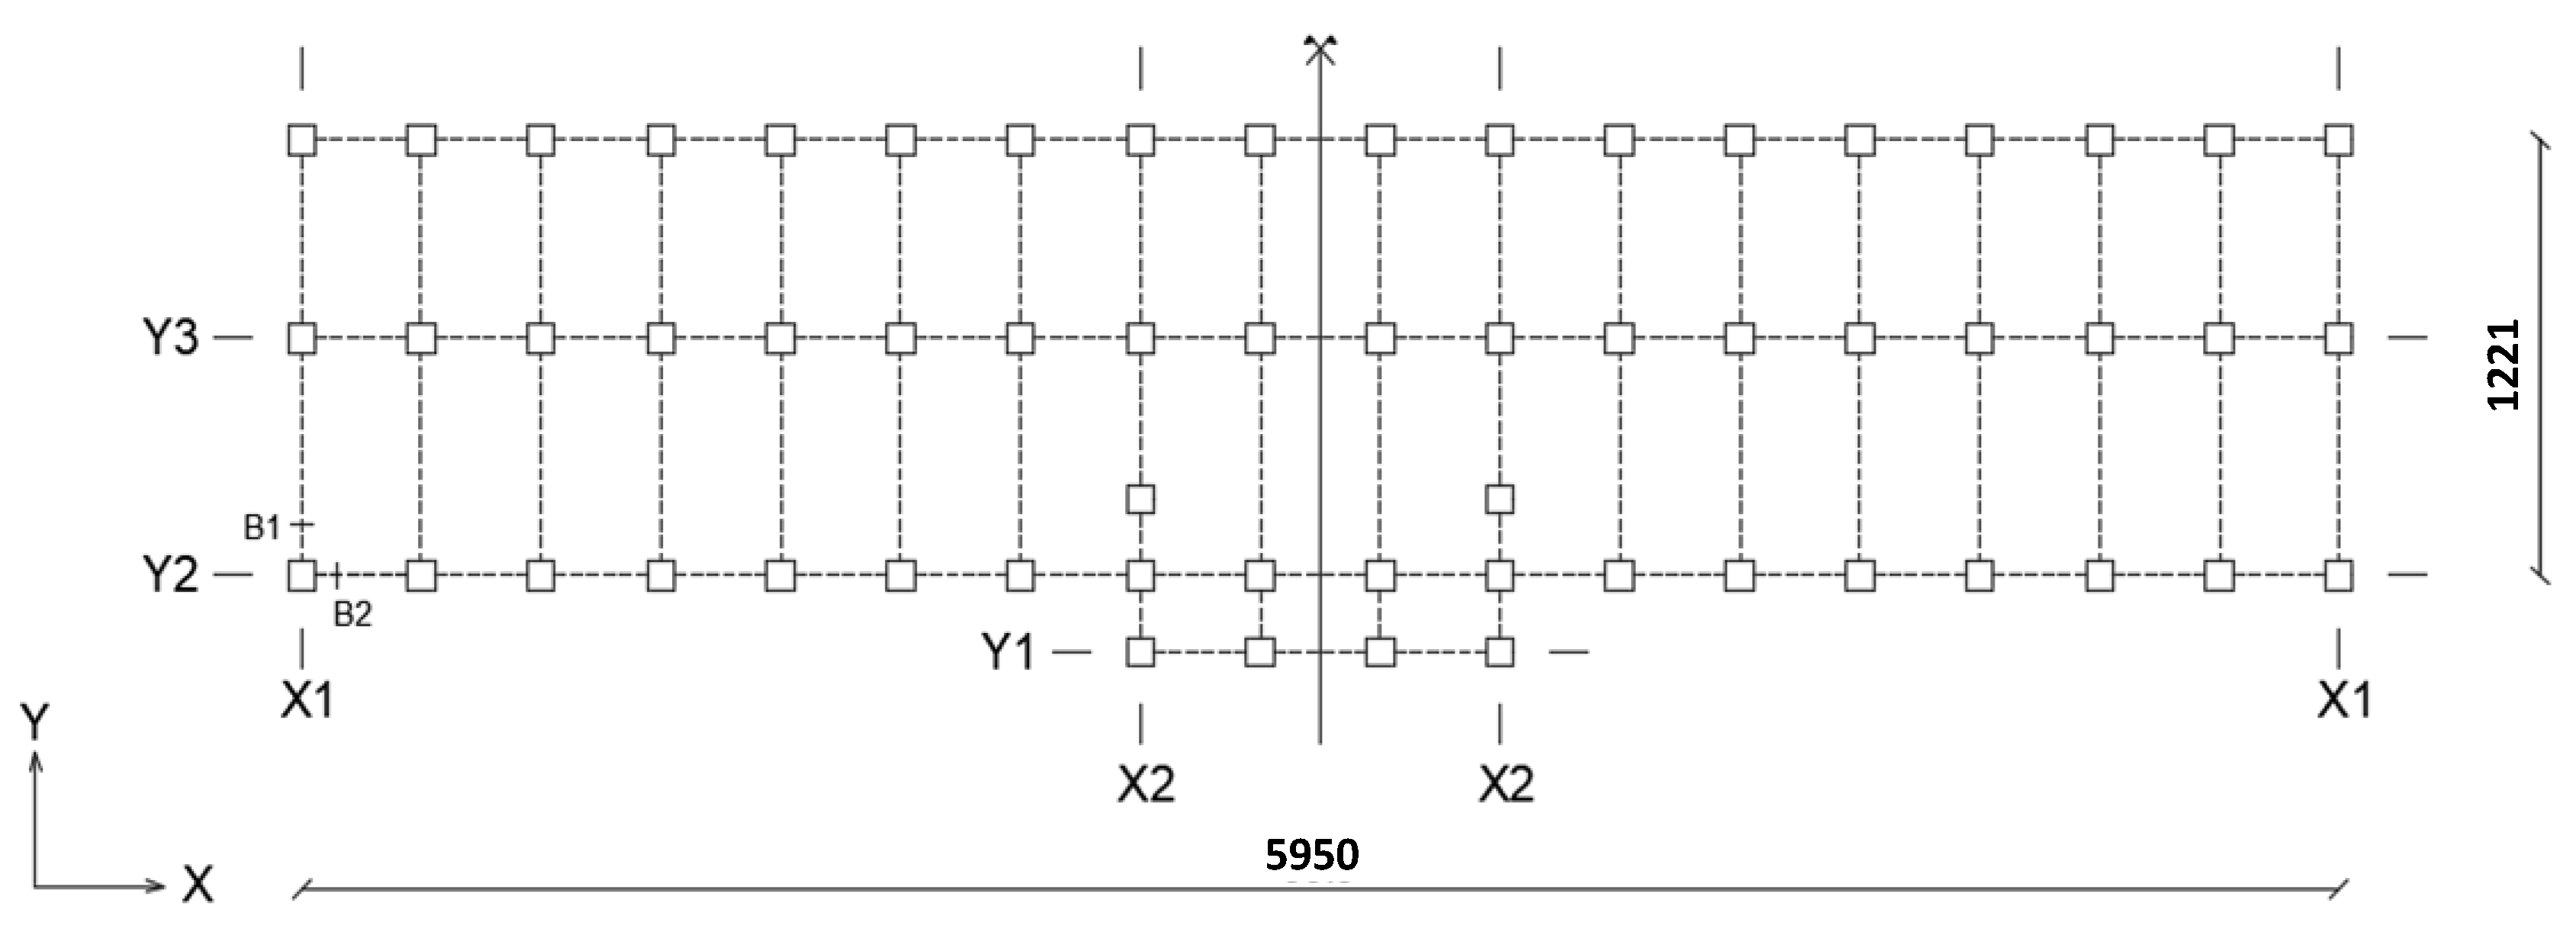
The case study considered for the present investigation relates to an existing framed reinforced concrete building located in central Italy in a high seismicity region (i.e., Peak Ground Acceleration—PGA higher than 0.25 g with a probability of exceedance of 10% in 50 years). According to Figure 2, the building consists of an RC framed structure built in the 60s which is founded on inverted RC beams and have a plan dimension of 12.2 m in the transverse direction (Y) and 59.8 m in the longitudinal direction (X).
The maximum height, at the roof level, is about 16 m from the foundation level. The structure is composed of a basement, a ground-floor, two further floors and a roof floor. The ground-floor (i.e., story 1) of the structure is surrounded by a soil embankment that significantly limits its movements in X and Y horizontal directions. As in the 60s Italian design code was not conceived for seismic design, the RC building were designed without proper conception to withstand seismic actions and without the related detailing.
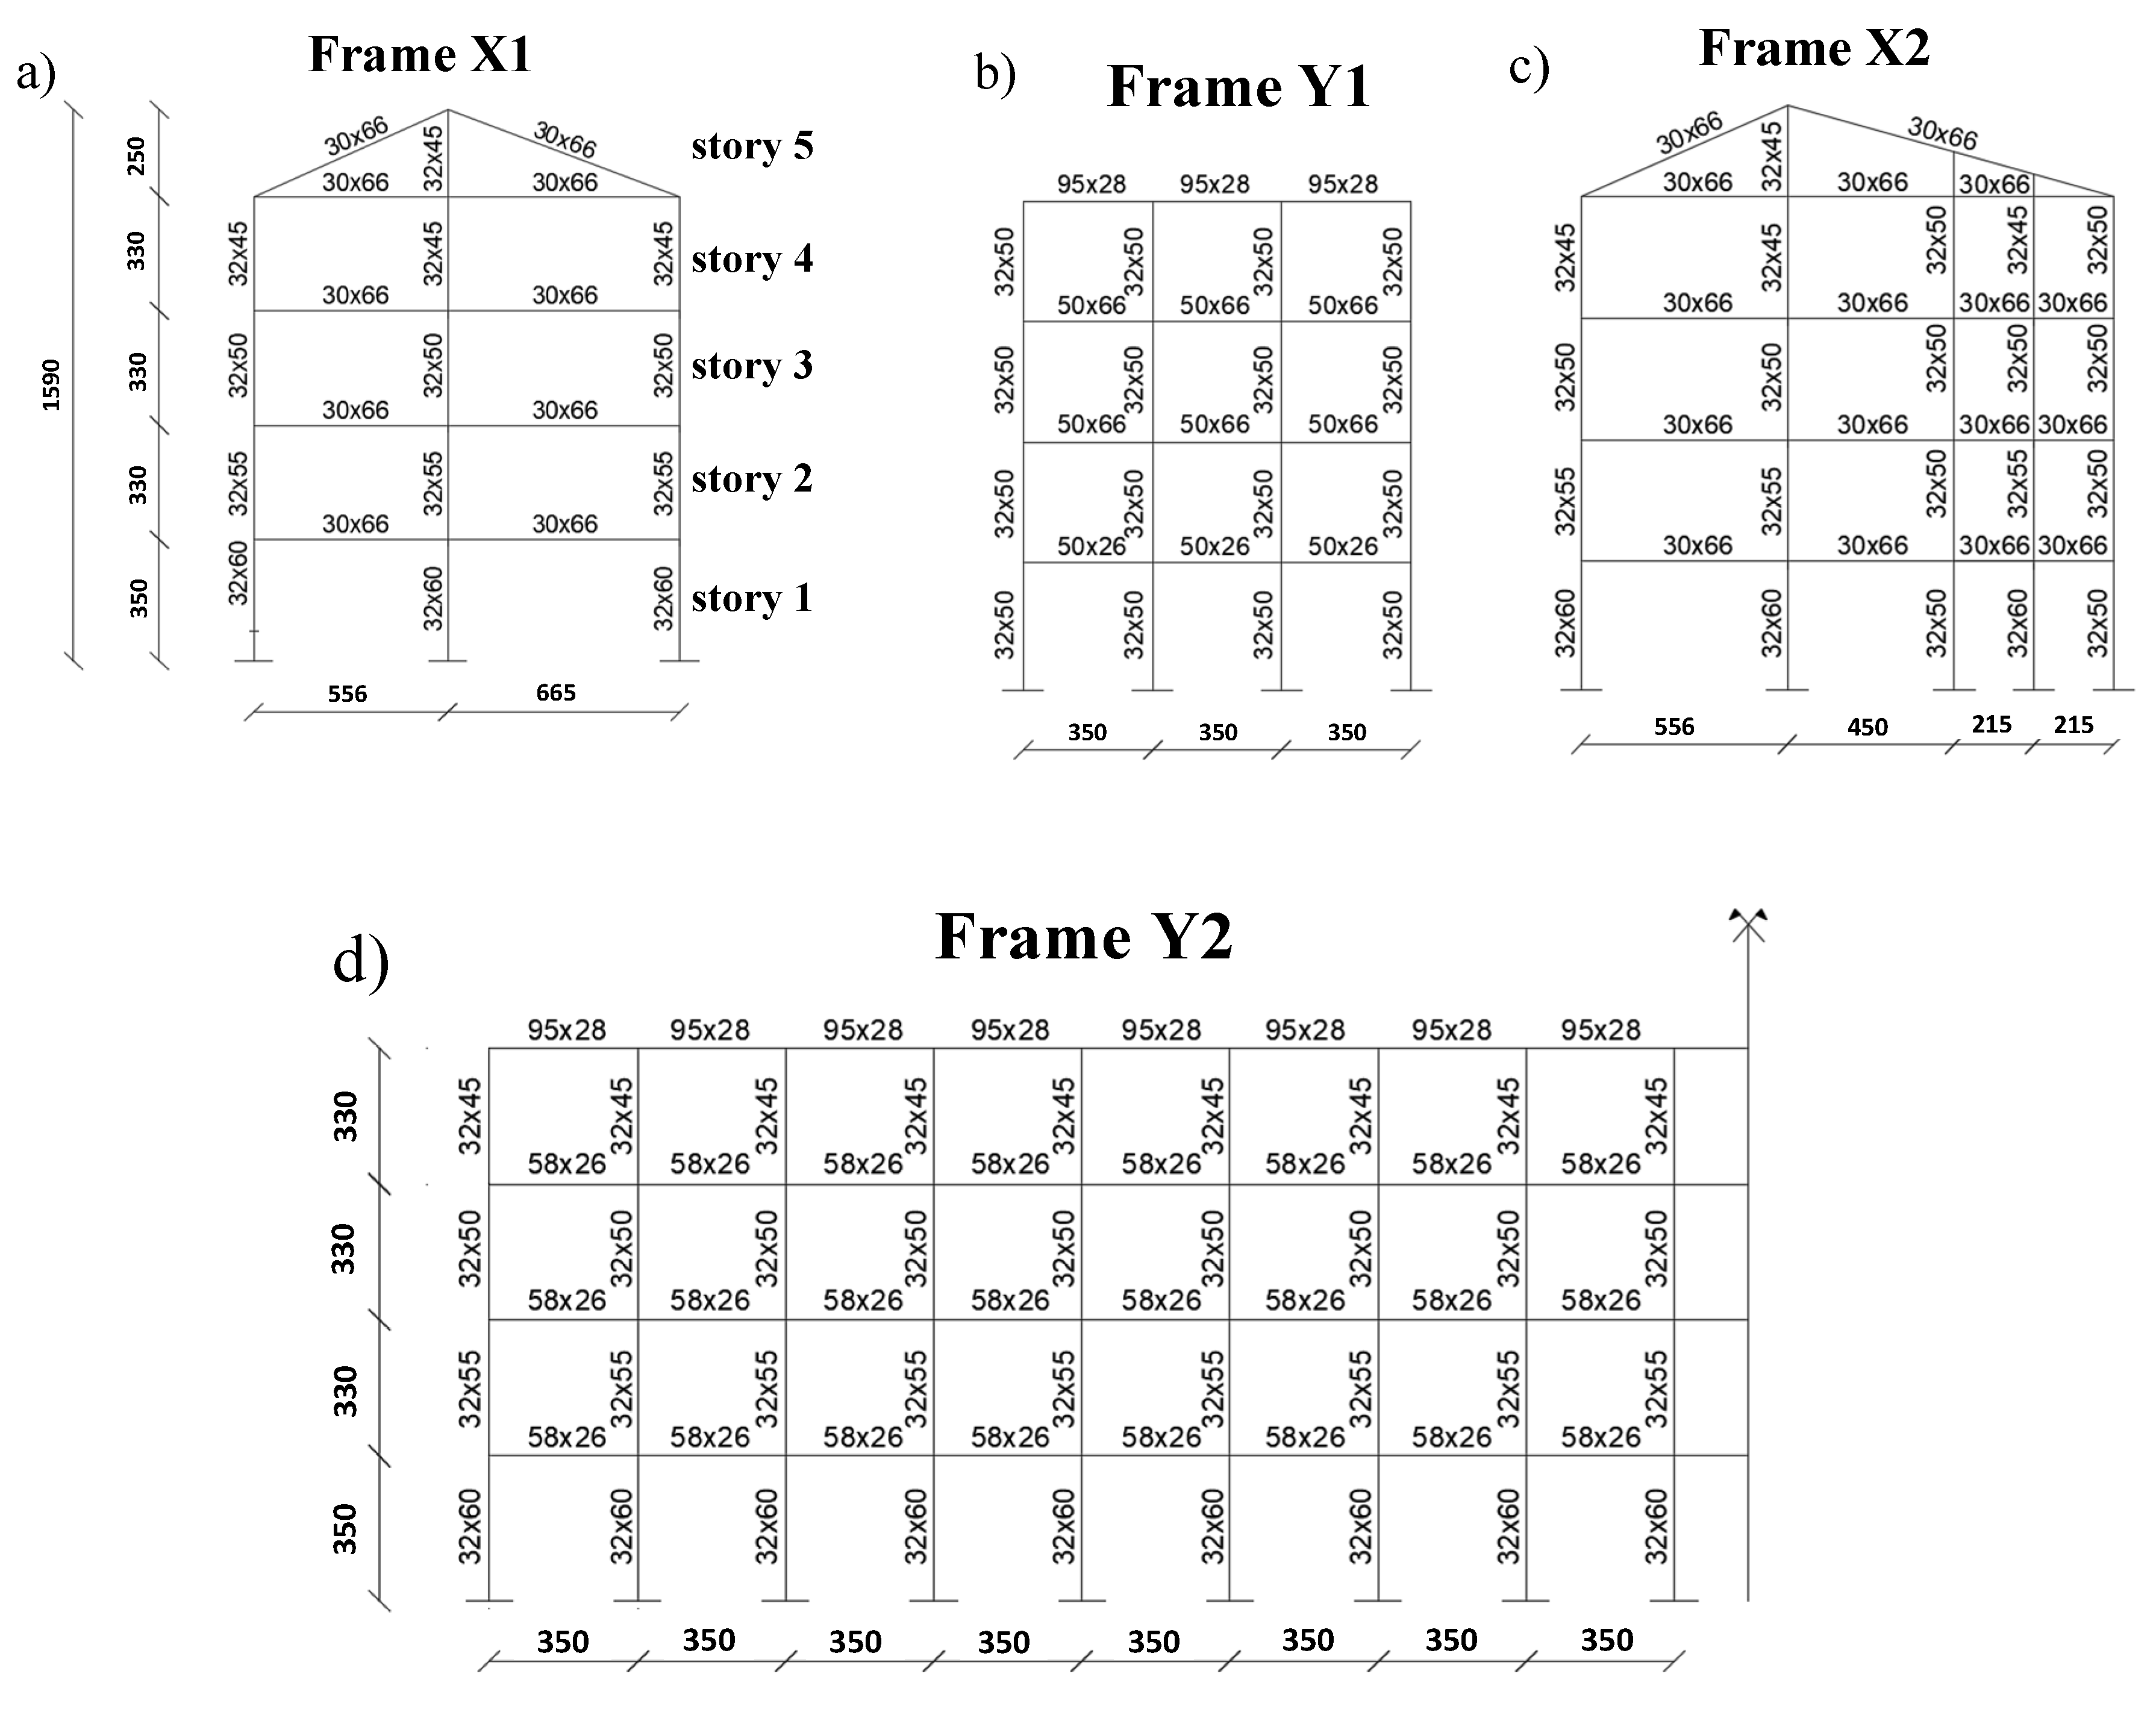
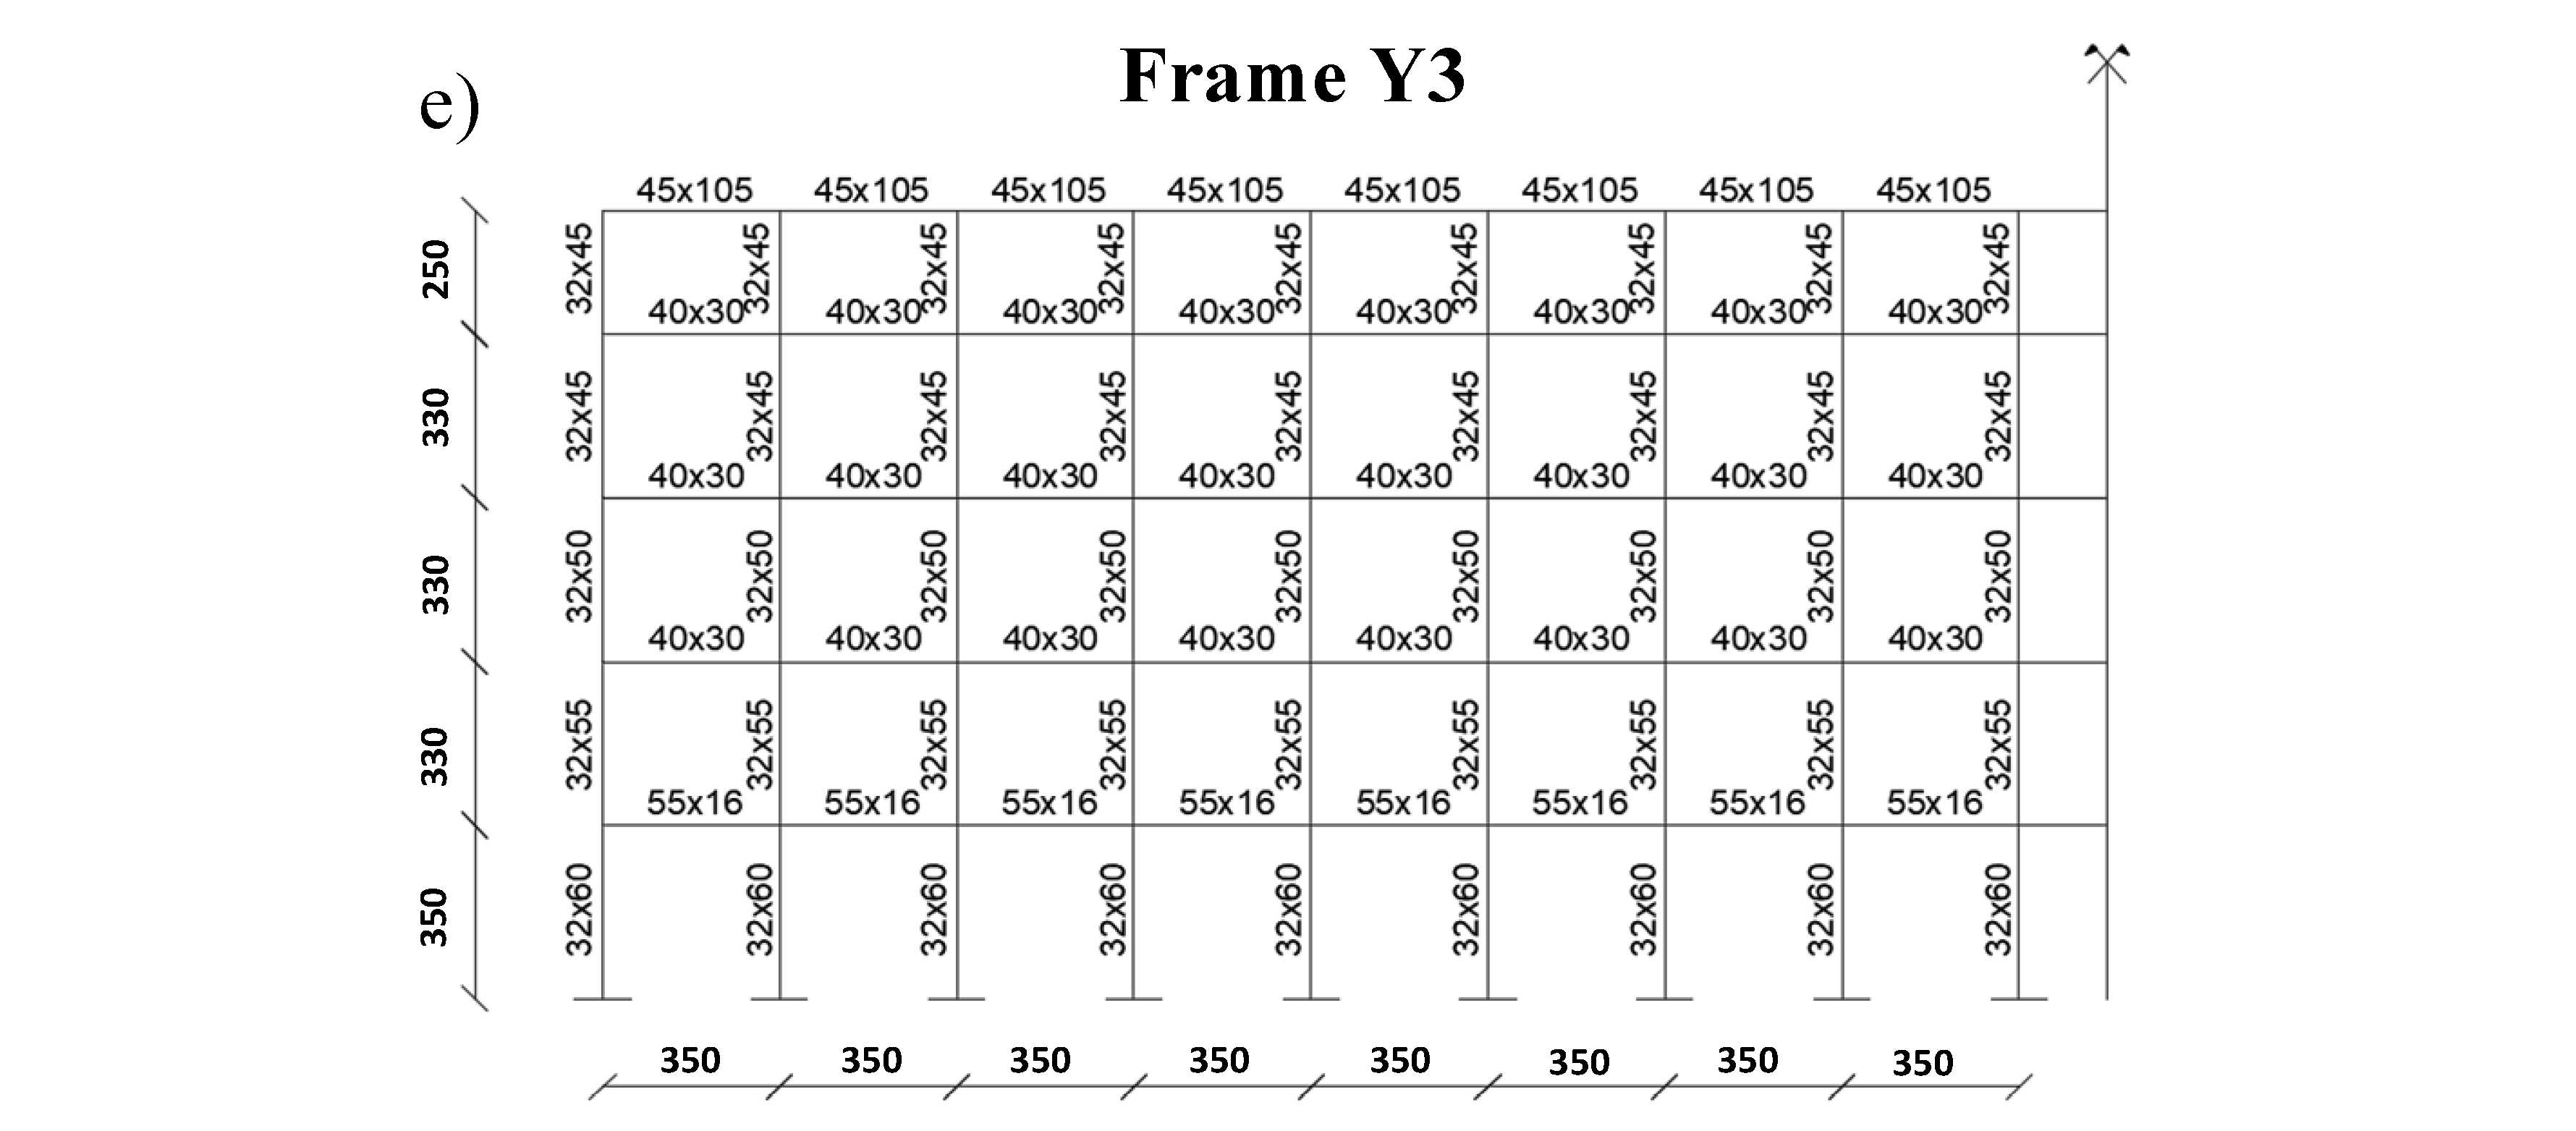
The geometrical characteristics of the main RC frames that compose the structure are described in Figure 3a–e with reference to the X and Y directions. Several typologies of beams and columns are present as also showed in Figure 4. The details of the main longitudinal and shear reinforcements for the different members typologies are listed in Table 1. The concrete cover is about 3 cm. The floors are realized with the typical Italian lightened “latero-concrete” solution with RC joist having height of 16 cm and base of 10 cm located with 50 cm of spacing with a top reinforced concrete slab of 4 cm. This structural system is able to provide a rigid floor behavior allowing a hyperstatic redistribution of horizontal actions (e.g., seismic action) between the different frames.
The mechanical characterization of the material properties, adopted in the numerical model, has been performed through appropriate destructive and “in situ” non-destructive tests. According to the prescriptions of the Italian code for structural design and assessment [2], the achieved knowledge level (KL) is the KL3, which leads to the adoption of a confidence factor C F = 1 . For instance, the material properties will be adopted with their mean values as a result of the statistical analysis of the data deriving from the tests.
The mean value of concrete compressive strength has been deduced from the crushing tests of cores drilled in different locations and structural members of the structure and its value turns out to be equal to fcm = 25.2 MPa. On some specimens, strain measurements have been carried out in order to estimate the mean value of secant modulus of elasticity that is equal to Ecm = 22,000 MPa. In addition, the characterization of the mechanical properties of steel used for reinforcement bars (FeB38k) has been performed using the data available from tensile tests on samples taken from different structural members. The following mean value for yield strength has been obtained: fym = 374 MPa.
The geometry of the structure with the related reinforcement arrangement and material properties has been adopted to define an appropriate non-linear numerical models using the software code SAP2000 [25].

4. Numerical Simulation of Seismic Response of the RC Building with and without Retrofitting Using Single-Concave FPS

In the present section the results from numerical non-linear dynamic analyses of the RC structure under investigation are described together with the modelling hypotheses [26,27] adopted to define the non-linear numerical (NLN) model and the assumptions to select the seismic inputs. In particular, SAP2000 [25] software platform has been used to realize the appropriate NLN models of the fixed-base (FB) and base-isolated (BI) structure and to perform non-linear dynamic analyses that are useful to evaluate in probabilistic terms the performance of the retrofitting intervention.

4.1. Definition of the Non-Linear Numerical Models for Fixed-Base/Base-Isolated RC Structure

The numerical model of the RC structure has been realized according to the geometric features described in the previous section. In particular, the columns have been assumed as fully restrained by the stiff inverted beams at the foundation level and the behavior of rigid floors has been accounted for by means of in-plane diaphragm constrains [25]. The interaction in the non-linear dynamic simulations between the structure of the ground-floor and the surrounding soil embankment has been accounted for by means of appropriate restraints to limit the horizontal displacements in X and Y directions. In this way, the seismic response only of the ground-floor of the structure (i.e., story 1 of Figure 3) is restrained due to the presence of the surrounding soil embankment as will be achieved in the following.
The cross-sections of the structural members (i.e., beams and columns) have been realized according to the fiber approach [25], as also developed in [28]. In particular, the mechanical properties of the fibers in each cross-section have been defined differentiating between concrete cover, core and longitudinal reinforcements. The concrete behavior in both cover and core fibers has been reproduced by means of Mander et al. [29] constitutive relationships accounting for non-linear response in compression and elastic with linear softening response in tension. The properties of concrete cover fibers (i.e., tensile strength, ultimate deformation in compression) have been derived from both the mean value of cylinder compressive strength fcm and Young’s modulus Ecm according to [30]. The response of concrete core fibers has been defined evaluating the enhanced properties due to the confinement effects of the stirrups evaluated adopting the model of [31]. The properties of the reinforcement have been defined by means of an elastic-plastic law with a limited ultimate strain to reproduce both tensile ad compressive response. The yielding strength has been set equal to the mean value fym estimated from the tests with a Young’s modulus assumed equal to 200,000 MPa and an ultimate strain set to 7.5%.
The mechanical non-linearities have been included in the numerical model adopting a distributed plasticity approach (the so-called “Fiber Hinge”) implemented in the software platform SAP2000 [25]. The fiber-plastic hinges so far defined are able to account for the interaction between axial load and bending moments in X and Y directions. The moment-curvature law of the fiber-hinge law is determined on the basis of the fiber cross-section properties previously introduced. The mechanical non-linearity is developed in each fiber of the cross-section, but is not extended to the whole element [32], but are included in a portion of the RC member with a predefined length (i.e., plastic hinge length). In particular, the plastic hinge length Lp is evaluated according to a well-validated formulation by Priestley et al. [33] formulation:
L p = 0.08 l + 0.022 f y m d
where l is the length of the member, fym is the mean yield strength of steel reinforcement from tests and d’ is the diameter of the smallest longitudinal reinforcing bar adopted within the cross-section. The geometric non-linearity (i.e., P-Δ effect) has been accounted for within the numerical simulations with the evaluation of the equilibrium equations with reference to the deformed structural configuration.
The fundamental vibration period of the fixed-base structures is 0.80 s from the eigenvalue analysis without considering any stiffness reduction in the RC beams and RC columns. This assumption is aimed not to underestimate the effects in terms of both accelerations and seismic forces to the structure.
The retrofitting using the single-concave friction pendulum (FP) has been simulated introducing a disconnection between superstructure and substructure at the top of the columns of the groundfloor. In practice, the intervention may be realized by means of the removal of the load on the columns through the use of hydraulic jacks that react on a pair of clamps fixed to each column to transfer the load by friction. Then, a portion of the column is cut at the isolation level where the friction-pendulum device should be located. This procedure, which is apparently very laborious, is not significantly demanding in practice and it is not invasive. In addition, the columns of the substructure at the isolation level may be connected through beams to improve the safety and robustness [3]. The single-concave friction pendulum (FP) isolators have been modeled using the non-linear link “Friction Pendulum” implemented in SAP2000 [25]. The latter permits one to consider compressive behavior along the vertical direction only, whereas, is able to couple the frictional properties in the X, Y directions in plan. The model reproduces the shear behavior in line with [34] and is adapted for seismic isolator bearings [35] according to the bi-linear relationships described by [21]. The parameters that have been considered to design the retrofitting intervention ware: the radius of curvature R, the stiffness values K1 and K2, and the friction coefficient μd along the two horizontal degrees of freedom (DOFs). Regarding the vertical DOF of the isolators, a linear behavior only in compression is adopted. The choice of the radius of curvature is related the isolation period of the structure [Equation (1)]. As also introduced in Section 2, the hysteretic behavior of FPS is represented by two stiffness values: the post-elastic one K2 that has been calculated according to the axial load on the device and the elastic stiffness K1 that has been assumed according to [21]. The software platform SAP 2000 [25] implements Equation (3) [22] for the variation of sliding friction coefficient μd as a function of the sliding velocity and time. An indicative value for the sliding friction coefficient has been evaluated considering an empiric relation [22] between μd and the ratio NSd/NEd, where NSd is the axial load acting on the FP device in the seismic combination of actions [2,36] and NEd represents the maximum axial load for the adopted bearing device as provided by the producer. The parameters herein assumed to reproduce the FP isolator behavior are the following: R = 1.5 m, μslow = 1%, μfats = 3%, α = 30 s/m. In this way, the isolated period is equal to 2.66 s. The stiffness of the devices has been calculated according to the vertical load acting on the isolators. The properties of the FP devices have been determined depending on the level of the axial load on the isolator within the code seismic combination [2]. In detail, the main seismic component along the X direction combined with the lower seismic component along the Y direction and vice versa have been considered. In addition, both the main and the lower components have been assumed characterized by an eccentricity in line with [2]. The worst results have been achieved considering the eccentricity in the seismic actions. In Table 2 and in Figure 5 the main properties of the FP devices and their planimetric location are reported. The NLN numerical models of the FB and BI structure are reported in Figure 6.

4.2. Evaluation of the Seismic Demand and Non-Linear Dynamic Analyses

The evaluation of the seismic demand in terms of elastic pseudo-acceleration Sa is performed considering the elastic design response spectrum related to 50 years reference period associated to nearly-collapse limit state according to [2] with reference to the seismic hazard site. The elastic response spectra have been defined adopting two different damping ratios as shown in Figure 7, in particular: ξ = 5% for the fixed-base (FB) NLN model and ξ= 2% as suggested by [17] for the base-isolated (BI) NLN model [17]. In general, the value of ξ = 5% is widely accepted for the dynamic analysis of FB RC structures [17]. With reference to the BI structure, the value of ξ is lower than the one related to the FB structure as the superstructure moves on the isolation level similarly to a rigid body. For instance, most of the energy in the BI structure is dissipated by hysteretic damping which is provided by the isolator devices. A value of ξ = 2% for BI RC structures is recognized according to common practice and literature references [3,17].
The seismic inputs adopted to perform the non-linear dynamic analyses are represented by 21 recorded accelerograms [17] (each of them includes 3 accelerometric recordings in the respective directions) selected from European Strong Motion Database (ESM) [37] (Table 3) and then scaled in all directions. The selection has been carried out with the aim to define a set composed of ground motions with different characteristics to represent both a record-to-record variability and event-to-event variability, as commented in [3,17]. The scaling factor has been defined in X direction with respect to the Intensity Measure (IM) related the elastic response spectrum in correspondence of the fundamental period of vibration T1 associated to 1st eigenmode for both FB and BI structures. This is in order to ensure the compatibility of the selected ground motion inputs with elastic design response spectra defined by the design code [2] for nearly-collapse limit state. Note that the scaling factor has been defined along the direction (i.e., X direction) able to cause the worst effects. The scaled response spectra associated to the 21 recorded accelerograms are reported in Figure 8 with reference to both the FB and BI structures.
The non-linear dynamic analyses have been performed adopting the direct integration of the motion equations [38,39] which regulate the dynamic behavior of the structure with its non-linearities:
[ M ] { d 2 u ( t ) d t 2 } + [ C ] { d u ( t ) d t } + [ K ] { u ( t ) } = { F ( t ) }
in which {d2u(t)/dt2}, {du(t)/dt}, {u(t)} are respectively the acceleration, velocity and displacement vector, having considered a multi-degree freedom (MDOF) system. While, [M], [C], [K] are the mass, proportional Rayleigh damping and stiffness matrix evaluated according to [3,17]. Finally, {F(t)} is the vector of external forces.
In Figure 9 the hysteretic loops of one of the FP bearing subjected to the scaled motion of the earthquake EQ5 is depicted showing how different phenomena occur during the non-linear hysteretic response of the FPS device. In detail, it is possible to observe the influence of the velocity-dependent behavior of the FPS device because when the displacement is peak the sliding friction coefficient gradually decreases from μfast to μslow. In addition, the floating shape of the curves is due to the vertical component of each ground motion.
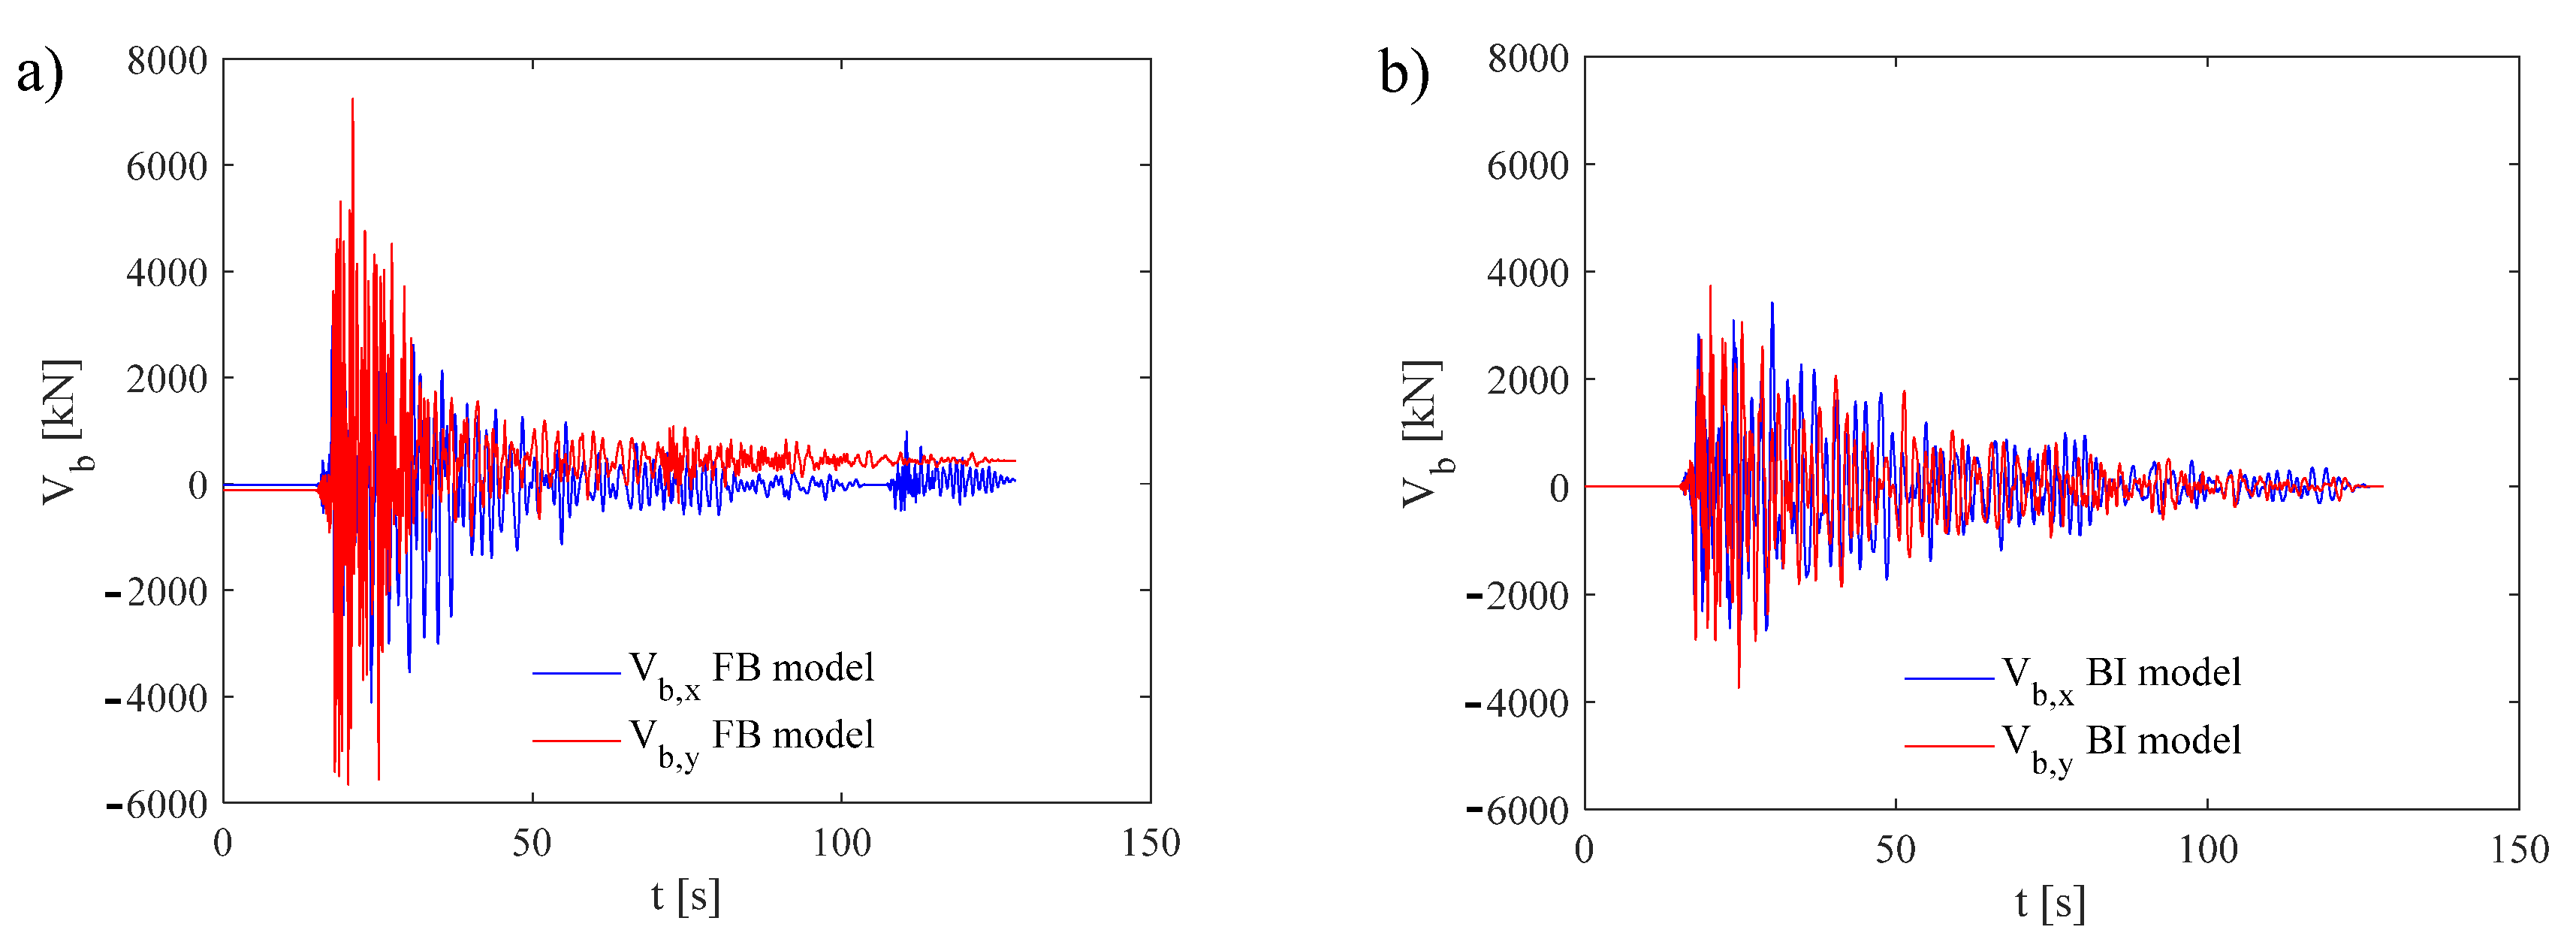
The force in the hysteresis loops fb has been evaluated according to Equation (3). The effectiveness of the seismic isolation retrofitting can be appreciated by the comparison between the base shear Vb from the FB numerical model to the one of the BI numerical model (Figure 10). Note that the base shear assessment for the FB numerical model derives from the restoring forces, whereas for the BI numerical model derives from the inertia forces.
The maximum values of the base shear are concentrated in the time interval in which there are the peak values of the accelerations. The dominant values of the base shear for both models are recognised in the transverse direction Y, namely Vb,y, due to the higher stiffness of the structure. The results highlight that the retrofitting intervention may avoid brittle shear failures with reference to frames characterized by high stiffness if compared to the others. Furthermore, Figure 10a highlights a small residual plastic deformation of the column of the FB model along Y direction. The shear verifications of each structural member has been performed according to [30] in order to confirm that shear failure does not occur during the non-linear dynamic analyses for the BI structure.
Starting from these values, the results of the time history analyses in terms of average interstory displacements dr have been determined for each floor of the structure and for both X and Y directions. By this way, the interstory drift index I D I have been calculated as:
I D I = d r / h
where h is the interstory height.
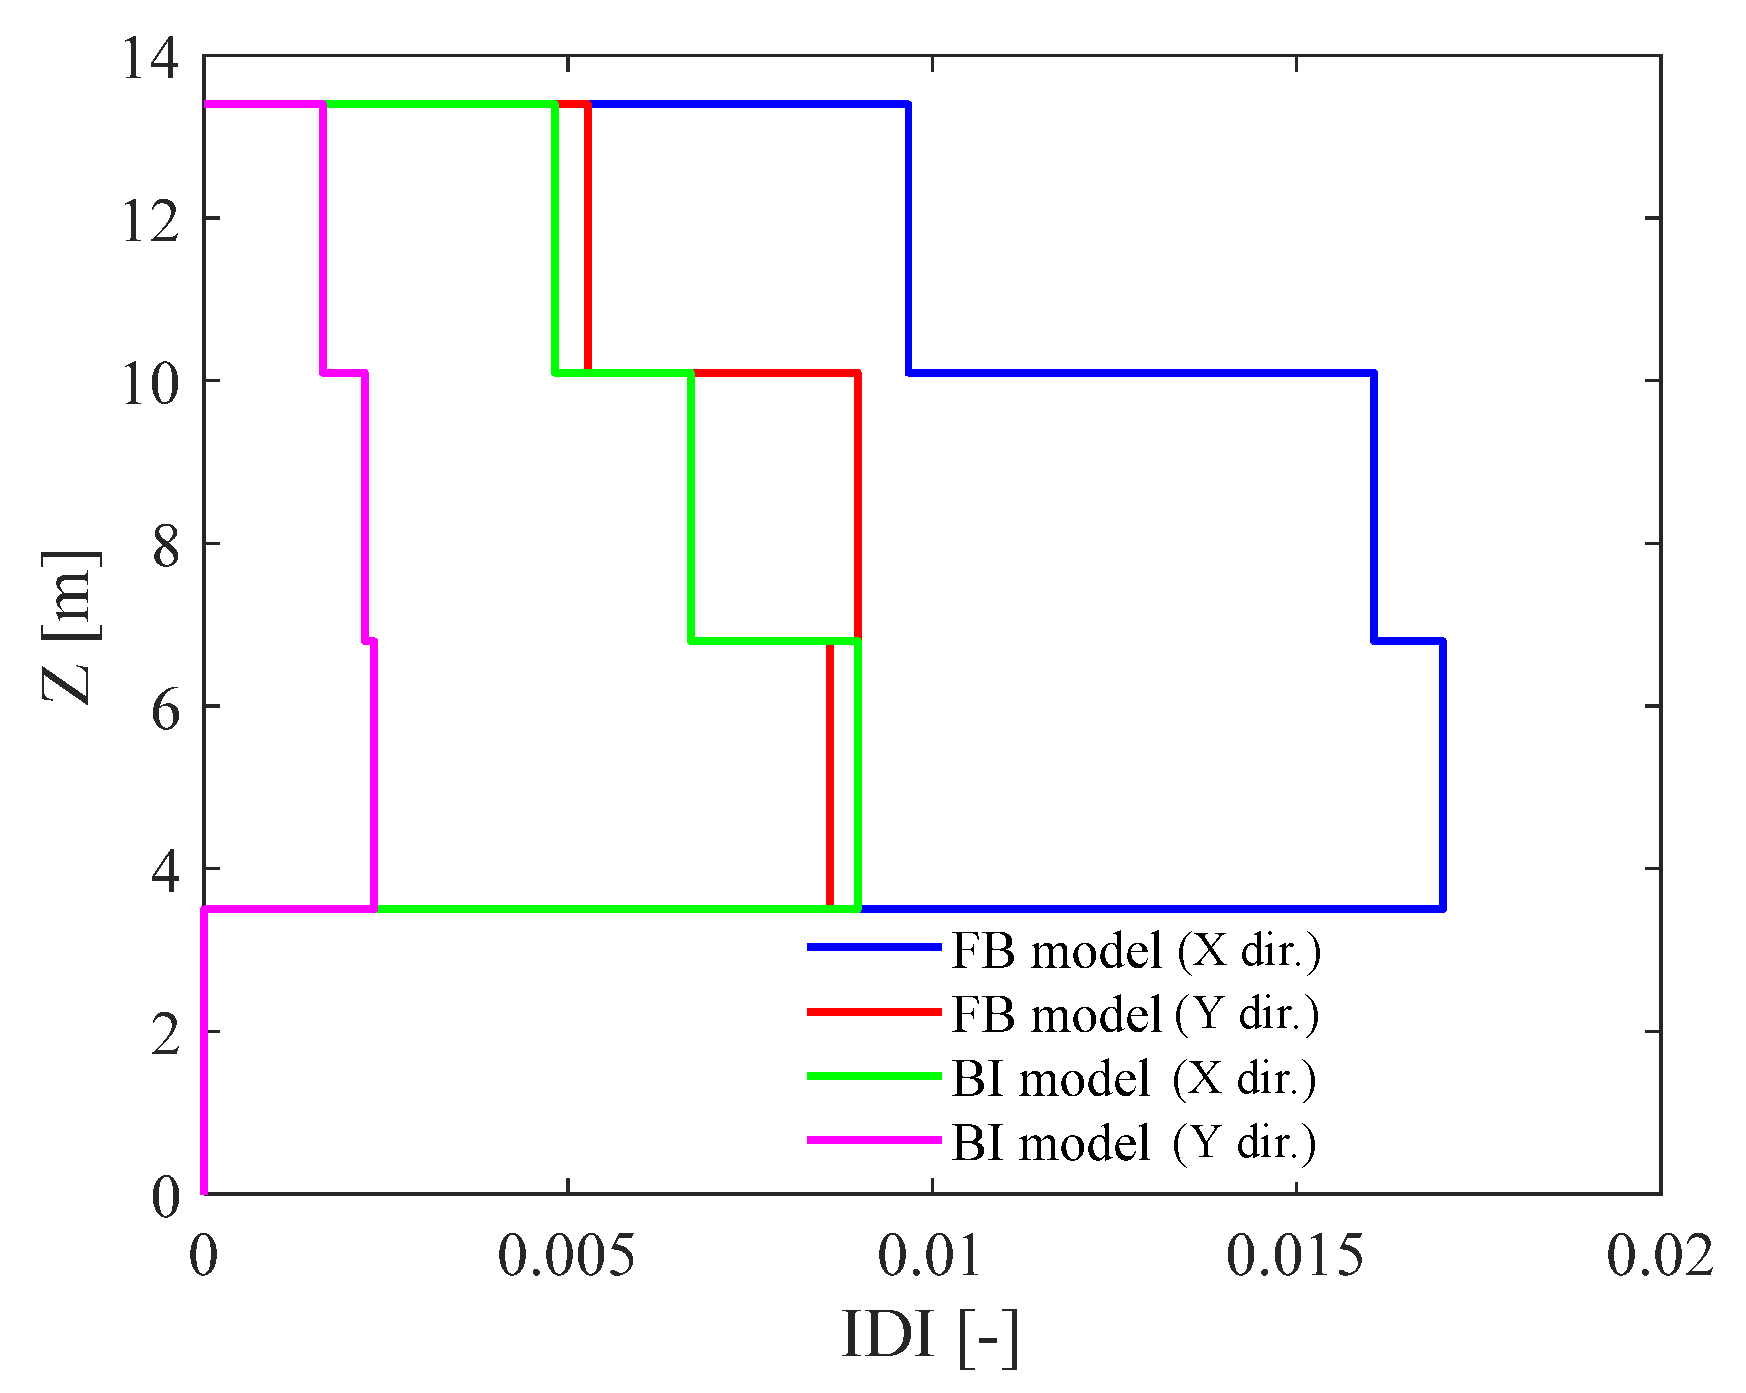
In Figure 11 the IDIs are plotted as a function of the elevation of the building for both the FB and BI models along both X and Y directions. In transverse Y direction the IDIs are smaller than in longitudinal X one because of the differences of the stiffness of the frames in Y and X directions.
The interstory drifts associated to both the ground-floor of the FB structure and to the sub-structure of the BI structure are zero because of the restraints which simulate the ground-structure interaction due to the presence of the soil embankment around the structure as explained in Section 4.1. In fact, the seismic response of the story 1 (Figure 3) is restrained due to the presence of the surrounding soil embankment and to the diaphragm constrains.
It can be recognized the drift reduction from FB model to BI model, due to the effectiveness of FP isolators adopted for the retrofitting intervention.

5. Probabilistic Interpretation of the Results

The results from the non-linear dynamic analyses in terms of interstory drift index IDI and horizontal relative displacement for the FP devices dFPS have been useful to perform the probabilistic evaluation of the performance of both FB structure and BI structure. The mentioned above parameters have been probabilistically modeled using a lognormal distribution [17], whose statistical parameters (mean value μ and standard deviation σ) are estimated from the numerical results of non-linear dynamic analyses through the maximum likelihood method [40,41]. The hypothesis of lognormal probabilistic model has been validated trough Chi-square statistical test with level of significance 5%. The monovariate probability density functions (PDFs) have been computed according to:
f ( I D I ) = 1 I D I σ ln ( I D I ) 2 π exp [ 1 2 ( ln ( I D I ) μ ln ( I D I ) σ ln ( I D I ) ) 2 ]
f ( d F P S ) = 1 d F P S σ ln ( d F P S ) 2 π exp [ 1 2 ( ln ( d F P S ) μ ln ( d F P S ) σ ln ( d F P S ) ) 2 ]
The probability of exceedance Pf of a given limit state (LS) has been calculated as follows:
P f = P ( I D I > I D I L S ) = 1 P ( I D I I D I L S )
where the probability P(IDI≤IDILS) can be directly estimated by the lognormal cumulative density functions (CDFs).
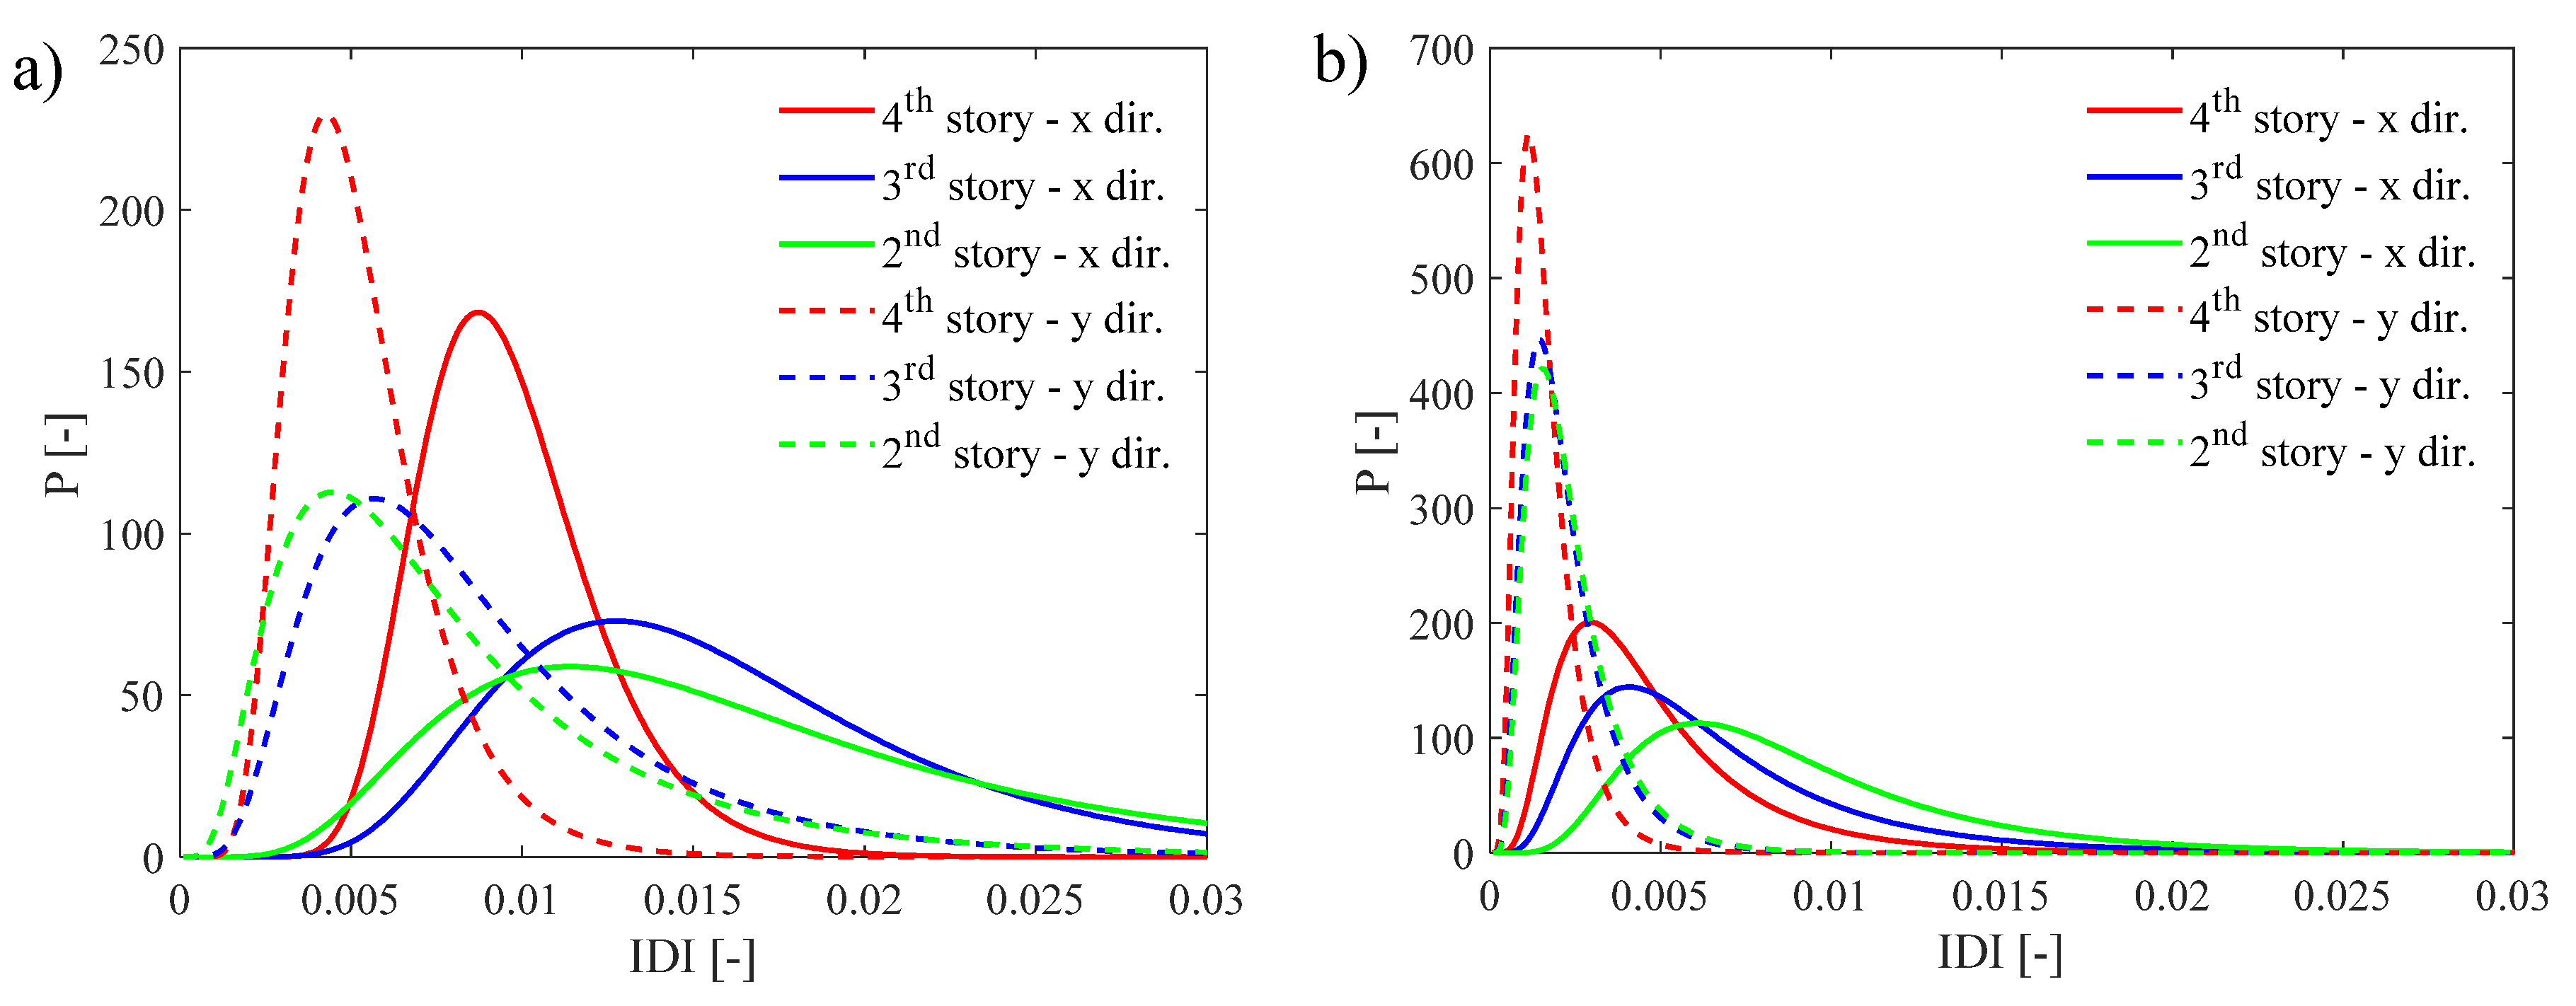
Figure 12a,b report the monovariate lognormal distributions (PDFs) associated to the IDIs of the different stories with reference to both the FB and BI structure, while Figure 13a,b report the related CDFs with the indication of a generic limit state threshold for evaluation of the associated probability of exceedance Pf.
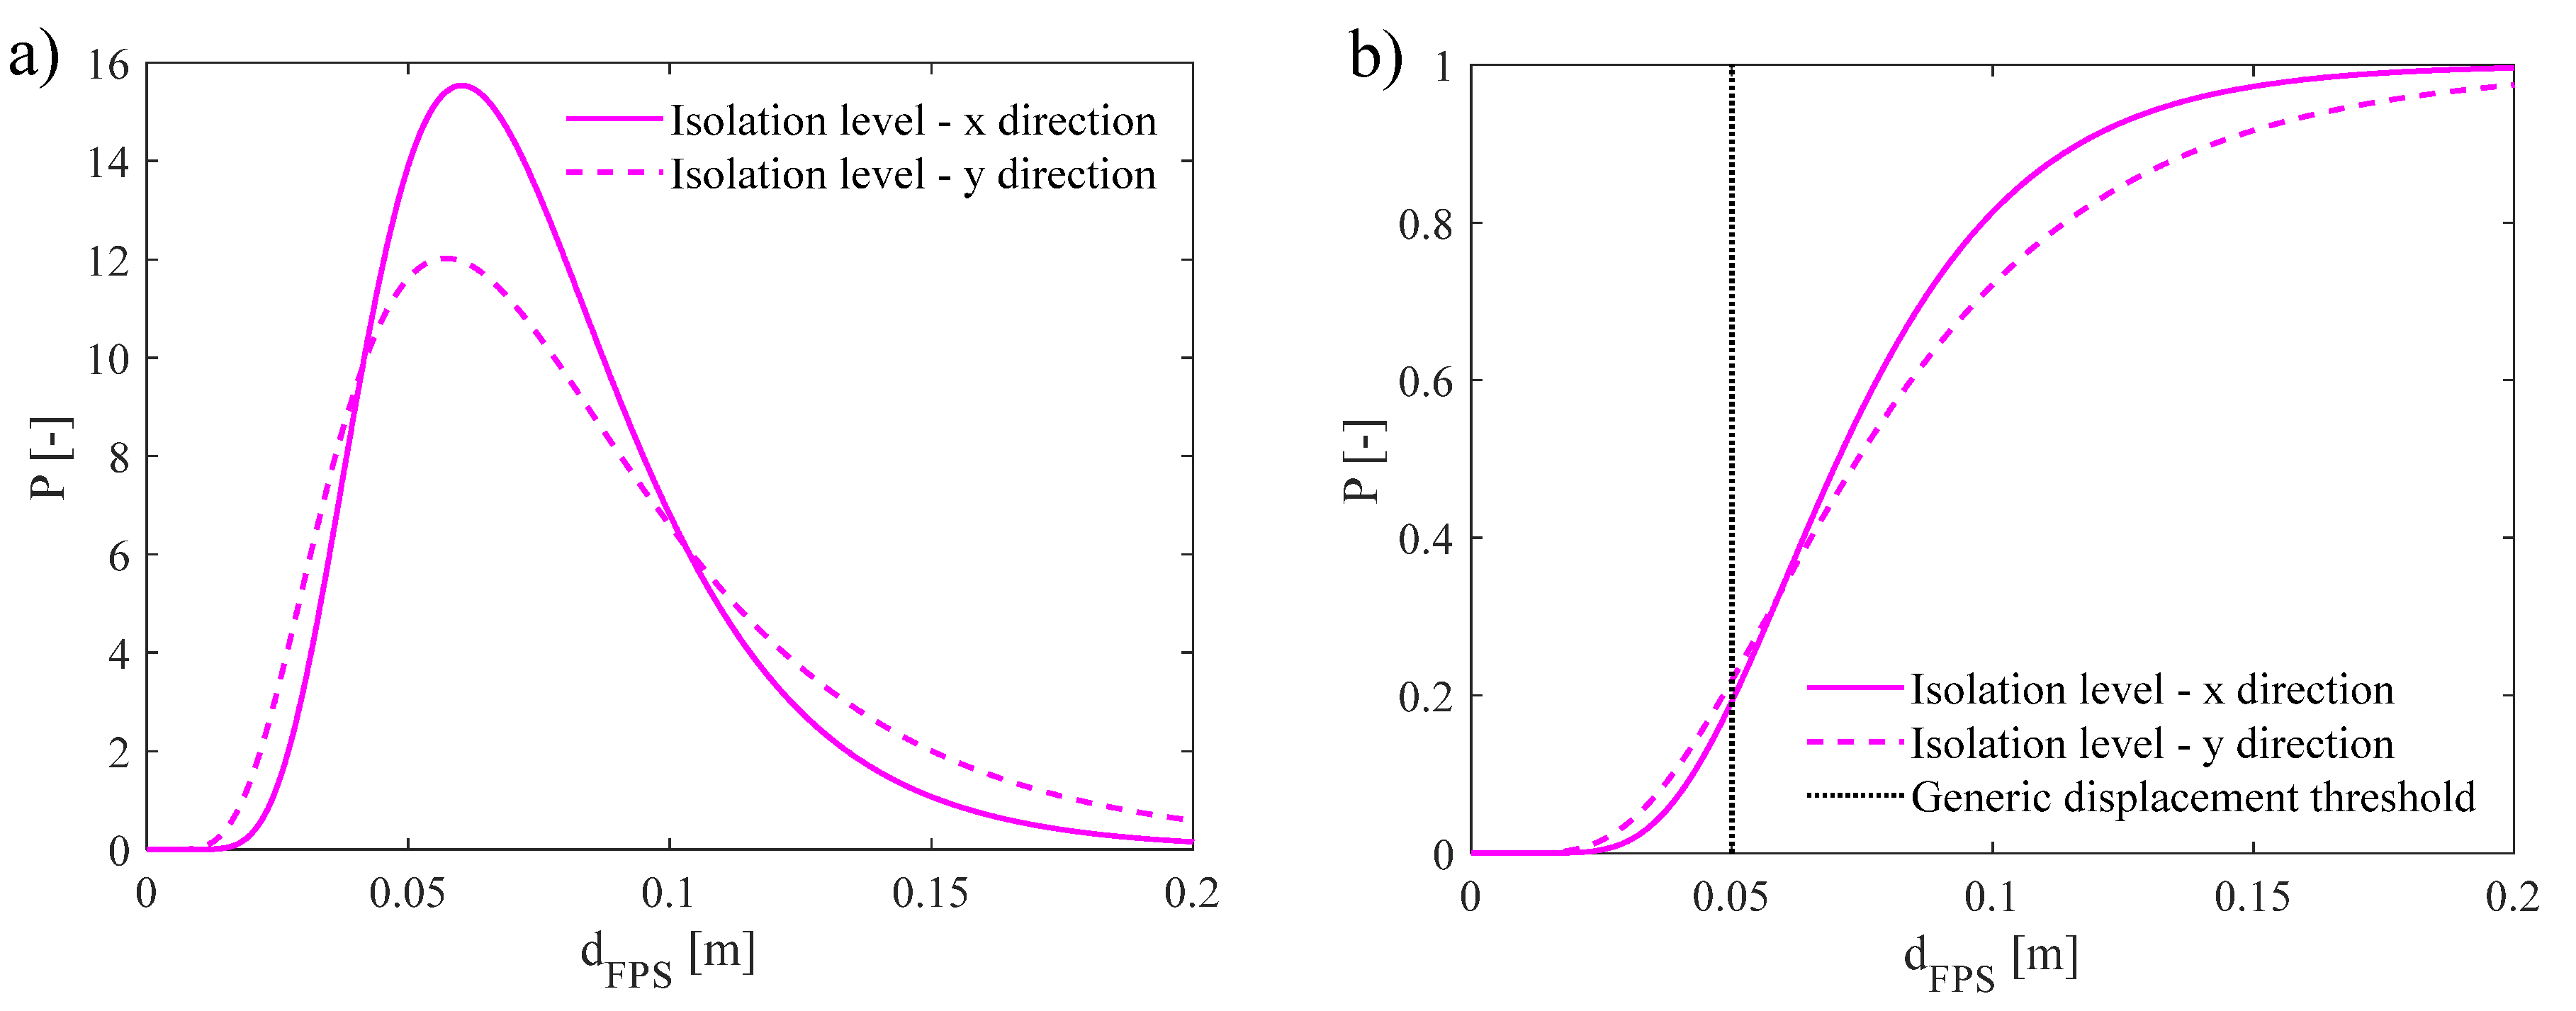
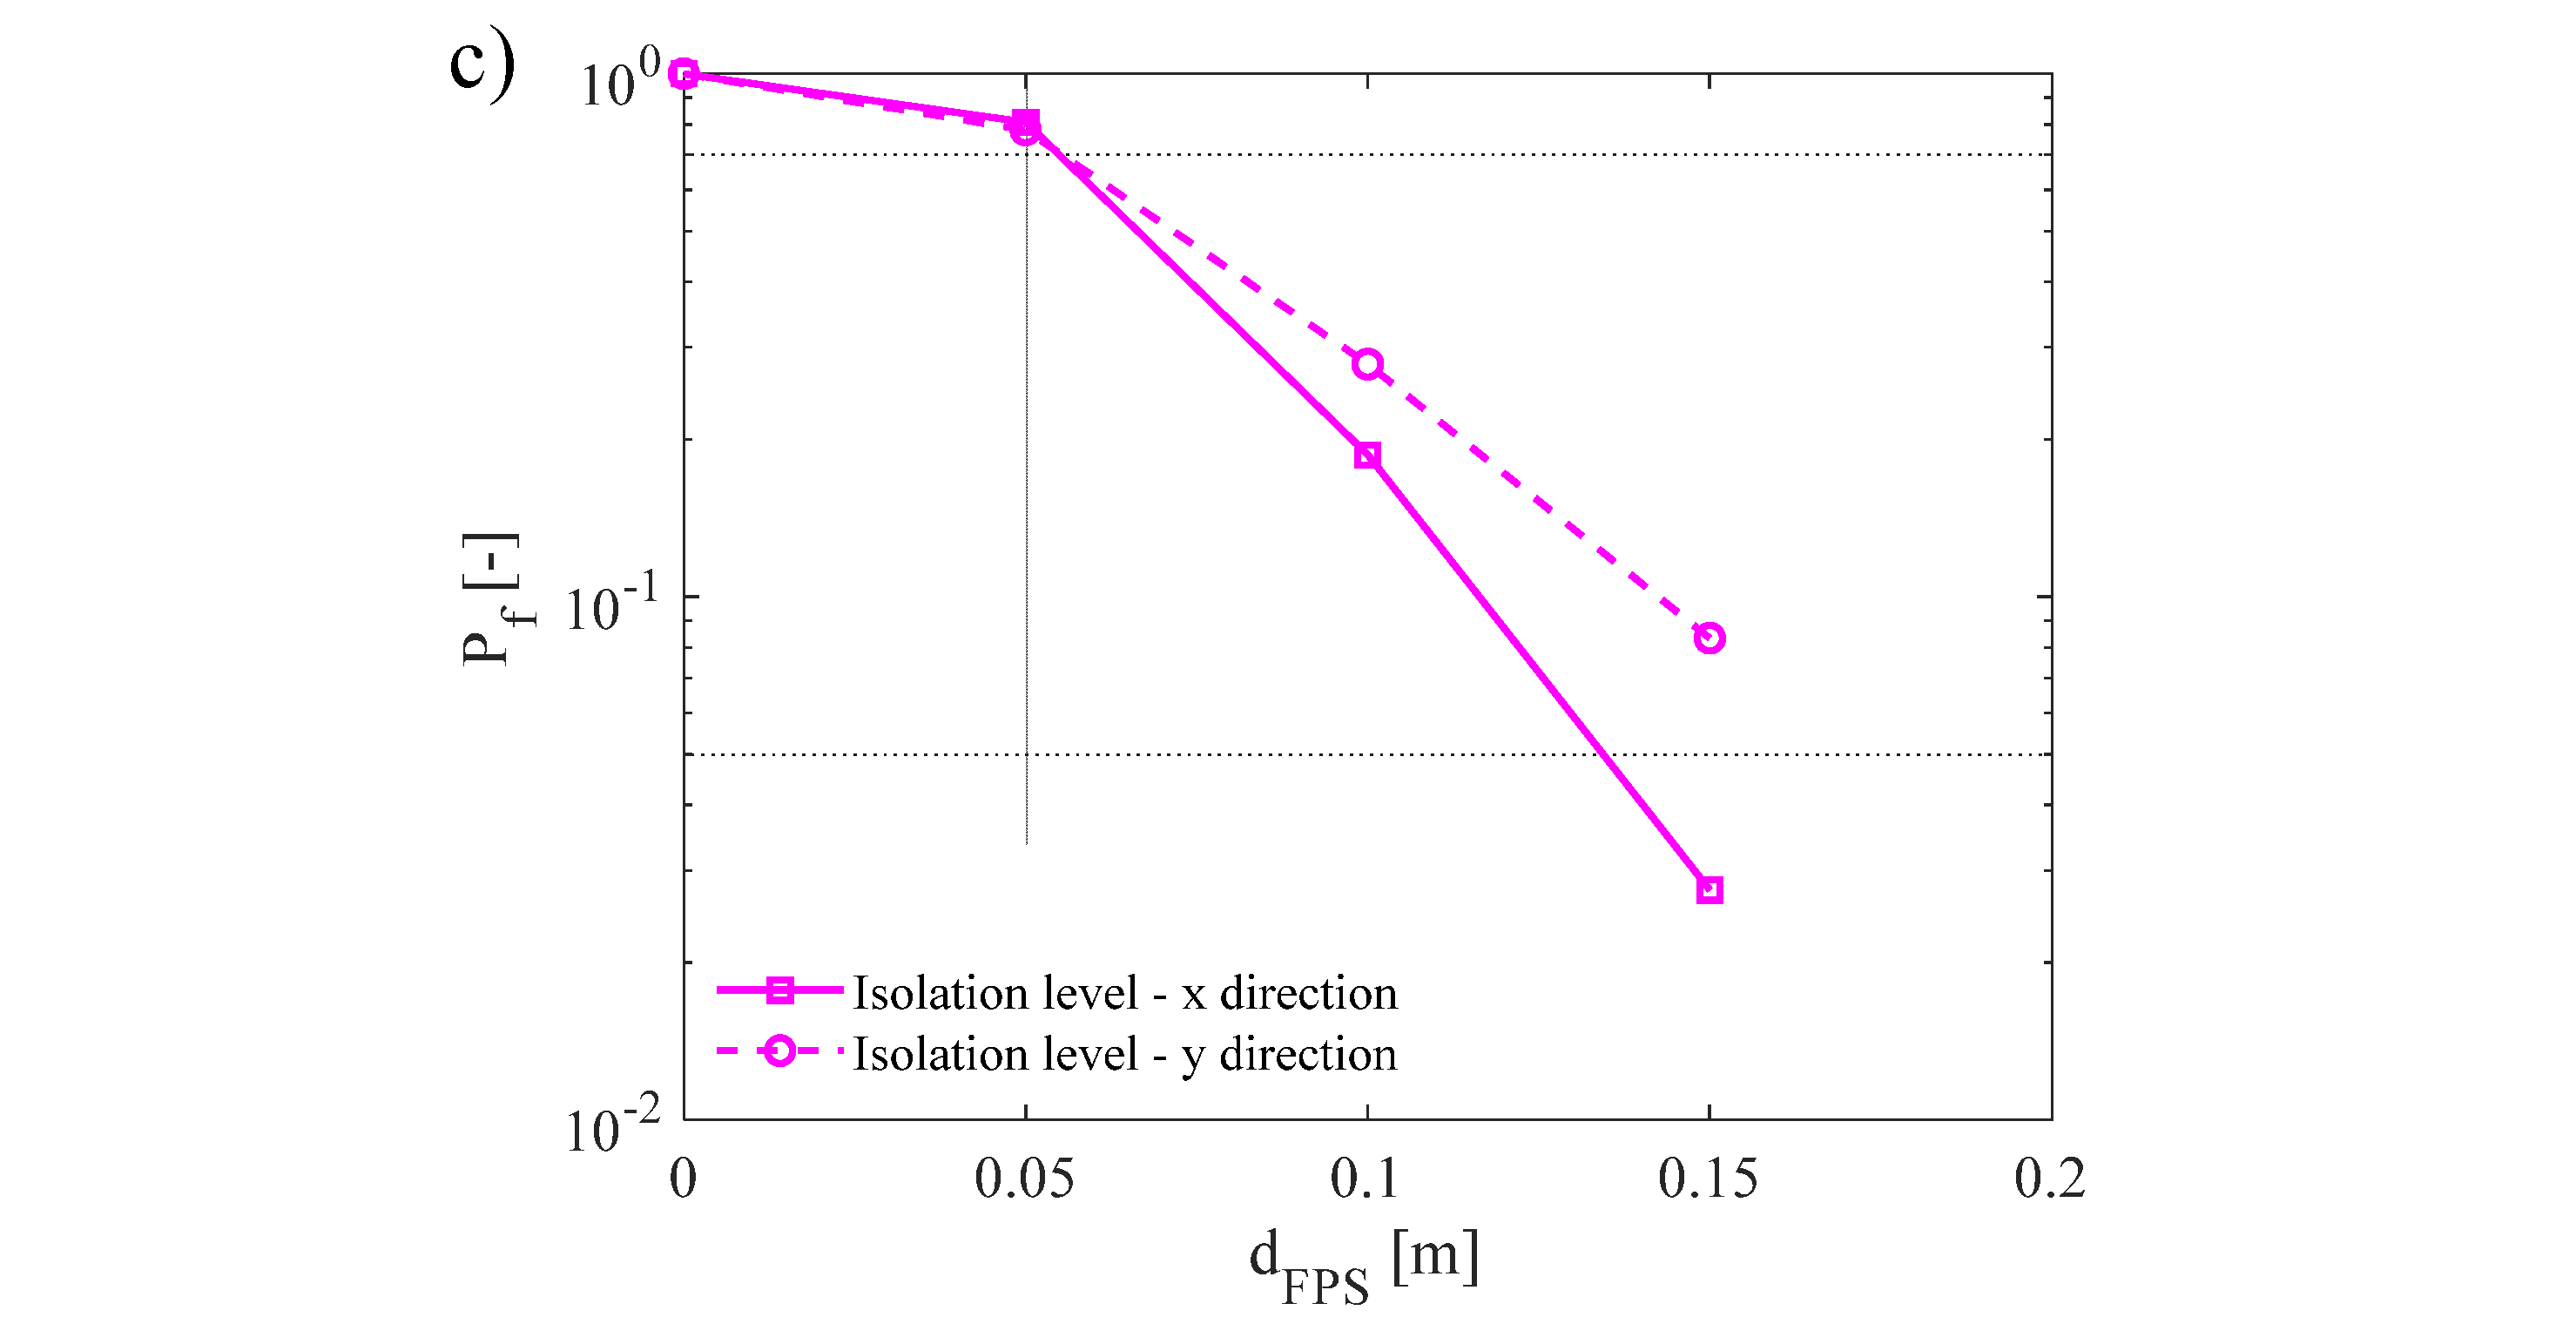
Concerning the BI structure, Figure 14a,b illustrate the monovariate lognormal distributions (PDFs) and the cumulative density functions (CDFs) related to the dFPS in both the X and Y directions. It can be recognized that the retrofitting intervention is able to reduce the probability of exceedance of pre-determined limit state threshold. Because the structure turns out to be stiffer in the Y direction, both IDIs and dFPS in that direction are significantly smaller if compared to the values in the X direction.
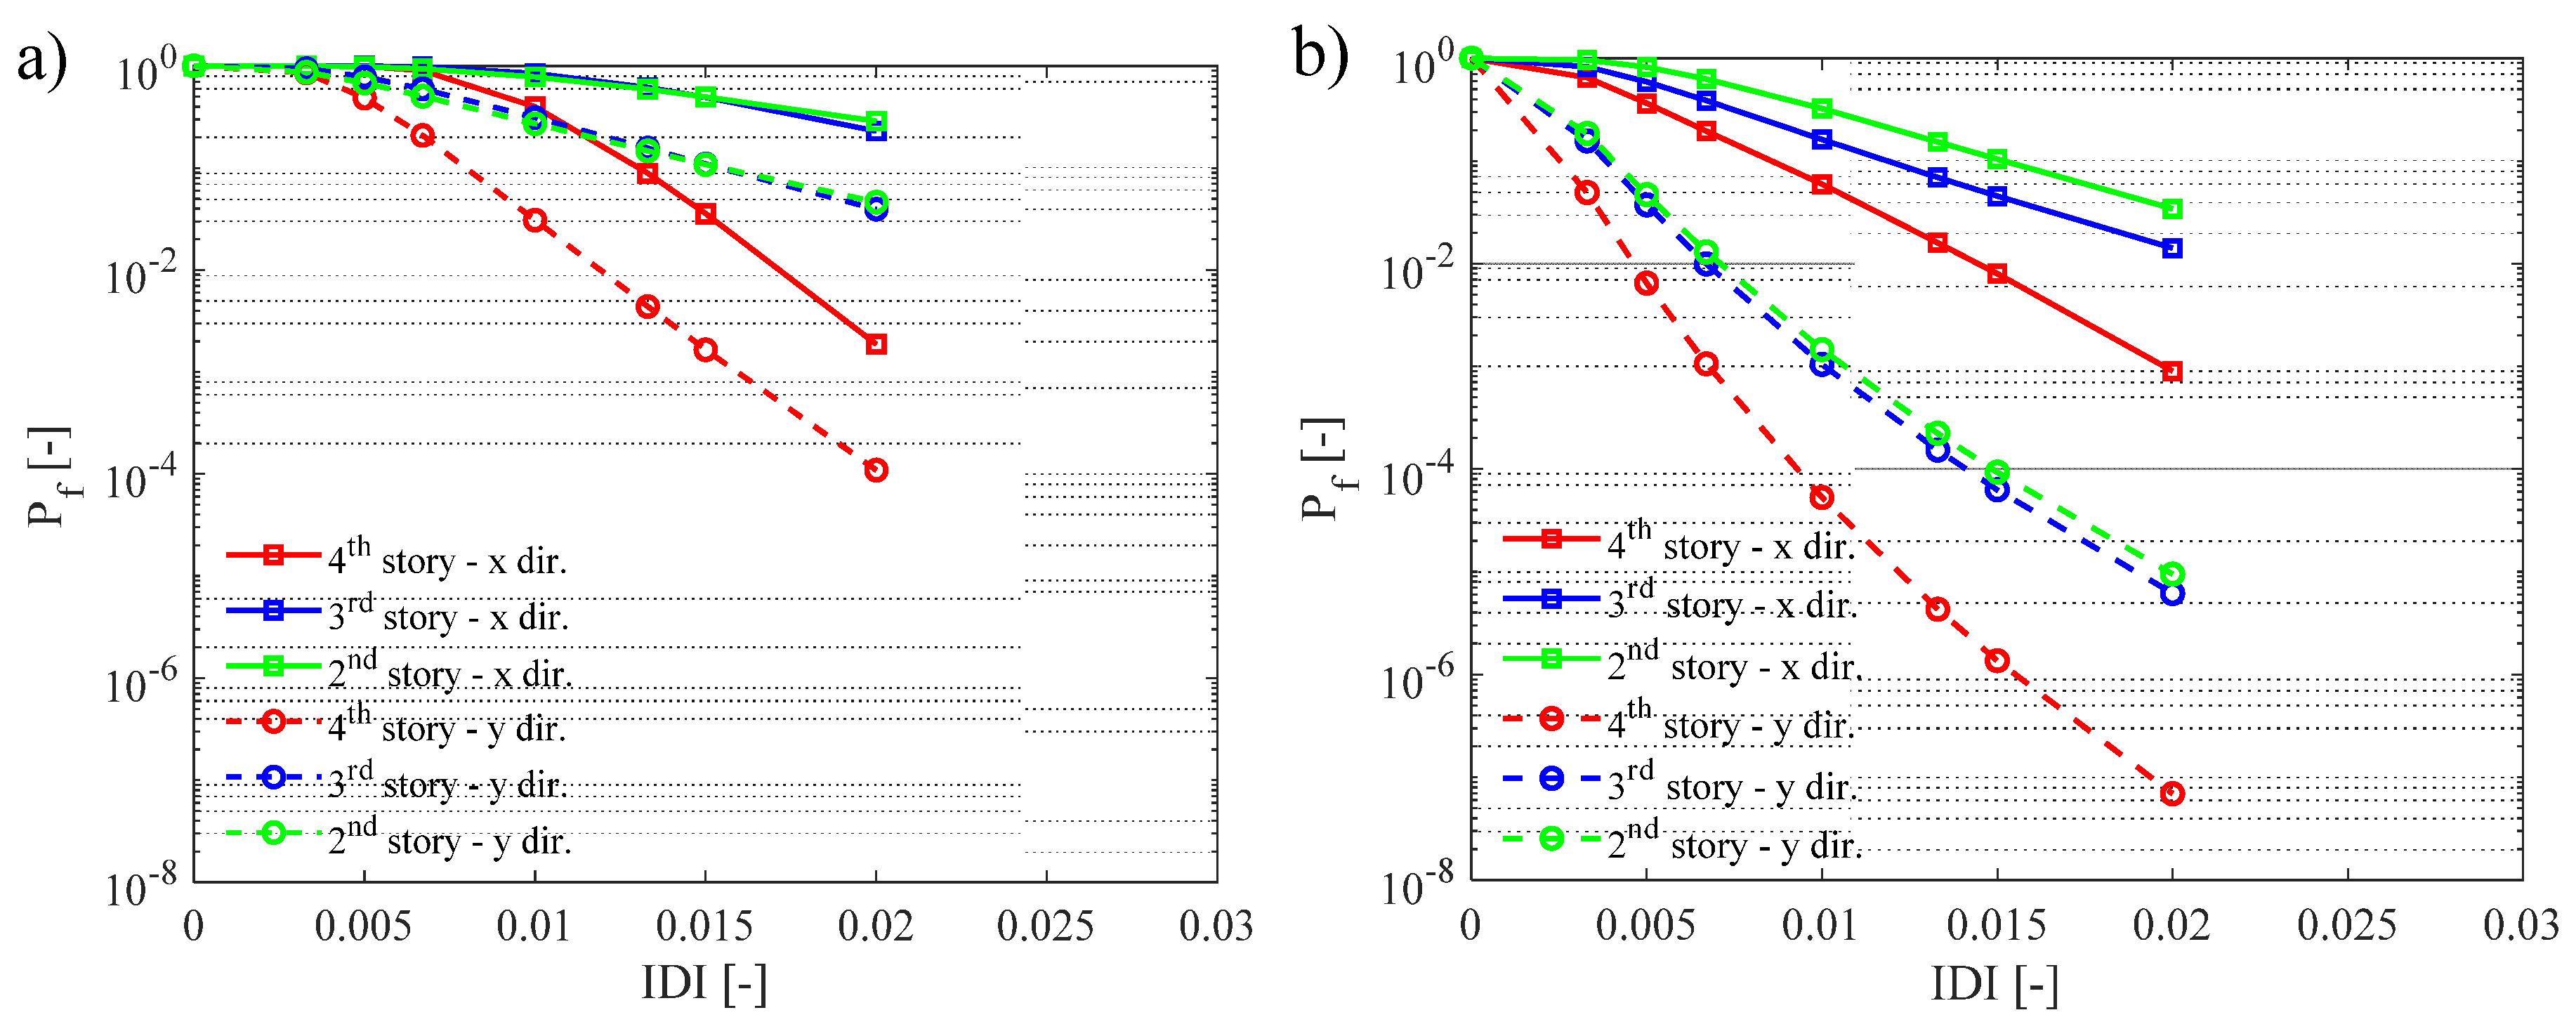
Adopting the probabilistic distributions so far described, it is possible to estimate the probability of exceedance Pf for different values of IDIs and dFPS. The results in terms of probability of exceedance Pf are reported in Figure 15a–c with reference to the different stories for the FB and BI structure and for the isolation level. The retrofitting intervention allows to reduce significantly the demand in terms of interstory drift leading to probability of exceedance Pf lower than 1 order of magnitude with respect to the FB structure for specific values of the IDIs. This aspect is fundamental for the safety [42] of the structural systems.
The descending trend of the exceeding probabilities plotted in Figure 15 is perfectly in line with the results described in [3,17]. In fact, higher values of the limit state thresholds are associated to lower and lower values of Pf in relation to both superstructure and isolation level. The analysis puts in evidence the importance to assess the seismic performance in probabilistic terms for each story and along the both directions for the both models (i.e., FB structure and BI structure). In fact, the results highlight the structural weakness along the X direction and higher values of the exceeding probabilities for lower floors due to also the vertical components of the records. These exceeding probabilities are strongly reduced in the configuration retrofitted through FPS showing a strong plastic reduction of the structural members [18]. As for the isolation level, the results demonstrate that also for the FPS devices the responses along the two orthogonal directions are different. Specifically, along the Y direction the seismic demand is higher due to more effective behavior of the seismic device able to reduce the seismic demand to the superstructure. In addition, the results confirm the effectiveness of the beams connecting the columns at the substructure (Section 4.1) able to improve the safety and robustness of the system as proposed in [3].

6. Conclusions

The present investigation aimed to evaluate the influence of the seismic retrofitting of an existing RC building using single-concave friction pendulum devices in probabilistic terms. First of all, an existing RC building has been characterized from a geometrical point of view and the related material properties have been assessed by means of the results from destructive and non-destructive tests. Then, non-linear numerical models of the structure have been defined using fiber cross-sections approach for the fixed base (FB) structure and the base isolated (BI) system including proper modelling of the response of the FP bearings under seismic actions. Non-linear dynamic analyses have been carried out accounting 21 recorded seismic events with the three components. The records have been scaled to the value of the pseudo-acceleration of the design elastic spectrum for nearly-collapse limit state associated to 50 years reference life in correspondence of the fundamental periods of both the FB and BI structures. The results of the non-linear dynamic analyses highlight the effectiveness of the retrofitting intervention in the reduction of the value of the base shear. In particular, as in existing RC buildings the amount of shear reinforcements is almost lower than minimum values required by current design codes, the latter results can avoid the occurrence of brittle shear failure in columns pertaining to stiffer RC frames. Next, the probabilistic interpretation of the results in terms of interstory drift index and displacement at the level of the isolation devices has been carried out adopting a lognormal probabilistic model. The probabilities of exceedance associated to different values of the mentioned above parameters have been evaluated highlighting a reduction of more than 1 order of magnitude between the FB structure and the structure retrofitted by means of single-concave FP devices. This aspect is fundamental for the safety of the structure.

Author Contributions

Conceptualization, P.C.; Data curation, D.G., C.A., M.F. and G.B.; Formal analysis, D.G., C.A., M.F., G.B. and L.G.; Investigation, D.G., C.A., M.F. and P.C.; Methodology, D.G., P.C., G.B. and L.G.; Project administration, P.C.; Supervision, P.C. and L.G.; Validation, L.G.; Visualization, C.A., G.B. and L.G.; Writing—original draft, D.G. and P.C. All authors have read and agreed to the published version of the manuscript.

Funding

This research received no external funding.

Acknowledgments

This work is a part of the collaborative activity developed by the authors within the framework of the Line 6—WP 2—Task 2.1—ReLUIS 2017.

Conflicts of Interest

The authors declare no conflict of interest.

References

  1. Gino, D.; Castaldo, P.; Bertagnoli, G.; Giordano, L.; Mancini, G. Partial Factor Bulletin 80: Assessment of an Existing Prestressed Concrete Bridge. Struct. Concr. 2020, 21, 15–31. [Google Scholar] [CrossRef]
  2. NTC18. Aggiornamento Delle Nuove Norme Tecniche per Le Costruzioni. DM 17.01.2018; Ministero delle Infrastrutture e dei Trasporti: Rome, Italy, 2018. (In Italian)
  3. Castaldo, P.; Mancini, G.; Palazzo, B. Seismic Reliability-based Robustness Assessment of Three-Dimensional Reinforced Concrete Systems Equipped with Single-Concave Sliding Devices. Eng. Struct. 2018, 163, 373–387. [Google Scholar] [CrossRef]
  4. Mishra, S.K.; Roy, B.K.; Chakraborty, S. Reliability-based-design-optimization of Base Isolated Buildings Considering Stochastic System Parameters Subjected to Random Earthquakes. Int. J. Mech. Sci. 2013, 75, 123–133. [Google Scholar] [CrossRef]
  5. Zou, X.K.; Wang, Q.; Li, G.; Chan, C.M. Integrated Reliability-Based Seismic Drift Design Optimization of Base-Isolated Concrete Buildings. J. Struct. Eng. 2010, 136, 1282–1295. [Google Scholar] [CrossRef]
  6. Christopoulos, C.; Filiatrault, A. Principles of Passive Supplemental Damping and Seismic Isolation; IUSS Press: Pavia, Italy, 2006. [Google Scholar]
  7. Szczepański, M.; Migda, W.; Jankowski, R. Experimental Study on Dynamics of Wooden House Wall Panels with Different Thermal Isolation. Appl. Sci. 2019, 9, 4387. [Google Scholar] [CrossRef] [Green Version]
  8. Migda, W.; Szczepański, M.; Jankowski, R. Increasing the Seismic Resistance of Wood-frame Buildings by Applying PU Foam as Thermal Insulation. Period. Polytech. Civil. Eng. 2019, 63, 480–488. [Google Scholar] [CrossRef] [Green Version]
  9. Massive Earthquake Simulation Could Lead to Stronger, Safer Wooden Buildings. 2009. Available online: https://phys.org/news/2009-07-massive-earthquake-simulationstronger-safer.html (accessed on 11 December 2020).
  10. Szczepański, M.; Migda, W.; Jankowski, R. Modal Analysis of Real Timber Frame Houses with Different Insulation Materials. Adv. Sci. Technol. Res. 2016, 10, 215–221. [Google Scholar] [CrossRef] [Green Version]
  11. Su, L.; Ahmadi, G.; Tadjbakhsh, I.G. Comparative Study of Base Isolation Systems. J. Eng. Mech. 1989, 115, 1976–1992. [Google Scholar] [CrossRef]
  12. Zayas, V.A.; Low, S.S.; Mahin, S.A. A Simple Pendulum Technique for Achieving Seismic Isolation. Earthq. Spectra. 1990, 6, 317–333. [Google Scholar] [CrossRef]
  13. Mokha, A.; Constantinou, M.C.; Reinhorn, A.M. Teflon Bearings in Base Isolation I: Test. J. Struct. Eng. 1990, 116, 438–454. [Google Scholar] [CrossRef]
  14. Chen, J.; Liu, W.; Peng, Y.; Li, J. Stochastic Seismic Response and Reliability Analysis of Base-Isolated Structures. J. Earthq Eng. 2007, 11, 903–924. [Google Scholar] [CrossRef]
  15. Su, L.; Ahmadi, G. Response of Frictional Base Isolation Systems to Horizontal–Vertical Random Earthquake Excitations. Prob. Eng. Mech. 1988, 3, 12–21. [Google Scholar] [CrossRef]
  16. Briseghella, B.; Zordan, T.; Liu, T.; Mazzarolo, E. Friction Pendulum System as a Retrofit Technique for Existing Reinforced Concrete Building. Struct. Eng. Int. 2013, 23, 219–224. [Google Scholar] [CrossRef]
  17. Castaldo, P.; Palazzo, B.; Della Vecchia, P. Seismic Reliability of Base-isolated Structures with Friction Pendulum Bearings. Eng. Struct. 2015, 95, 80–93. [Google Scholar] [CrossRef]
  18. Castaldo, P.; Alfano, G. Seismic Reliability-based Design of Hardening and Softening Structures Isolated by Double Concave Sliding Devices. Soil Dyn. Earthq. Eng. 2020, 129, 105930. [Google Scholar] [CrossRef]
  19. Castaldo, P.; Amendola, G.; Palazzo, B. Seismic Fragility and Reliability of Structures Isolated by Friction Pendulum Devices: Seismic Reliability-based Design (SRBD). Earthq. Eng. Struct. Dyn. 2017, 46, 425–446. [Google Scholar] [CrossRef]
  20. Castaldo, P.; Ripani, M.; Priore, R.L. Influence of Soil Conditions on the Optimal Sliding Friction Coefficient for Isolated Bridges. Soil Dyn. Earthq. Eng. 2018, 111, 131–148. [Google Scholar] [CrossRef]
  21. Naeim, F.; Kelly, J.M. Design of Seismic Isolated Structures: From Theory to Practice; John Wiley Sons Inc.: Hoboken, NJ, USA, 1999. [Google Scholar]
  22. Constantinou, M.C.; Mokha, A.; Reinhorn, A.M. Teflon Bearings in Base Isolation II: Modeling. J. Struct. Eng. 1990, 116, 455–474. [Google Scholar] [CrossRef]
  23. Constantinou, M.C.; Whittaker, A.S.; Kalpakidis, Y.; Fenz, D.M.; Warn, G.P. Performance of Seismic Isolation Hardware under Service and Seismic Loading; Multidisciplinary Center for Earthquake Engineering Research: Buffalo, NY, USA, 2007. [Google Scholar]
  24. FIP Industriale. Available online: https://www.fipindustriale.it (accessed on 1 July 2020).
  25. SAP 2000. CSI Analysis Reference Manual: For SAP 2000, Etabs, Safe and CSI Bridge; SAP 2000, 2018 Computers & Structures, Inc.: Berkeley, California, USA, 2000. [Google Scholar]
  26. Castaldo, P.; Gino, D.; Bertagnoli, G.; Mancini, G. Resistance Model Uncertainty in Non-linear Finite Element Analyses of Cyclically Loaded Reinforced Concrete Systems. Eng. Struct. 2020, 211, 110496. [Google Scholar] [CrossRef]
  27. Castaldo, P.; Gino, D.; Mancini, G. Safety Formats for Non-linear Analysis of Reinforced Concrete Structures: Discussion, Comparison and Proposals. Eng. Struct. 2018, 193, 136–153. [Google Scholar] [CrossRef]
  28. Castaldo, P.; Tubaldi, E.; Selvi, F.; Gioiella, L. Seismic Performance of an Existing RC Structure Retrofitted with Buckling Restrained Braces. J. Build. Eng. 2021, 33, 101688. [Google Scholar] [CrossRef]
  29. Mander, J.B.; Priestly, M.J.N.; Park, R. Theoretical Stress-strain Model for Confined Concrete. J. Struct. Eng. 1988, 114, 1804–1826. [Google Scholar] [CrossRef] [Green Version]
  30. CEN. EN 1992-1-1: Eurocode 2–Design of Concrete Structures. Part 1-1: General Rules and Rules for Buildings; Normative; CEN: Brussels, Belgium, 2014. [Google Scholar]
  31. Saatcioglu, M.; Razvi, S.R. Strength and Ductility of Confined Concrete. J. Struct. Eng. 1992, 118, 1590–1607. [Google Scholar] [CrossRef]
  32. McKenna, F.; Fenves, G.L.; Scott, M.H. Open System for Earthquake Engineering Simulation; University of California Berkeley: Berkeley, CA, USA, 2000. [Google Scholar]
  33. Priestley, M.J.N.; Park, R. Strength and Ductility of Concrete Bridge Columns under Seismic Loading. ACI Struct. J. 1987, 84, 61–76. [Google Scholar]
  34. Park, Y.J.; Wen, Y.K.; Ang, A.H.S. Random Vibration of Hysteretic Systems under Bidirectional Ground Motions. Earthq. Eng. Struct. Dyn. 1986, 14, 543–557. [Google Scholar] [CrossRef]
  35. Nagarajaiah, S.; Reinhorn, A.M.; Constantinou, M.C. 3D-Basis: Non Linear Dynamic Analysis of Three-dimensional Base Isolated Structures: Part II. In Tech. Rep. NCEER-91-0005; 1991. Available online: https://nehrpsearch.nist.gov/static/files/NSF/PB90161936.pdf (accessed on 5 July 2020).
  36. EN 1990: Eurocode—Basis of Structural Design; CEN: Brussels, Belgium, 2013.
  37. European Strong Motion Database (ESM). Available online: http://www.isesd.hi.is (accessed on 5 July 2020).
  38. Hilber, H.M.; Hughes, T.J.R.; Taylor, R.L. Improved Numerical Dissipation for Time Integration Algorithms in Structural Dynamics. Earthq. Eng. Struct. Dyn. 1977, 5, 283–292. [Google Scholar] [CrossRef] [Green Version]
  39. Cheng, F.Y. Matrix Analysis of Structural Dynamics: Applications and Earthquake Engineering; CRC Press: Boca Raton, FL, USA, 2001. [Google Scholar]
  40. Troisi, R.; Alfano, G. Firms’ Crimes and Land Use in Italy. An Exploratory Data Analysis. Presented at the New Metropolitan Perspectives, International Symposium—4th edition, Reggio Calabria, Italy, 27–30 May 2020. [Google Scholar]
  41. Faber, M.H. Statistics and Probability Theory; Springer: Berlin, Heidelberg, Germany, 2012. [Google Scholar]
  42. Troisi, R.; Alfano, G. Towns as Safety Organizational Fields: An Institutional Framework in Times of Emergency. Sustainability 2019, 11, 7025. [Google Scholar] [CrossRef] [Green Version]
Figure 1. Non-linear hysteretic response of the single-concave friction pendulum device.
Applsci 10 08980 g001
Figure 2. Scheme with main dimensions of the building in plant and identification of the main RC frames in X (X1, X2) and Y (Y1, Y2, Y3) directions. Dimensions reported in [cm].
Applsci 10 08980 g002
Figure 3. Cross sections of beams and columns pertaining to the main RC frames in X and Y directions. Dimensions reported in [cm]. (a)Frames X1. (b) Frame Y1. (c) Frame X2. (d) Frame Y2. (e) Frame Y3.
Applsci 10 08980 g003aApplsci 10 08980 g003b
Figure 4. Identification and location of the different beams and columns typologies according to Table 1. (a) Stories 1-4. (b) Story 5 (Roof).
Applsci 10 08980 g004
Figure 5. Location of the adopted FP devices in plan.
Applsci 10 08980 g005
Figure 6. Non-linear numerical models for FB (a) and BI (b) structure using SAP 2000 [25].
Applsci 10 08980 g006
Figure 7. Elastic design response spectra according to nearly-collapse limit state [2] with two different damping ratios.
Applsci 10 08980 g007
Figure 8. Scaled acceleration spectra for FB (a,b) and BI (c,d) structure of the 21 real ground motion records in X direction (a,c); Y direction (b,d).
Applsci 10 08980 g008
Figure 9. Hysteresis loops of the FP bearing under the motion of the EQ5 after scaling process.
Applsci 10 08980 g009
Figure 10. Base shear comparison along the two directions: FB model (a), BI model (b).
Applsci 10 08980 g010
Figure 11. Comparison between the IDIs.
Applsci 10 08980 g011
Figure 12. Lognormal monovariate PDFs for the IDIs in X and Y direction: FB model (a), BI model (b).
Applsci 10 08980 g012
Figure 13. Lognormal monovariate CDFs for the IDIs in X and Y direction: FB model (a), BI model (b).
Applsci 10 08980 g013
Figure 14. Lognormal monovariate PDFs and CDFs for horizontal relative displacement of FP device in X and Y direction with reference to the isolation level. (a) PDFs. (b) CDFs.
Applsci 10 08980 g014
Figure 15. Exceeding monovariate probabilities (logarithmic scale): FB model (a); BI model (b); Isolation level for BI model (c).
Applsci 10 08980 g015aApplsci 10 08980 g015b
Table 1. Details of the reinforcements for the different structural members.
Structural MemberLongitudinal ReinforcementShear ReinforcementLongitudinal ReinforcementShear Reinforcement
Story12
Column type 12𝜙20 + 5𝜙16/2𝜙20 + 5𝜙16𝜙6/8 mm (2 leg stirrups)2𝜙20 + 5𝜙16/2𝜙20 + 5𝜙16𝜙6/8 mm (2 leg stirrups)
Column type 2
Column type 32𝜙20 + 5𝜙14/2𝜙20 + 5𝜙14𝜙6/12 mm (2 leg stirrups)2𝜙20 + 5𝜙14/2𝜙20 + 5𝜙14𝜙6/12 mm (2 leg stirrups)
Beam type 1Midspan:
Top 2𝜙14
Bottom 5𝜙16
𝜙6/19 mm (2 leg stirrups)Midspan:
Top 2𝜙14
Bottom 5𝜙16
𝜙6/19 mm (2 legs stirrups)
Support:
Top 2𝜙14 + 5𝜙20
Bottom 2𝜙16
𝜙6/10 mm (2 leg stirrups)Support:
Top 2𝜙14 + 5𝜙20
Bottom 2𝜙16
𝜙6/10 mm (2 leg stirrups)
Beam type 2Midspan
Top 2𝜙12
Bottom 5𝜙14
𝜙6/19 mm (2 leg stirrups)Midspan
Top 2𝜙12
Bottom 5𝜙14
𝜙6/19 mm (2 leg stirrups)
Support
Top 2𝜙14 + 5𝜙20
Bottom 3𝜙16
𝜙6/10 mm (2 leg stirrups)Support
Top 2𝜙14 + 5𝜙20
Bottom 3𝜙16
𝜙6/10 mm (2 leg stirrups)
Beam type 3Top 2𝜙10 + 2𝜙12
Bottom 2𝜙10 + 2𝜙12
𝜙6/30 mm (2 leg stirrups)Top 4𝜙10
Bottom 2𝜙10 + 2𝜙12
𝜙6/30 mm (2 leg stirrups)
Beam type 4Top 4𝜙10
Bottom 4𝜙10
𝜙6/30 mm (2 leg stirrups)Top 4𝜙10
Bottom 4𝜙10
𝜙6/30 mm (2 leg stirrups)
Beam type 5Top 4𝜙14
Bottom 4𝜙14
𝜙6/10 mm (2 leg stirrups)Top 4𝜙14
Bottom 4𝜙14
𝜙6/10 mm (2 leg stirrups)
Story34
Column type 12𝜙20 + 5𝜙14/2𝜙20 + 5𝜙14𝜙6/10 mm (2 leg stirrups)2𝜙20 + 5𝜙14/2𝜙20 + 5𝜙14𝜙6/12 mm (2 leg stirrups)
Column type 2
Column type 3𝜙6/12 mm (2 leg stirrups)
Beam type 1Midspan:
Top 2𝜙14
Bottom 5𝜙16
𝜙6/19 mm (2 leg stirrups)Midspan:
Top 2𝜙14
Bottom 5𝜙16
𝜙6/19 mm (2 leg stirrups)
Support:
Top 2𝜙14 + 5𝜙20
Bottom 2𝜙16
𝜙6/10 mm (2 legs stirrups)Support:
Top 2𝜙14 + 5𝜙20
Bottom 2𝜙16
𝜙6/10 mm (2 legs stirrups)
Beam type 2Midspan
Top 2𝜙12
Bottom 5𝜙14
𝜙6/19 mm (2 legs stirrups)Midspan
Top 2𝜙12
Bottom 5𝜙14
𝜙6/19 mm (2 legs stirrups)
Support
Top 2𝜙14 + 5𝜙20
Bottom 3𝜙16
𝜙6/10 mm (2 legs stirrups)Support
Top 2𝜙14 + 5𝜙20
Bottom 3𝜙16
𝜙6/10 mm (2 legs stirrups)
Beam type 3Top 3𝜙10
Bottom 2𝜙10 + 1𝜙12
𝜙6/30 mm (2 legs stirrups)Top 4𝜙10 + 2𝜙12
Bottom 2𝜙10
𝜙6/30 mm (2 legs stirrups)
Beam type 4Top 4𝜙10
Bottom 4𝜙10
𝜙6/30 mm (2 legs stirrups)Top 4𝜙10
Bottom 4𝜙10
𝜙6/30 mm (2 legs stirrups)
Beam type 5Top 4𝜙14
Bottom 4𝜙14
𝜙6/10 mm (2 legs stirrups)Top 4𝜙10 + 1𝜙12
Bottom 2𝜙10 + 1𝜙12
𝜙6/10 mm (2 legs stirrups)
Story5 (Roof)
Beam type 6Top 2𝜙16 + 5𝜙20
Bottom 3𝜙16 + 2𝜙14
𝜙6/10 mm (2 legs stirrups)
Beam type 7Top 4𝜙10
Bottom 2𝜙12 + 2𝜙10
𝜙6/10 mm (2 legs stirrups)
Table 2. Types of FP devices and related characteristics.
FPS
Type 1Type 2Type 3Type 4Type 5Type 6Type 7Type 8Type 9
R [m]1.51.51.51.51.51.51.51.51.5
K2 [kN/m]355442471293413400431335382
K1 [kN/m]18,08022,51723,99614,95721,03820,38121,95817,09319,460
Table 3. Selected ground motion records from European Strong Motion Database [37]: D denotes the epicentral distance of the event in and M the related magnitude.
Earthquake EventDateM [-]Fault MechanismD [km]
EQ1—Bingol05/01/20036.3Strike-slip11.79
EQ2—Christchurch06/13/20116Reverse5.1
EQ3—Darfield09/03/20107.1Strike-slip13.31
EQ4—E Off Izu Peninsula05/03/19985.5Reverse9.5
EQ5—EMILIA_Pianura_Padana05/29/20126Reverse4.73
EQ6—Friuli 4th shock09/15/19765.9Reverse16.83
EQ7—Hector Mine10/16/19997.1Strike-slip28.61
EQ8—Honshu08/10/19965.9Reverse13.89
EQ9—Hyogo-Ken Nanbu01/16/19956.9Strike-slip16.6
EQ10—Landers06/28/19927.3Strike-slip13.08
EQ11—L’Aquila mainshock04/06/20096.3Normal5.65
EQ12—Loma Prieta10/18/19896.9Oblique27.59
EQ13—Mid Niigata Prefecture10/23/20046.6Reverse16.42
EQ14—Mt. Fuji Region03/15/20115.9Strike-slip12.8
EQ15—N. Miyagi Prefecture07/25/20036.1Reverse9.93
EQ16—Northridge01/17/19946.7Reverse20.19
EQ17—Off Noto Peninsula03/25/20076.7Reverse6.64
EQ18—Olfus05/29/20086.3Strike-slip8.25
EQ19—South Iceland06/17/20006.5Strike-slip5.25
EQ20—Southern Iwate Prefecture06/13/20086.9Reverse23.08
EQ21—W. Tottori Prefecture10/06/20006.6Strike-slip11.78
Publisher’s Note: MDPI stays neutral with regard to jurisdictional claims in published maps and institutional affiliations.