Article

Energy Balance, Cost and Architectural Design Features of 24 Building Integrated Photovoltaic Projects Using a Modelling Approach

by
Cihan Gercek
1,*,
Mirjana Devetaković
2,
Aleksandra Krstić-Furundžić
2 and
Angèle Reinders
1,3
1
Department of Design, Production and Management, Faculty of Engineering Technology, University of Twente, P.O. Box 217, 7500 AE Enschede, The Netherlands
2
Faculty of Architecture, University of Belgrade, Bulevar Kralja Aleksandra 73/II, 11000 Belgrade, Serbia
3
Energy Technology Group at Mechanical Engineering, Eindhoven University of Technology, P.O. Box 513, 5600 MB Eindhoven, The Netherlands
*
Author to whom correspondence should be addressed.
Appl. Sci. 2020, 10(24), 8860; https://doi.org/10.3390/app10248860
Submission received: 22 October 2020 / Revised: 27 November 2020 / Accepted: 7 December 2020 / Published: 10 December 2020
(This article belongs to the Special Issue Performance Analysis of Photovoltaic Systems)

Abstract

:
This paper presents the energy balance, architectural design features and cost aspects of 24 building integrated photovoltaic (BIPV) projects in three different contexts, namely BIPV in residential, office and historical buildings. These BIPV projects have been modelled and evaluated for different geographic locations because the European Energy Performance of Buildings Directive (2018/844/EU) has resulted in country-specific regulations and situations aimed towards the reduction in energy consumption, and hence the CO2 emissions of built environments. Moreover, the geographical variation of irradiation affects the performance of different BIPV projects on different locations. The results of our study show that the return of investment of BIPV projects across 12 countries took (on average) 13.3 years. Furthermore, the residential projects —as compared to non-residential buildings—were mostly energy plus buildings with an average self-sufficiency of 110% due to their low energy consumption. In conclusion, most BIPV projects resulted in realistic energy performances (on average: 761 kWh/kWp.year), low payback times (10 years for residential and office buildings), and modelled unique design features.

1. Introduction

In 2017, according to [1], the building sector accounted for 39% of global energy-related carbon dioxide (CO2) emissions. In order to reduce both these emissions and our societal dependency on fossil fuel-based energy sources, the European Energy Performance of Buildings Directive (2018/844/EU) has declared that all new buildings should be nearly zero energy buildings (NZEB) by 2021 [2]. According to this directive, an NZEB is defined as “a building that has a very high energy performance”, which “…shall be expressed by a numeric indicator of primary energy use in kWh/m2·year” [2]. Due to country-specific climate conditions, member states are allowed to describe their methodology of the quantification according to the framework [2]. The following five ISO standards describe steps in the assessment of the energy performance of buildings; namely 52000-1, 52003-1, 52010-1, 52016-1, and 52018-1 [3,4,5,6]. As each country applies its own methods to label building as NZEBs, the minimum values of primary energy use for NZEB range between 20 and 117 kWh/m2·year for residential buildings, and between 25 and 255 kWh/m2·year for non-residential buildings [7].
Within the EU, the average residential energy demand of regular homes is currently estimated at 180 kWh/m2·year, and 250 kWh/m2·year for non-residential buildings [8]. Because of their annual electricity yield, which is in the range of 800 kWh/kWp.year for Northern European countries and up to 1800 kWh/kWp.year in Mediterranean countries [9], photovoltaic (PV) systems can significantly contribute to the realisation of NZEBs [10,11].
A specific category of PV systems is building-integrated PV (BIPV). BIPV is defined as the essential elements in the building envelope that contain at least one additional construction material function besides generating electricity (e.g., insulation, sound barrier, shading, etc.). While currently replacing conventional building materials, BIPV could play an essential role in generating the local energy demands of buildings [12]. BIPV may improve comfort and energy resilience, providing extra insulation, even preheating, such as reported in [13], which is a remarkable addition while aiming for NZEB. Compared with an ordinary roof-mounted installation (standoff systems), which is placed on top of a conventional roof, part of the basic concept of a true BIPV installation is to share the cost of the building envelope because the installation has a double function [14]. Building integrated PV modules can be treated as an envelope or as a finishing layer of the envelope and therefore they provide thermal, acoustic, wind, and humidity insulation, and sometimes fire and security protection, while producing electric energy and in some cases also thermal energy [15].
Despite an estimate annual growth rate of 18.7% of the global BIPV market between 2009 and 2019 [16], the use and application of BIPV has remained relatively limited. With average costs of BIPV of 600 EUR/m2, a figure that is even lower compared to certain insulation materials [17], BIPV’s market share in the EU’s PV sector is only 2% [18].
Numerous commercially available PV technologies offer various design features, as defined in [19]. Beyond energy balance and costs, integrating photovoltaic systems into the building envelope strongly affects the appearance of buildings, but also the appearance of urban structures. Architectural design features of BIPV can be considered from two points of view: in terms of the shape of the building, i.e., the geometry of surfaces on which the PV modules are placed, and in terms of the required aesthetic expression, which all together influences the appearance of the building envelope [12,20]. The design decisions regarding the architectural design features of BIPV such as; appearance (dimension, form [21], colour [15], transparency [22]), inclination, location, not only reflect on the visual experience, but can also affect the energy efficiency and the energy label of the building. Among non-residential buildings, offices have a tendency to generally promote a greener and futuristic image with distinguishable BIPV systems. Nevertheless, historical buildings, i.e., buildings under protection or heritage buildings, require unique design features and distinct regulations. As the requirements diverged, the buildings in this study were clustered into three separate categories: residential, office and historical.
Although the first application project dates back to 1991 [23], BIPV systems are relatively under-researched, which is evidenced by approximately 1500 publications as compared to more than 100,000 on the subject of PV, according to a search in Scopus. As field data for BIPV projects are rarely available, there exists a lack of practical insights. Simulation tools and modelling approaches are therefore required to generate information about the energy production, architectural design features and cost aspects of BIPV systems.
Several simulation tools exist with which to assess the energy production of BIPV systems [24,25], yet none of them fully take into account all variables relevant for “good design”, such as (beside energy performance) technical design features, financial aspects, CO2 emission reduction potential, aesthetics, user perception and appreciation, and the effects of regulations and laws. Moreover, architects often qualify those tools as “difficult to use”, “complex”, and “cumbersome” [26], and hence they require expertise from energy researchers and engineers during the assessment. To enable clear communication between the various stakeholders and to optimise the different features involved in BIPV applications, multicriteria optimisation as a building information modelling (BIM) approach and modelling tools are needed to facilitate collaboration and gather more insights.
Given the context sketched above, the energy balance, architectural design features and cost aspects of 24 BIPV projects will be determined and evaluated for three different building categories, namely; residential, office and historical buildings. In this study, we used BIMsolar together with Sketchup, as well as our own written MatLab algorithms to quantify energy and cost-related aspects, so as to evaluate various types of buildings on different locations in order to:
  • Map the feasibility of BIPV projects: how do investment costs, electricity prices, incentives, type of buildings, their geometry, and their geographic location impact feasibility in terms of the energy, cost and design features of a BIPV project?
  • Energy balance of BIPV: what potential exists regarding increased self-consumption and self-sufficiency of BIPV systems in NZEBs in different geographic locations?
  • Design features: how could design features of the buildings be respected or even enhanced by BIPV projects?
This paper is structured as follows. Section 2 will present the method applied to the evaluation of 24 selected BIPV projects, with a focus on their description. Section 3 will report the cumulated data of 24 BIPV projects and compare them with each other. Finally, in Section 4, a discussion about the results will take place and conclusions will be drawn.

2. Method Applied to BIPV Project Evaluations

The methodological approach in this paper includes: presentation of buildings selected by a group of students to create BIPV projects, which are residential, business and historical building projects, discussion of modelling results for 24 BIPV projects, taking into account project specifications and numerical results in terms of energy and financial aspects.
Selected BIPV projects in the aforementioned three categories were analysed in an educational research framework provided by the course ‘Building Integrated Photovoltaics’ given at the University of Twente, the Netherlands, between April and June of 2019. Sixteen students attended this course and contributed to an engineering assignment which will be executed as a project by a small team of 2 to 3 students. To provide framing and prior knowledge, 6 lectures with 4 workshops with BIM Solar for 3D irradiance analysis and MatLab for further energy data and economic analysis were given. Visual aspects and design features, markets, PV technology and performance, energy balance, data monitoring and BIPV software skills were some of the main topics of the lectures.
The assignment was executed by 7 teams. The final result of the project reported and included an analysis of a BIPV case study on a realized project, at least three or more new BIPV designs, and a description of a future perspective on a BIPV project. Three groups did an additional project, which gives 24 BIPV modelling projects in total. Representative figures are presented in Table 1, excluding bonus projects, although their specifications and results are still mentioned in the following figures and tables.
Figure 1 summarizes the methodology of the BIPV projects’ modelling and analysis. A BIM-friendly BIPV software, BIMSolar was used for 3D modelling, which is the result of a Horizon 2020 project (PVsites), described in [50,51]. Based on 3D solar irradiation data, including sun position on the horizon, the software delivers surface-specific and custom-made module-specific 3D analysis. It takes into account surrounding shadings and heat losses, PV module locations and the system losses such as cabling, inverter, mismatch losses, albedo reflections, and light transmission, etc. [52]. The results were extracted for further analysis in MatLab for data analysis and further investigations. The details of the modelling and analysis will be described in the following sub-sections.

2.1. Selected BIPV Projects for Evaluation

Twenty-four BIPV projects were selected (see Table 1) for evaluation by the project teams according to the following criteria:
  • Data availability
  • Design features
  • Cost Incentives
The most important selection criteria of the building were the availability of the 3D geometry and appearance of the building and design features that could allow for relatively easy BIPV integration. In addition, building fame, annual energy consumption data at an hourly resolution, and interesting subventions and incentives were of course parameters to consider when choosing between different buildings. Some buildings were generic rather location-specific, and their location decision was mostly based on climate and incentives including attractiveness for most of the cases. All the buildings were represented in their real/chosen neighbourhood, with the buildings and objects surrounding the studied building. The location had a tremendous effect on the three aspects studied below.

2.2. Architectural Design Features

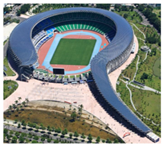
Integration of PV into buildings challenges architects and construct designers. While some of them are afraid of the possible “solar look” of their designed buildings, others respond to the challenge with innovative, advanced architectural solutions. The architects and PV professionals nowadays need to understand the need for the integration of PV systems, and to predict its architectural design implications. It is very important for contemporary architects to be informed of exceptional examples of BIPV around the world. A significant contribution for BIPV promotion comes from the most renowned architects, awarded the Pritzker prize for architecture, who applied BIPV on their recent designs (for example, Taiwan National Stadium, Table 1).
For BIPV, different performance data can be required regarding location possibilities, function possibilities, dimensions and forms, colour and appearance of modules, light permeability and construction possibilities [12,21]. As for the location on the building, BIPV can be applied on facades and roofs, fences, skylights, and canopies. In the end, the system yield is strongly influenced by the orientation and inclination of PV modules.
With regard to the geometry of the surfaces on which the BIPV modules are placed, there are flat, saw tooth, accordion, stepped, and curved surfaces and their combinations, called free forms, which can be placed as vertical, horizontal and inclined planes (angle < 90°) [18].
Various light permeability and interesting light effects inside a building can be produced through the use of light-permeable solar cells or the variation of the arrangements and distances between the cells. In general, building surfaces with BIPV can be “opaque” or “semi-transparent”, and lately, thanks to new technologies, also transparent. The appearance of the facade and roof with BIPV is influenced by the PV module’s colour, which depends on the material of solar cells and antireflection coating. Using double-layer antireflection coatings, a broad range of colours of PV modules can be obtained [20] (gold, steel blue, dark blue, pink, green), allowing architects flexibility for the integration of PV cells into building facades and providing a good match to the environment. Regarding construction possibilities, photovoltaic facades usually represent a type of glazed, suspended facade, while roof integrated PV systems can appear as integral roof modules (appear as a glazed structure) and roofing tiles and shingles (appear as a roof) [19].
The mentioned architectural design features of BIPV indicate that the integration of PV into the building envelope affects its structure, requiring solving the necessary installations, although in terms of the application of PV modules, the mainly available technologies for constructing the final layers of facades and roofs are represented.
Design features such as glazing, transparency, module or cell dimensions and spacing, and colours could be taken into account during the modelling in BIMsolar© to modify the design features to express them more easily [50,52]. The software could cover the impacts of those aspects on energy generation, by creating modules and cells with their own characteristics and technology, respecting manufacturers’ details and the 3D surroundings, including frames. The position, the data input and the electricity generation details are mentioned in Section 2.4. Simulating the integration of specific PV systems in chosen buildings, it was essential not to impact their basic geometry and external appearance. This was especially important with historic and landmark buildings.

2.3. Cost

The selected BIPV projects were financially evaluated by means of levelized cost of electricity (LCOE), and return on investment (ROI) according to Equations (1) and (2):
L C O E = ( C A P E X + t = 0 l i f e t i m e O P E X     ( 1 μ ) C A P E X     d     μ ( 1 + r ) t   ) E B I P V
ROI (%) = CAPEX/(Inself-consumption+ Infeed-in − OPEX)
where CAPEX is the capital expenditure (in EUR), OPEX is the operational expenditure or maintenance (2.5–5% of the CAPEX, in EUR), t is time, d is the depreciation rate (%), μ is the tax rate and r is the discount rate (%). EBIPV is the amount of electricity (kWh) produced by BIPV throughout its lifespan (usually taken as 25 years). Inself-consumption indicates how much import and cost is avoided and Infeed-in indicates the economic value of the BIPV energy sold to the grid, both resulting as income (€), as yearly energy production values derivate (as described in the following section).
In this study, the country regulations and electricity end-user prices, as well as a market analysis and the potential stakeholders of the project, were investigated. The cost of the panels and inverters were acquired from manufacturers. Hourly resolution annual energy consumption and PV production, self-consumption, and electricity fed into the grid were investigated further to establish a more precise levelized cost of electricity (LCOE) and incomes of the PV system, compare it with the incentives given, and obtain the return on investment (ROI).

2.4. Energy Balance

In this project, the energy balance was determined by comparing the energy production with energy consumption at different timescales and by calculating different indicators such as self-consumption ratio (SCR) and self-sufficiency ratio (SSR). Equations (3)–(6) show how the energy balance for each building was determined:
E flow = Econsumtion-EBIPV
EBIPV= Eself-consumption+Efeedin
SCR = Eself-consumption/EBIPV
SSR = EBIPV/Econsumption
where Eflow is the energy flow including all imports and exports to the grid (net-meter, in kWh), and Eself-consumption is the BIPV energy production consumed by the household (kWh). Efeedin is the energy that could not be consumed and was fed into the grid (kWh).
Econsumption data of the building were either recorded data (ex: energy provider’s public data [53] ) or estimated with similar consumption profiles. In the latter case, the similar profile found in the time series was scaled proportionally to the building studied according to annual/monthly consumption, found in government websites (e.g., OpenEI of the US Department of Energy [54]). Econsumption varied at an hourly to 15 min resolution. This allowed for greater accuracy regarding the self-consumption, and therefore provided better precision of the energy neutrality code of a building. Furthermore, this helped to tailor the location and the nominal power of the PV modules to increase the self-consumption.
The solar irradiance on the outside geometry of a building was modelled at an hourly basis over the year for the specific location by using meteorological data and BIMsolar. The Sketchup© Warehouse 3D building model was the basis of a building’s geometry; additional modifications were added if required, notably for existing shading objects in surroundings. Once the satellite-based typical meteorological year (TMY3) data were imputed [9], the yearly average solar yield could be assessed, therefore allowing the mapping of suitable locations to install PV on the geometry itself. Depending on the local climate, certain PV technologies were chosen. For BIPV options, some specific cell technologies, including glazing, transparent, or opaque modules over the 3D geometry, were selected, and BIMsolar was used to estimate the energy production for every hour in a year based on TMY3. The choice of PV or inverters proposed from the photon database could be even further extended by creating their own cells, modules, and inverters, etc. Once the software indicated the wiring and PV modules, the estimated solar energy at an hourly resolution could be given to include losses, as in Equation (7):
EBIPV = (EPVproduction − Elosses).ηeff
where EPVproduction is the production obtained with maximum power point tracking in ideal conditions without losses. Elosses integrates heat, shading, mismatch, and wiring losses up to the inverter. We applied the EU efficiency (ηeff) in order to get the final results of the energy yield EBIPV. These results were matched with energy load profiles.

3. Results

This section presents the buildings chosen by the study participants, a case investigation [55], and the model-based design of the project (Table 1). Photos of the buildings are also shown for further clarification. As we were unable to present each individual building assessment in this paper, an example will be shown in Section 3.1. (similar approaches were taken for other buildings). The results of all 24 projects will be shown in Table 2, Table 3 and Table 4.

3.1. Case Description of a Historical Building

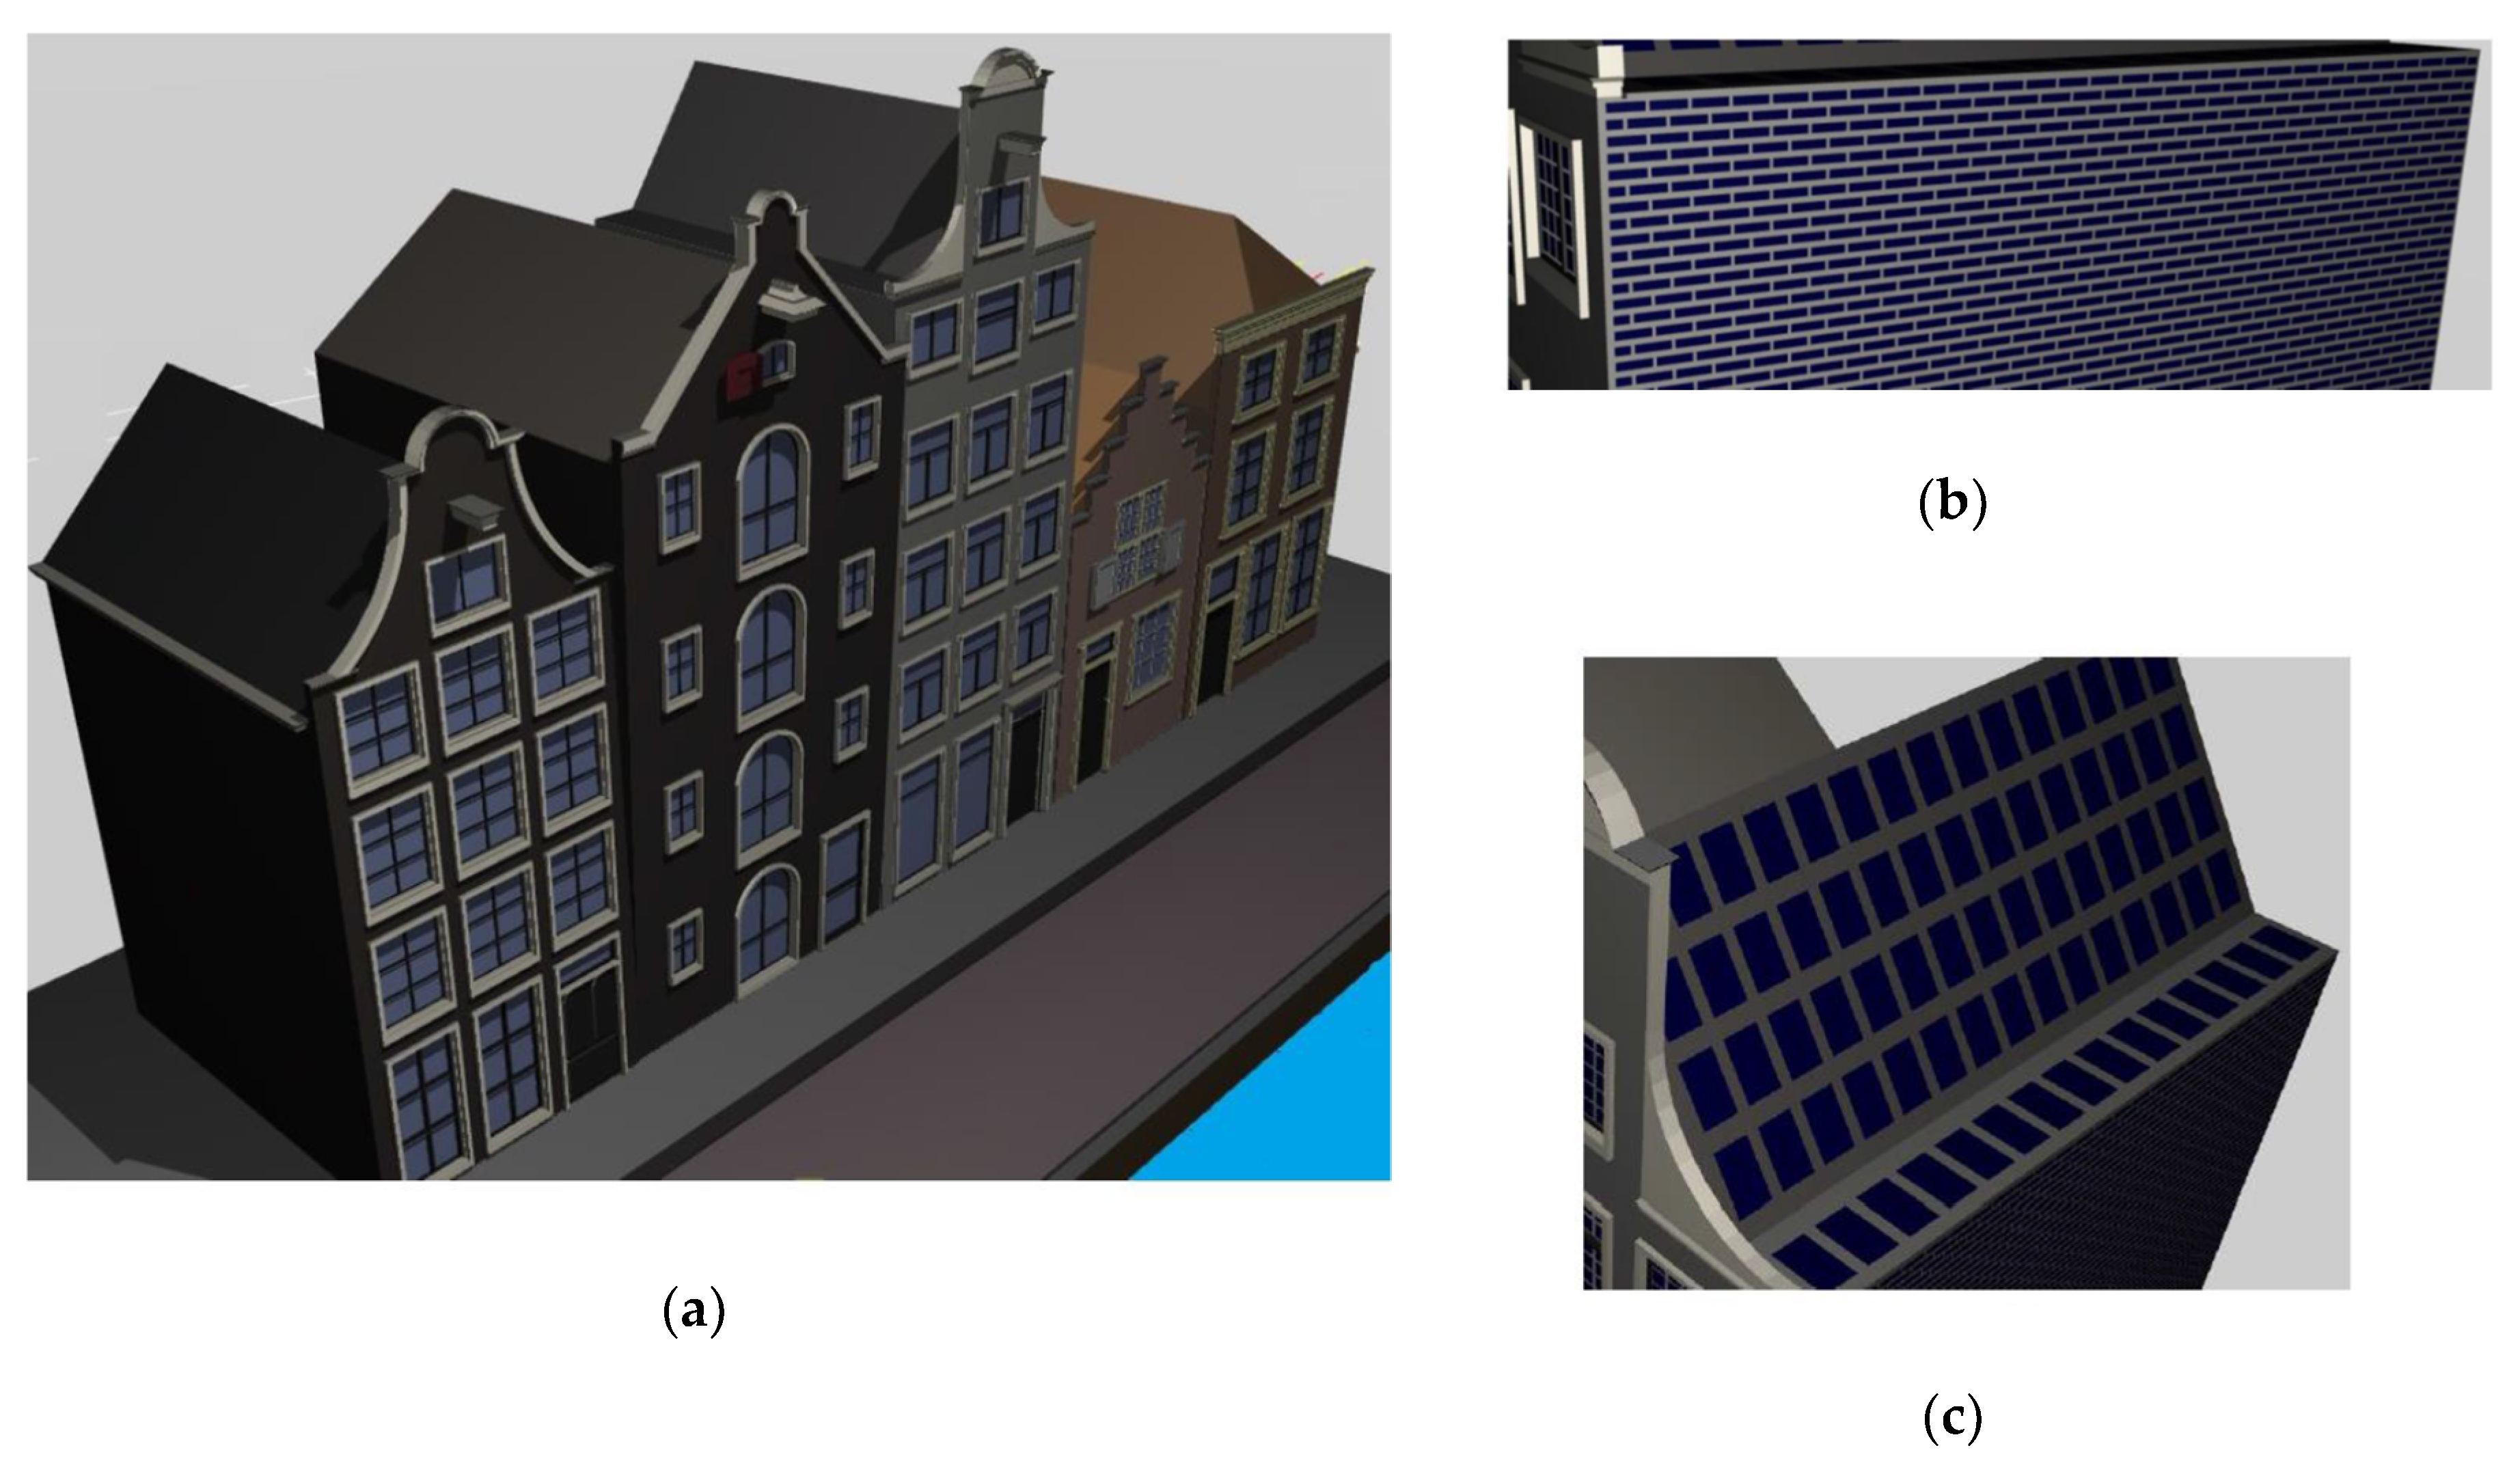
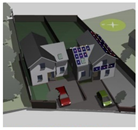
A typical historical canal house model is investigated in this subsection, respecting the building’s historical appeal (Figure 2a). Custom-made BIPV modules of monocrystalline silicon with typical wall bricks dimensions (210 mm × 100 mm × 50 mm) and colour were proposed (Figure 2b) [56]. Similarly, BIPV roof tiles were used to provide a non-intrusive appearance (Figure 1c) [57].
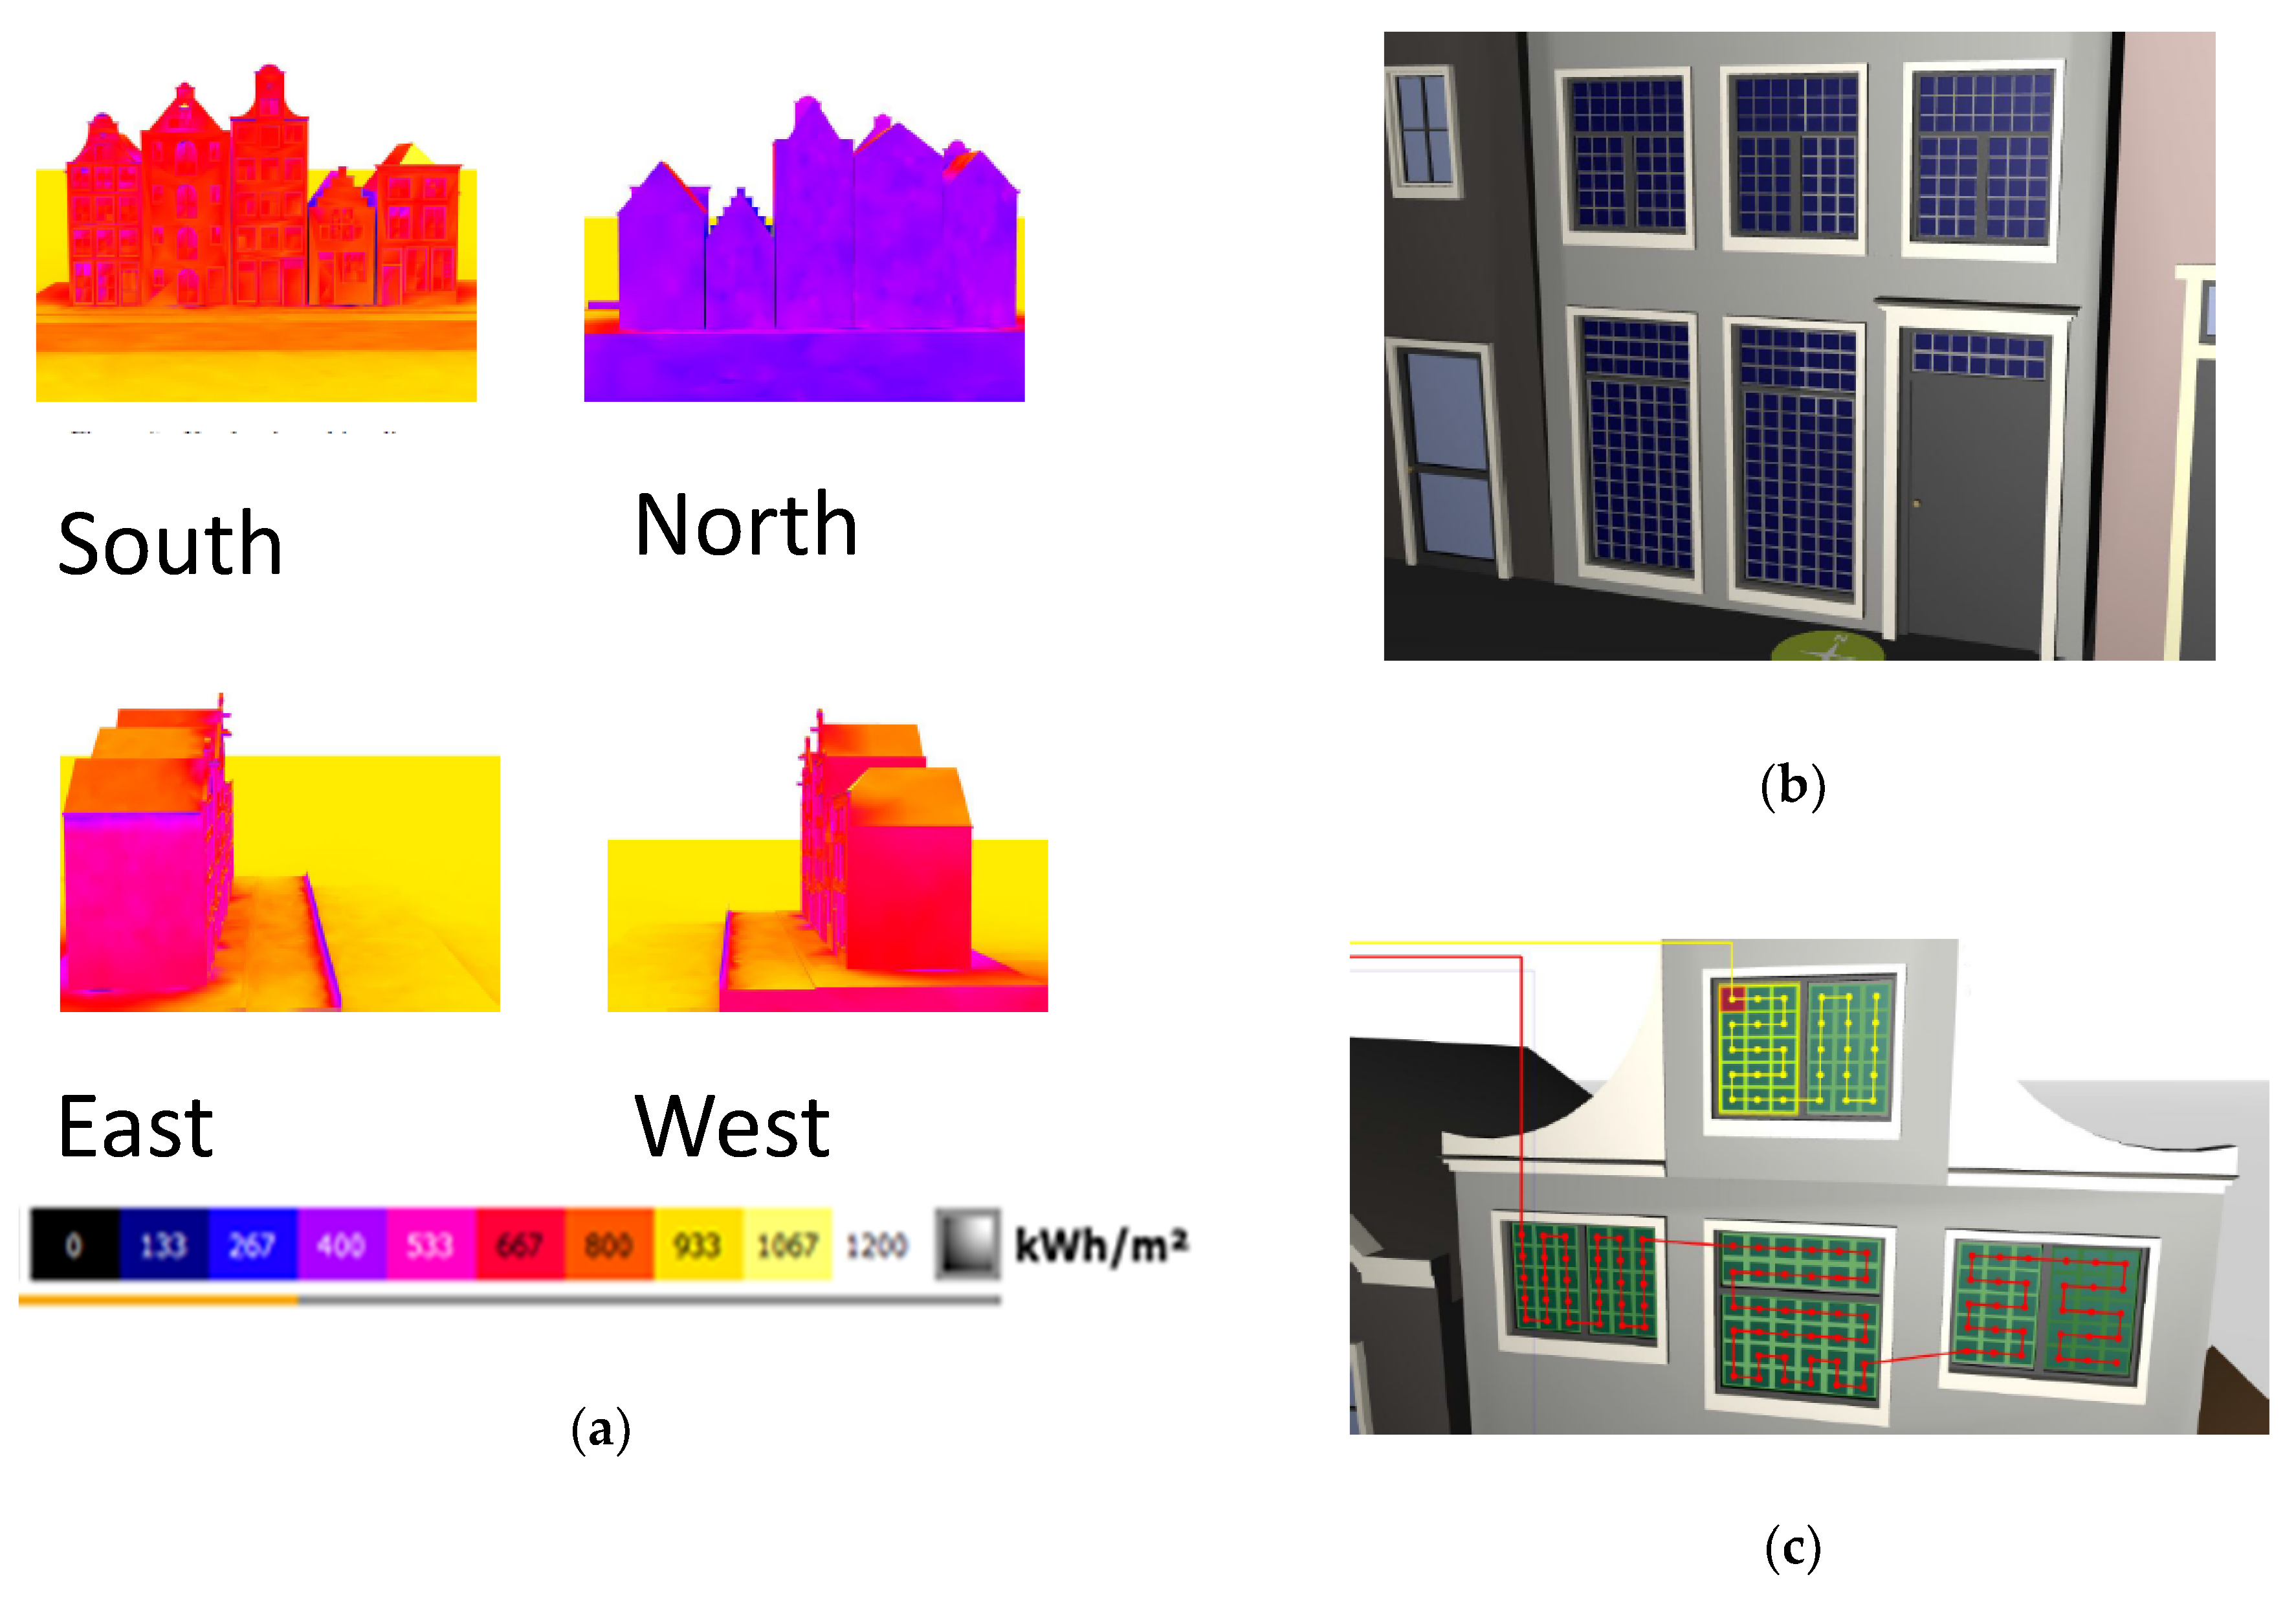
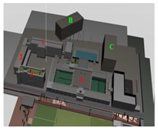
As the chosen BIPV modules could be considered aesthetically non-intrusive, the modules were mainly placed based on average irradiance assessment. The monocrystalline silicon cells provide 150 Wp/m2 depending on the colours [56]. Figure 3 shows the average irradiance and transparent BIPV windows applied in the south façade. The western side is also used due to the absence of any obstacles. To ensure that the building becomes an energy-plus building, 15 kWp is installed as the limit of net metering in the Netherlands [58], resulting in 8 MWh annually. The installations, including transparent windows, are shown in Figure 3. The load profile of an average Dutch family with three children was used and upscaled to 6 MWh, considering the house’s size. Hourly based average Dutch load profiles were used [30]. Although the self-consumption was 33%, the building achieved high self-sufficiency (136%). The electricity tariff for import and feed-in was 23 cents/kWh [50] and CAPEX 22 kEUR, respectively. This resulted in an energy-plus building with a payback time of 16 years.
Although a residential building, this example might belong to a protected historic neighbourhood and therefore some of its design features need to be highlighted. The first feature is the geometry and layout of the front façade that is entirely preserved. The second feature is glazing of the front façade windows that could be affected by the proposed PV integration. In this context, it is important to find a transparent PV glazing solution that would be entirely non-intrusive, preferably invisible.
As with the front façade, the geometry of the building is not affected by the integration of the PV system on the roof. Since the building roof parts equipped with the PV system are hardly visible from the street, and since the BIPV roof tiles have been selected, the architectural design features have not been intruded upon.
From an architectural point of view, the most critical factor is the integration of PV brick-form BIPV tiles that affect the original specific materialization of the building and are visible in the neighbourhood context. This BIPV solution might be expected to become an issue for discussion with the institutions that protect historical buildings.

3.2. Modeling Results for 24 BIPV Projects

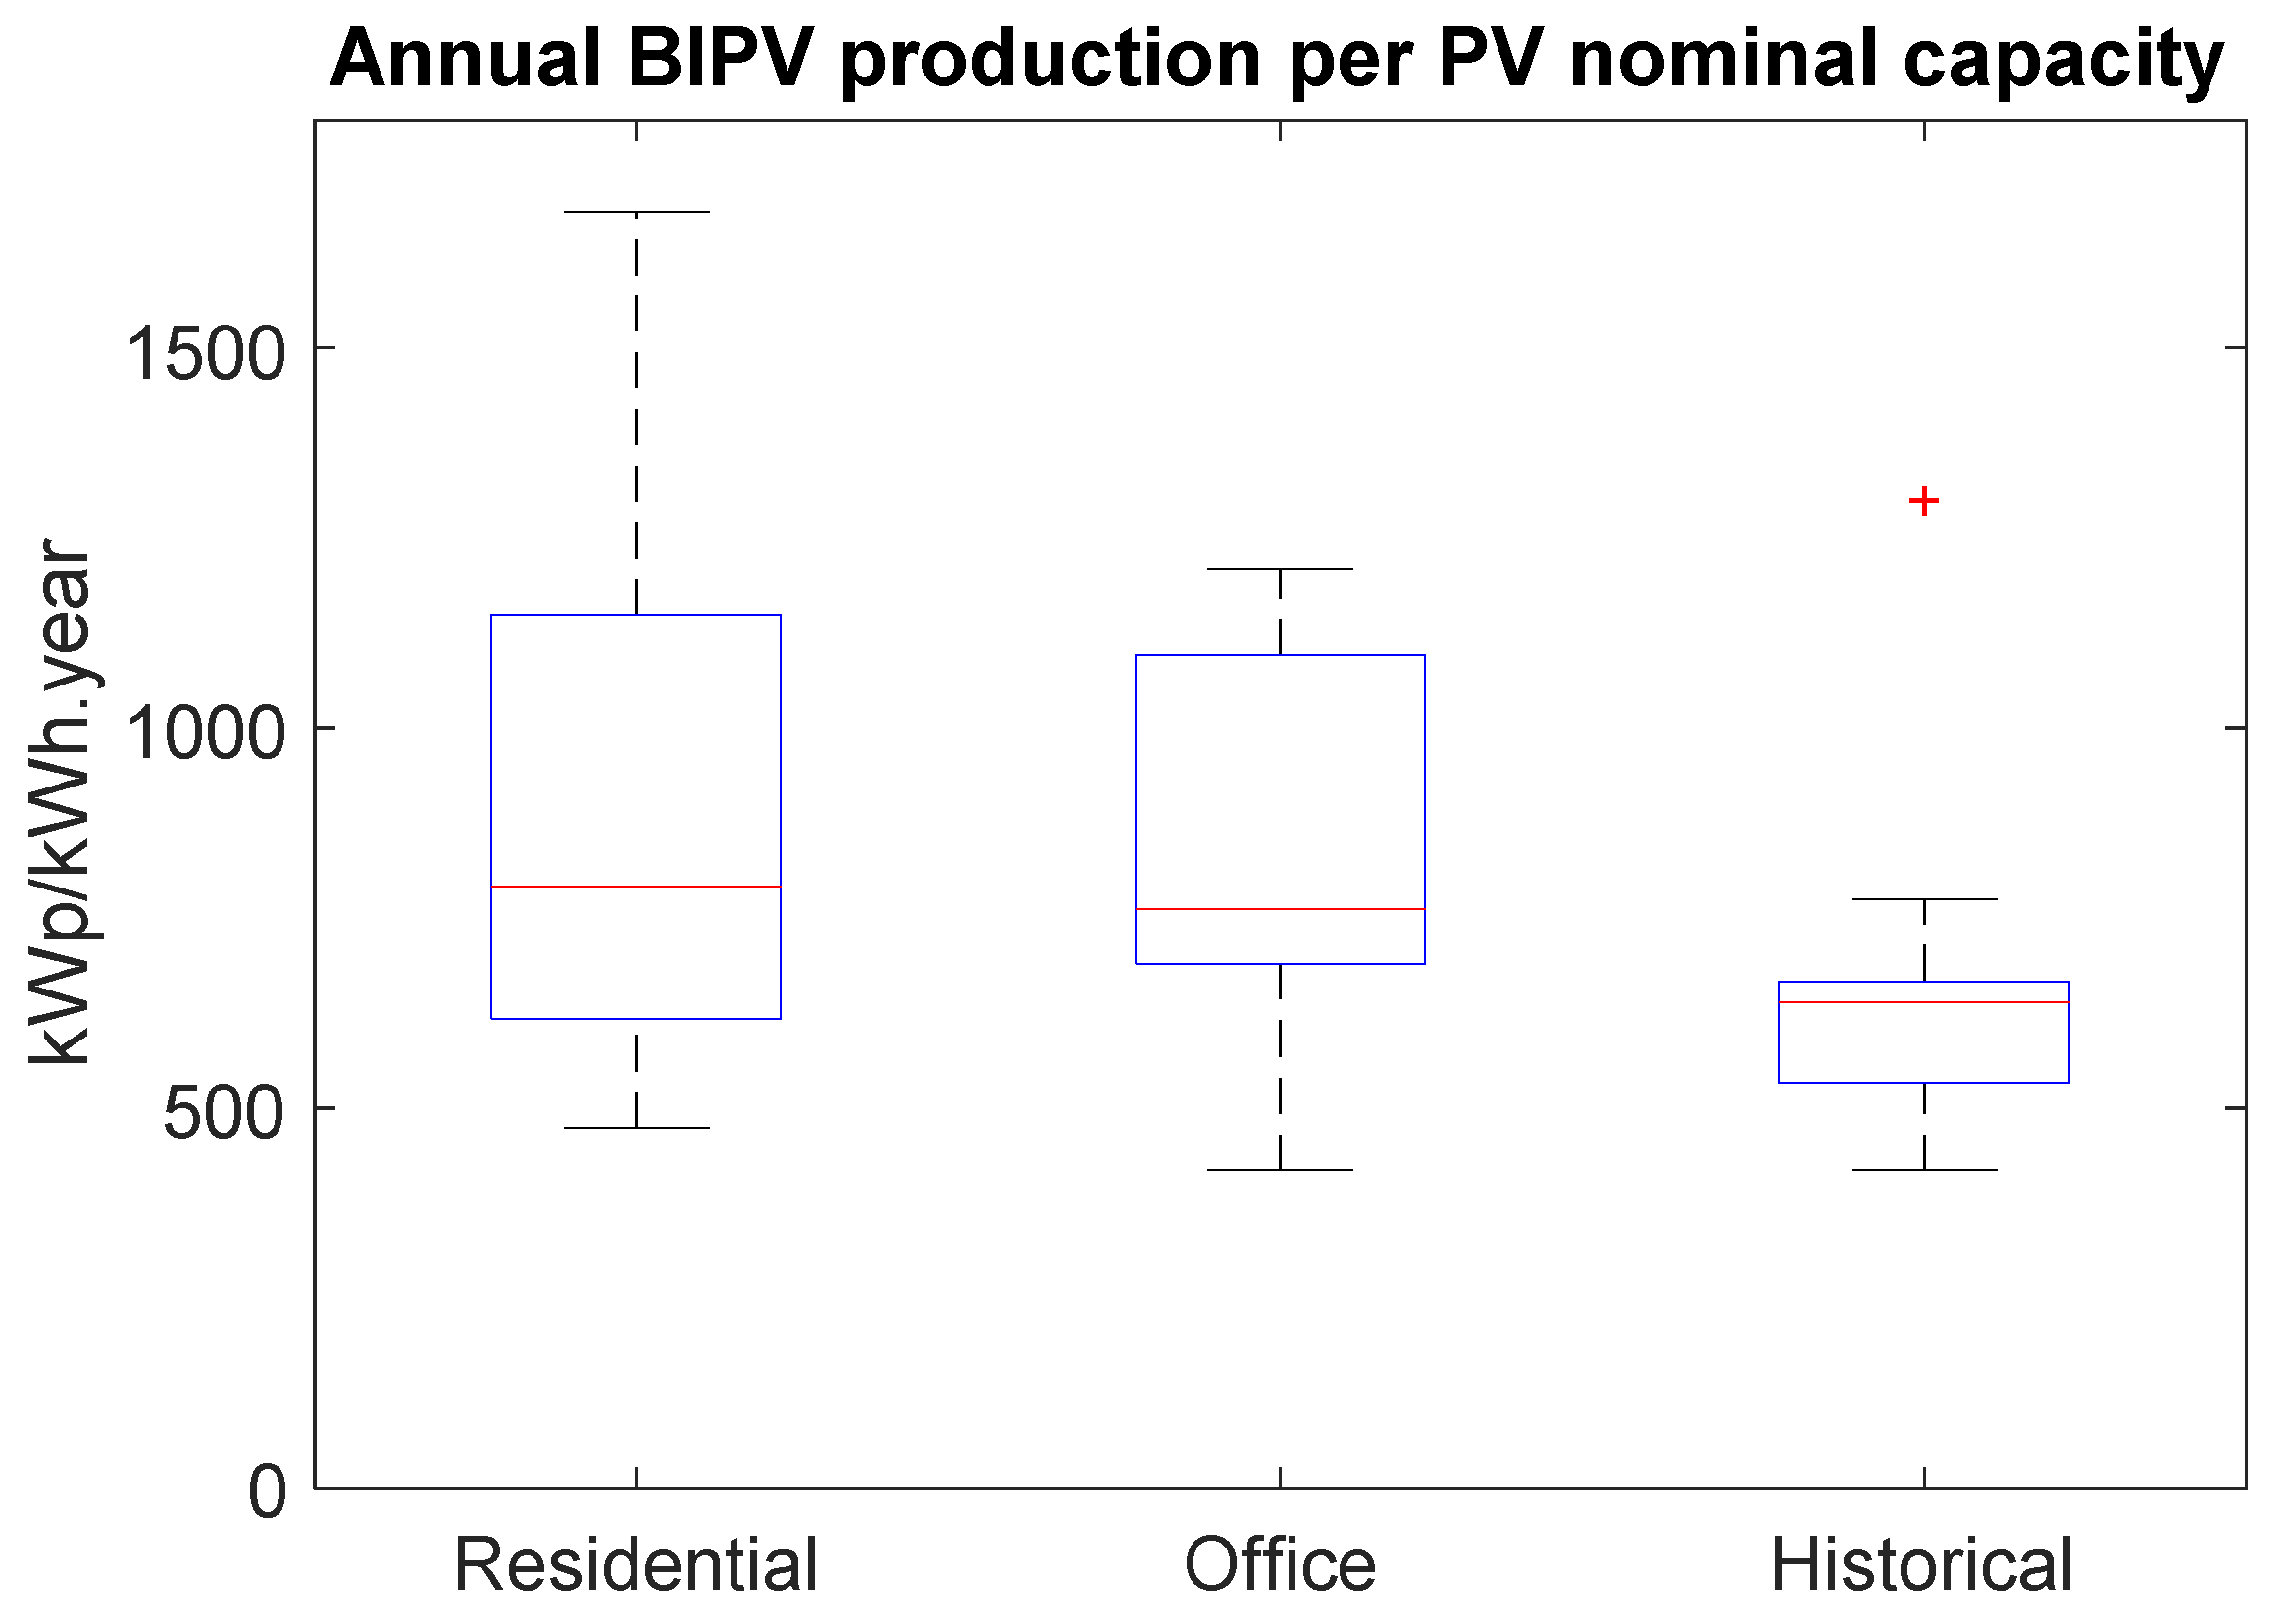
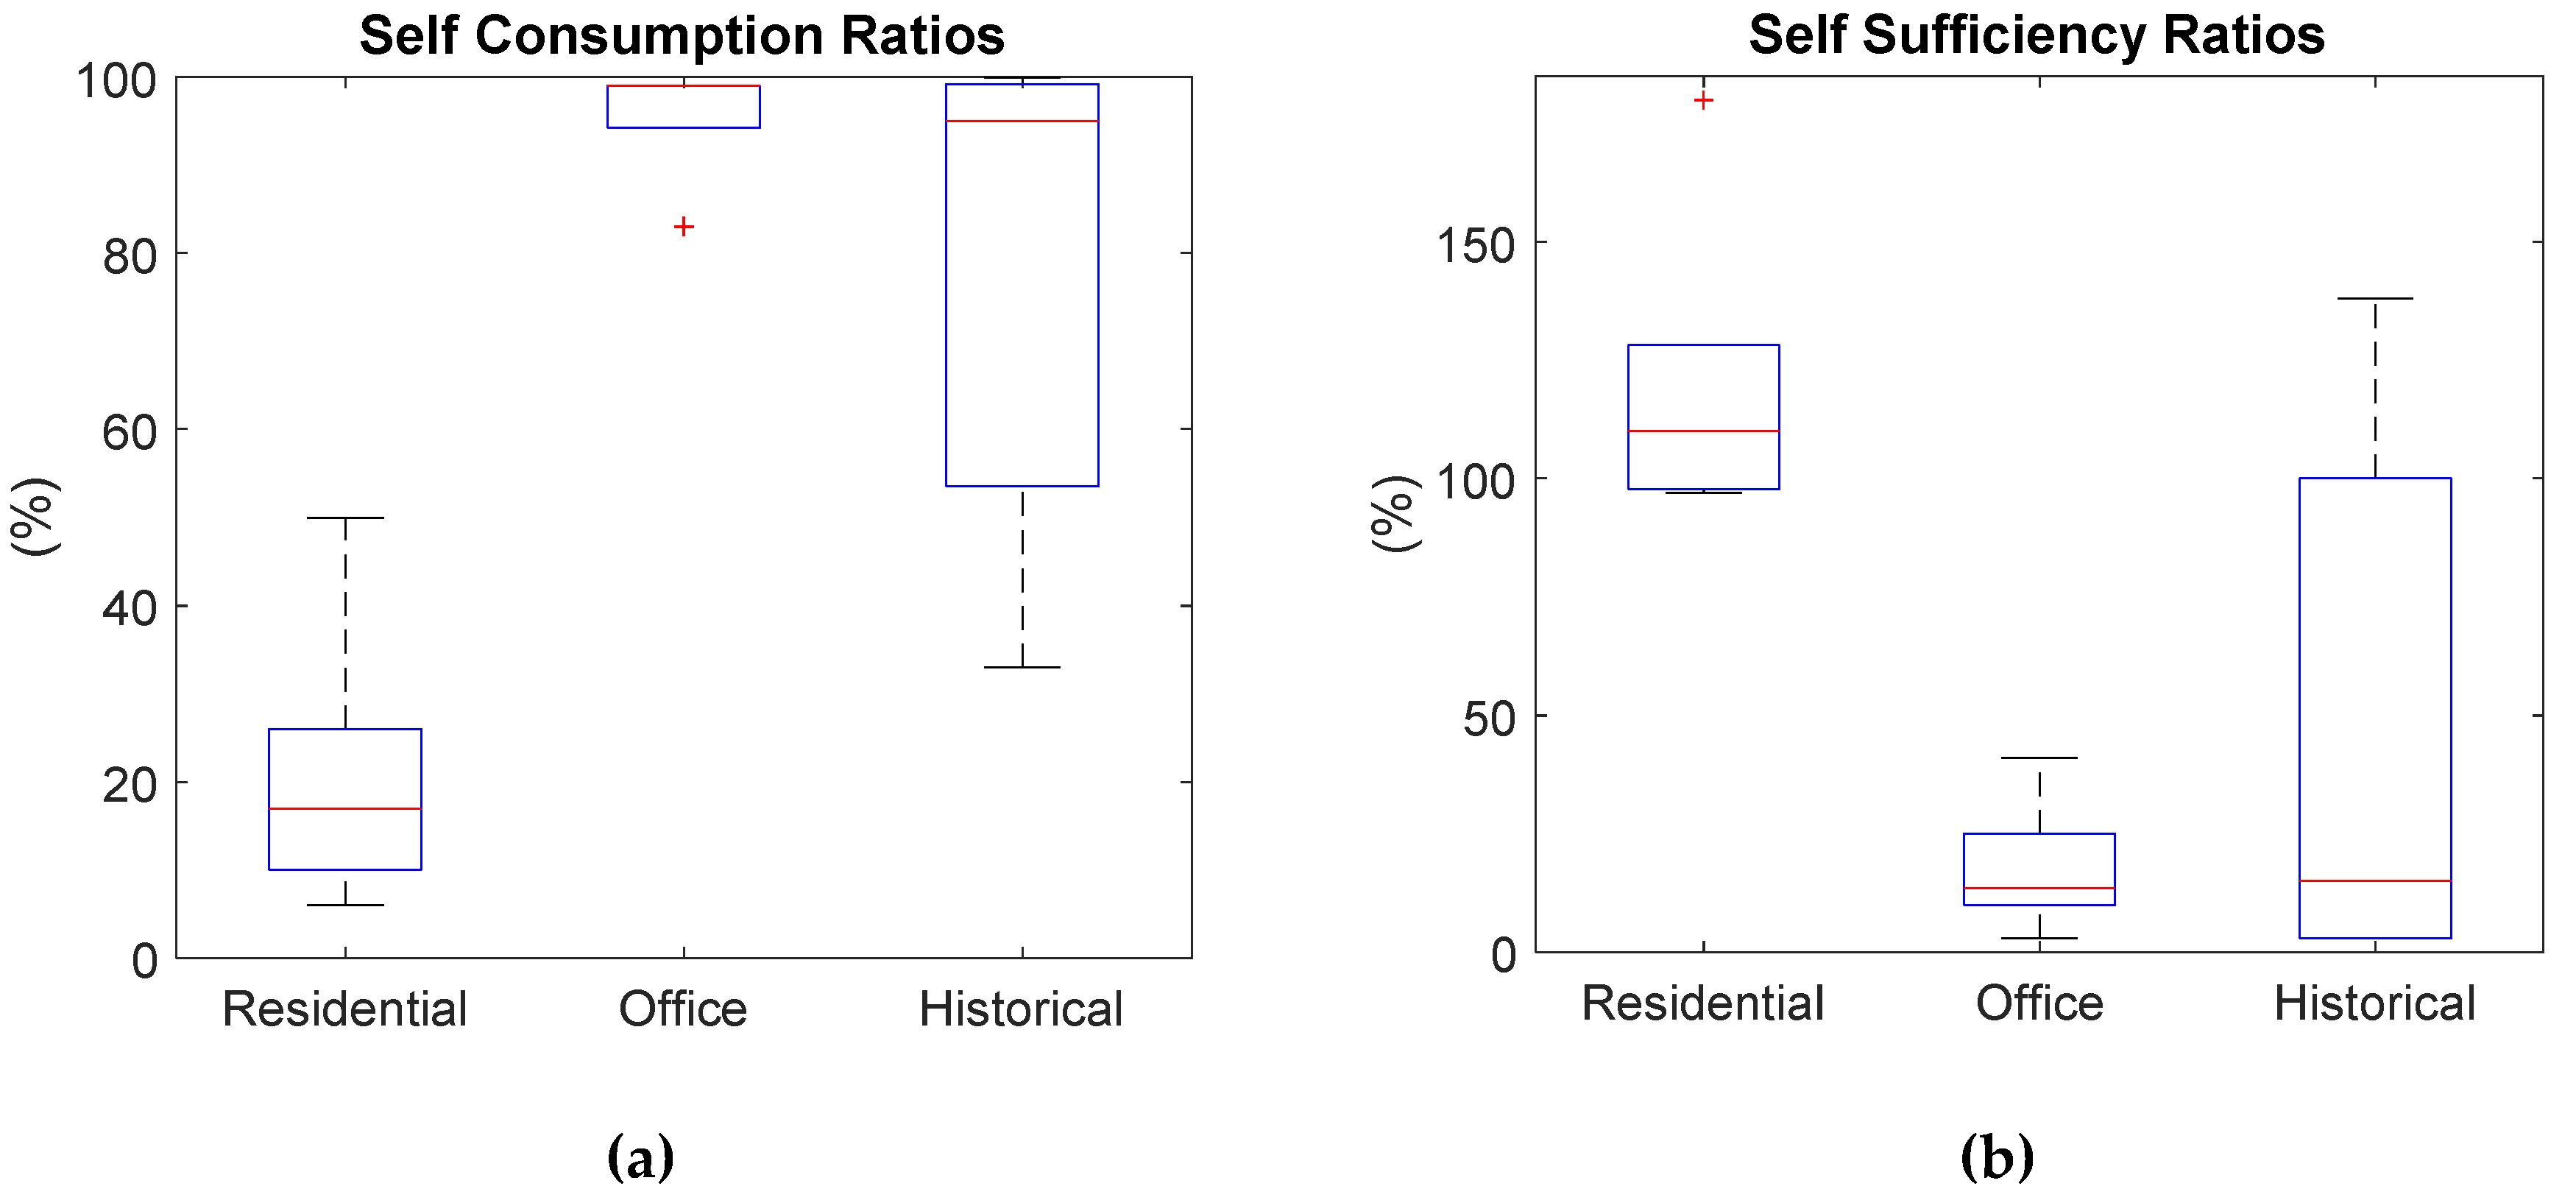
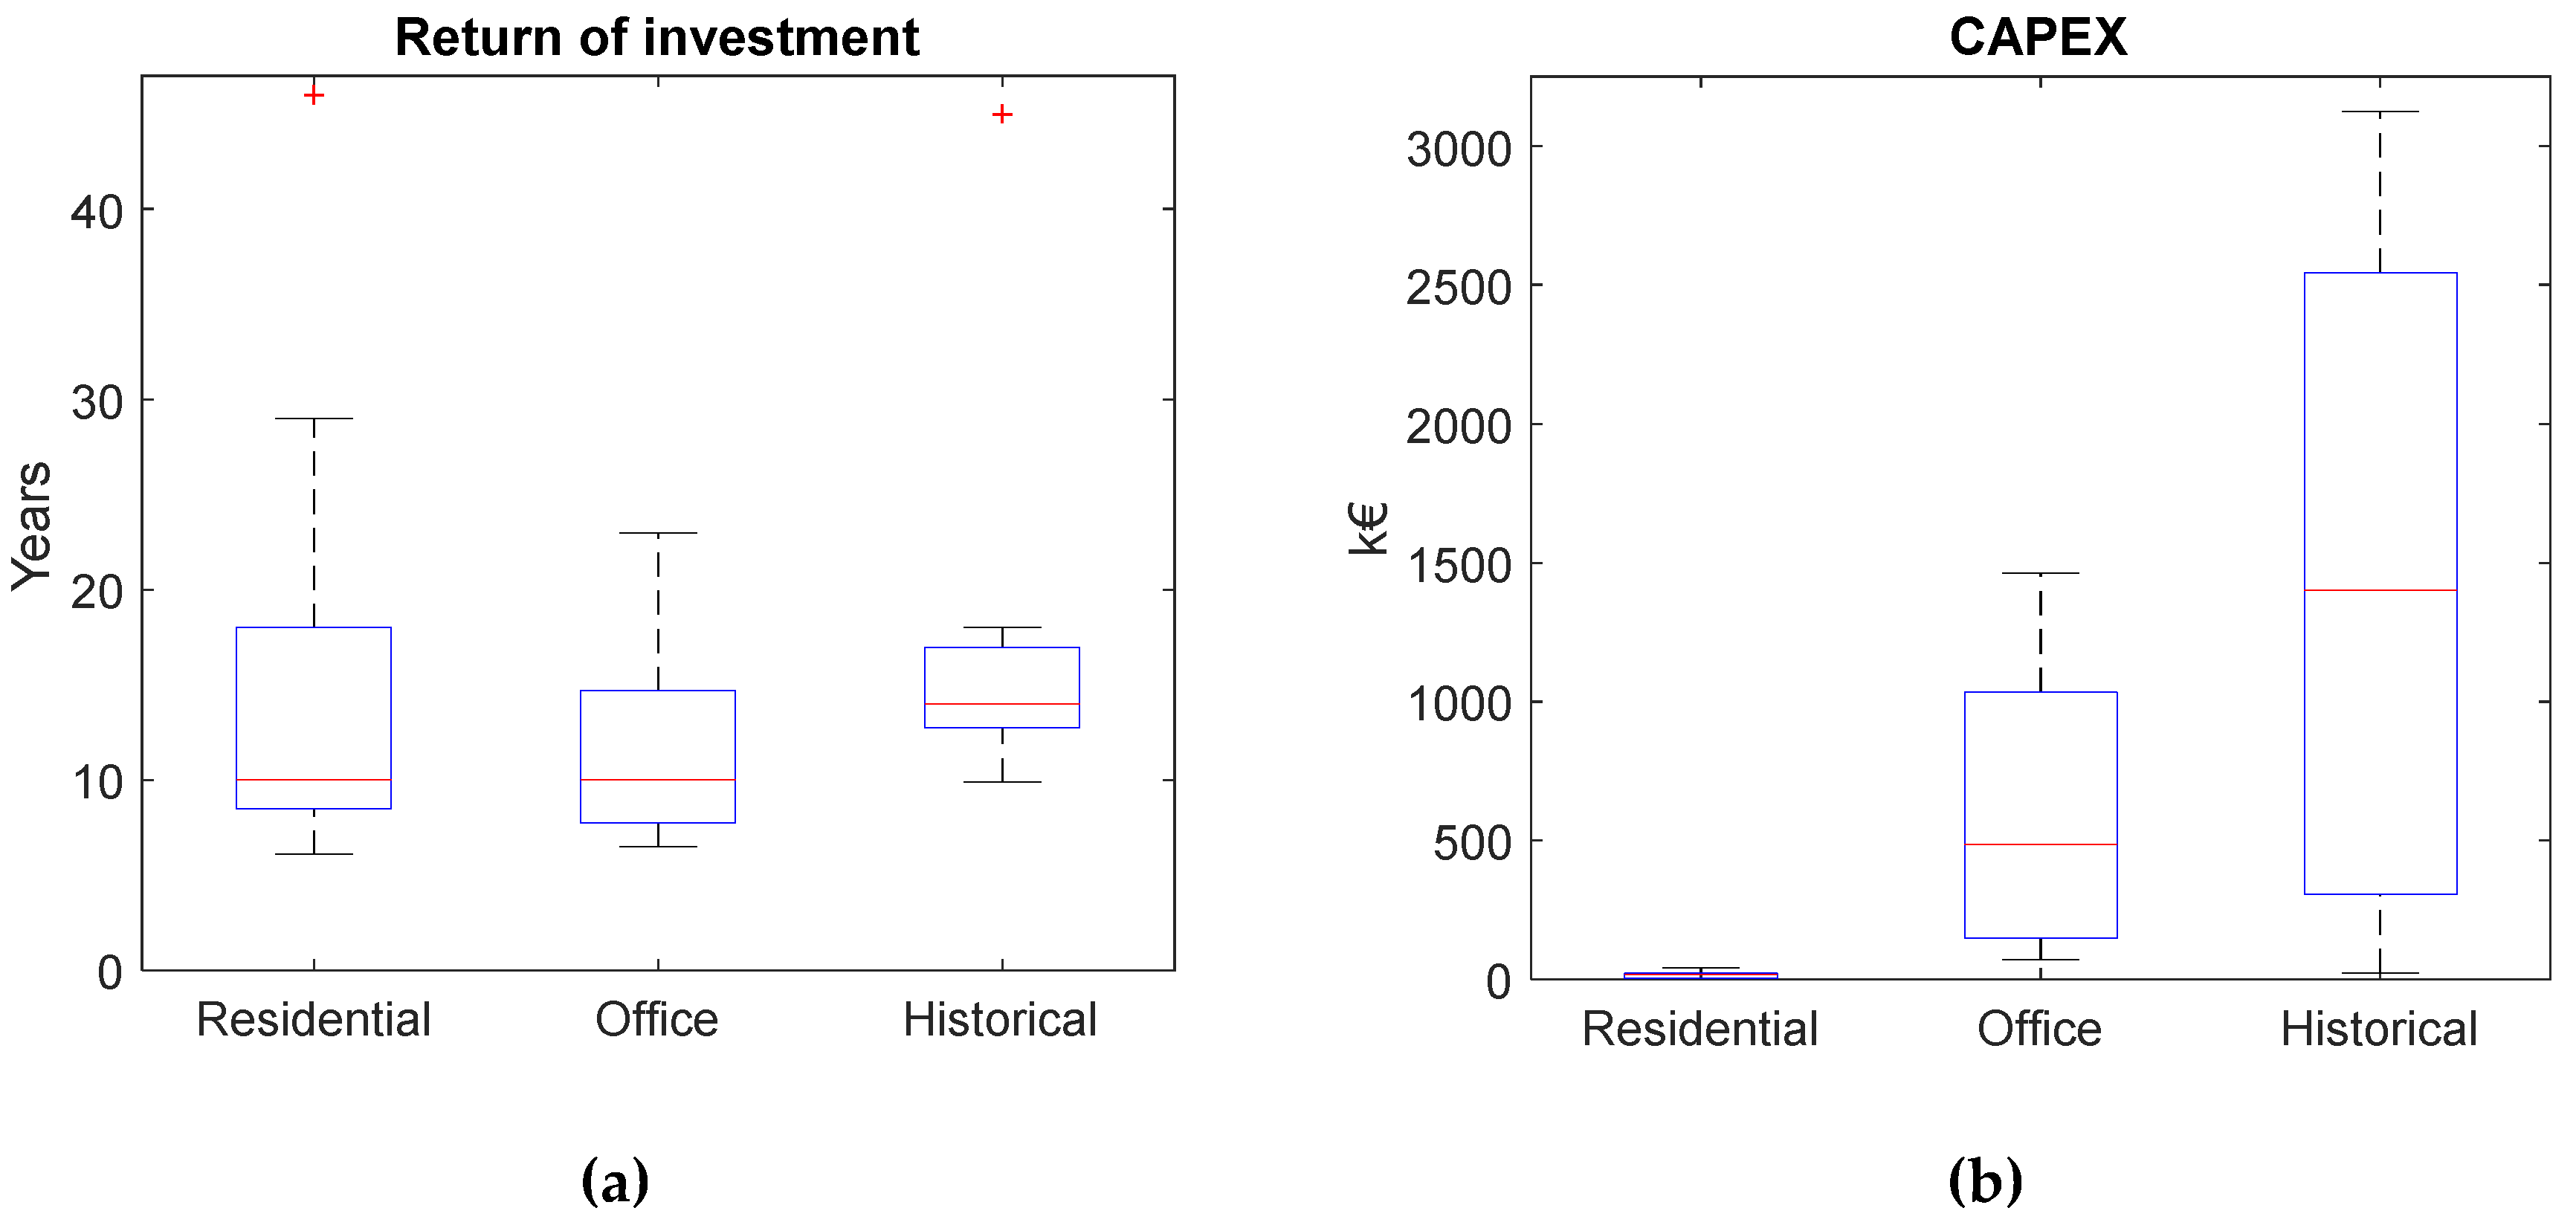
Table 2, Table 3 and Table 4 present results for 24 selected BIPV projects, focusing on the findings of the energy and financial modelling and the design features. The quantitative modelling results for each case could be consulted from those tables. To provide an overview for each type of building, Figure 4, Figure 5 and Figure 6 summarize the annual energy production per nominal capacity installed, self-sufficiency and self-consumption, return on investment (ROI) and capital expenditure (CAPEX), respectively.
Residential projects were mostly designed to be energy-plus buildings or NZEB. They have the highest kWh/kWp.year in some cases, as the roof/façade proportion was the highest. There were also relatively low values due to shading, which resulted in a similar performance with office buildings regarding the mean value (Figure 4). Although PV systems were often modelled on the highest irradiation spot (south roof and façade for ex.), the building’s height also limits precautions against shading. The initial investments (as the nominal capacity) were low, as residential buildings were restrained to 10–15 kWp, mostly by the net metering limits. The fastest ROI was found to be 6.1 years (building 6, Table 2), in Spain, thanks to a combination of the feed-in tariff and exceptional irradiation (as well as highest yield per kWp). Self-sufficiency ratios were high for residential buildings (even more than %100), yet the self-consumption ratios were difficult to achieve (6–50%). The self-consumption could be improved thanks to a 6 kWh battery, from 50% to 75%, according to the modelling in DEMKIT software. The battery also reduced the original ROI of 20% for the case inspected.
Regarding office buildings, Table 3 and the figures show a similar payback time for offices as for residential buildings. High self-sufficiency ratios (+95%) compensate for the lower feed-in tariffs. Due to a greater coverage area, or special subventions, the building and energy costs could make office buildings attractive for investors. Almost all office modellings had a payback time under 14 years, except for two (building 3 and 12), due to high installation cost assumptions. However, the desired self-sufficiency levels are hard to reach as the demands for office buildings are high. More transparent BIPVs were used during those projects to respect design requirements.
Historical buildings were the most diverse, as they included various building types (historical, landmarks, or other). The self-sufficiency and self-consumption ratios varied significantly depending on both the building’s and BIPV installation’s size. For these buildings, examples were predominantly taken from London, Sydney, Amsterdam, and Rotterdam—big cities and iconic places—except for two buildings, Enschede and Hong-Kong. The CAPEX is closely related to special module requirements and the project size. In general, the historical or iconic buildings and stadiums had larger surfaces than other types of buildings. It should be noted that the installation costs were difficult to estimate due to the special requirements of the building element. Therefore, the initial costs and payback times were slightly higher—between 10 and 18 years—except for buildings 17 and building 23, which used more transparent panels and dealt with many functional, and thereby appearance, aspects; as such, the kWh/kWp.year is significantly less for most of the cases investigated.

4. Discussion

This study has encapsulated 24 BIPV modelling projects in terms of design features, energy consumption, and cost aspects. Three typical building types are analyzed: residential, office, and historical BIPV projects. Model-based design and analysis enabled estimations of costs and energy balance benefits, along with their compliance with regulations. The 24 analyses related to the 12 separate countries by indicating incentives, electricity tariffs for production and consumption, as well as specific regulations. More modeling and synthesis were required to make an overview of BIPV projects, which was the study attempt.
The data availability was one of the primary concerns in building selection, such as their 3D sketches and their consumption profiles and other characteristics. Country-specific incentives and the fame of the building also played a role. Consequently, the majority of the projects investigated were located in the EU or other developed countries due to data availability (20–55° N, except one in Sydney, Austria).
Some outliers appeared, as the feed-in tariffs were too low or employed expensive modules. After excluding outliers (5/24), the payback time ranged between 6 and 18 years, with a mean value of 13 years overall, and 10 years for residential and office buildings. Many residential building cases obtained high levels of self-sufficiency (110%). Out of seven residential buildings, the majority (five) were NZEB from the perspective of electrical demand. However, none of the office buildings, and only two of historical buildings, were able to attain NZEB and 100% (or above) self-sufficiency. This could be argued to be due to offices’ high energy demands—greater even than residential buildings. For historical buildings, the design features to be respected led to occasional non-optimized energy yields on BIPV. These two types of buildings could become more energy efficient in the near future through the use of isolation materials of BIPV that could contribute to air conditioning or heating of the building, and light management of the interior—all of which were outside the scope of our study. Another solution to increase self-sufficiency would be to install more capacity over more areas, such as parking spots, etc.
Certain technical aspects, such as degradation of the PV modules or cables, are typically assumed to be included in the maintenance cost, yet a yearly degradation output of 0.5% could be applied—a figure which will not significantly affect the results.
The ROI was based on the LCOE approach, Capex and Opex, as described in Section 2. Assuming that the Capex would already be possessed, loan rates were therefore ignored. Net present value was also investigated for some cases, reaching 8–10 years for a return on investment. In favorable conditions, subventions and government incentives could be used to decrease the projects’ initial costs. For certain projects, the costs were very high, even with mild assumptions.
Additionally, the projects calculated the module installations themselves, and do not consider the avoided material costs of replacing building materials. However, the cost per kWp was typically assumed to be low (300 €/m2), hence BIPVs are likely to be less expensive in the near future when the niche market moves to the mass market [59].
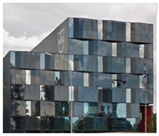
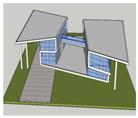
Limitations concerning the software tools for round geometries also restrained certain designs. Figure 7 shows how the students would have liked to create BIPV modules to be installed and that those visually specific modules demanded too much computational power or were not supported by BIMsolar.
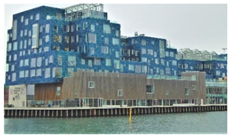
Since the present study was done on existing architectural objects, it is important to stress a need for every solution to be examined from an architectural perspective. Despite the fact that buildings’ south façades could be fully equipped with BIPV, one can expect additional interventions in terms of architectural design (BIPV material choice, color, geometry on roof/façade, etc.). Although this is characteristic for all the three kinds of buildings, i.e., residential, office, and historic (landmark), the last group of buildings is the most sensitive to any changes, including the BIPV additions. This is especially evident for the buildings such as Sydney Opera or “The Gherkin” in London (Figure 7), which represent the major landmark objects of their cities. For such sensitive objects, some innovative BIPV technological solutions and products might be expected (see the example of the Copenhagen International School). Therefore, it is useful to understand that the elaborated examples are not the design solutions but rather BIPV proposals that need to be further discussed by multidisciplinary teams consisting of architects, authors, BIPV producers, representatives of local communities, investors, and others.

5. Conclusions

Twenty-four BIPV projects reported their multicriteria modelling analysis for buildings in 12 countries. Most of the residential projects attained NZEB, while non-residential projects provided an attractive investment return while having specific design features. The cases offered detailed energy modelling, including real or realistic consumption profiles and PV system losses due to heat, shading, cables, mismatch losses, and inverters, etc. Different geographic locations in urban and rural areas were investigated to provide energy balances, such as self-sufficiency and self-consumption ratios. These energy inputs were translated into economic outputs with respect to the country’s incentives and regulations, mapping the feasibility in different countries. Moreover, the BIPV modules employed specific technologies or design features to respect or enhance the environment and facilitate the integration to the building architecture.
It is important to stress that every case considered in the study needs to be negotiated with an architect, be it the author of the architectural design or a representative of the city government, heritage protection body or other relevant institution. In an ideal situation, the BIPV professionals will work together with the architects during the whole process of BIPV design and implementation. The architect’s role would be to protect the appearance characteristics of the BIPV-implemented buildings and prevent functional and visual degradation of a building.
Finally, the modelling approach and the designs take into account aesthetics and were found to be more collaborative amongst architects. Our approach could help accelerate the BIPV project in conceptual phases while increasing its quality regarding the three key aspects, namely energy, cost, and design features.

Author Contributions

Conceptualisation, methodology, validation, C.G., A.R.; software, writing—original draft preparation, visualisation, C.G.; writing—review and editing, C.G., A.R, A.K.-F. and M.D.; supervision, project administration, funding acquisition, A.R. All authors have read and agreed to the published version of the manuscript.

Funding

This research received no external funding.

Acknowledgments

We would like to acknowledge the COST Action Pearl PV for the training school organisation that resulted many inspirations for the BIPV lecture and this project. We would like also to thank our students of BIPV lectures who participated to our lecture.

Conflicts of Interest

The authors declare no conflict of interest.

References

  1. International Energy Agency. Towards a Zero-Emission, Efficient, and Resilient Buildings and Construction Sector: Global Status Report 2017; United Nations Environment Programme: Nairobi, Kenya, 2017; Volume 188, ISBN 978-92-807-3686-1. [Google Scholar]
  2. European Commission; European Parliament. Directive (EU) 2018/844 of the European Parliament and of the Council of 30 May 2018 Amending Directive 2010/31/EU on the Energy Performance of Buildings and Directive 2012/27/EU on Energy Efficiency; European Commission: Brussels, Belgium, 2018. [Google Scholar]
  3. ISO 52000-1. Energy Performance of Buildings–Overarching EPB Assessment–Part 1: General Framework and Procedures; International Organization for Standardization: Geneva, Switzerland, 2017. [Google Scholar]
  4. ISO 52003-1. Energy Performance of Buildings–Indicators, Requirements, Ratings and Certification–Part 1; International Organization for Standardization: Geneva, Switzerland, 2017. [Google Scholar]
  5. ISO 52016-1. EPB—Energy Needs for Heating and Cooling, Internal Temperatures and Sensible and Latent Heat Loads—Part 1: Calculation Procedures; International Organization for Standardization: Geneva, Switzerland, 2017. [Google Scholar]
  6. ISO 52018-1. EPB—Indicators for Partial EPB Requirements Related to Thermal Energy Balance and Fabric Features—Part 1: Overview of Options; International Organization for Standardization: Geneva, Switzerland, 2017. [Google Scholar]
  7. D’Agostino, D.; Zangheri, P.; Cuniberti, B.; Paci, D.; Bertoldi, P. Synthesis Report on the National Plans for Nearly Zero Energy Buildings (NZEBs): Progress of Member States towards NZEBs; Publications Office: Luxembourg, 2016; ISBN 978-92-79-57344-6. [Google Scholar]
  8. EU Commission. Energy Use in Buildings. Available online: https://ec.europa.eu/energy/eu-buildings-factsheets-topics-tree/energy-use-buildings_en (accessed on 6 July 2020).
  9. European Commission. Photovoltaic Geographical Information System. Available online: http://re.jrc.ec.europa.eu/pvg_tools/en/tools.html#MR (accessed on 6 July 2020).
  10. Reinders, A. Photovoltaic technologies: The present state of the art. In Designing with Photovoltaics; Reinders, A., Ed.; CRC Press: New York, NY, USA, 2020; Chapter 2; ISBN 1-351-57855-3. [Google Scholar]
  11. Good, C.; Kristjansdottír, T.; Houlihan Wiberg, A.; Georges, L.; Hestnes, A.G. Influence of PV technology and system design on the emission balance of a net zero emission building concept. Sol. Energy 2016, 130, 89–100. [Google Scholar] [CrossRef]
  12. Bontekoe, E.; van Sark, W.; van Leeuwen, J. Building-Integrated Photovoltaics. In Designing with Photovoltaics; Reinders, A., Ed.; CRC Press: New York, NY, USA, 2020; Chapter 5; pp. 127–163. [Google Scholar]
  13. Domjan, S.; Petek, L.; Arkar, C.; Medved, S. Experimental Study on Energy Efficiency of Multi-Functional BIPV Glazed Façade Structure during Heating Season. Energies 2020, 13, 2772. [Google Scholar] [CrossRef]
  14. Nordmann, T. Built-in future: Integration, technical and market-development issues for PV. Renew. Energy World 2005, 8, 236, 238, 240, 242, 244–247. [Google Scholar]
  15. Krstic-Furundzic, A. PV Integration in Design of New and Refurbishment of Existing Buildings: Educational Aspect. JAAUBAS-J. Assoc. Arab Univ. Basic Appl. Sci. 2006, 4, 135–146. [Google Scholar]
  16. PVSITES. Building-Integrated Photovoltaic Technologies and Systems for Large-Scale Market Deployment. Available online: https://cordis.europa.eu/project/id/691768 (accessed on 18 June 2020).
  17. EU Commission. Overview: Building Integrated Photovoltaics (BIPV) as a Viable Option among Renewables. Available online: https://www.buildup.eu/en/news/overview-building-integrated-photovoltaics-bipv-viable-option-among-renewables (accessed on 6 July 2020).
  18. PVSITES. BIPV Market and Stakeholder Analysis and Needs; PVSITES Consortium: Donostia-San Sebastian, Spain, 2016. [Google Scholar]
  19. Reinders, A. Designing with Photovoltaics; CRC Press: New York, NY, USA, 2020; ISBN 978-1-351-57855-4. [Google Scholar]
  20. Gercek, C.; Reinders, A. Design Case 6: PV-Powered Charging Station for E-Bikes. In Designing with Photovoltaics; Reinders, A., Ed.; CRC Press: New York, NY, USA, 2020; pp. 127–163. [Google Scholar]
  21. Kristic-Furundzic, A.; Kosoric, T.; Terzovic, J. Influence of Glass Component Joints on the Structural Glass Façade Design. In Keeping up with Technologies to Improve Places; Vaništa Lazarević, E., Vukmirovic, M., Krstić-Furundžić, A., Đukić, A., Eds.; Cambridge Scholars Publishing: Newcastle upon Tyne, UK, 2015; Chapter 17; ISBN 978-1-4438-8477-8. [Google Scholar]
  22. Spiegel, M.; Bucher, E.; Willeke, G. Colored Antireflection Coatings for High Efficiency PV Modules. In Proceedings of the 4th European Conference on Solar Energy in Architecture and Urban Plannin, Berlin, Germany, 26–29 March 1996. [Google Scholar]
  23. Heinstein, P.; Ballif, C.; Perret-Aebi, L.-E. Building Integrated Photovoltaics (BIPV): Review, Potentials, Barriers and Myths. Green 2013, 3. [Google Scholar] [CrossRef]
  24. Vuong, E.; Kamel, R.S.; Fung, A.S. Modelling and Simulation of BIPV/T in EnergyPlus and TRNSYS. Energy Procedia 2015, 78, 1883–1888. [Google Scholar] [CrossRef] [Green Version]
  25. Robledo, J.; Leloux, J.; Lorenzo, E.; Gueymard, C.A. From video games to solar energy: 3D shading simulation for PV using GPU. Sol. Energy 2019, 193, 962–980. [Google Scholar] [CrossRef]
  26. Aksamija, A. and Mallasi, Z. Building performance predictions: How Simulations Can Improve Design Decisions. Perkins Will Res. J. 2010, 2, 7–31. [Google Scholar]
  27. Google Maps Street View: Frodeparken, Upsala, 56 Stationsgatan. Available online: https://www.google.com/maps/@59.8565239,17.6532143,3a,75y,351.55h,97.76t/data=!3m6!1e1!3m4!1sG5yNwNq0HuKZ3LrL-sA_AQ!2e0!7i16384!8i8192 (accessed on 9 July 2020).
  28. Crystal, S. 3D Warehouse: Dutch Canal Houses (Nederlandse Grachten Panden). Available online: https://3dwarehouse.sketchup.com/model/u71bb6d41-699c-4bdc-a187-450e3cf347b5/Dutch-Canal-Houses-Nederlandse-Grachten-Panden (accessed on 9 July 2020).
  29. Google Earth Infinity Building. ING House, Amsterdam. Available online: http://www.earth.google.com (accessed on 9 July 2020).
  30. University of Twente Facts & Figures 2018. Available online: https://www.utwente.nl/en/facts-and-figures/#organization (accessed on 6 May 2019).
  31. Jørgensen, L. English: Copenhagen International School at Levantkaj in Nordhavn in Copenhagen. Available online: https://commons.wikimedia.org/wiki/File:Copenhagen_International_School_01.jpg (accessed on 9 July 2020).
  32. Yinping, D.; Morales, M. Building Integrated Photovoltaics Project Report 1; University of Twente: Enschede, The Netherlands, 2019; p. 50. [Google Scholar]
  33. Google Maps Street View: Edison Plaza, Baumont, Texas. Available online: https://www.google.com/maps/@30.085037,-94.0978206,3a,75y,46.89h,118.53t/data=!3m7!1e1!3m5!1svkVEPqJDqPC4ACgi5gHDJg!2e0!6s%2F%2Fgeo1.ggpht.com%2Fcbk%3Fpanoid%3DvkVEPqJDqPC4ACgi5gHDJg%26output%3Dthumbnail%26cb_client%3Dmaps_sv.tactile.gps%26thumb%3D2%26w%3D203%26h%3D100%26yaw%3D167.07332%26pitch%3D0%26thumbfov%3D100!7i13312!8i6656 (accessed on 9 July 2020).
  34. Google Maps Street View: Logistic Centre V-Zug, Solarchitecture. Available online: https://www.google.com/maps/place/Zug,+V-Zug/@47.1809777,8.5211311,3a,75y,50.6h,90t/data=!3m7!1e1!3m5!1s1VuaKU37x9XuqSsMh9LUCw!2e0!6s%2F%2Fgeo2.ggpht.com%2Fcbk%3Fpanoid%3D1VuaKU37x9XuqSsMh9LUCw%26output%3Dthumbnail%26cb_client%3Dmaps_sv.tactile.gps%26thumb%3D2%26w%3D203%26h%3D100%26yaw%3D50.59597%26pitch%3D0%26thumbfov%3D100!7i13312!8i6656!4m12!1m6!3m5!1s0x479aaa500f5947e5:0x8b34e3de17731d98!2sV-ZUG+AG+Hauptsitz!8m2!3d47.1820954!4d8.5229538!3m4!1s0x0:0xbc2de8b6c18520af!8m2!3d47.1809899!4d8.5211822 (accessed on 9 July 2020).
  35. Ayres, R. Rotterdam Cube House Street View. Available online: https://commons.wikimedia.org/wiki/File:Rotterdam_Cube_House_street_view.jpg (accessed on 9 July 2020).
  36. Gareth, J. File: The Sage, Gateshead. Available online: https://commons.wikimedia.org/wiki/File:The_Sage,_Gateshead_(geograph_3639399).jpg (accessed on 9 July 2020).
  37. Hzh Tottenham Hotspur Stadium. Available online: https://commons.wikimedia.org/wiki/File:Tottenham_Hotspur_Stadium_March_2019_-_view_from_east.jpg (accessed on 9 July 2020).
  38. Desai, N.; Halpern-Wight, N.; Pappu, A. Building Integrated Photovoltaics Project Report 2; University of Twente: Enschede, The Netherlands, 2019; p. 40. [Google Scholar]
  39. Sepp, S.; Amsterdam Centraal Station. A “Sprinter” Type Train of the Nederlandse Spoorwegen Is Visible on the Foreground. Picture Taken from Central Library at Oosterdokseiland. Available online: https://commons.wikimedia.org/wiki/File:Amsterdam_centraal_side.jpg (accessed on 8 July 2020).
  40. Nasimebadgir Dubai Frame. Available online: https://commons.wikimedia.org/wiki/File:Dubaiframe.jpg (accessed on 9 July 2020).
  41. Romero, F. Schiemond. Lloydstraat with the Construction of the Shipping and Transport College, Courses Formerly Spread Throughout the City Have Been Given a Prominent Place. The STC Boosts the Declining Numbers of Students in Secondary and Higher Maritime Education. Arch. Neutelings Riedijk Architecten 2000–2005. Available online: https://commons.wikimedia.org/wiki/File:Rotterdam_-_Scheepvaart_en_Transport_College.jpg (accessed on 9 July 2020).
  42. Romero, F. Amsterdam—Symphony Office Tower & Symphony Amsterdam. Available online: https://commons.wikimedia.org/wiki/File:Amsterdam_-_Symphony_Office_Tower_%26_Symphony_Amsterdam_(30214043291).jpg (accessed on 9 July 2020).
  43. Quistnix Aerial Photograph of the Amsterdam ArenA, Roof Open. Available online: https://commons.wikimedia.org/wiki/File:Amsterdam_Arena_Roof_Open.jpg (accessed on 9 July 2020).
  44. O’Young, M. Taiwan National Stadium Sculpted from Concrete, Steel, and BIPV Panels-GAB Report. Available online: https://www.gabreport.com/taiwan-national-stadium-sculpted-from-concrete-steel-and-bipv-panels (accessed on 10 July 2020).
  45. Nitnaware, P.; Paul, D. Building Integrated Photovoltaics Project Report 3; University of Twente: Enschede, The Netherlands, 2019; p. 33. [Google Scholar]
  46. Klink, A. English: Swiss-Re-Tower (Gherkin) in Southark, London, UK. 2008. Available online: https://commons.wikimedia.org/wiki/File:Swiss_Re_Tower_(Gherkin)_London_UK.png (accessed on 24 November 2020).
  47. Adam, J.W.C. Sydney Opera House, Botanic Gardens. Available online: https://commons.wikimedia.org/wiki/File:Sydney_Opera_House,_botanic_gardens_1.jpg (accessed on 10 July 2020).
  48. Farrag, N.M.; Omran, S. Designing a Building Integrated Photovoltaic System (Bipv) for Residential Façade: Case Study in Egypt. J. Eng. Appl. Sci. 2006, 12, 22. [Google Scholar]
  49. Doldersum, R.; Testori, G. Building Integrated Photovoltaics Project Report 7; University of Twente: Enschede, The Netherlands, 2019; p. 38. [Google Scholar]
  50. PVSITES BIMsolar & PVSITES Plugins. Available online: https://www.pvsites.eu/software/ (accessed on 24 November 2020).
  51. Quintana, S.; Huang, P.; Saini, P.; Zhang, X. A preliminary techno-economic study of a building integrated photovoltaic (BIPV) system for a residential building cluster in Sweden by the integrated toolkit of BIM and PVSITES. Intell. Build. Int. 2020, 1–19. [Google Scholar] [CrossRef]
  52. EnerBIM BIPV-Insight. Available online: http://www.bim-solar.com/index.php?Page=software_documentation (accessed on 24 November 2020).
  53. Liander Public Data (Beschikbare Data). Available online: https://www.liander.nl/partners/datadiensten/open-data/data (accessed on 24 November 2020).
  54. US Departement of Energy Datasets. OpenEI DOE Open Data. Available online: https://openei.org/doe-opendata/dataset?sectors=buildings (accessed on 24 November 2020).
  55. Budding, D.; van den Bogaard, W.; Beckers, K. Building Integrated Photovoltaics Project Report 6; University of Twente: Enschede, The Netherlands, 2019; p. 41. [Google Scholar]
  56. Kameleon Solar About ColorBlast. Available online: https://kameleonsolar.com/about-colorblast/ (accessed on 24 November 2020).
  57. Tesla Solarglass Roof. Available online: https://www.tesla.com/solarroof (accessed on 24 November 2020).
  58. European Renewable Energy Federation. PV Prosumer Guidelines for Eight EU Member States; EREF: Brussels, Belgium, 2019. [Google Scholar]
  59. Bonomo, P.; Chatzipanagi, A.; Frontini, F. Overview and analysis of current BIPV products: New criteria for supporting the technological transfer in the building sector. Vitruvio 2015, 67. [Google Scholar] [CrossRef] [Green Version]
Figure 1. Summary of the modelling steps, data analysis, and evaluation of the projects.
Applsci 10 08860 g001
Figure 2. Amsterdam canal house (a), the subject is the highest building (middle), the brick-form BIPV panels (b) and tiles representative of the roof tiles (c). The curved structure of conventional tiles is ignored for the computational purposes.
Applsci 10 08860 g002
Figure 3. Average irradiance over the group of buildings (a), transparent BIPV windows (b) wiring of the BIPV cells and modules (c).
Applsci 10 08860 g003
Figure 4. Annual BIPV production per photovoltaic (PV) nominal capacity installed for three types of buildings.
Applsci 10 08860 g004
Figure 5. Self-Consumption (a) and self-sufficiency (b) ratios in percentages for three types of buildings.
Applsci 10 08860 g005
Figure 6. Return of investment (a) and capital expenditure (b) for three types of buildings.
Applsci 10 08860 g006
Figure 7. “The Gherkin” London, UK [46] and the BIPV modules designed for this building [45].
Applsci 10 08860 g007
Table 1. Buildings selected per group of students for building integrated photovoltaic (BIPV) projects (image references, respectively: [27,28,29,30,31,32,33,34,35,36,37,38,39,40,41,42,43,44,45,46,47,48,49]).
Case InvestigationResidential BuildingsOffice BuildingsLandmark, Historical or Diverse Buildings
Frodeparken, Uppsala, SwedenHistorical canal house, AmsterdamInfinity Building, AmsterdamSpiegel, University of Twente
Applsci 10 08860 i001 Applsci 10 08860 i002 Applsci 10 08860 i003 Applsci 10 08860 i004
Copenhagen international schoolHousehold in Silverton, UKEdison plaza, Texas, USASecondary School, Hong Kong
Applsci 10 08860 i005 Applsci 10 08860 i006 Applsci 10 08860 i007 Applsci 10 08860 i008
Logistic center V-zugCube House RotterdamSage Gateshead, UKTottenham Hotspur Stadium, UK
Applsci 10 08860 i009 Applsci 10 08860 i010 Applsci 10 08860 i011 Applsci 10 08860 i012
The Solar Ark Anpachi, JapanDutch mansion (non-existing building)Military Base, USA
(non-existing building)
Amsterdam Central Station
Applsci 10 08860 i013 Applsci 10 08860 i014 Applsci 10 08860 i015 Applsci 10 08860 i016
Dubai FrameSTC, RotterdamSymphonie tower, Amsterdam Johan Cruijff Arena, Amsterdam
Applsci 10 08860 i017 Applsci 10 08860 i018 Applsci 10 08860 i019 Applsci 10 08860 i020
Taiwan National StadiumResidential, Florida, USA“The Gherkin” London, UKSydney Opera House, Australia
Applsci 10 08860 i021 Applsci 10 08860 i022 Applsci 10 08860 i023 Applsci 10 08860 i024
Villa, EgyptAverage Dutch Household, NLOffice, Hengelo, NLWembley Stadium, UK
Applsci 10 08860 i025 Applsci 10 08860 i026 Applsci 10 08860 i027 Applsci 10 08860 i028
Table 2. Residential projects—design specifications and numerical results in terms of energy and financial aspects.
RESIDENTIAL
Design FeaturesEnergy AspectsFinancial Aspects
LocationNameBIPV ApplicationSpecial Features
No buildingCity, Country,
GPS coordinates
(o) opaque
(t) transparent
H (kWh/m2·year)
Pnom
(kW)
EPV
(MWh)
SCR (%)SSR (%)ROI (years)Capex (k€)Import tariff (c€/kWh)
Feed in tariff (c€/kWh)
LCOE (c€/kWh)
1Silverton, UK;
50°48′N, 3°29′ W
A common household in UK(o) facade and roof
(t) windows
Battery (6 kWh), Generated load profile1200109.840984620146
2Amsterdam, NL;
52°37′N, 4°90′ E
Mansion(o) facade (t) windowsScaled load profile98012.25.78269729402323
3Florida, US;
28°08′N, 82°63′ W
Waterchase(o) all 20001016.81411082111167
4Rotterdam, NL;
51°92′N, 4°49′ E
Cube House(o) all 115053 103.4
5Amsterdam, NL;
52°22′N, 4°53′ E
Common house(o) facade and roof (t) windows 9809.67.6101801812
6Malaga, ES;
36°72′N, 4°42′ W
Typical summer house(o) facade and roof (t)windows 17008.31061116.1 23207
7Amsterdam NL
52°37′N, 4°90′ E
Dutch average terrace house(o)facade and roof (t)windowsOriginal load profile9803220 8.53.323237.3
Table 3. Office building projects—design specifications and numerical results in terms of energy and financial aspects.
OFFICE
Design FeaturesEnergy AspectsFinancial Aspects
LocationNameBIPV ApplicationSpecial Features
No buildingCity, Country,
GPS coordinates
(o) opaque
(t) transparent
H
(kWh/m2·year)
Pnom
(kW)
EPV
(MWh)
SCR (%)SSR (%)ROI (years)Capex (k€)Import tariff (c€/kWh)
Feed in tariff (c€/kWh)
LCOE (c€/kWh)
8Baumont, US
30°09′N, 94°10′ W
Edison Plaza(o) facade and roofScaled load profile based on m22000580700981013.6970 k$10 c$8 c$
9Esopus, New York
41°83′N, 73°97′ W
Military base(o) roofMilitary base flat load14408271000832581470 k$
10London, UK
51°51′N, 0°08′ W
The Gherkin(o) facade and roof (t) windowsScaled load profile800485203993>20485155.326
11Gateshead, UK
54°97′N, 1°60′ W
Sage Gateshead(t) all 980670510 412389216.316.3
12Rottterdam NL
51°90′N, 4°46′ W
STC Iloystraat(o) facade and roof (t) windowsResidential and office mix profile9803602669912181462
13Amsterdam, NL
52°20′N, 4°51′ W
Infinity (ING house)(o) facade and roof (t) windowsTriple glazing9801801219915717523239,5
14Hengelo, NL
51°14′N, 6°51′ E
Typical Office(o) facade and roof (t) windows 9806348 6.568231211
Table 4. Historical building and diverse projects—design specifications and numerical results in terms of energy and financial aspects.
HISTORICAL AND DIVERSE
Design FeaturesEnergy Aspects Financial Aspects
LocationNameBIPV ApplicationSpecial Features
No buildingGPS coordinates (o)opaque
(t)transparent
H
(kWh/m2. year)
Pnom
(kW)
EPV
(MWh)
SCR (%)onSSR (%)ROI (years)Capex (k€)Import tariff (c€/kWh)
Feed in tariff (c€/kWh)
LCOE (c€/kWh)
15Hongkong;
23°32′N, 114°18′ E
King George V School(o) façade, roofMultiple buildings1500770100095151314001334
16Amsterdam, NL;
52°38′N, 4°90′ E
Central train station(t) skylight (o) canopySpecial modules9805800370099.9315.410000
17Sydney, AUS;
33°86′S, 151°22′ E
Sydney Opera(o) roof (t) façadeWhite modules17802253078537255172710
18London, UK;
51°60′N, 0°07′ W
Tottenham Hotspur(o) roof 98032252500 12292416.36
19Amsterdam, NL;
51°51′N, 0°08′ W
Johan Cruijff Arena(o) façade, roof 98030001440 100183124 6
20Amsterdam, NL;
52°22′N, 4°53′ W
Canal House(o) façade, roof (t)windows 9801583313816.622.4232317
21London, UK;
51°56′N, 0°28′ W
Wembley(o) façade and roofSpecial modules800126082799.3314 153
22Enschede, NL;
52°24′N, 6°85′ E
Spiegel, Univ. of Twente(o) façade, roof 98024313473439.9245232310
23Manchester, UK;
53°46′N, 2°29′ W
Old Trafford Stadium(o) façade, roof
(t) windows
1000577737003410046 5.96
24Amsterdam, NL;
52°24′N, 6°85′ E
Symphony Residential(o) façade and roofResiden-tial load 1500100095151314001334
Publisher’s Note: MDPI stays neutral with regard to jurisdictional claims in published maps and institutional affiliations.