1. Introduction
The gas–solid two-phase flow resulting from interactions between a shock wave and solid particles is highly complex and difficult to observe experimentally [
1,
2]. However, workable knowledge regarding this process has numerous practical applications. For example, the fire-extinguishing bullet is filled with solid fire-extinguishing powder, and the dispersion uniformity of the solid powder directly affects the fire-fighting effect in practice [
3]. In industrial explosion accidents, it can effectively abate the accident hazards and reduce the probability of secondary explosion by preventing the hoisting of combustible dust particles on the ground that is caused by the shock wave [
4,
5]. The fuel air explosive (FAE) that appeared in the Vietnam War marked a notable advancement in conventional weapons. The fuel’s dispersion range and particle concentration distribution during the explosion of solid FAE are the major factors influencing the explosive power [
6,
7].
Many previous researchers have investigated compressible gas–solid two-phase flows, and particularly the interactions between shock waves and particles. Rogue et al. [
6] used shadow photography systems to observe the flow fields of particle swarms driven by shock waves under various Mach numbers. They conducted numerical simulations using the finite difference method; their results were repeated in a physical experiment. Zhang et al. [
7] employed hybrid explosives to investigate the rapid dispersion of solid particles. They observed the interactions between shock waves and solid particles via high-speed camera. Boiko et al. and Kiselev et al. [
8,
9] studied the diffusion and attenuation of shock waves propagating amid solid particles, then analyzed the formation mechanism of reflected shock waves. In addition, the shock wave diffraction process may be numerically simulated to explore the interactions between shock waves and single particles [
10,
11]. Parmar et al. [
12,
13], Ling et al. [
14,
15,
16], and Sridharan et al. [
17] adopted body-fitted grids in their numerical analyses of fluid/single-particle interactions, providing workable insight into the unsteady force and heat transfer of shock interacting with deformable particles.
In the previous studies [
18,
19,
20,
21,
22,
23], plenty of meaningful research results have been acquired. However, there are still many aspects that can be further improved. For instance, a limited number of test parameters were usually captured experimentally, but it was difficult to obtain detailed flow field information, especially for the three-dimensional vortex structure generated by shock waves. Furthermore, many numerical investigations were conducted on a single particle, but there has been little study on the entire particle groups, which has not been conducive to further understanding the movement characteristics of the solid particles.
Therefore, in this paper, theoretical analysis, shock tube experiments, and computational fluid dynamic (CFD) simulation were combined to study the interaction process between a shock wave and solid quartz sand particles of different sizes. The detailed information of particle motion and flow field evolution during the gas–solid two-phase flow was obtained, and the complex physical phenomenon and formation mechanism considered in depth. This work may facilitate a more comprehensive understanding of the interaction mechanism of gas–solid two-phase flow, which has practical significance in terms of dust explosion safety protection, FAE weaponry, and similar applications.
2. Experimental (Vertical Shock Tube Generator)
The shock wave experiments were carried out using a self-designed vertical shock tube generator, which mainly consists of a shock tube, a high-speed camera system, and a pressure test system. The structure of the entire experiment system is shown in
Figure 1.
As depicted in
Figure 1, the inner diameter of the vertical shock tube used in this paper is 16 mm. The metal mesh for holding the solid particles is placed above the low-pressure section of the shock tube, which is connected to the atmosphere. The top of the high-pressure section is separated from the low-pressure section by a diaphragm, and the bottom is connected to the high-pressure gas cylinder through a valve. After the gas in the high-pressure section breaks through the diaphragm, a shock wave with a certain Mach number will be generated and act on the solid particles. Two piezoelectric pressure sensors (P
1 and P
2) are installed on the inner wall and above the shock tube, to study the pressure attenuation after the shock wave interacted with the solid particles. The 113A21 pressure sensors with a Full Scale (FS) of 100 psi are from the PCB Company (Buffalo, New York, USA). The resonant frequency is greater than 250 kHz, and the calibrated nonlinearity is less than 1% FS. The distance between the two pressure sensors is 100 mm. The propagation speed of the shock wave can be determined by the distance between the pressure sensors at different positions and the time of receiving the pressure signal.
In addition, a high-speed camera system is arranged outside the shock tube, which adopts the Fast-camultima APX high-speed camera from the Photron Company (Kyoto, Japan), with a maximum shooting speed of 5000 fps. It is used to capture the dispersion of solid particles, to provide the motion trajectory of solid particles under the action of the shock wave and the corresponding flow field parameters.
During the experiments, the solenoid valve of the gas cylinder is opened through the controller, and then the high-pressure driving section of the shock tube is inflated and pressurized. When the pressure exceeds the ultimate pressure of the diaphragm, the diaphragm breaks and a shock wave is generated in the tube, which disperses the particles. When the pressure sensor catches the pressure signal, it automatically triggers the high-speed camera system to capture the interaction between the shock wave and solid particles.
3. Numerical Model
3.1. Geometric Model and Mesh
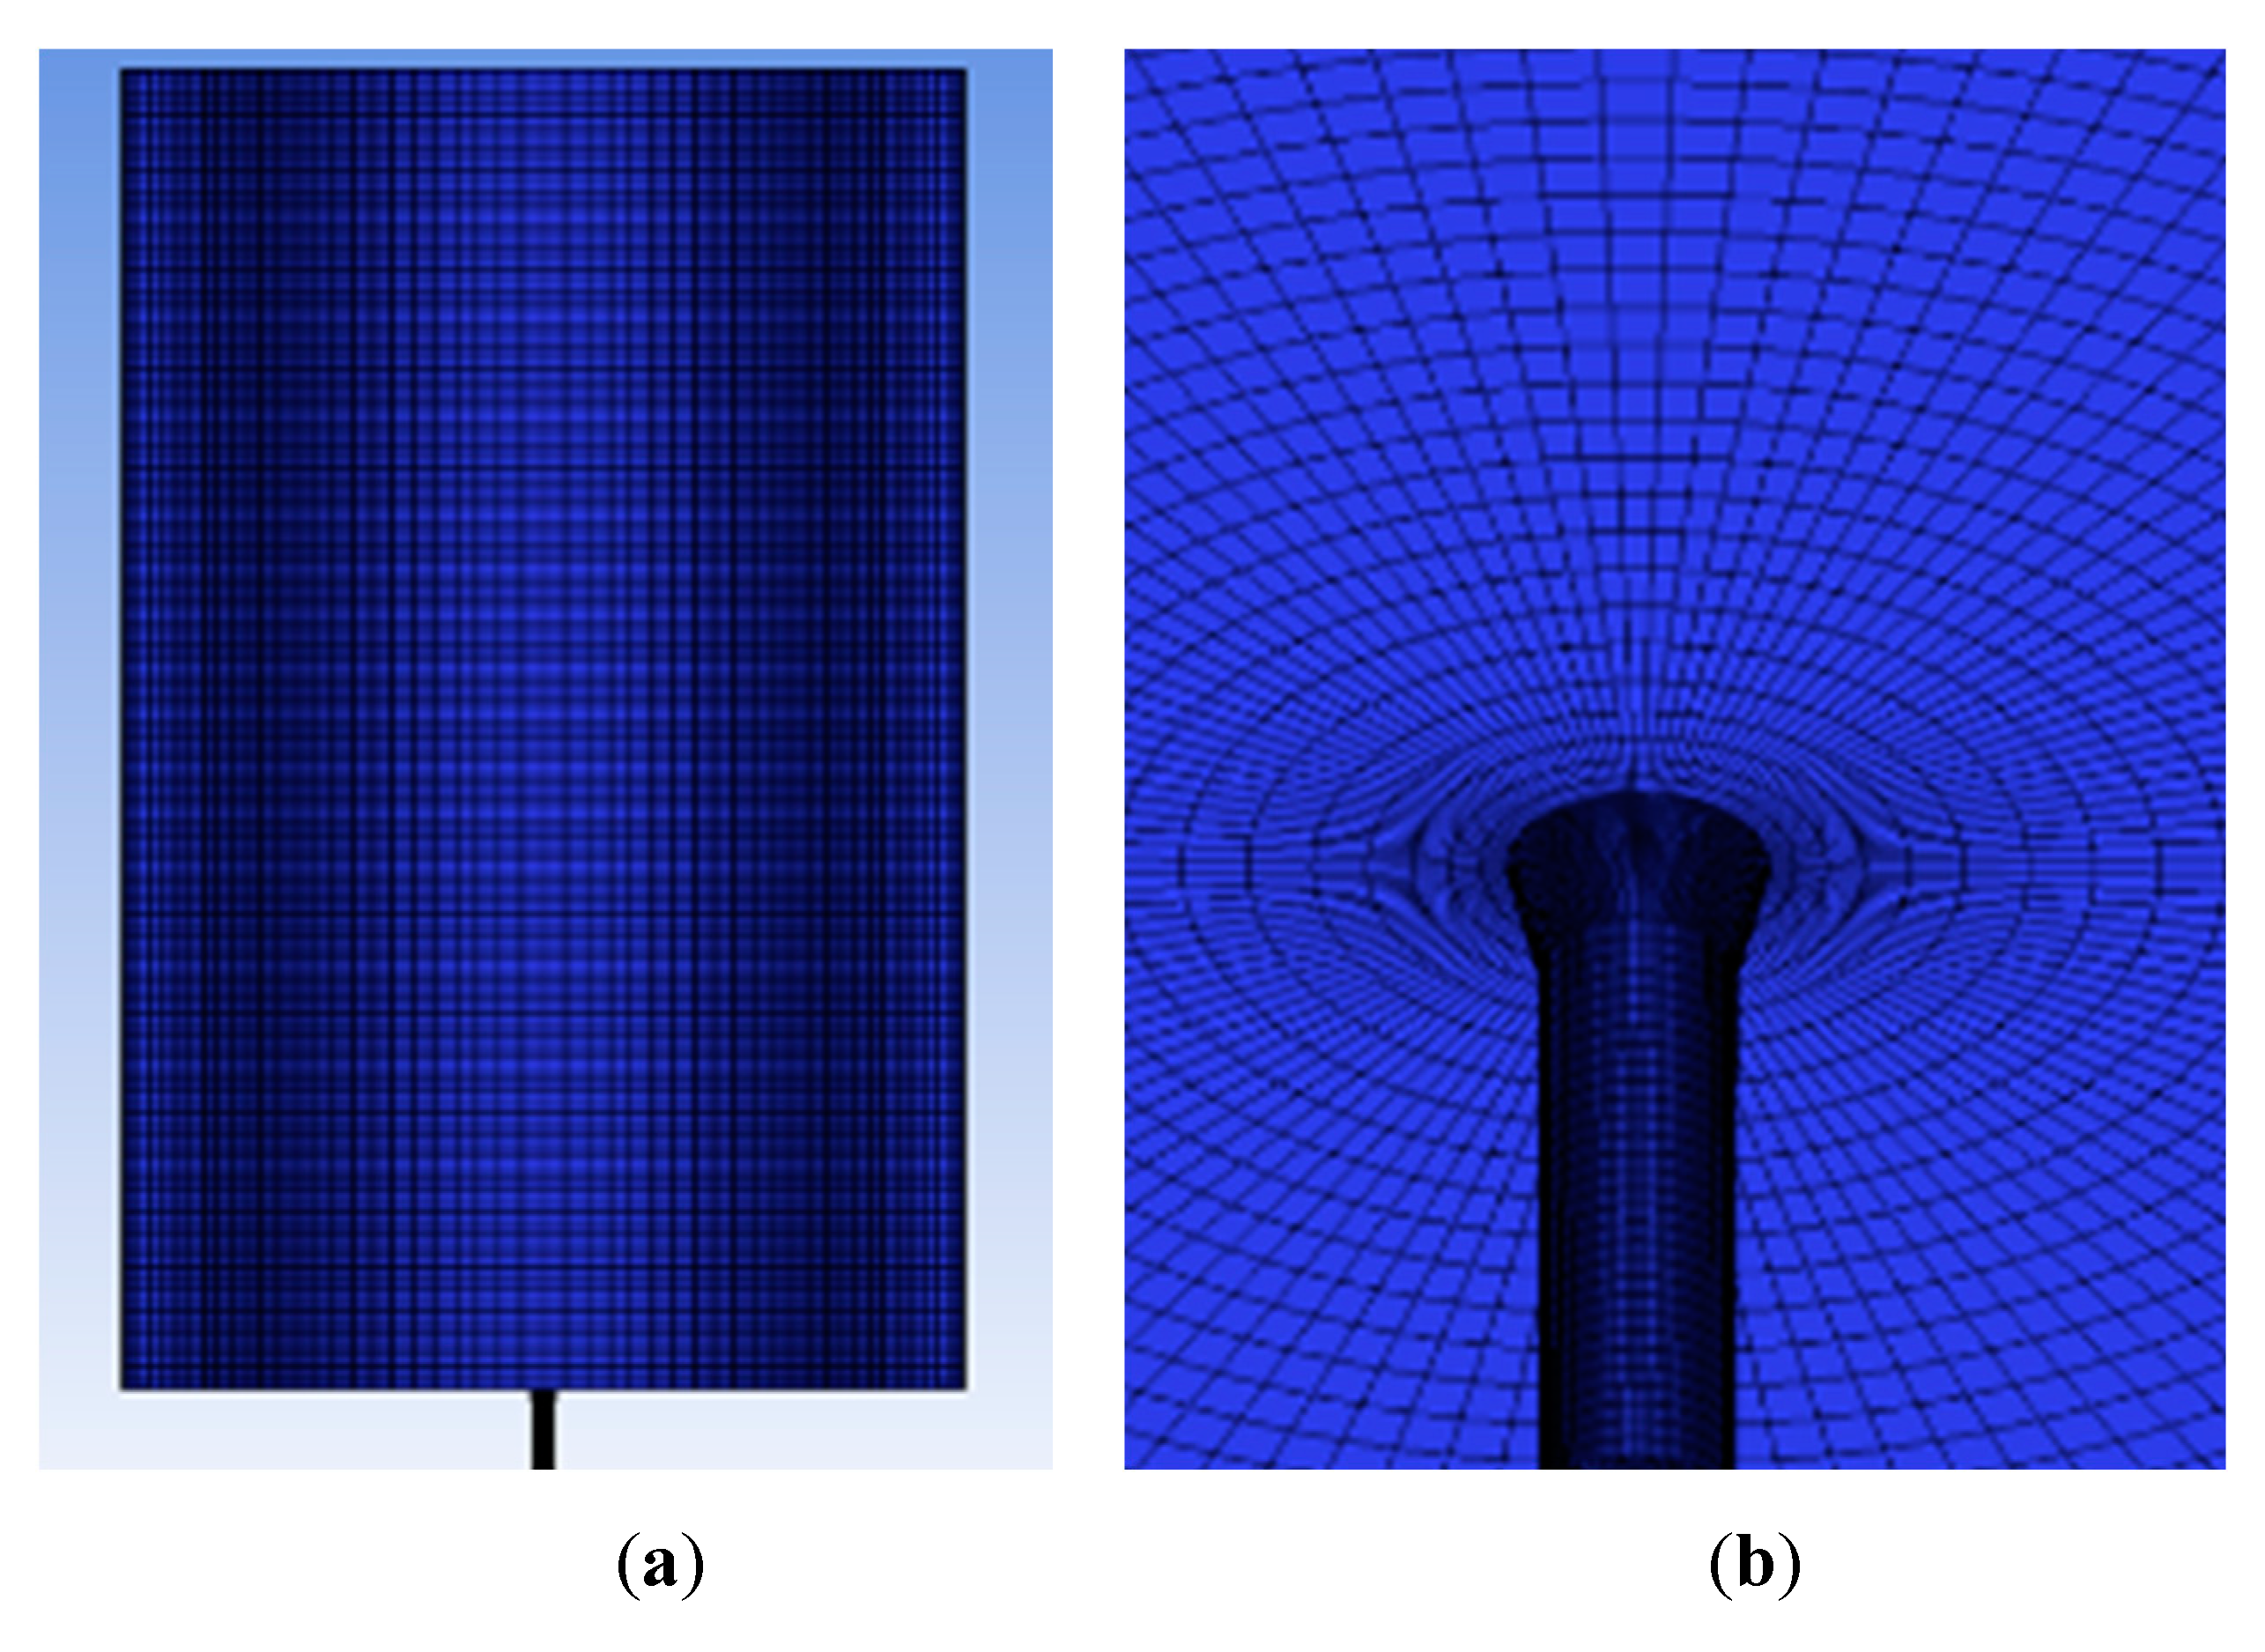
To study the fluid dynamic behavior outside the shock tube, an entire computational domain was modeled, including the shock tube and the larger external space. The three-dimensional geometric model was meshed to discretize the computational domain and governing equations in the numerical simulation. The inner diameter of the shock tube model was 16 mm, which was consistent with the experimental conditions. The external space was 300 mm in diameter and 600 mm in height. The hexahedral mesh of the entire computational domain and shock tube constructed by topological segmentation is shown in
Figure 2. The mesh was refined near the tube and particle layer to accurately capture the interaction between the shock wave and solid particles. Three different mesh sizes were tested for the calculation (463,582, 1,223,040, and 2,184,768 elements). It was found that the calculation results with 1,223,040 elements was acceptable.
The Jacobian matrix is one of the most important criteria of hexahedral mesh quality. The relative determinant is the ratio of the smallest determinant of the Jacobian matrix divided by the largest determinant of the Jacobian matrix; the mesh quality is better when the value is closer to 1. As shown in
Figure 3, the relative determinant for the global mesh in the simulation was above 0.669, which indicates the hexahedral mesh was of high quality.
3.2. Governing Equations
Three-dimensional compressible Navier–Stokes equations were established based on conservation of mass, momentum, and energy [
24,
25,
26]. The CFD software SC/Tetra was used to simulate the gas–solid two-phase flow of solid quartz sand particles driven by the shock wave. The air was described by the Euler method; the solid particles were described by the Lagrange method. The governing equations are written as follows.
Mass conservation equation:
Momentum conservation equation:
Energy conservation equation:
Gas state equation:
where
is the density of air;
is the time;
is the velocity of the
direction;
is the stress tensor;
is viscosity;
is the specific enthalpy;
is the gravity;
is the temperature;
is the thermal conductivity;
is the heat source;
P is the pressure; and
is the gas constant.
In addition, during the momentum exchange between the shock wave and the solid particles, a drag force is generated, which manifests that the particles get an initial velocity and disperse outwards. To accurately calculate the drag force of shockwave on particles, it was defined as a function of the Reynolds number (Re), and the coupling effect between the gas and solid phases considered simultaneously. The equilibrium equations of particle force during the interaction process are as follows:
where
is the velocity of air;
is the velocity of particle;
is particle density;
is the particle diameter;
is the drag coefficient;
is the relaxation time;
is the additional acceleration (force/unit particle mass) term; and
a1,
a2, and
a3 are constants.
The
–
turbulent model was adopted to describe the turbulence phenomena in the numerical simulation. It is an empirical model based on model transport equations for the turbulence kinetic energy
and the specific dissipation rate
[
27].
The turbulence kinetic energy
and specific dissipation rate
can be obtained from the following transport equations:
where
is the generation of turbulence kinetic energy due to mean velocity gradients;
is the generation of
;
and
represent the effective diffusivity of
and
and
are the dissipation of
and
due to turbulence; and
and
are user-defined source terms.
4. Results and Discussion
4.1. Theoretical Analysis of the Interaction between the Shock Wave and Particles
Energy and momentum are exchanged and depleted in the interaction between the shock wave and solid particles, thus causing a change in the flow field. The variation of flow field is mainly determined by parameters such as shock intensity, particle size, and particle properties.
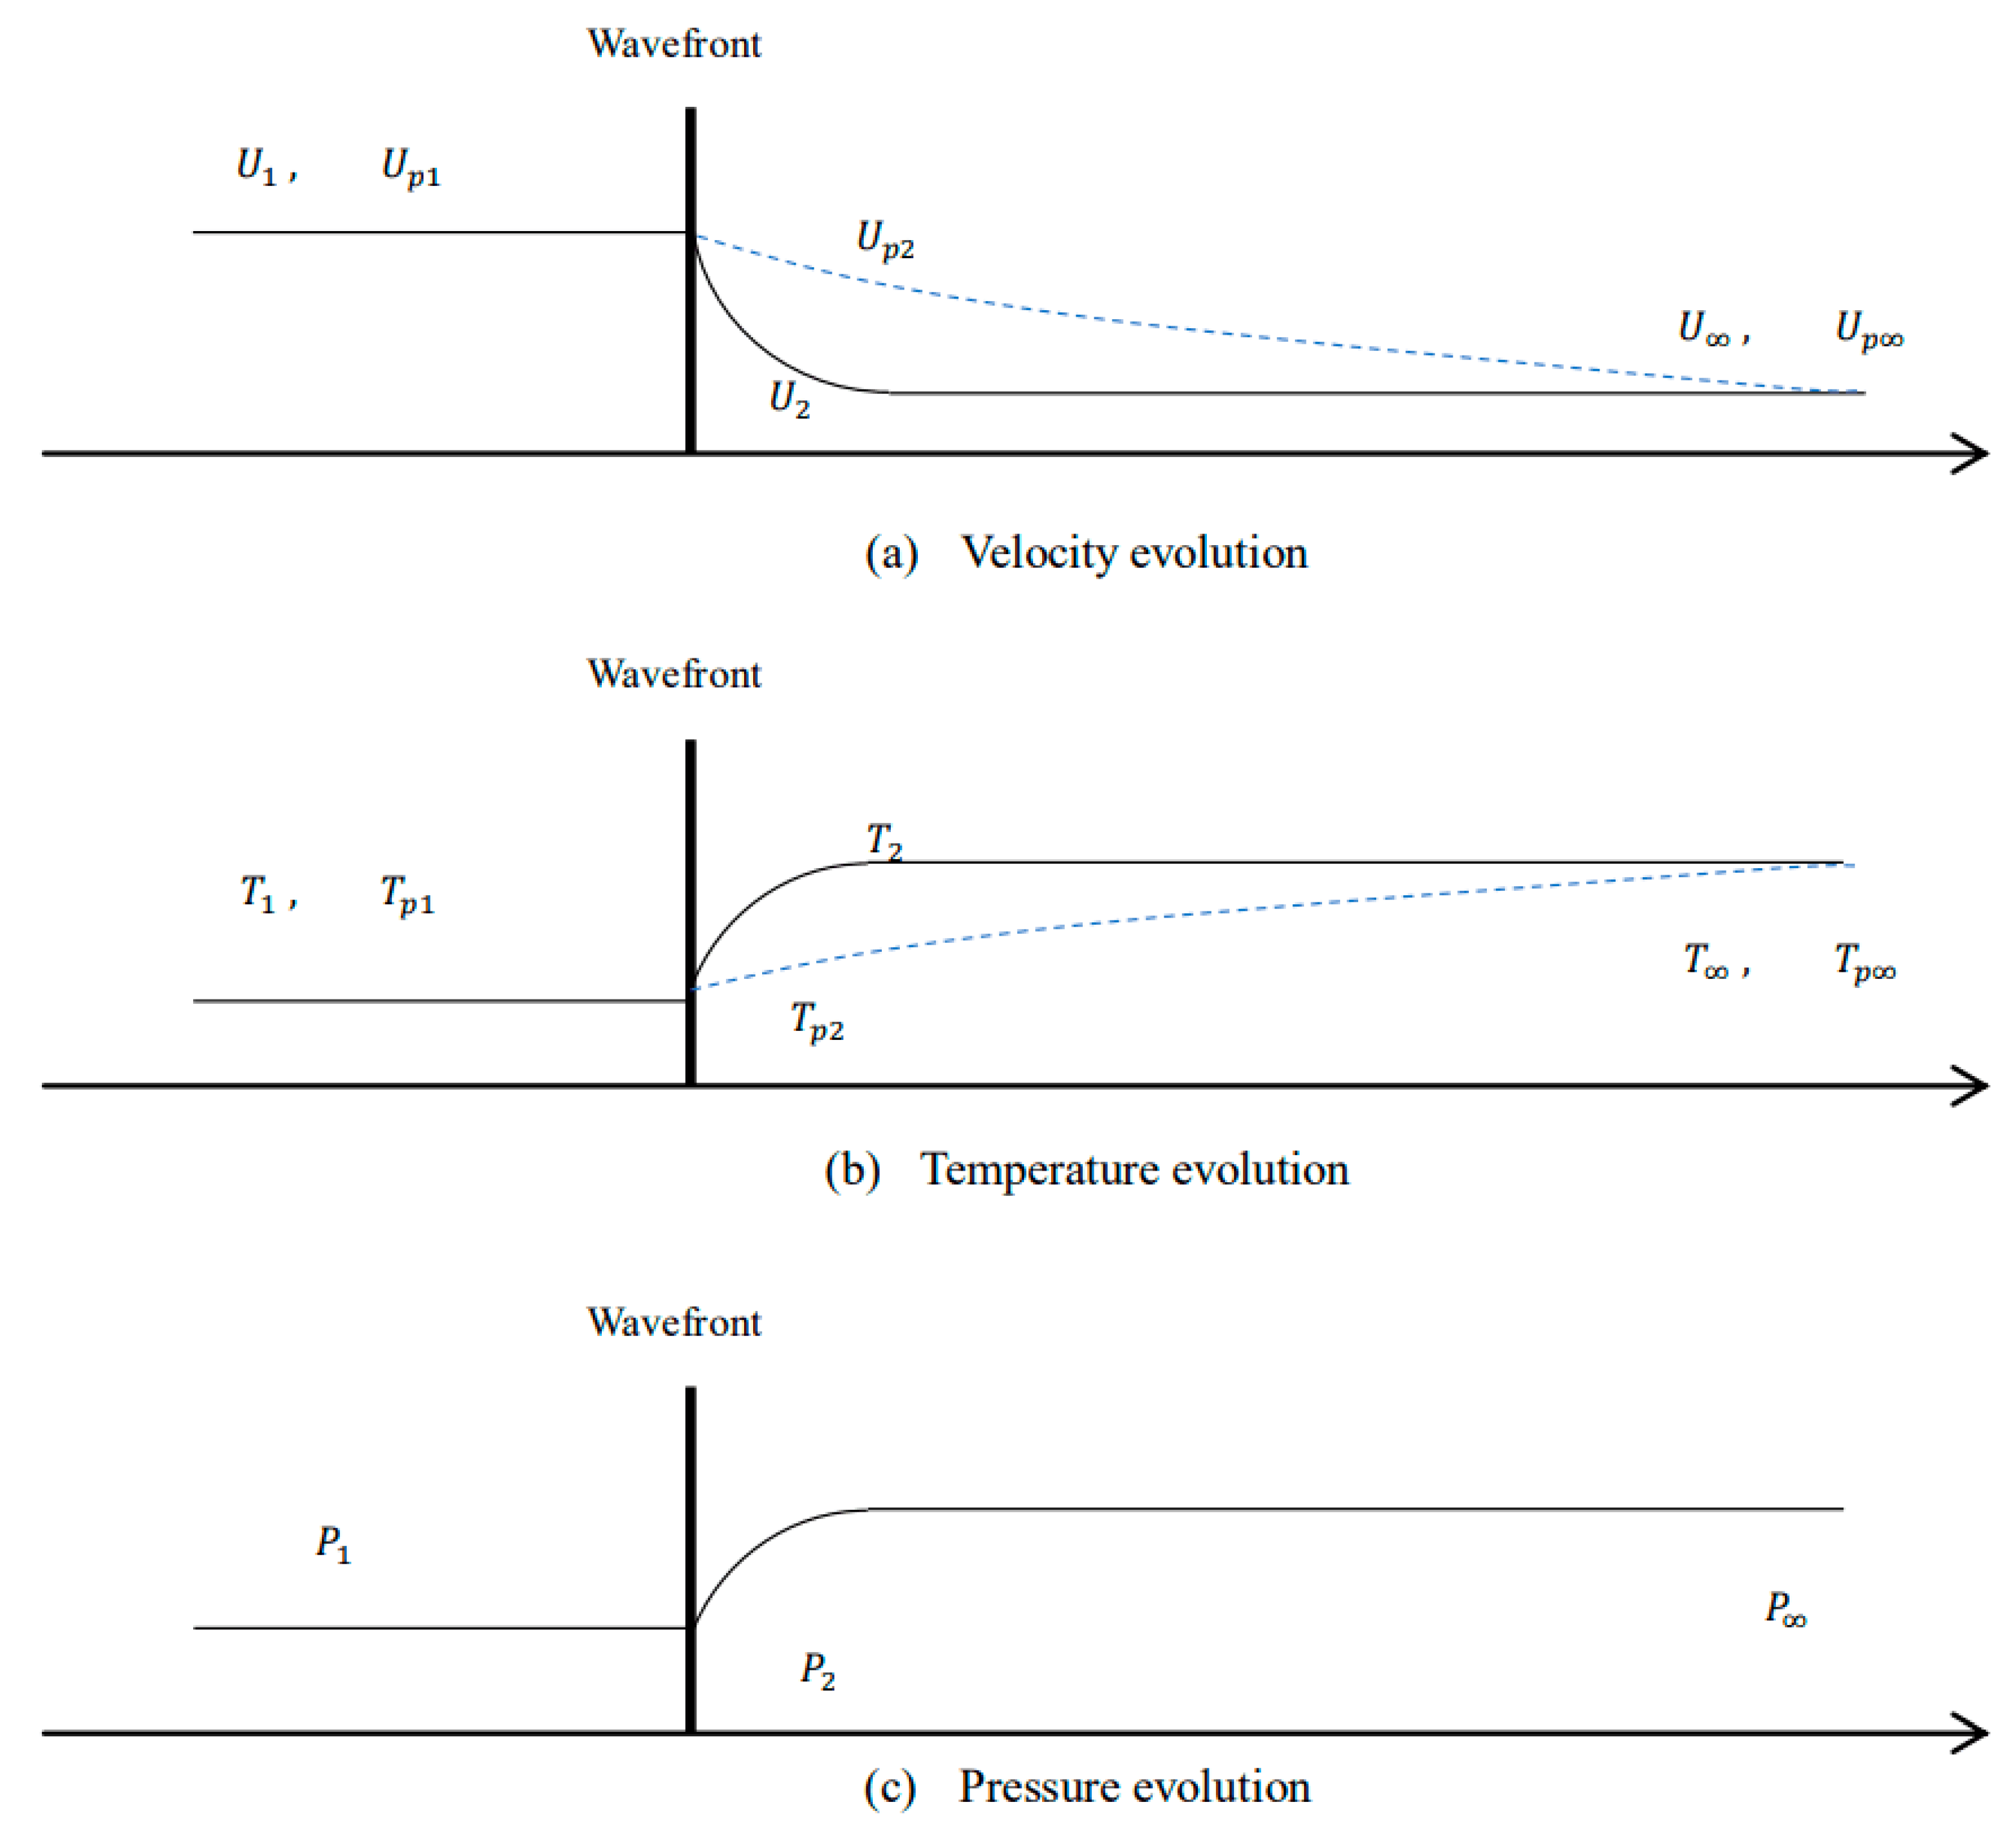
Figure 4 shows the variation of the temperature, pressure, and velocity of the gas and solid phases during the interaction process.
As shown in
Figure 4, a distinct gas–solid nonequilibrium zone emerged near the wave front. The time for shock wave passage through the solid particles is instantaneous; the exchanged momentum and energy between the two phases are very limited. Therefore, it takes a period of time for the solid particles to achieve a new equilibrium state of momentum and energy, which is called the relaxation time [
28,
29,
30,
31].
The time of the shock wave passing through a single particle is denoted as
, and the relaxation time is expressed as
. The ratio of
and
is described as:
where
is the diameter of the particle;
is the sound speed; and
is the specific heat ratio.
It can be seen that
is only about one thousandth of
[
28]. Therefore, the velocity of the particle is nearly the same at the moment when the shock wave passes through it. The particle motion obviously lags behind the shock wave propagation. This phenomenon is also well-verified in the subsequent numerical simulation.
4.2. Experimental Results of Pressure Attenuation and Particles Dispersion
In order to obtain the pressure variation characteristics during the interaction process, the quartz sand particles with an average diameter of 0.95 mm and a filling mass of 5 g were used for the shock wave experiment. The experimental results were compared with the pressure data measured in the blank experiment (without particles), as shown in
Figure 5.
It can be seen from
Figure 5 that there was only one peak pressure at the P
1 position in the blank experiment, which was the incident shock overpressure (149 kPa). Peak pressure at the P
2 position was 107 kPa. However, in the shock wave experiment with solid particles, there were two peak pressures at the P
1 position; the first was the incident shock overpressure (156 kPa) and the second was the reflected shock overpressure (310 kPa). The peak pressure at the P
2 position was the transmitted shock overpressure (75 kPa). This phenomenon indicates that the presence of solid particles caused the reflection and transmission of the shock wave, thus the shock intensity decreased significantly. In addition, the pressure attenuated 42 kPa in the blank experiment and 71 kPa in the experiment with solid particles. The results are attributed to two aspects. First, the pressure attenuation of the shock front was caused by the volume expansion of the airflow outside the tube. Second, the shock wave exchanged momentum with the solid particles during the interaction process, and part of the energy was used to do work on the particles to drive their dispersion.
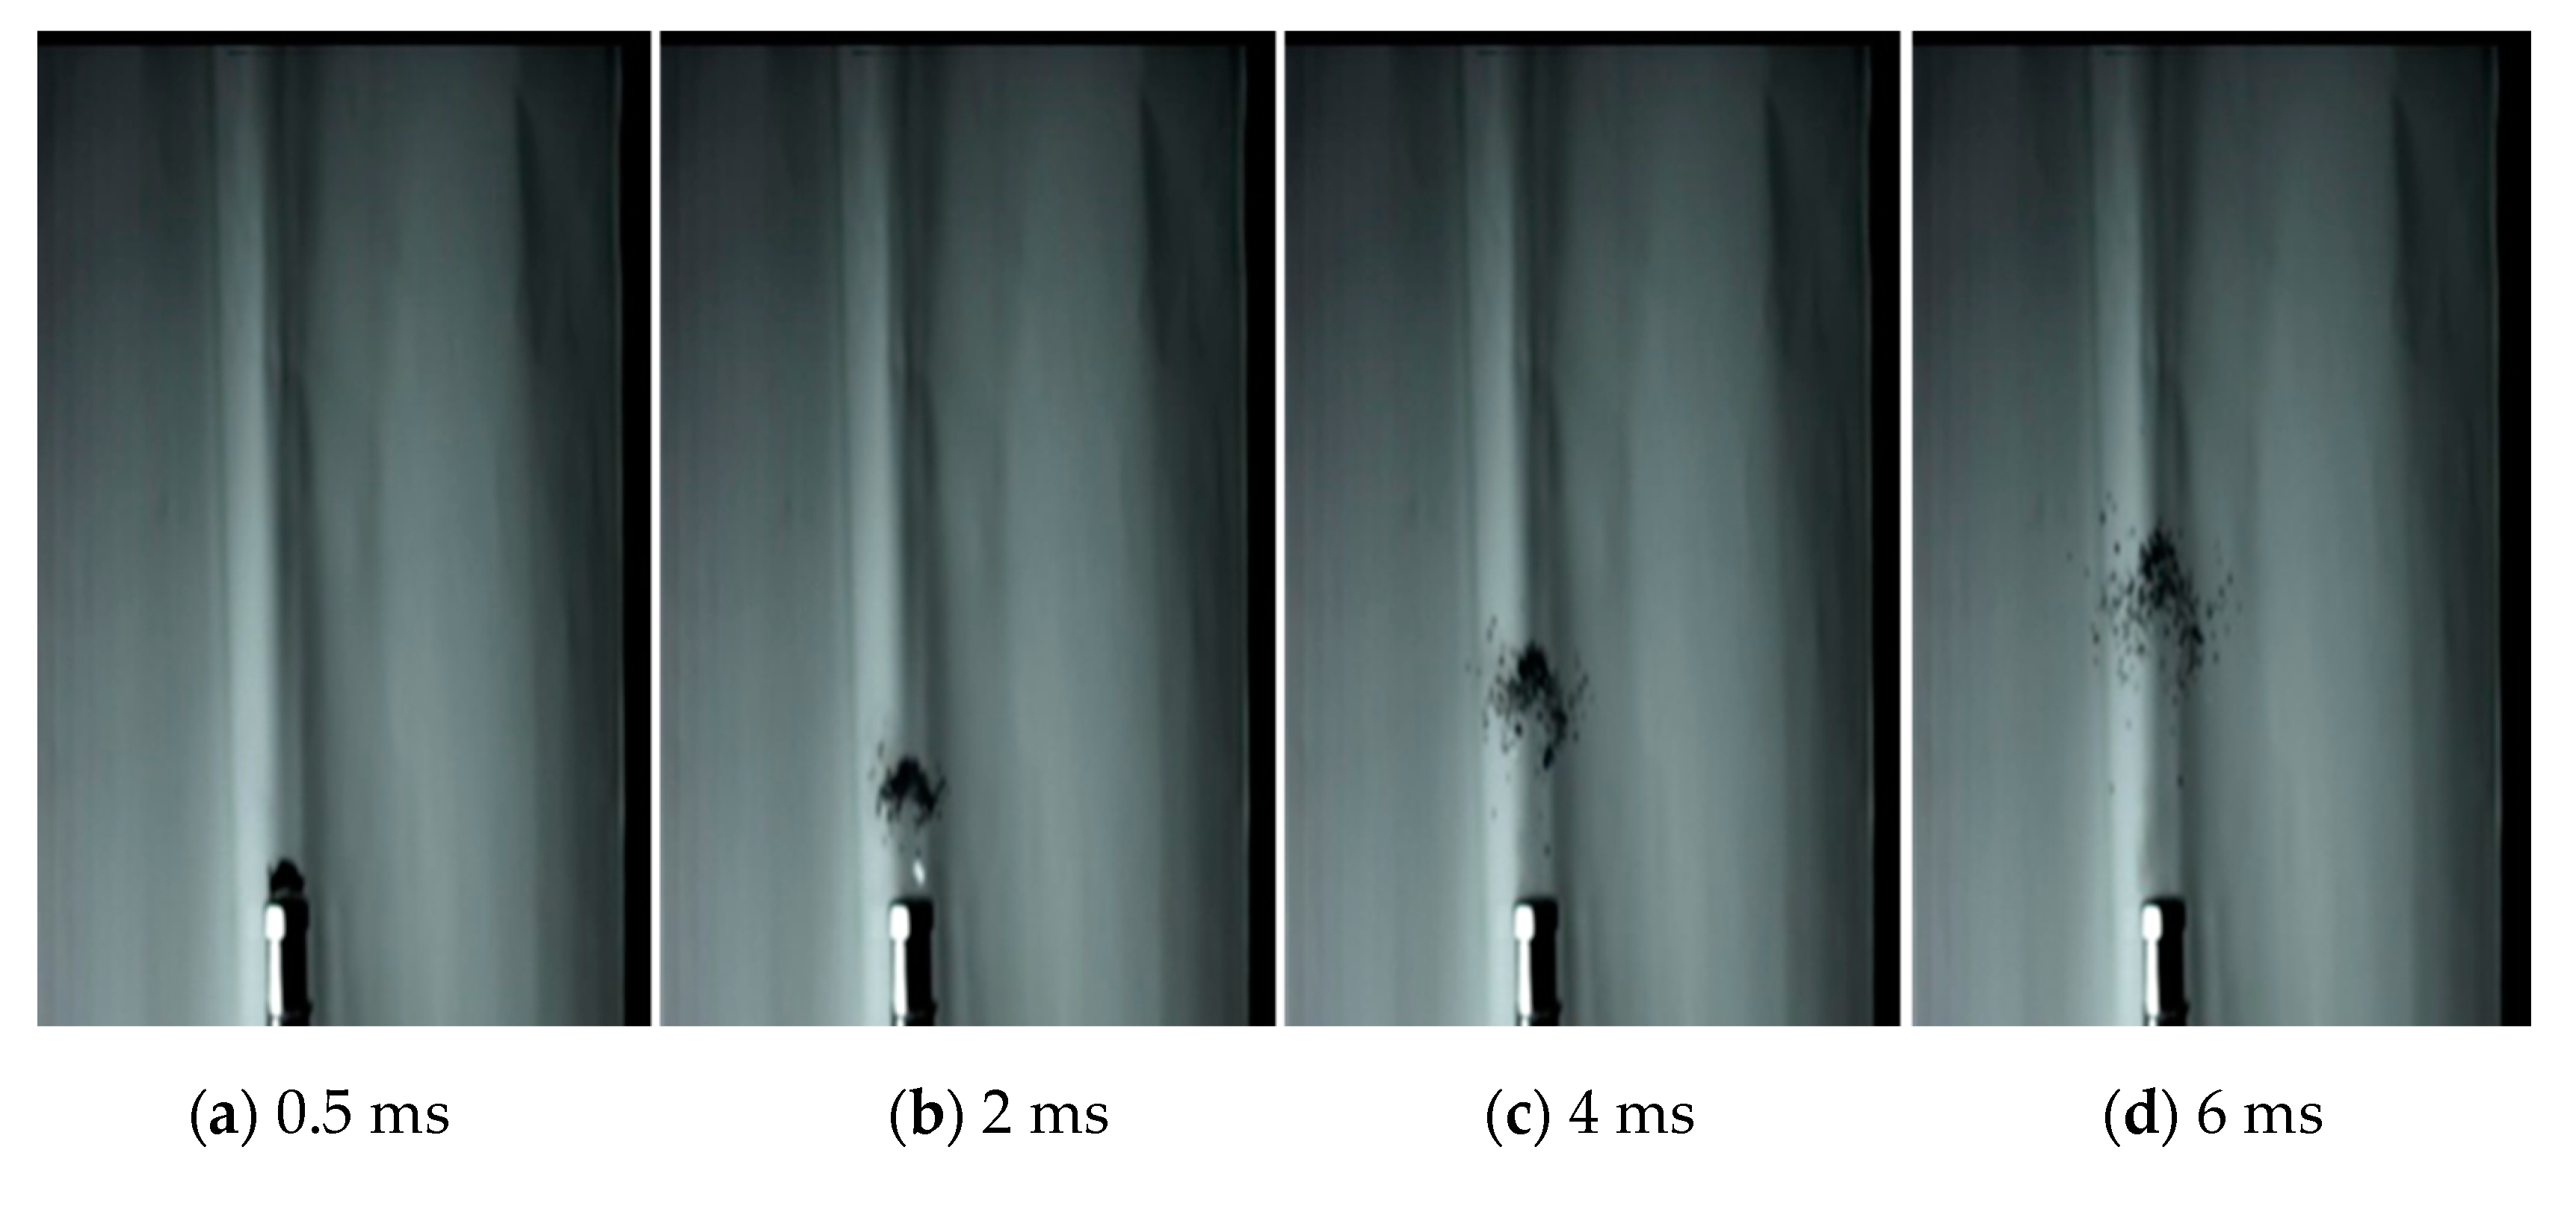
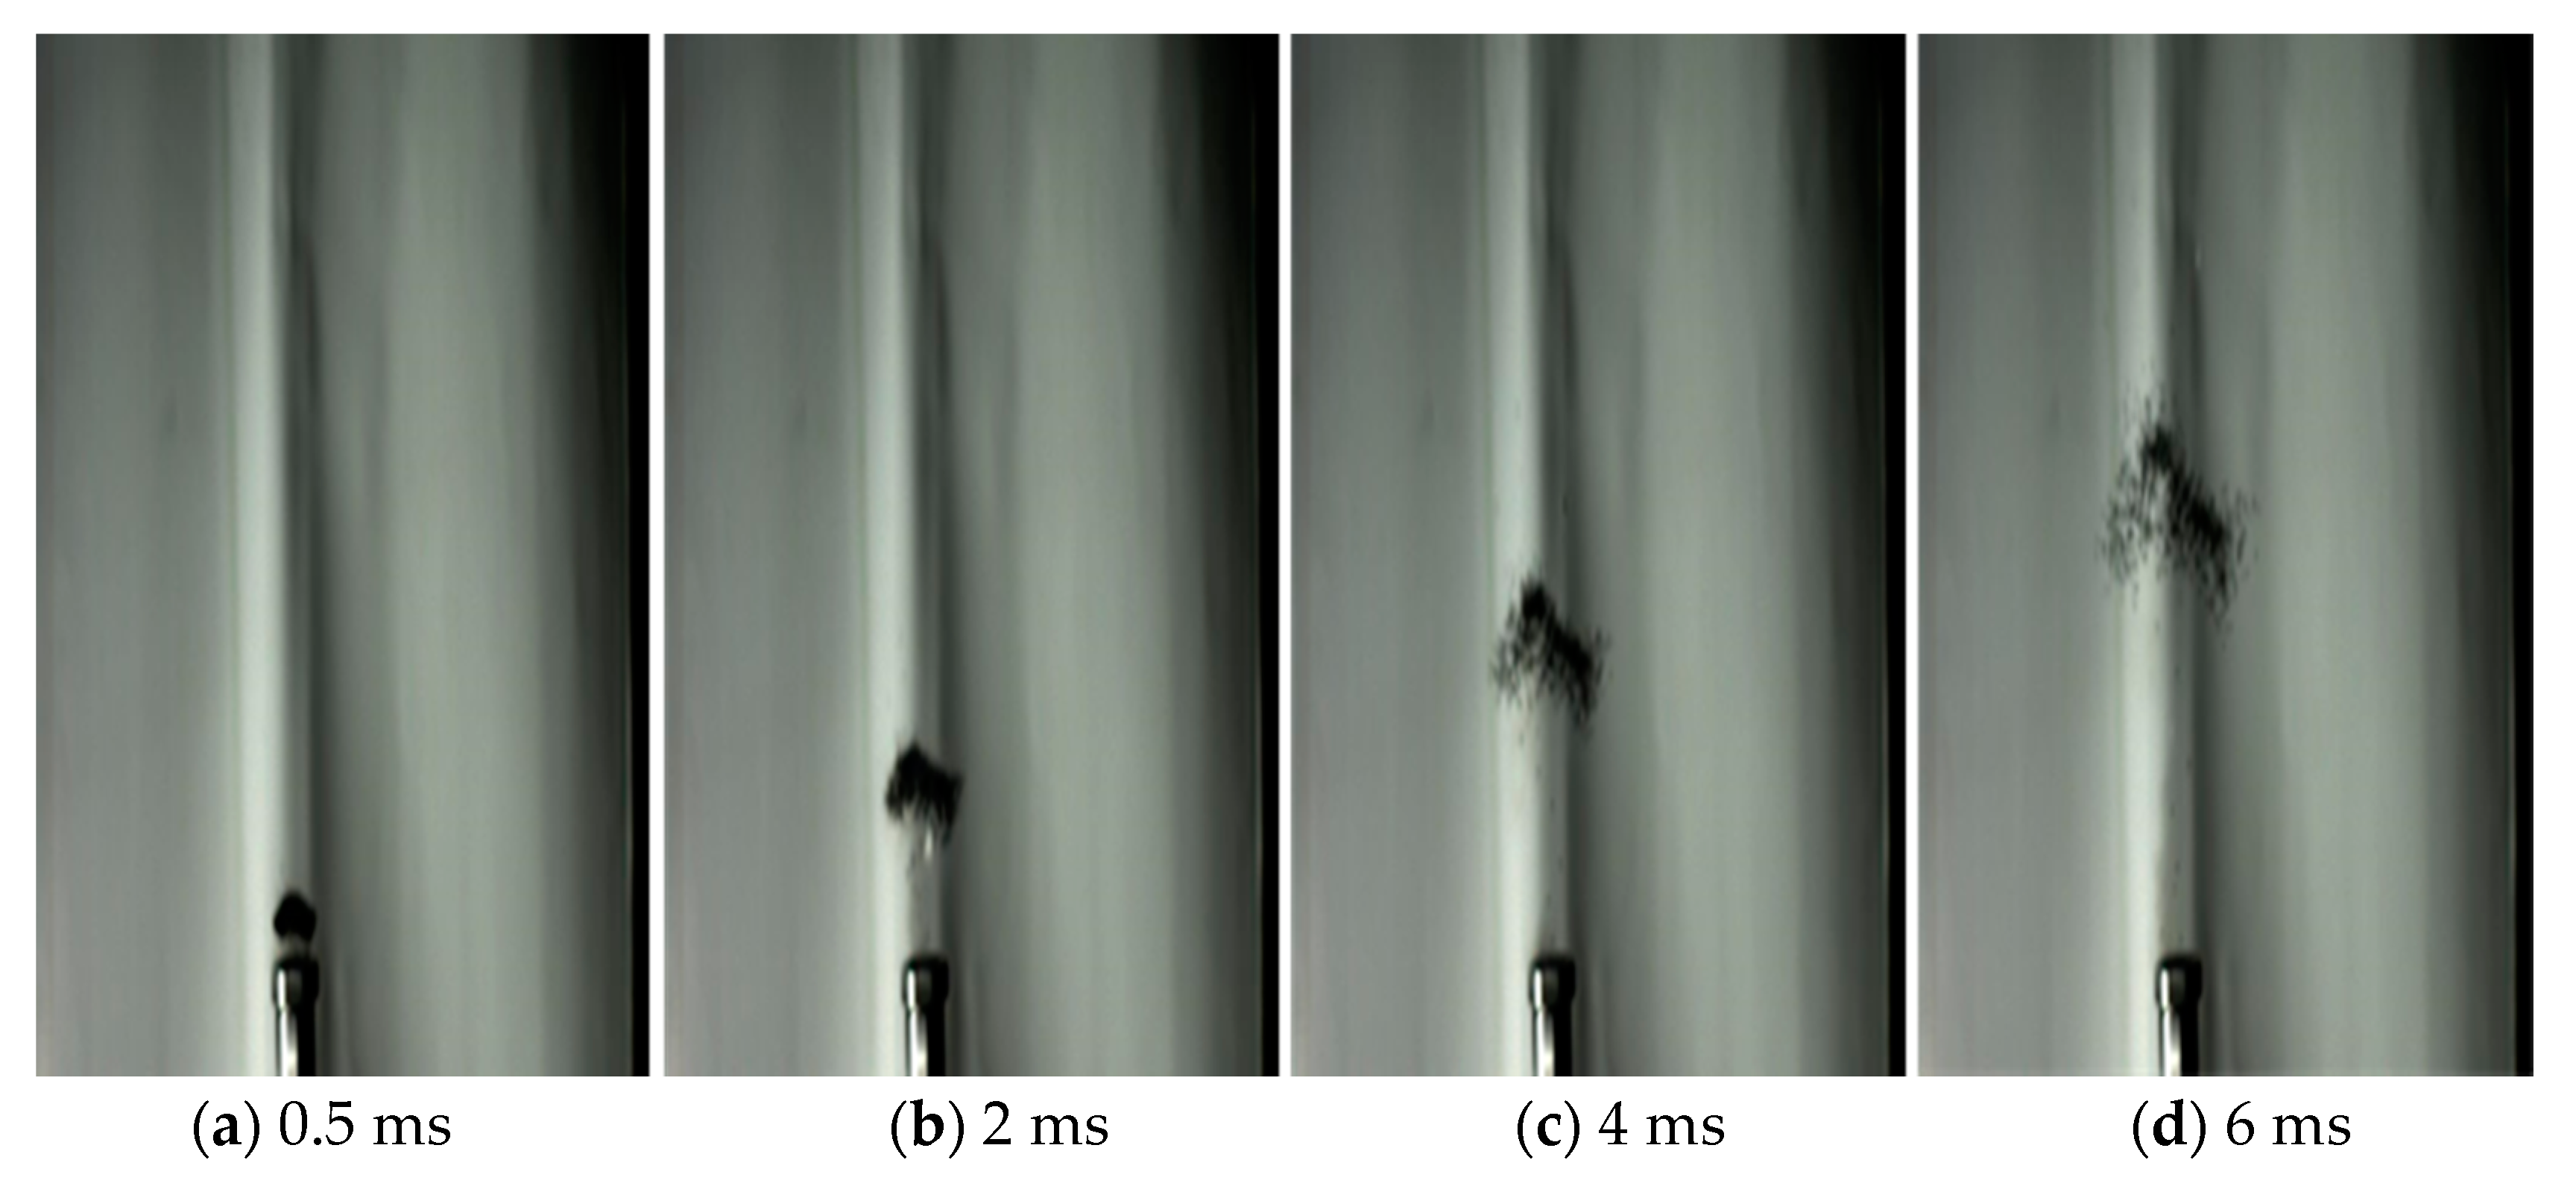
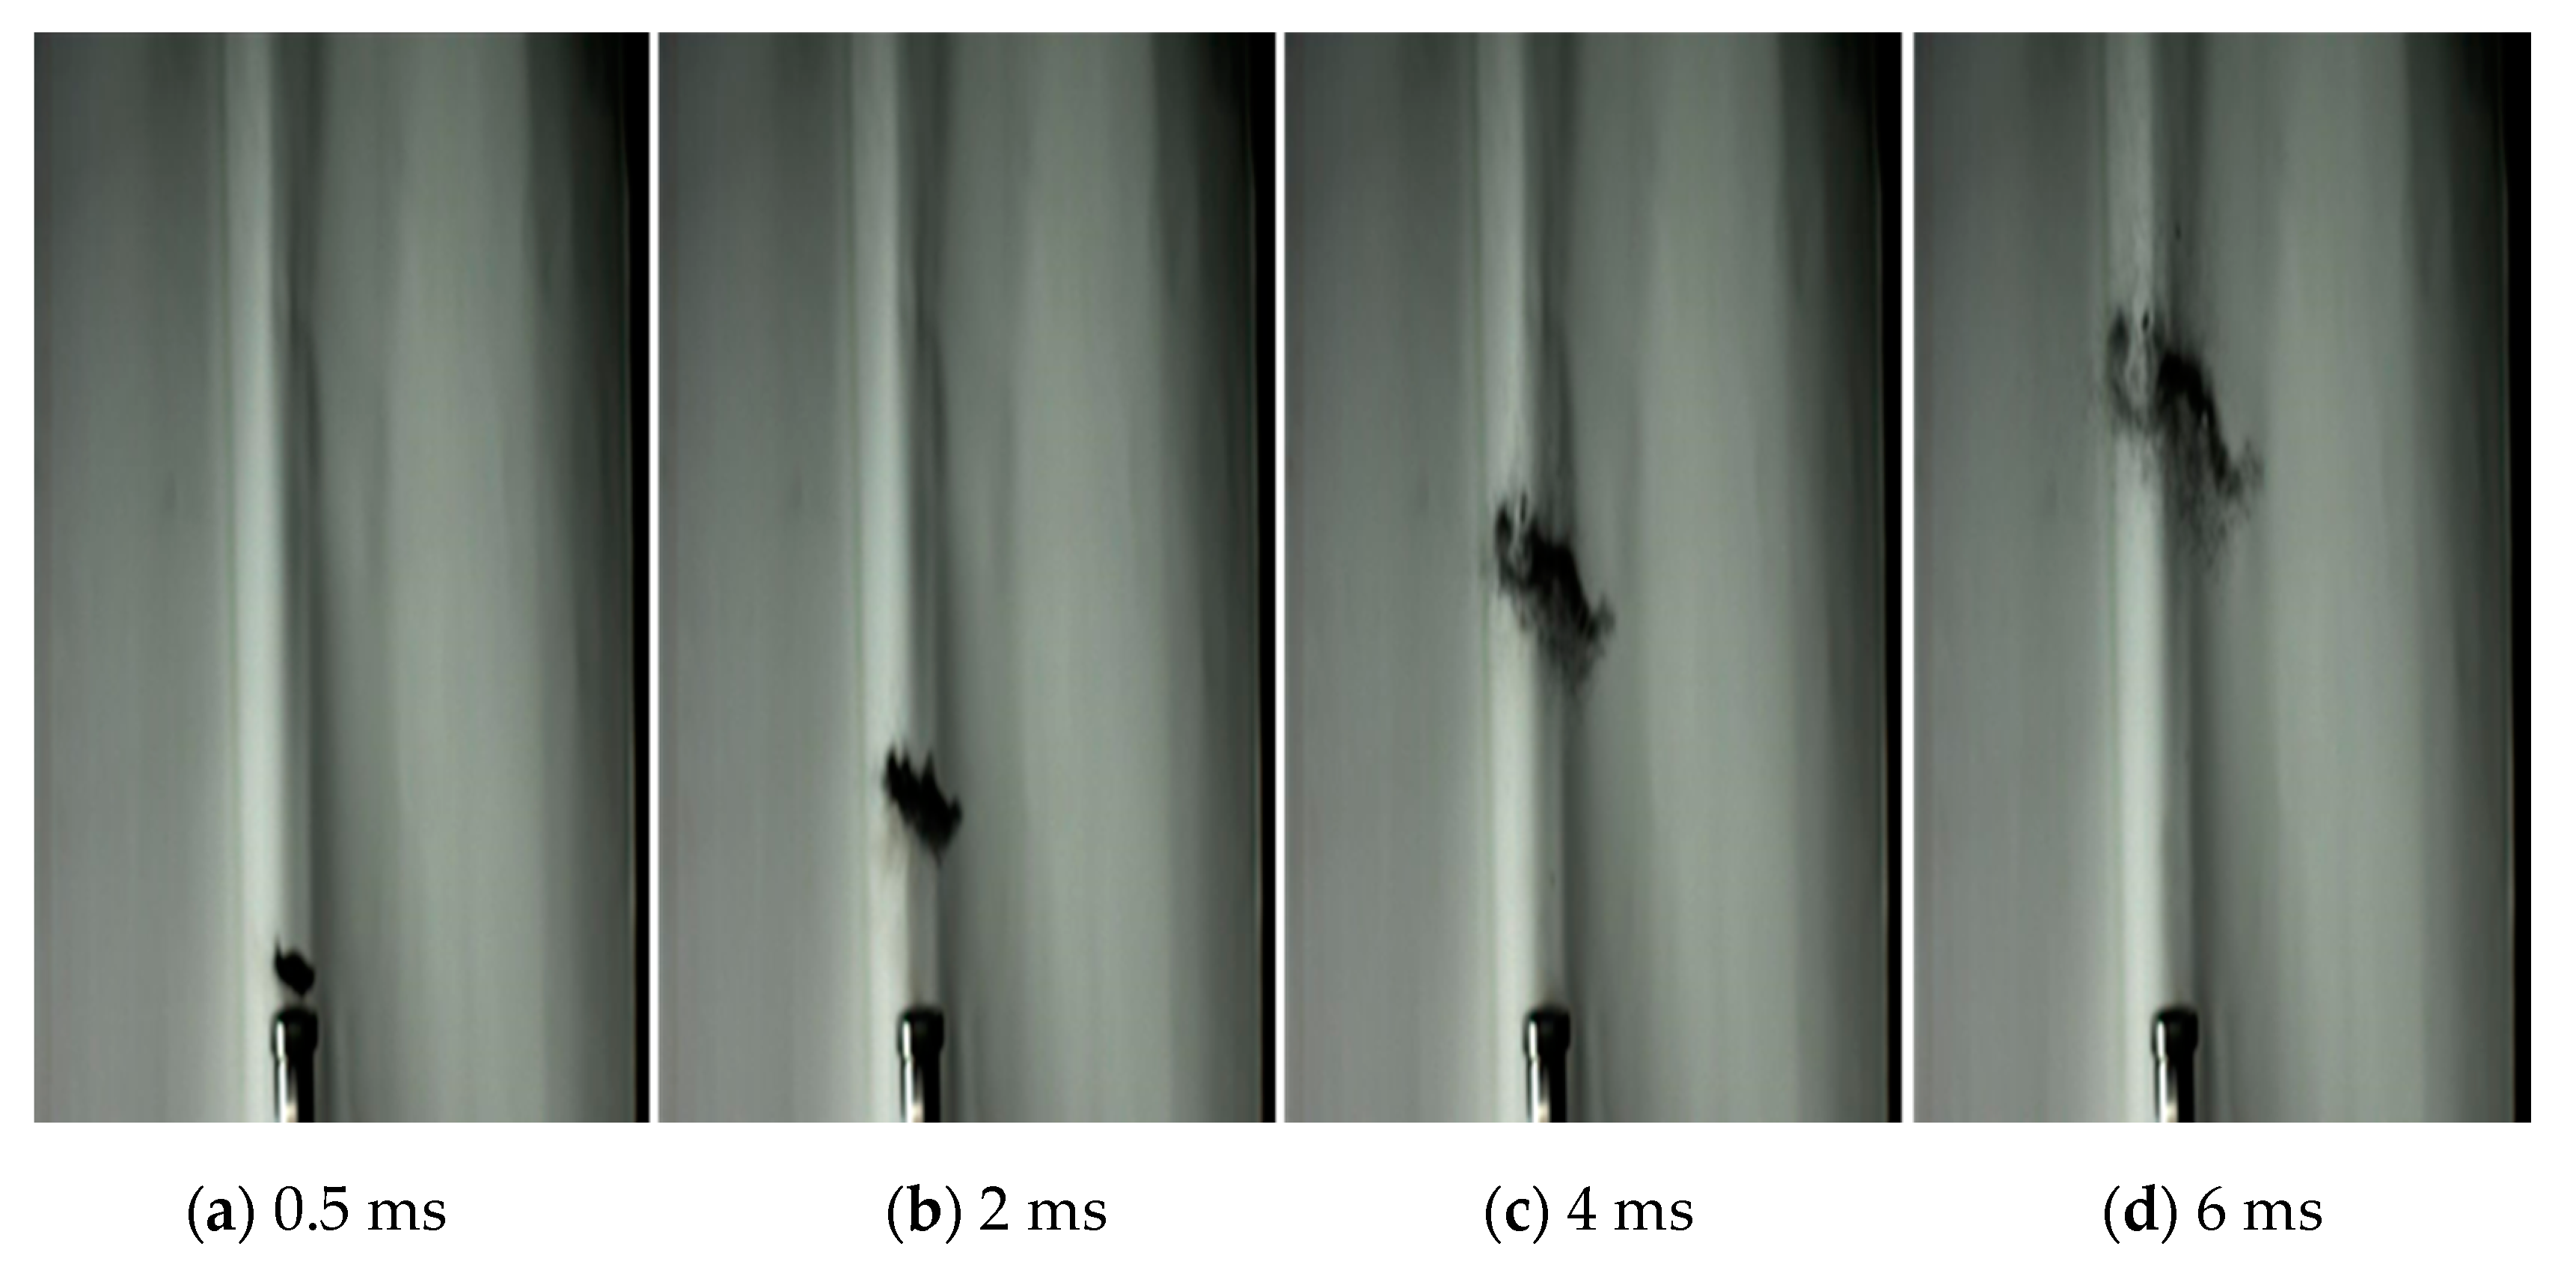
To study the influence of the size on the particle dispersion process under the shock wave, three types of solid quartz sand particles with average diameters of 2.5, 0.95, and 0.42 mm were used individually for the shock wave experiments, and the filling mass was 5 g. The same batch of diaphragms was employed to ensure the consistency of shock intensity for different experiments. The Mach number generated by the high-pressure driving section was calculated by the pressure data to be 1.47. The dispersion process of the quartz sand particles with three different sizes under the action of the shock wave was captured by the high-speed camera system during the experiments. The dispersion process is shown in
Figure 6,
Figure 7 and
Figure 8.
It can be seen from
Figure 6,
Figure 7 and
Figure 8 that after the shock wave acted on the quartz sand particles, the dispersion distance of the solid particles increased continuously within 6 ms, and the particles presented a gradually opened "umbrella" shape during the dispersion process. It indicated that in the early stage, the energy provided by the shock wave with 1.47 Mach was enough to cause the 5 g of solid quartz sand particles to overcome the gravity and air resistance, and exhibit an overall upward movement. The drag force of the shock wave on the particles dominated in this period. With the passage of time, the drag force decreased, and the gravity of particles gradually became the dominant force that affected the particle movement.
In addition, according to the comparison of
Figure 6,
Figure 7 and
Figure 8, there were some differences in the dispersion process of quartz sand particles with different sizes. At the same time, the solid particles with a small size were scattered faster, and the farther the dispersion distance, the clouds that formed were more dispersed. In
Figure 8, the experimental particle dispersion shown is not symmetric. The reason is that the particle size was very small and the particles were easily disturbed by the airflow during the experiment, thus the symmetry was not as well-developed as that shown in
Figure 6 and
Figure 7.
4.3. Simulation of the Interaction between Shock Wave and Solid Particles
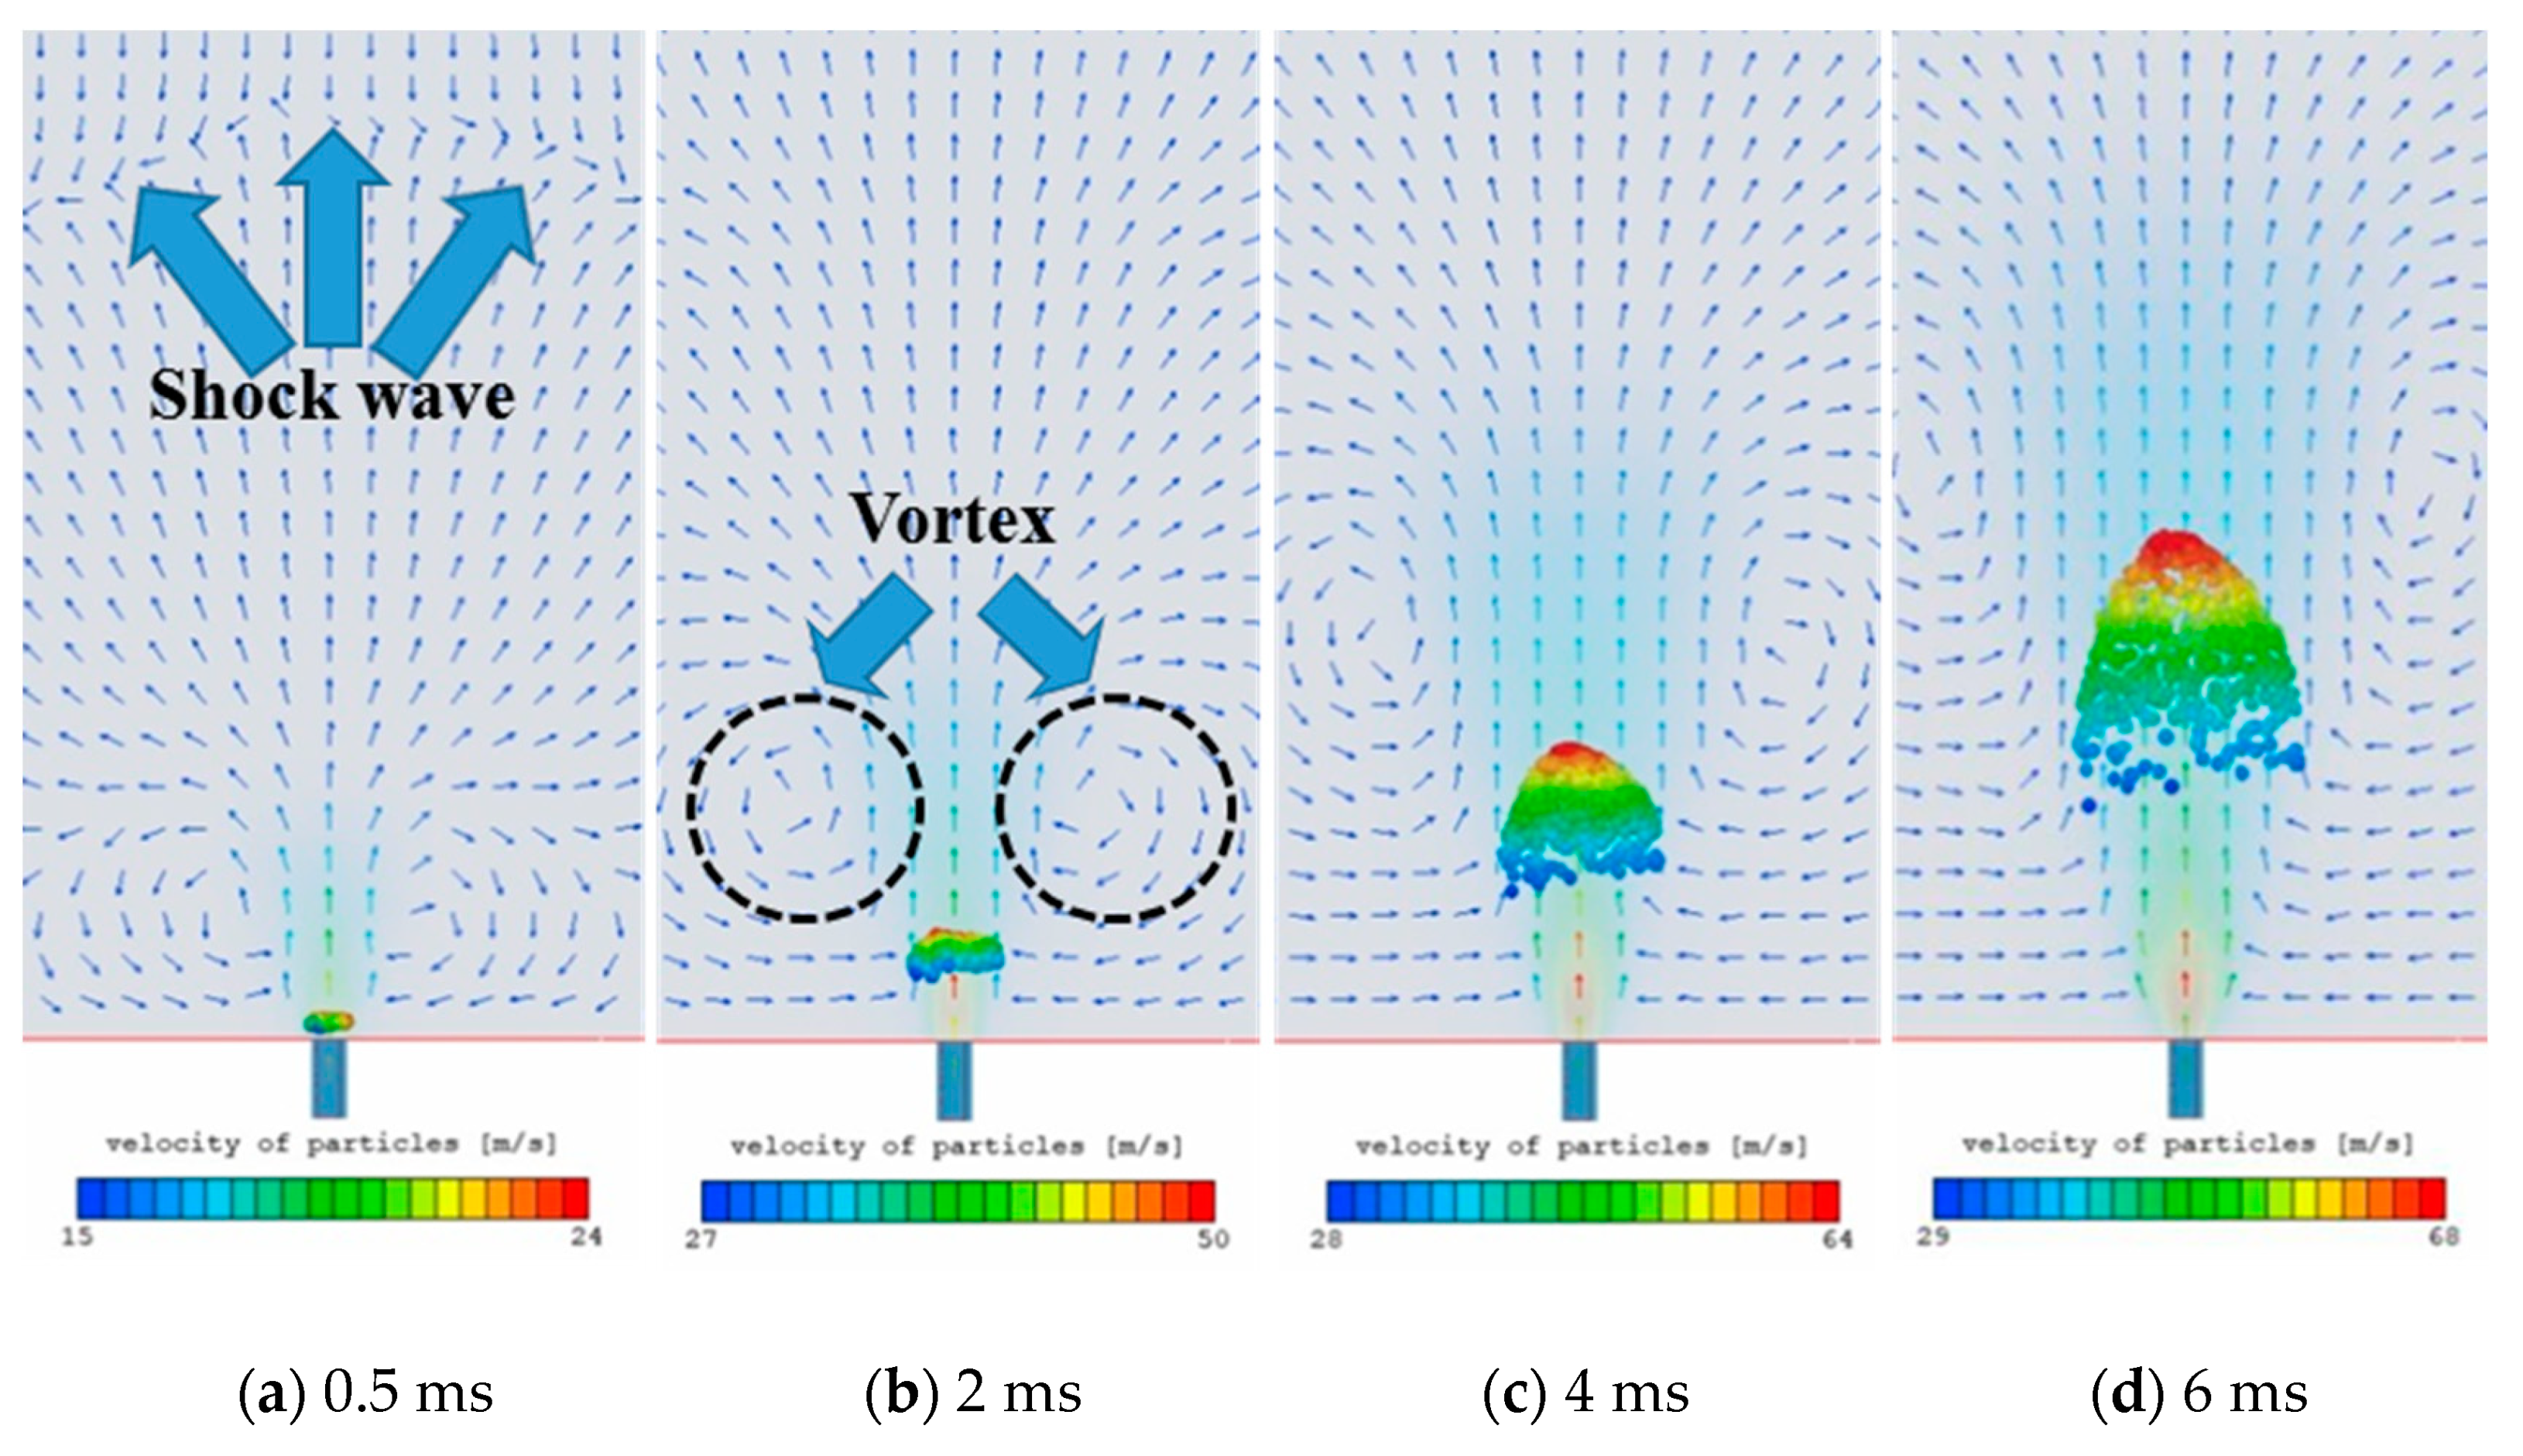
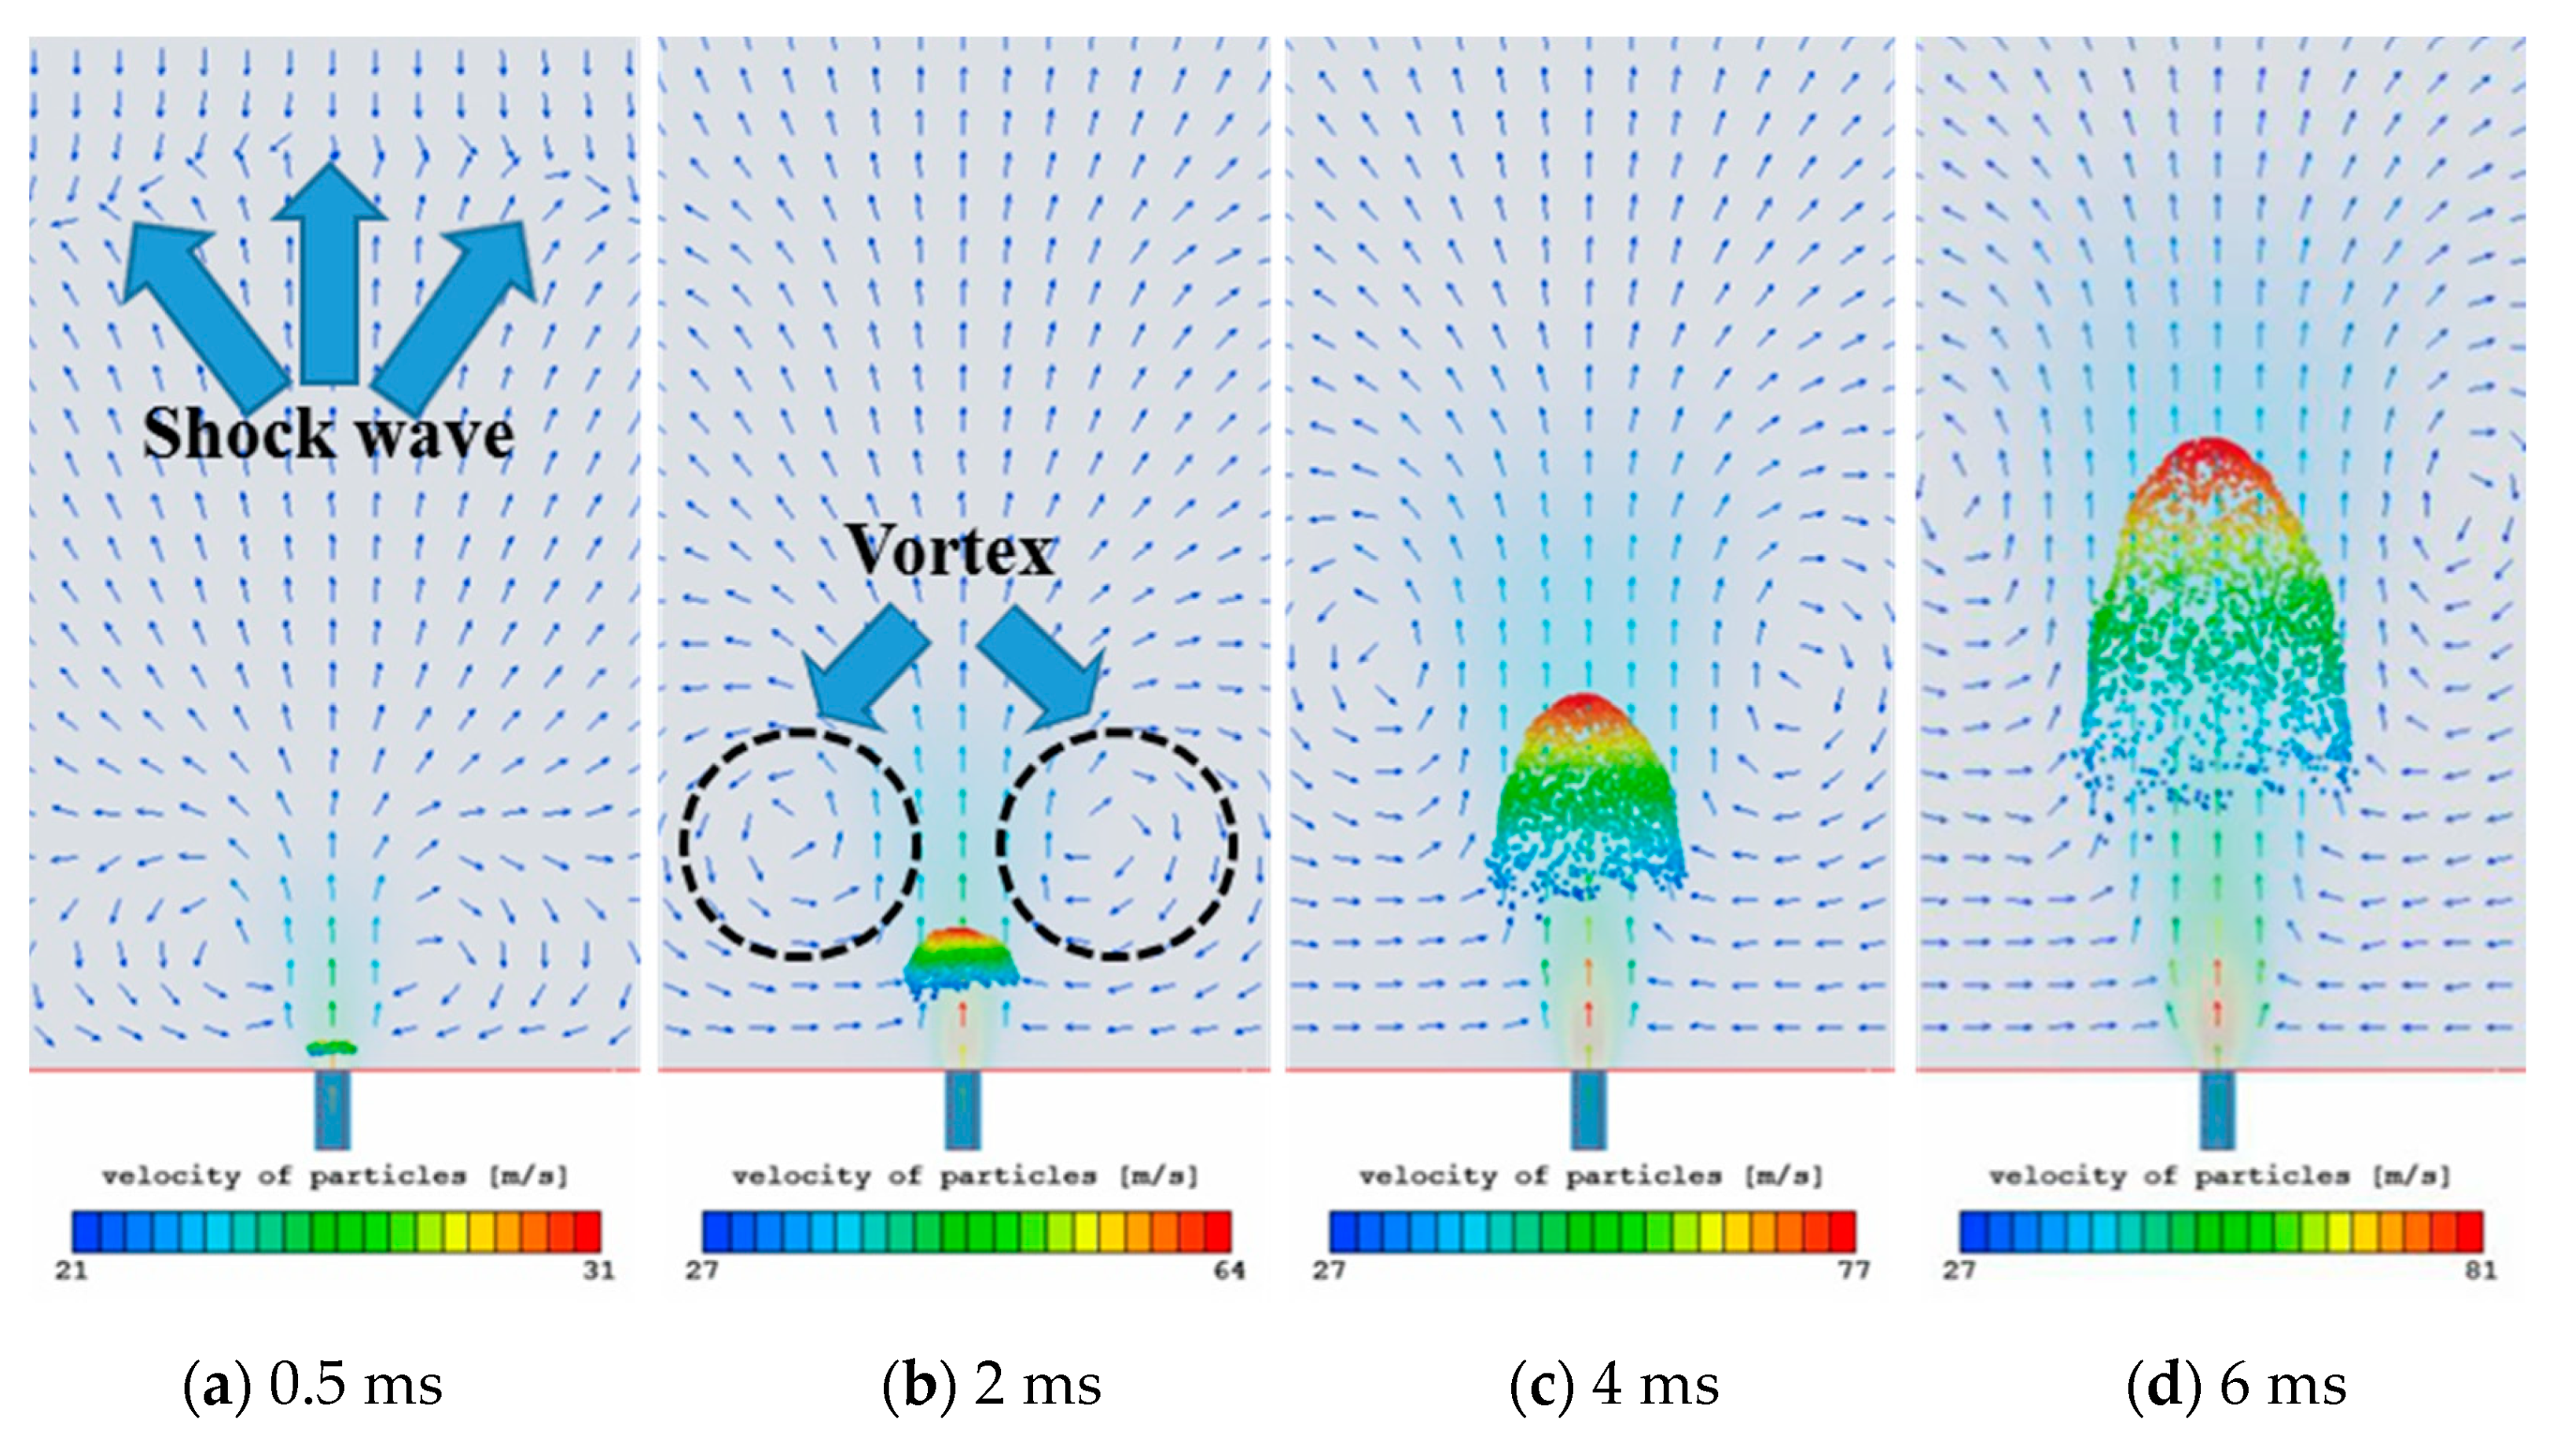
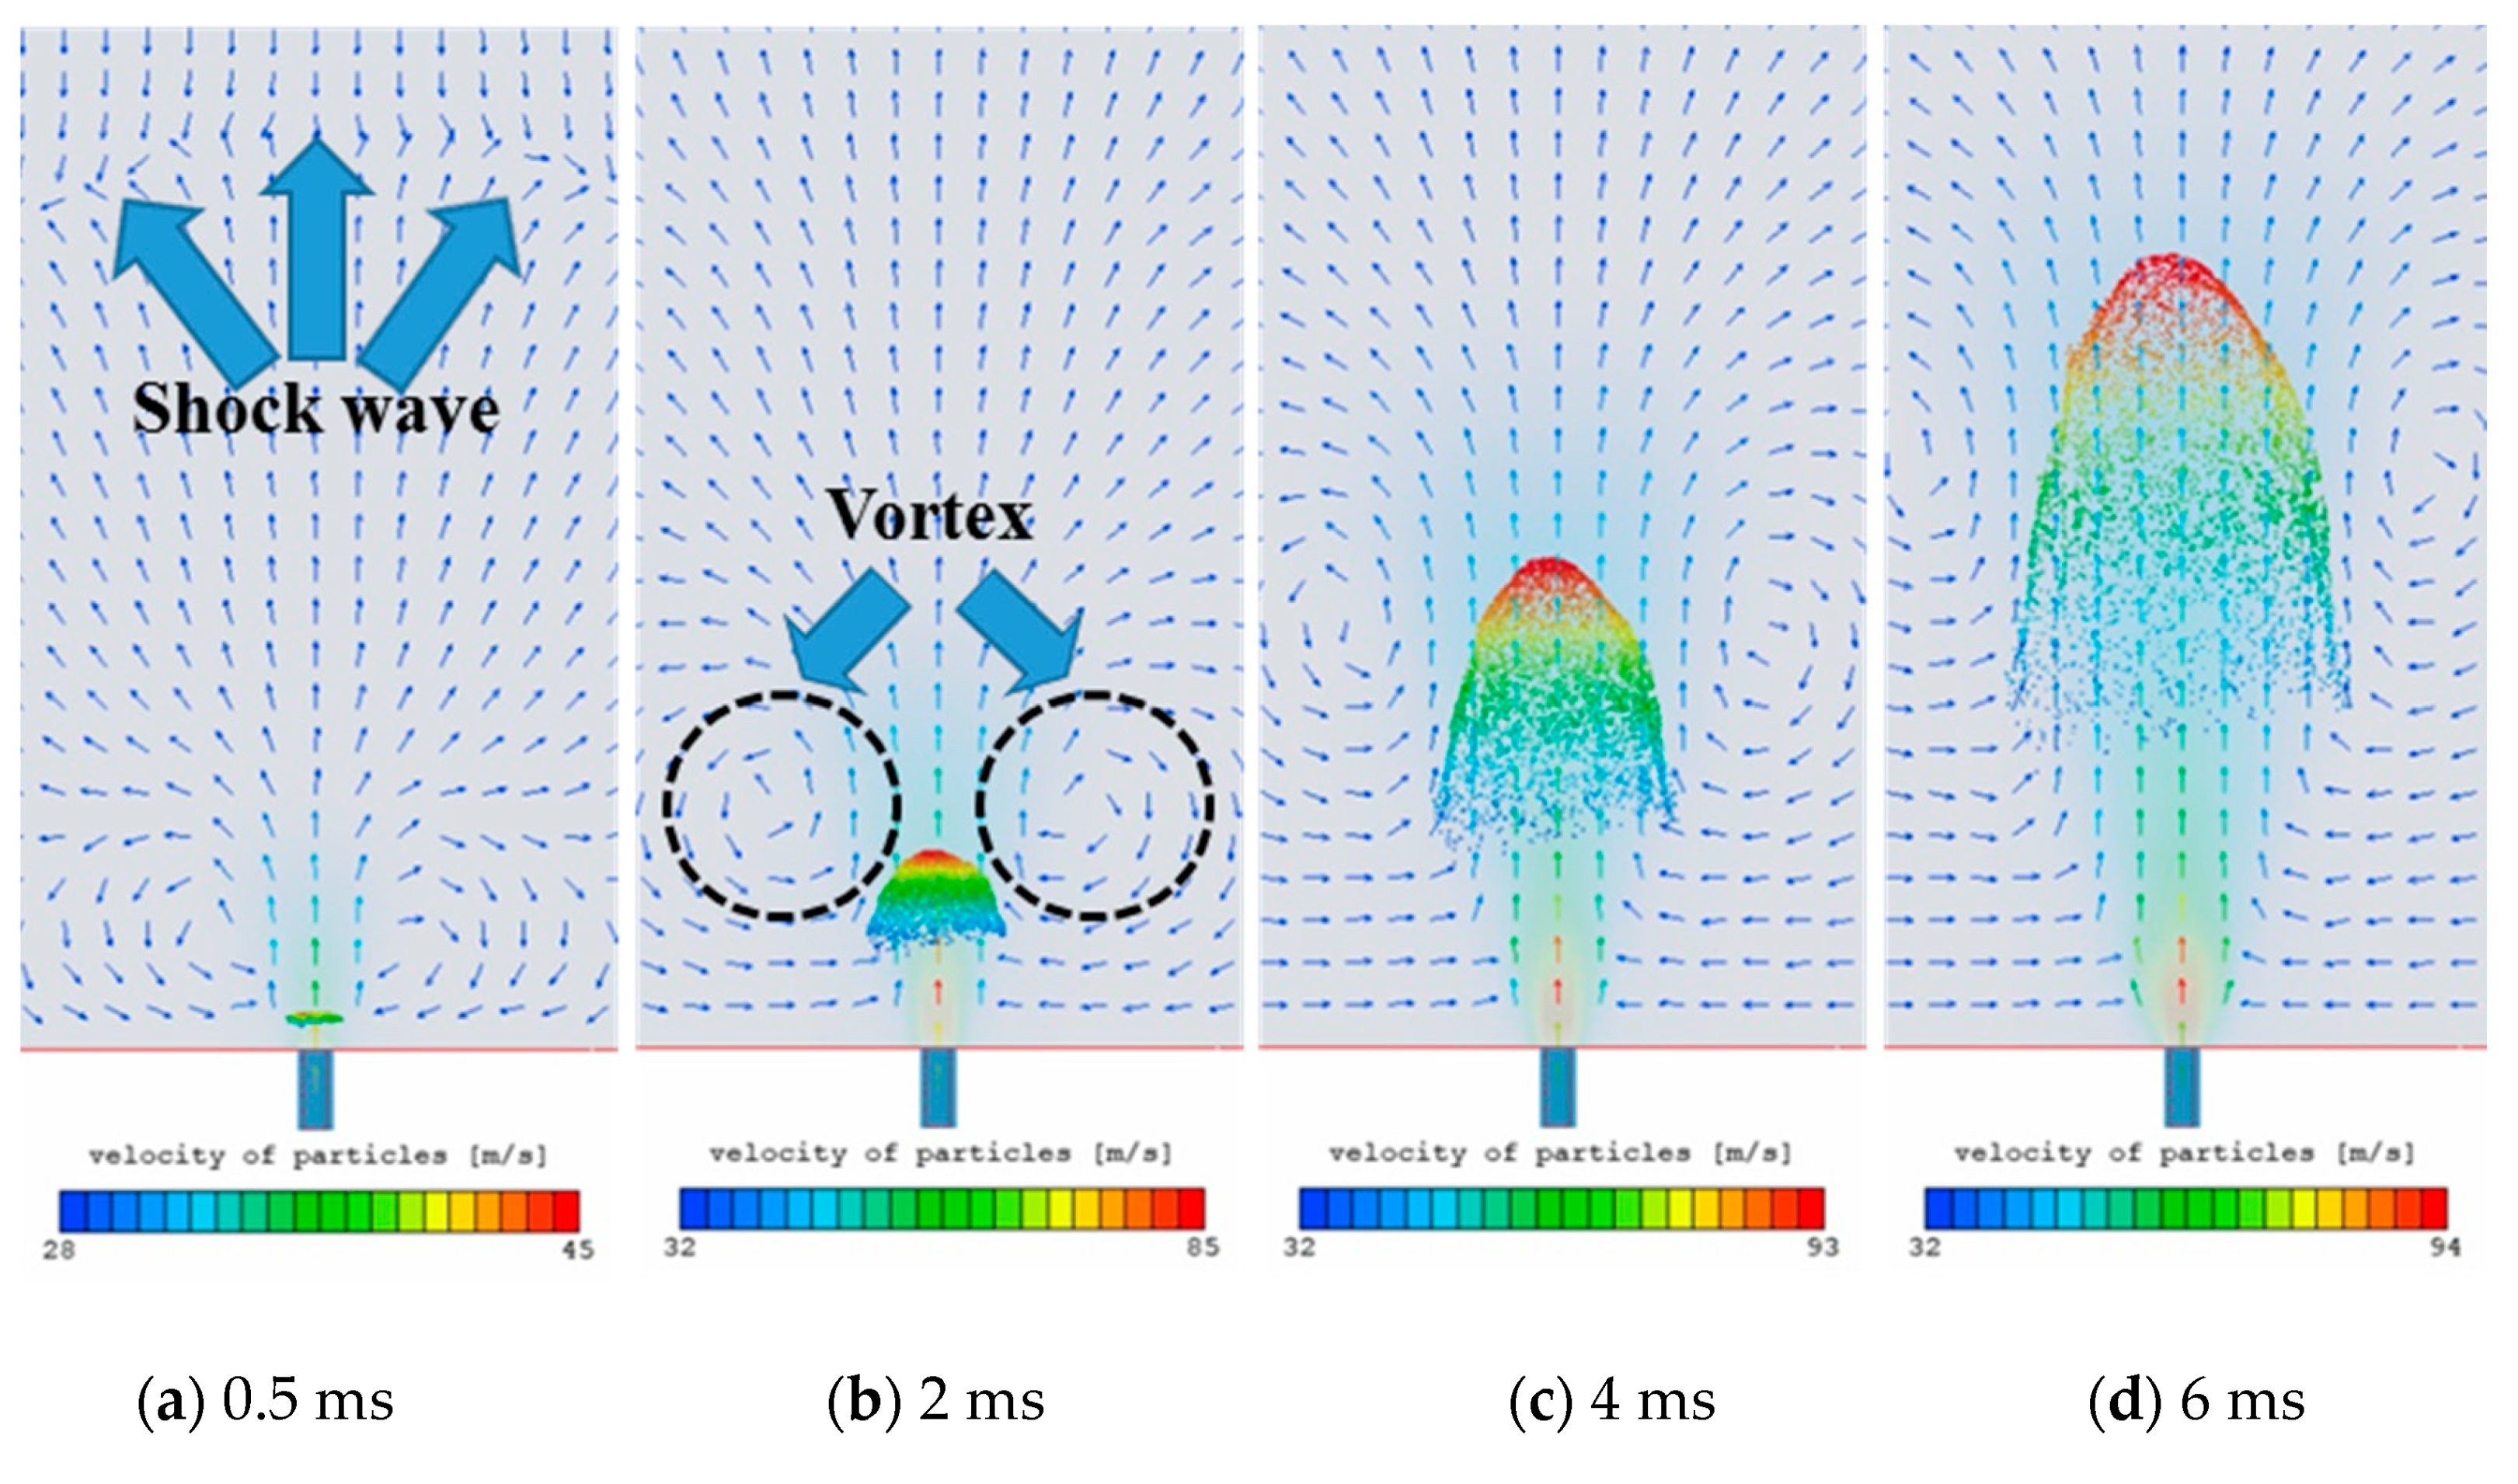
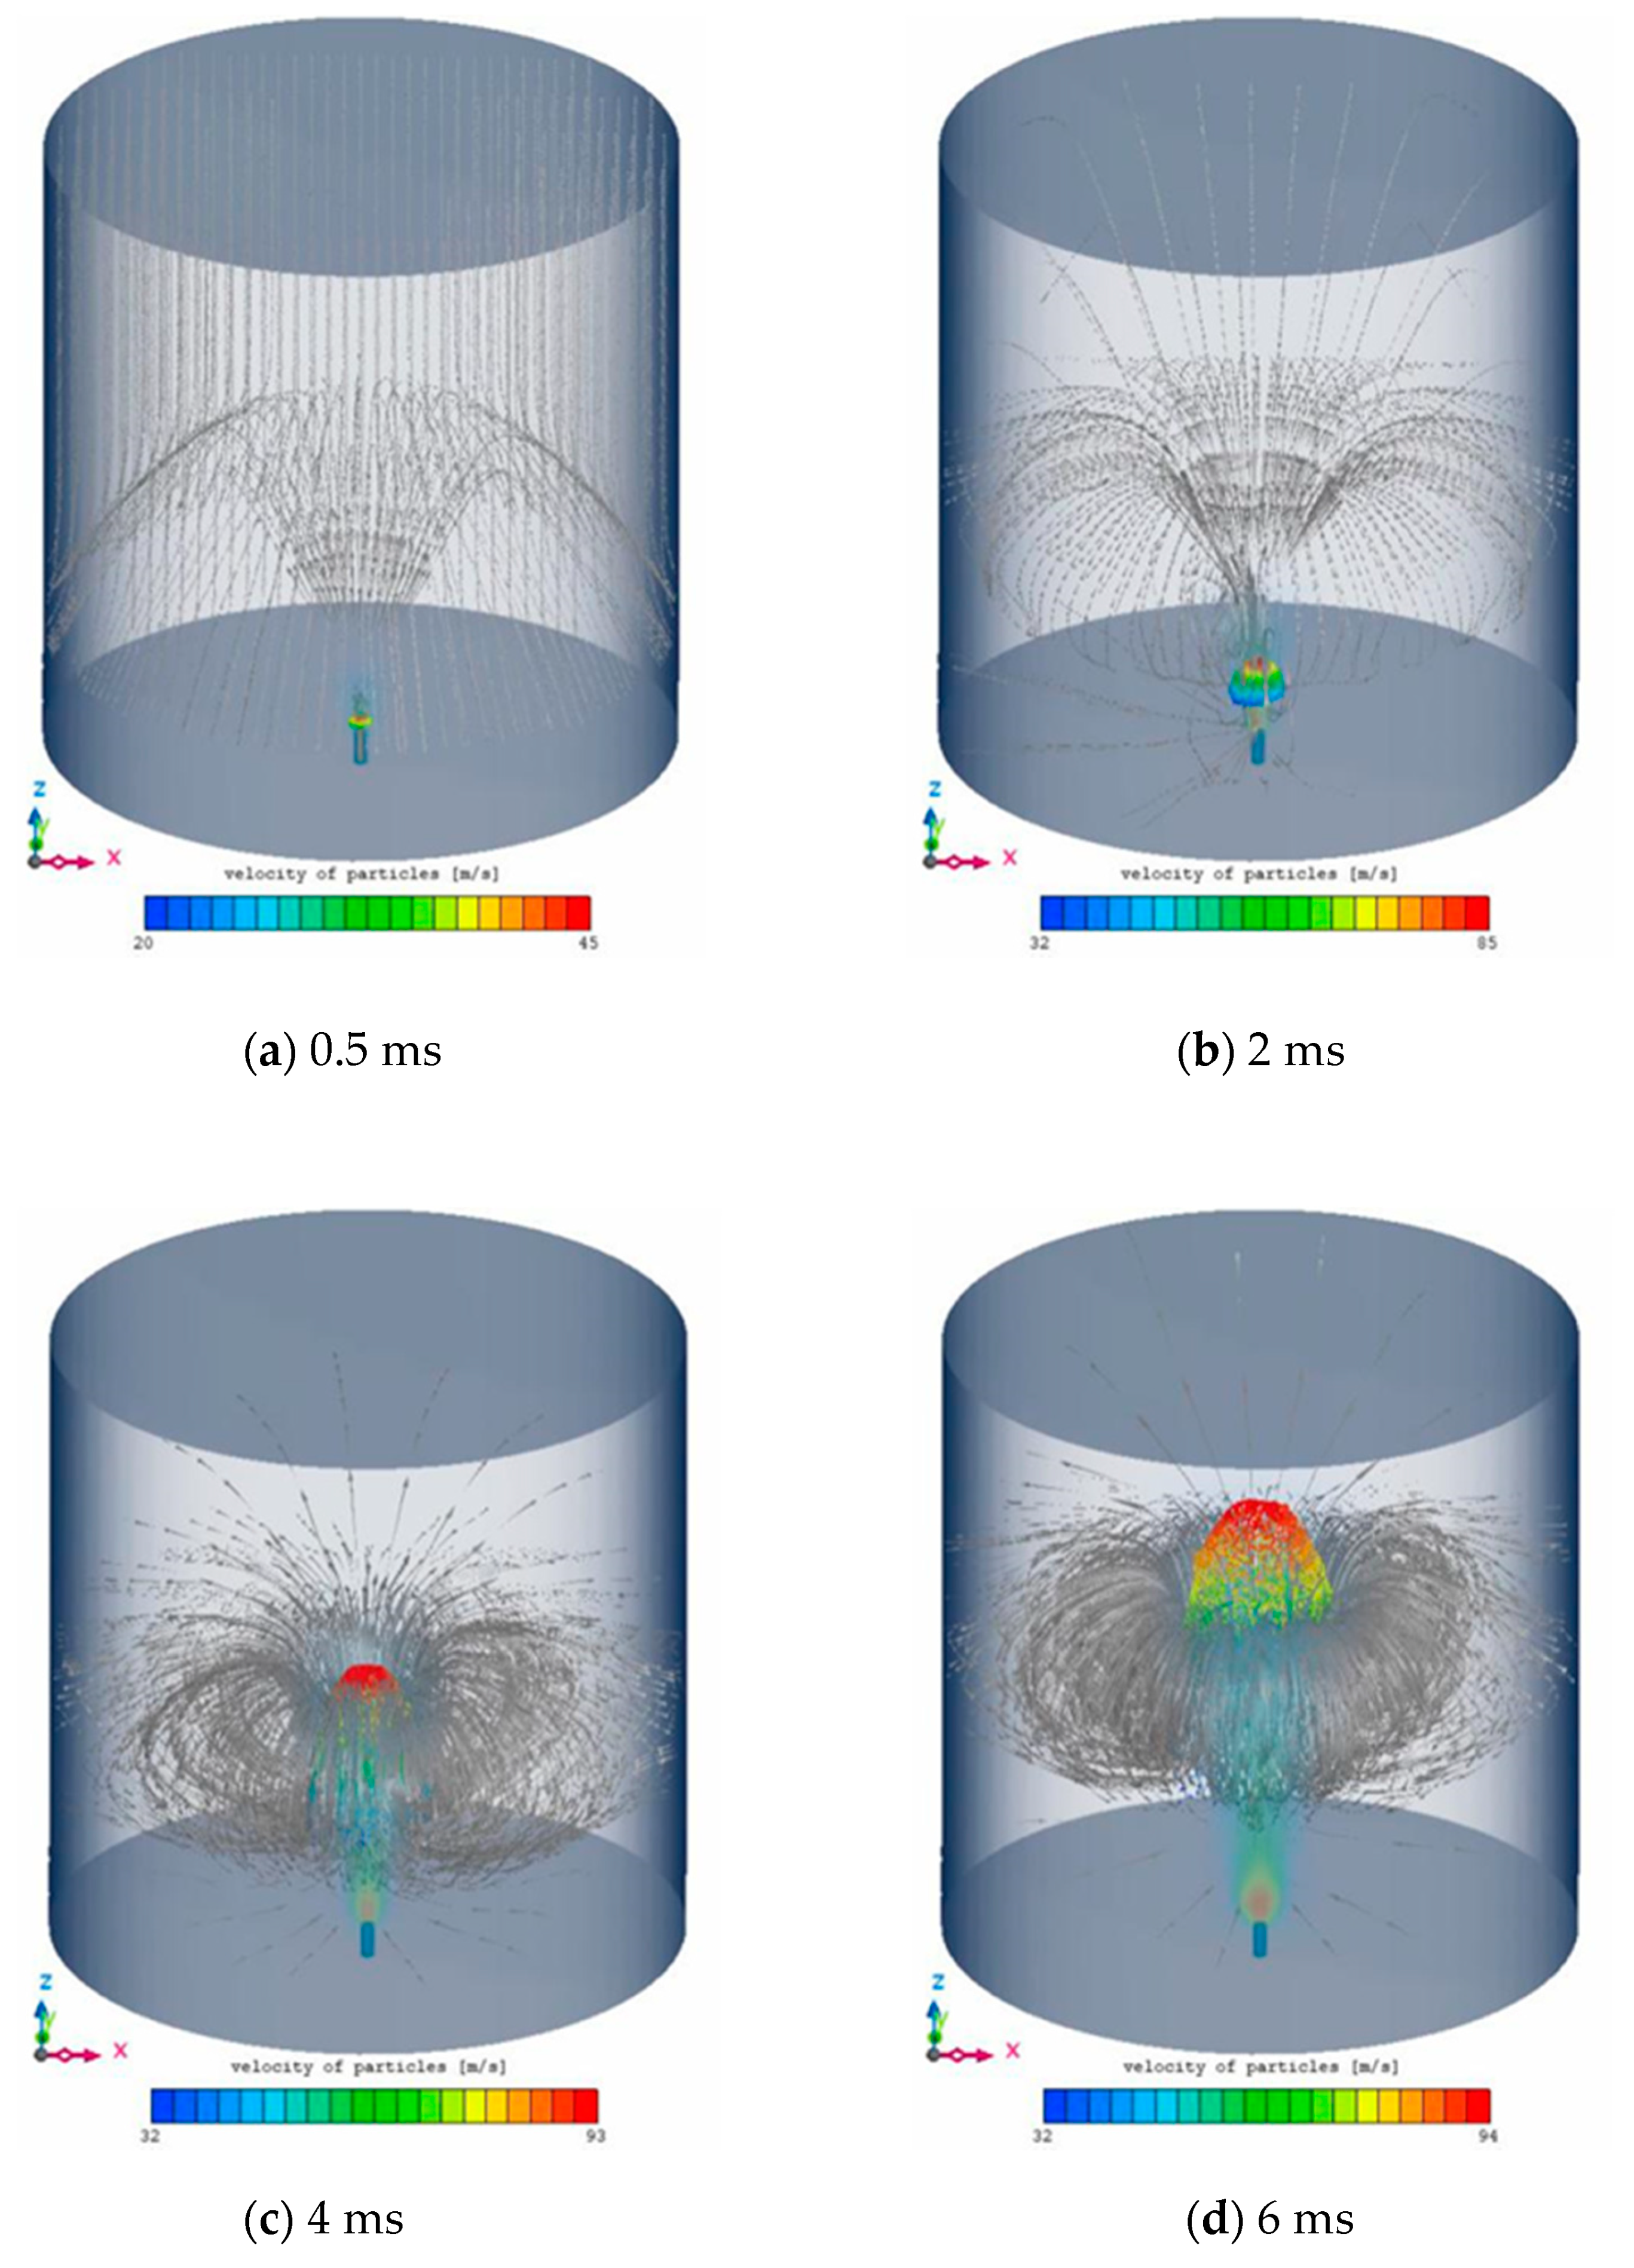
In order to study the detailed flow field distribution and gas–solid two-phase flow during the interaction between shock wave and quartz sand particles, and to further understand the two-phase interaction mechanism, the CFD method was used to numerically simulate the dispersion process of the solid particles with three different sizes (2.5, 0.95, and 0.42 mm) driven by the shock wave. In the simulations, the air was defined as a compressible continuous phase, and the quartz sand particles were defined as incompressible discrete phases, and the interaction between the two phases was considered simultaneously. The solid particles were assumed to be spheres, there is no collision between particles, and the effect of particle volume fraction on the continuous phase was neglected. The boundary conditions of the shock tube surface and external calculation domain were defined as no sliding wall and pressure outlet. The second-order central difference scheme was applied in the calculation. For the initial conditions, the high-pressure section and the low-pressure section were set at 583 and 0 kPa. The simulated dispersion process of the three sizes of quartz sand particles (2.5, 0.95, and 0.42 mm) at different moments are shown in
Figure 9,
Figure 10 and
Figure 11, respectively.
As can be seen from
Figure 9,
Figure 10 and
Figure 11, the velocity distribution of the quartz sand particles showed a clear sense of layering, and the velocity of the particles at the central axis position was significantly greater than that of the surrounding particles, which also explained the reason why the particles show a gradually opened "umbrella" type pattern. The smaller the particle size, the farther the dispersion distance, the larger the formed "umbrella", and the more uniform the particle distribution. Therefore, the simulation results were consistent with the shock wave experimental results, indicating the reliability of the numerical model. In addition, the details of the flow field were also clearly revealed through the CFD simulation. It can be seen from the positions of the shock wave front and the solid particles at 0.5 ms that the particles lagged significantly behind the shock wave during the dispersion process, which verified the theoretical analysis in
Section 4.1. According to the velocity vector distribution of the flow field, an annular vortex was generated around the solid particles, which was mainly caused by the entrainment effect of the fluid. At the same time, the vortex continued to rise as the particles were dispersed upward.
In order to further analyze the shape and formation mechanism of the vortex structure, the vortex generated in the interaction process between the shock wave with the 0.95 mm quartz sand particles was taken as the research object, and the evolution of the three-dimensional annular vortex at different times is shown in
Figure 12.
As shown in
Figure 12, the three-dimensional annular vortex was generated above the shock tube outlet, and the vortex gradually expanded and rose with time. After the shock wave passed through the quartz sand particles, a high-speed jet was formed at the central position above the shock tube. The jet could be divided into a jet core area and a jet boundary layer. The central area that maintained the velocity near the outlet of the shock tube was the jet core area, and the part between the jet core and the static air was the jet boundary layer. In the vertical direction, the transition section from the shock tube outlet to the jet core is called the “initial section” of the jet. The three-dimensional annular vortex observed in the simulation was mainly generated in the jet boundary layer.
During the interaction process between the shock wave and the solid particles, the high-speed jet generated by the shock wave exchanged momentum and energy with the surrounding static air, and then the surrounding air was entrained and moved with the jet. As a result of entrainment and mixing effects, the flow field was gradually homogenized, the jet velocity decreased, and the jet region and the cross-sectional area of the vortex caused by the entrainment effect continued to increase.
4.4. Comparison of Simulations and Experiments
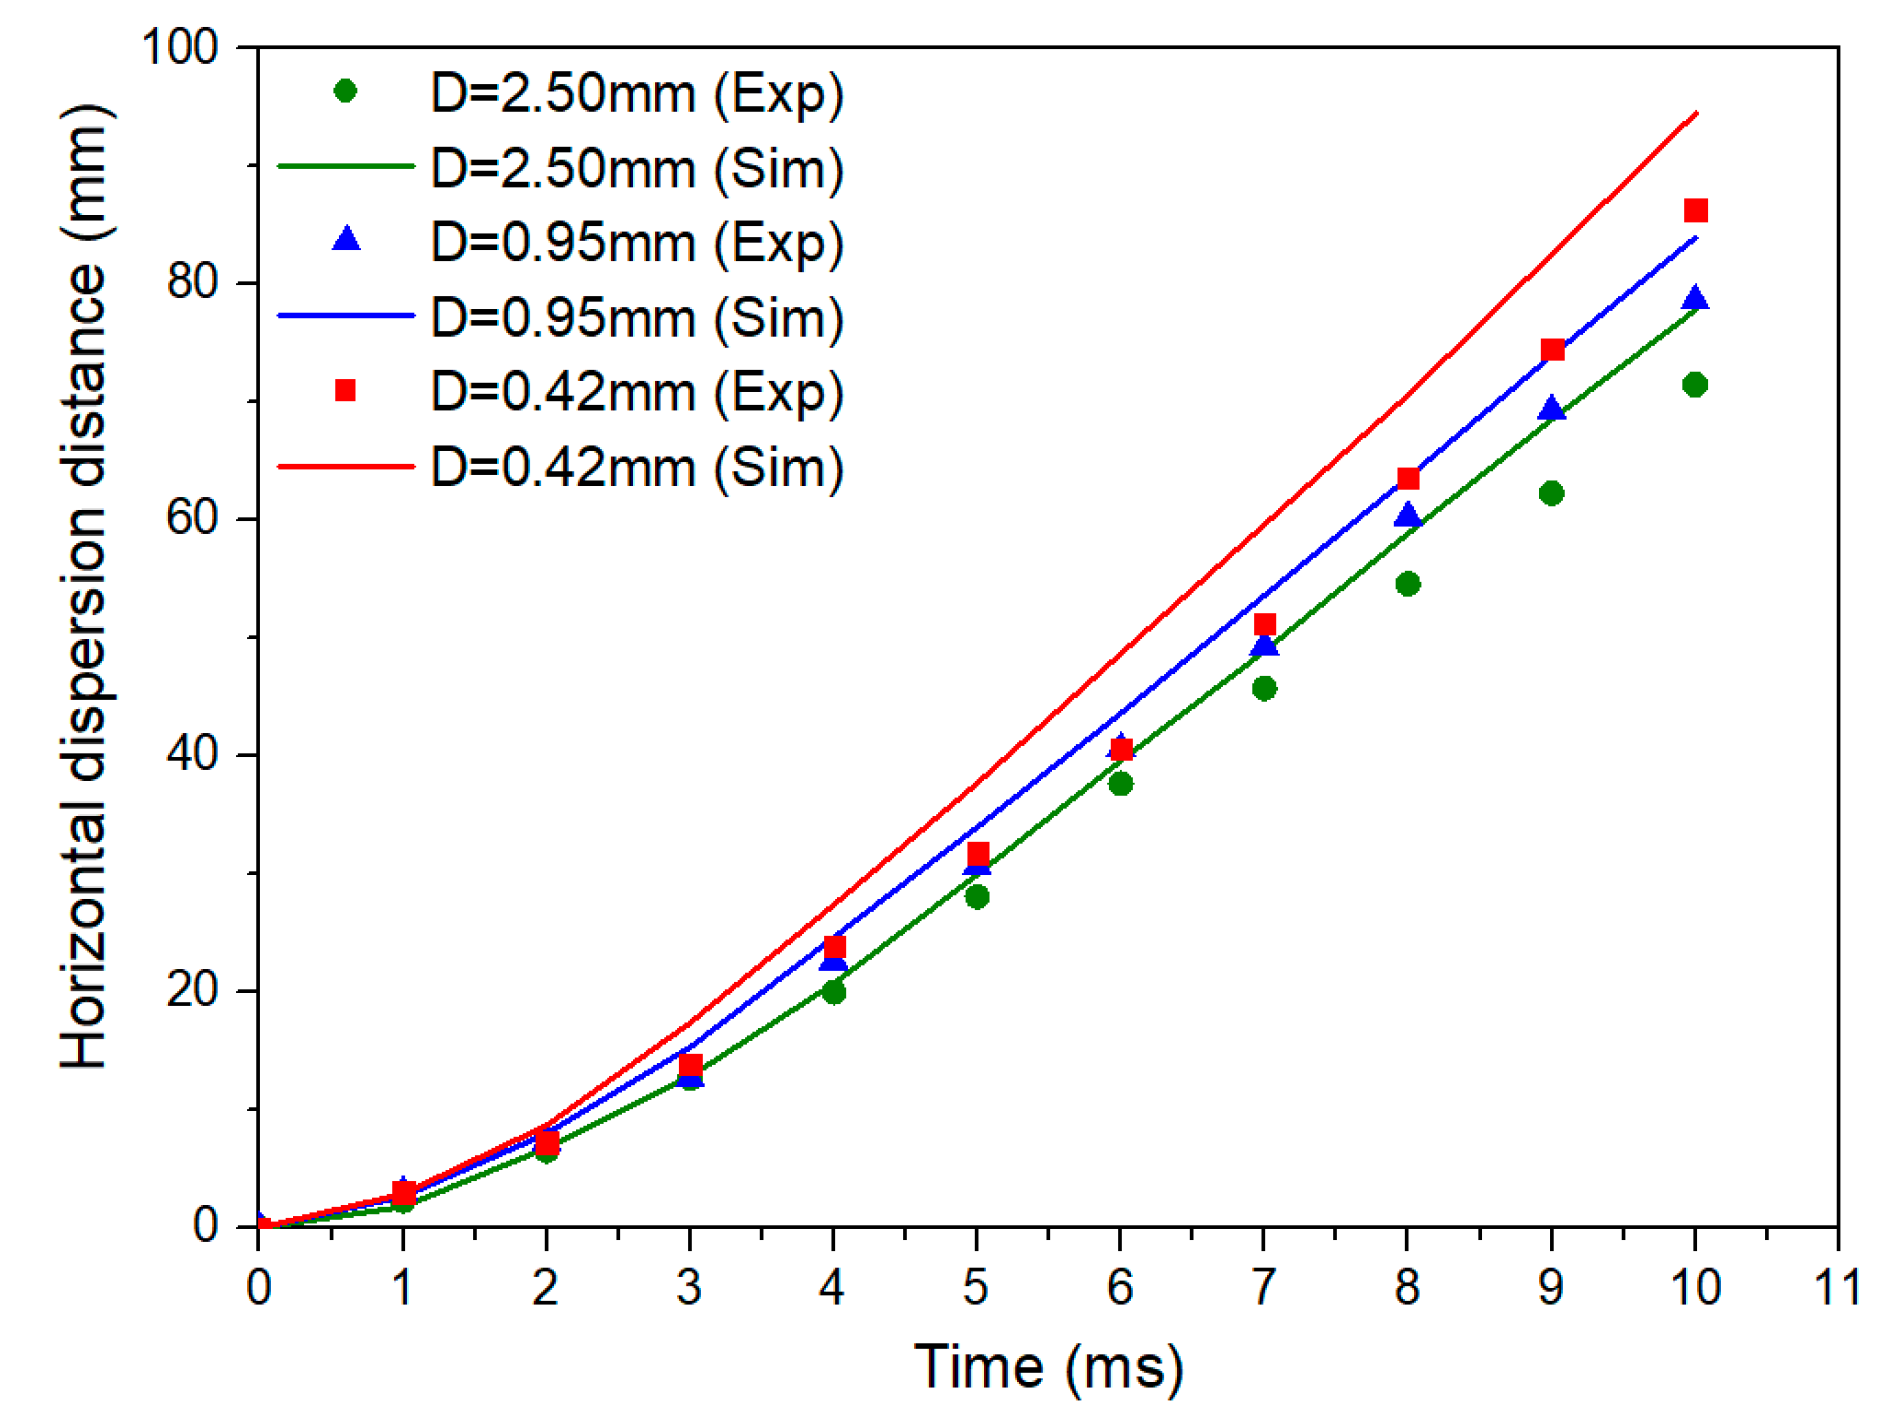
Based on the experimental and simulated particle motion images, the relationship between the vertical and horizontal dispersion distances of the quartz sand particles with time could be obtained and compared, as shown in
Figure 13 and
Figure 14, respectively.
According to
Figure 13 and
Figure 14, the dispersion distance of solid particles in the horizontal direction was smaller than that in the vertical direction at the same moment. The simulated dispersion distances in both directions were in reasonable agreement with the experimental data, further proving the validity of the numerical model. As depicted in
Figure 13, within 0–3 ms after the shock wave acted on the solid particles, the vertical dispersion distance showed an accelerating growth trend, indicating that the vertical velocity of the particles gradually increased during this period. The vertical dispersion distance then increased almost uniformly within 3–6 ms, and the increase slowed after 6 ms, which means that the vertical velocity of the particles gradually decreased. The larger the particle size, the more obvious the velocity drop.
Figure 14 presents that after a period of acceleration (0–3 ms), the horizontal dispersion distance basically showed a linear growth trend, and the horizontal velocity of the particles hardly attenuated within 10 ms.
The motion law of the solid particles in the vertical and horizontal directions is different, which is ascribed to the different forces in the two directions. The solid particles are mainly subjected to drag force, air resistance, and gravity in the vertical direction, while mainly subjected to drag force and air resistance in the horizontal direction. In the initial stage after the interaction, the drag force of the fluid on the solid particles is greater than the gravity and air resistance, resulting in the accelerated motion of the particles. With the passage of time, when gravity dominates, the upward dispersion velocity of the solid particles gradually slows until the particles fall. Furthermore, since the airflow is mainly in the vertical direction, the vertical drag force is significantly greater than the horizontal drag force, causing a greater vertical dispersion distance of the solid particles.
5. Conclusions
In this paper, the gas–solid two-phase flow process of a shock wave interacting with quartz sand particles of different sizes was investigated by a combination of theory, experiment, and numerical simulation. The main conclusions are summarized as follows:
(1) During the interaction between the incident shock wave and quartz sand particles, there appeared reflection and transmission phenomena, and the shock intensity was obviously attenuated. Compared with the blank test, the pressure attenuation of the experiment with particles was greater. This is ascribed to the fact that the shock wave will do work on the solid particles to drive them to be dispersed.
(2) For the three different sizes (2.5, 0.95, and 0.42 mm) of quartz sand particles with the same filling mass, a smaller particle size resulted in a larger moving acceleration, longer dispersion distance, and wider cloud formation.
(3) During the dispersion process, a three-dimensional annular vortex was generated in the jet boundary layer surrounding the solid particles due to the entrainment effect of airflow. The vortex gradually expanded and rose with time.
(4) After the shock wave acted on the particles, a nonequilibrium state was formed between the gas and solid phases and momentum exchange was generated, resulting in a drag force of the shock wave on the particles. The drag force was dominant in the initial stage, causing an accelerated motion of the particles. Then the particles showed different motion laws in the vertical and horizontal directions, which is ascribed to the different forces in the two directions.

