Article

Estimation on Embedment Length of Anchor Bolt inside Concrete Using Equation for Arrival Time and Shortest Time Path of Ultrasonic Pulse

Department of Infrastructure Safety Research, Korea Institute of Civil Engineering and Building Technology, 283 Goyangdae-Ro, Ilsanseo-Gu, Goyang-Si, Gyeonggi-Do 10223, Korea
*
Author to whom correspondence should be addressed.
Appl. Sci. 2020, 10(24), 8848; https://doi.org/10.3390/app10248848
Submission received: 13 October 2020 / Revised: 30 November 2020 / Accepted: 9 December 2020 / Published: 10 December 2020
(This article belongs to the Section Civil Engineering)

Abstract

:
The bearings or the seismic isolation bearings that play a critical role in bridge structures are fixed to the substructure by anchor bolts. However, the embedment depth of the constructed anchor bolts does often not reach the designed one and may lead to safety issues. The present study proposes an ultrasonic non-destructive testing (NDT) method to verify the embedment depth of the anchor bolts installed on bridges in-service. The P-wave of 50–100 kHz that is usually used in the NDT of concrete was transmitted from the head of the anchor bolt and its arrival time on the concrete cover was measured. The shortest arrival time of the ultrasonic pulse and the corresponding path were then analyzed to formulate their relationship and obtain the distance traveled by the ultrasonic pulse along the anchor by inverse analysis using the equation error estimation. The instability occurring in the inverse analysis is settled by regularization. Finally, the embedment depth of the anchor bolt can be estimated by the analysis of the graph plotting the position of the ultrasonic transmitter and the distance traveled by the pulse along the anchor. The proposed method is validated numerically and experimentally. The method is expected to contribute to the NDT of civil structures by making it possible to estimate the embedment depth of anchor bolts by the means of ultrasonic transducers using P-waves of 50–100 kHz.

1. Introduction

The accurate safety inspection technology is required to prevent safety accidents of infrastructures, and various studies have been actively conducted to inspect the structural safety of bridges [1,2,3,4,5,6]. Bridge bearings are especially important due to their connections which accommodate the longitudinal deformations generated by environmental loads and support the traffic and wind loads. Among them, the seismic isolation bearings safely protect the bridge from seismic events by shifting the natural period of the structure under the occurrence of an earthquake, dissipating the seismic energy and enabling the recovery of eventual displacements [7,8,9,10]. These features highlight the crucial role played by the bridge bearings in the structural stability by connecting the superstructure and substructure as well as the importance of their accurate design and construction for letting them fulfill their original functions. In particular, the bearing must be adequately anchored to the substructure by anchor bolts embedded with the required length to be able to transmit the loads [11,12,13]. However, these anchor bolts are often not meeting such a design requirement during their construction or replacement, which may result in the collapse of the whole structure due to the occurrence of problems like the rupture, loosening, damage of anchor bolts or the cracking of the pedestal as shown in Figure 1 [14,15,16,17,18]. Moreover, in view of the peculiarities of the bridge bearing, it is difficult to verify the soundness of the anchor bolt before the failure of the concrete at the support.
Accurately estimating the embedment depth of the anchor bolt using non-destructive testing (NDT) methods is thus necessary to solve such problems. The application of NDT methods such as ultrasonic, impact-echo, impulse thermography, radar, and acoustic emission is being extensively studied because of the possibility to inspect internal damages in the structure without mutilating it while preserving the quality [19,20,21]. Among these methods, those using ultrasonic pulses offer easier measurement as well as easier analysis that make them widely utilized for estimating the strength, analyzing the durable performances and evaluating the setting time of concrete according to various mix conditions and ages as well as detect defects and cracks occurring at the surface [21,22,23,24,25]. Demirboğa et al. proposed a model estimating the compressive strength of concretes with various mix conditions by using the measured ultrasonic velocity as input data [22]. Yeih and Huang utilized the amplitude attenuation method in ultrasonic testing to evaluate the corrosion damage of the steel reinforcement in concrete. These authors experimentally proved the existence of a relationship between the average amplitude attenuation, the circuit potential values, the instantaneous corrosion rate, and the thickness loss [23]. Watanabe et al. evaluated the corrosion-induced crack and rebar corrosion by ultrasonic testing and revealed that the ratio of the propagation distance was characterized by the attenuation, which was correlated with the damage of rebar corrosion [24]. Climent et al. experimentally demonstrated that the crack width at the surface of the concrete could be detected by ultrasonic techniques [25].
The aforementioned studies focused mainly on the detection of cracks at the surface of concrete or on the evaluation of the material properties. In addition, the method using guided ultrasonic pulses can be seen as representative for estimating the embedded length of steel bars like anchor bolts [26,27,28]. This method employs a small transducer and an ultrasonic pulse with a frequency spectrum higher than 0.5 MHz, a narrow diffusion angle and high resolution according to the equation for the beam spread angle [29]. In this method, a two-channel ultrasonic transducer playing the role of both transmitter and receiver is installed at the exposed end of the steel rod and the time taken by the ultrasonic pulse reflected from the buried end of the rod to re-emerge is measured. If the traveling velocity of the ultrasonic pulse in steel is exactly known, the embedded depth of the rod can be estimated by means of the measured time. However, concrete is the most widely used construction material in the civil engineering field, and has non-homogeneous characteristics, so when high-frequency ultrasonic waves are used, attenuation such as scattering occurs severely. Therefore, these methods have a disadvantage in that an ultrasonic device that is less useful in the civil engineering field must be used. Because of the narrow diffusion angle exhibited by ultrasonic frequency spectra higher than 0.5 MHz, the ultrasonic pulse must be emitted in the axial direction of the rod and the structure installed above the exposed end of the steel rod must be completely removed. In addition, if the embedded end of the rod is broken and presents irregularities, the reflected wave will not propagate axially and will likely prevent consistent measurement [30,31,32].
In a will to settle such drawbacks, this study proposes a method estimating the embedment depth of anchor bolts by using ultrasonic P-waves with frequency range of 50–100 kHz that are commonly used for the NDT of concrete. In the P-waves, the oscillations occur in the direction of wave propagation. P-waves are less sensitive to the sample-transducer contact problem than S-waves and allow the more accurate velocity measurements in concrete where higher signal-to-noise ratios can occur [33]. The utilization of a basic ultrasonic device measuring the transmitting–receiving time gap is devised to reduce the economic burden by using highly practicable equipment in the concrete NDT of civil structures. Furthermore, the ultrasonic P-wave for concrete is featured by wide spreading, which allows paying no regard to the reflection angle nor the transmission angle.
The proposed method uses ultrasonic P-waves with a frequency spectrum of 50–100 kHz that is capable of penetrating concrete and steel and an ultrasonic device measuring the time gap between the transmission and the reception of the pulse. The moving path of the P-wave is analyzed using the spreading property of the P-wave with a frequency range of 50–100 kHz and a formula was established to obtain the transmission–reception time gap according to the embedment depth of the anchor bolt. The defined formula is solved by inverse analysis using equation error estimation (EEE) to estimate the embedded length of the anchor bolt. The instability generated in this process is stabilized by regularization.
The proposed method is validated by a numerical example and an experiment. The numerical example simulates an anchor bolt installed in a concrete member with a rectangular section and infinite length and the analysis is conducted considering the measurement errors as well as the errors in the major variables. In addition, the results were analyzed with respect to the changes in the regularization factor to propose a guideline for determining the appropriate value of the regularization factor since the factor plays crucial role in controlling the stability and accuracy of the EEE with the regularization. The experiment performs ultrasonic measurement on prismatic concrete specimens in which anchor bolts were installed. Both the numerical example and experiment demonstrated the high accuracy of the proposed method in estimating the embedment depth of the anchor bolt.

2. Embedded Length of Anchor Bolt inside Concrete

2.1. Problem Definition

Figure 2 schematically illustrates the ultrasonic test conducted for estimating the embedment depth of the anchor bolt buried in concrete. Figure 2a,b show the three-dimensional view of the test specimen and set up and the cross-section of the plane α, respectively. The anchor bolt is disposed vertically in concrete and perpendicularly to the exposed upper face of the concrete block. It is assumed that the concrete cover in the direction perpendicular to the paper is sufficiently thick, and the surface wave arrives later than the P-wave moving along the section in the figure. It is also assumed that the reflection and refraction generated at the boundaries of the aggregates included in concrete have practically no effect and can be ignored [34]. The adopted ultrasonic P-wave has a frequency spectrum of 50–100 kHz that allows it to penetrate concrete and steel. The utilized ultrasonic device is capable of measuring the time gap between the time at which the pulse is emitted and the time at which the receiver detects it. The ultrasonic transmitter is installed at the top of the anchor bolt and the receiver is disposed on the concrete side in the same plane as that of the anchor bolt and performs the measurement by moving vertically. When the ith measurement is done, the position d i (m) of the receiver and the arrival time t i (s) of the ultrasonic pulse are recorded. The measured receiver is taken sequentially from the top to the bottom:
d i > d j   when   i > j
Unlike the ultrasonic pulse with the frequency spectrum for the NDT of steel, the P-wave with a frequency range of 50–100 kHz, which is employed for the ultrasonic NDT of concrete, has a large diffusion angle and propagates with a circular pattern [29]. If the velocity of the P-wave is identical in steel and concrete, the first P-wave received by the receiver will follow the path ABE1 shown in Figure 2. However, the velocity of the P-wave in steel is faster than that in concrete. Consequently, the first P-wave received by the receiver actually propagates along the path ACE1, and the time gap-measuring device measures the travel time of the incoming P-wave that was propagated via this path.
In view of the distance x i (m) travelled by the P-wave along the anchor bolt for the receiver position d i , the P-wave will travel along the path ABE2 regardless of the presence or not of the anchor bolt when the position of the receiver is close to 0, which leads to x i = 0 . If d i increases beyond a definite value, the P-wave will travel along the path ACE1, and x i will take a value determined in function of the P-wave velocities in both materials and d i . Thereafter, if x i increases to reach the embedment length of the anchor bolt that is point C reaches point D, x i cannot experience further increase even if d i increases since the fastest path is a straight line in the homogeneous material. Figure 3 shows the theoretical plot of such a change of x i according to d i . x i is zero for few steps of d i , which corresponds to the path ABE2, and is increased for the next steps of d i , which correspond to the path ABE1. Finally, x i cannot be increased beyond an upper limit for the last steps of d i , which correspond to the path ABE3. In Figure 3, x * is the upper limit to which the values of x i converge. Here, x * thus represents the embedment length of the anchor bolt since the P-wave is transferred through the path ADE3. Accordingly, if the value of x i is known with respect to the position of the receiver d i by a large number of measurements i , the embedded depth of the anchor bolt can be estimated as shown in Figure 3.
x i is obtained as follows:
t i = b V s + x i V s + ( d i x i ) 2 + c 2 V c   for   each   i
where b (m), c (m), V s (m/s), V c (m/s) are, respectively, the exposed length of the anchor bolt outside the concrete, the concrete cover thickness at the receiver position, the propagation velocity of the P-wave along the anchor bolt, and the propagation velocity of the P-wave in concrete. d i , t i , x i are, respectively, the position of the receiver at the ith measurement, the time gap between the time at which the P-wave is generated by the ultrasonic transducer at the ith measurement and the time at which the P-wave is detected by the receiver, and the distance travelled by the P-wave along the anchor bolt at the ith measurement. The subscript i is used to distinguish the measurement according to the position of the receiver. b , c , d i and x i are shown in Figure 2b, where b , c , and d i are values that can be obtained through simple measurements. The terms in the right-hand side of Equation (2) are successively the time required by the P-wave to travel along the exposed length of the anchor bolt (path AB), the time required by the P-wave to travel along the buried length of the anchor bolt (path BC), and the time required by the P-wave to travel through the concrete (path CE). If the velocities of the P-wave in the anchor bolt and concrete are known, the distance x i traveled by the P-wave along the anchor bolt can be obtained by using Equation (2) from the values of d i and t i recorded at the ith measurement.

2.2. Stabilization Using Equation Error Estimation and Regularization

Equation (2) is reformulated as follows as a second-order equation:
( V c 2 V s 2 1 ) x i 2 [ 2 V c 2 1 V s ( t i b V s ) + 2 d i ] x i + V c 2 ( t i b V s ) 2 c 2 d i 2 = 0
From Equation (3), there can be one, two or no solutions for a pair of x i and t i . In the absence of error in all the variables defined in Equations (2) and (3) like the ultrasonic velocity, the cover thickness, the exposed length of the anchor bolt, and the measurement time and position, there will be one or two roots since it is not possible to have no solution.
If there is error in the input variables or in the measured values in the equation accommodating only one double root, the equation will have two solutions or no solution. The two-solution case will be discussed later together with the equation accommodating two roots. Nevertheless, for the no-solution case, the extremum of the second-order equation will provide the closest values to the original solution because there exists a solution for the extremum of the second-order equation with a double root. Accordingly, the closest value to the original solution can be obtained by defining Equation (2) as a minimization problem defined by EEE as follows when there is no solution due to measurement errors:
Min x i Π E = ( t i ¯ t i ( x i ) ) 2 = [ t i ¯ ( b V s + x i V s + ( d i x i ) 2 + c 2 V c ) ] 2   for   each   i
where t i ¯ (s) is the time actually measured by the ultrasonic device.
When Equations (2) and (3) have two roots, Equation (4) has also two solutions and one solution is chosen arbitrarily depending on the selection of the numerical technique to solve the minimization problem. This problem is due to the fact that Equation (4) has actually two solutions rather than being a local minimum issue that arises in an optimization problem. Moreover, the inverse problem defined by an EEE like Equation (4) is known to be very sensitive to noises. Therefore, the regularization term is adopted to solve such instability as follows [35]:
Π r ( x i ) = ( x i x i 1 ) 2
Equation (5) means that the solution x i of the ith measurement shall exist near the x i 1 of the precedent i−1th measurement. As explained for Equation (1), since the receiver is displaced sequentially downward from the top and the measurement done at each location of the receiver, the distance traveled by the P-wave along the anchor bolt also increases gradually. This proves that the value of x i is close to that of x i 1 . Adding Equation (5) to Equation (4) gives:
Min x i ( Π E + Π r ) = ( t i ¯ t i ( x i ) ) 2 + λ ( x i x i 1 ) 2   for   each   i
where λ (s2/m2) is the regularization factor.
The regularization factor is used to control the extent of the regularization effect [35]. The factor does not have any physical meaning but has a unit to match the dimension of Equation (6). A too small regularization factor will make the regularization term failing in playing its role and result in the instability of the solution. In addition, a too large regularization factor will prevent obtaining information about the embedment length of the anchor bolt because the data included in the measurement t i ¯ would not be sufficiently reflected in the solution x i . There is still no common technique that has been developed to find the optimal regularization factor. Accordingly, the optimal regularization factor must be determined for the problem at hand by relying on the engineer’s decision. Fortunately, clear signs can be identified when the regularization factor of Equation (6) falls below the optimal range. Moreover, a regularization factor beyond the optimal range has no noticeable effect on the determination of the solution apart from slowing the convergence rate. This topic will be discussed in the numerical example.
The initial x 0 is set to zero for the regularization of the first measurement. This initial value is chosen because the P-wave will follow the fastest path to the receiver without passing through the buried part of the anchor bolt if the position d 1 of the receiver at the first measurement is practically zero.

3. Numerical and Experimental Verification

The proposed method was validated by means of a numerical example and an experiment. In the numerical example, the measurement error and the error in the ultrasonic transmission velocity are analyzed using simulated data generated under the assumption that the actual traveling velocity of the P-wave coincides exactly to that of Equation (2). In addition, the change in the results is also analyzed according to the variation of the regularization factor. The experiment considers the data obtained from the laboratory test on specimens fabricated by installing anchor bolts in concrete.

3.1. Numerical Verification

As shown in Figure 4, the numerical example considered specimens with various concrete cover thicknesses (100, 200 mm) and different embedment lengths of the anchor bolt (100, 200, 300 mm). Table 1 lists the designation of the specimens according to the embedment length of the anchor bolt and the cover thickness. In the designation, the numbers after “E” and “C” indicate, respectively, the embedment length of the anchor bolt and the cover thickness in mm.
The measurement of x i was computed using Equation (2) so that the arrival time t i became minimal for the position d i of the receiver. A minimization problem is defined to generate measured values for the numerical example using Equation (2).
Min x i t i ¯ = b V s + x i V s + ( d i x i ) 2 + c 2 V c   subjected   to   x i e
where the embedded depth of the anchor, the cover thickness, and the exposed length of the anchor are as given for each specimen. The adopted velocity of the ultrasonic pulse is 3800 m/s in concrete and 5900 m/s in the anchor [36,37,38,39]. The value of t i corresponding to x i calculated by Equation (7) is accepted as the exact measured value. In order to consider the case where perfect measurement is not achieved due to the presence of voids or irregularities in concrete, the exact measured values were mixed with a uniformly distributed white noise of ±3% of the measurement.
Figure 5 and Figure 6 present the results of the simulation for the cases with a cover thickness of 100 and 200 mm, respectively. The convergence value where x i starts to converge was determined by the engineer’s decision. The final value x * was decided to be the average of the transferred distance of the ultrasonic pulse through the embedded anchor bolt after the convergence. As shown in Figure 5 and Figure 6, the scattering of the test data is very wide before the introduction of regularization, so it is impossible to determine the point at which the value begins to converge. Therefore, it is necessary to find a convergence value by reducing the scattering degree of test data by introducing regularization and using an appropriate regularization factor. In this study, an optimal value of 0.02 for the regularization factor was obtained empirically and used for solving Equation (6). If a regularization factor higher than 0.02 was used, the scattering degree can be reduced, but there was a disadvantage in that the data convergence is delayed. As shown in Figure 6c, when a regularization factor of 0.02 was used, the convergence value could be determined within the range of the x axis (0–1000 mm) in the case of the E300C200 specimen. Therefore, the regularization factor of 0.02 was used for the equal comparison of all specimens. The determination of the regularization factor was discussed at the end of the present section. The resulting estimated embedment depth of the anchor bolt for the specimens E100C100, E200C100, E300C100, E100C200, E200C200, and E300C200 was, respectively, 100.1, 202.2, 298.4, 102.9, 199.9, and 315.9 mm, which showed respective errors of 0.1, 1.1, 0.5, 2.9, 0.0, and 5.3% compared to the exact depths of 100, 200, 300, 100, 200, and 300 mm. Table 2 summarizes the results. Even though a white noise of 3% was introduced, the error remained below 5.3% in all six cases. At the exception of case E300C200, the error remained at an ignorable level. Consequently, the proposed method appeared to provide good results against the white noise disturbance of the measuring device.
When the problem was solved using Equation (5), which does not apply regularization, numerous outliers occurred as shown in Figure 5 and Figure 6. These outliers can be credited to the fact that a solution that is not the exact solution had to be selected through the optimization of Equation (5) among the two roots of the second order equation in Equation (3). If the result including the outlier is used, the final value x * cannot be obtained properly. However, the results of Equation (6), which applies regularization, are free of outliers, which eases the assessment of the convergence value. Moreover, the solutions obtained by Equation (5) without the regularization exhibit the wide dispersion, whereas the solutions using regularization show relatively lesser dispersion and smooth continuity that ease the assessment of the convergence value. The comparison of the exact solution with the results of Equation (6) reveals that the regularization tended to delay the convergence. This delay is common when using the precedent solution in the regularization as in Equation (6) but this delay does not affect the final value itself [40].
The exact value of the P-wave transfer velocity, which is one major variable in Equation (2), is often difficult to determine. The most accurate value can be obtained if the velocity is measured directly on site but the measured value is likely to be polluted by various errors like measurement error. Figure 7 plots the results of Equation (6) in the cases where the velocities of the P-wave in the anchor bolt and in the concrete have errors of 1, 2, 3% for specimen E100C100 case. When errors of −3, −2, −1, 1, 2, and 3% were introduced in the P-wave velocity V s in the anchor bolt, the estimated embedded depth was, respectively, 110.5, 106.6, 102.8, 95.9, 92.7, and 89.7 mm corresponding to estimation errors of 10.5, 6.6, 2.8, 4.1, 7.3, and 10.3%. When errors of −3, −2, −1, 1, 2, and 3% were introduced in the P-wave velocity V c in concrete, the estimation provided embedment depths of 156.5, 137.8, 118.8, 79.6, 59.4, and 38.9 mm corresponding to estimation errors of 56.5, 37.8, 18.8, 20.4, 40.6, and 61.1%, respectively. The estimated embedment depth of the anchor bolt appeared thus to be very sensitive to the error in the P-wave velocity. Consequently, the velocity should be measured as accurately as possible to apply the proposed method. The estimated results were also seen to be more sensitive to the P-wave velocity in concrete than to that in the anchor bolt because the path of the pulse was longer in concrete than in the anchor bolt. Therefore, the sensitivity can be modified by changing the ratio of the concrete cover thickness to the embedded depth of the anchor bolt. For example, if the thickness of the concrete cover is thin, the length of the P-wave transmitted through concrete is short, so the P-wave velocity of concrete will not have a significant effect on the estimated results. Conversely, if the thickness of the concrete cover is thick, the length of the P-wave transmitted through concrete becomes longer, so the P-wave velocity of concrete will have a great influence on the estimated results.
Figure 8 plots the variation of the estimation according to the value of the regularization factor of Equation (6) for case E100C100. The regularization factor of 0 corresponds to solving Equation (5) that does not apply regularization. The regularization factor of 0.0001 appears to have a very weak regularization effect and produces solutions with a dispersion comparable to the non-application of regularization but the complete removal of outliers is noteworthy. The quasi-absence of improvement in the dispersion indicated that the value of the factor was too small. Increasing the value of the regularization factor led to the gradual reduction in the instability of the solution and clear convergence but at the expense of a clearly slower convergence to the solution. Consequently, the accuracy of the estimation of the embedded depth of the anchor bolt can be improved by selecting a large regularization factor when there is sufficient space for displacing the ultrasonic receiver and perform measurement until large d i . Moreover, when it is difficult to secure a sufficiently large d i , a relatively smaller regularization factor shall be used to verify the convergence to the solution.
An appropriate regularization factor can thus be selected in view of the circumstances and the comparison presented in Figure 8. If it is difficult to determine the convergence value because of excessive dispersion, the regularization factor shall be increased. On the other hand, the regularization factor shall be decreased appropriately and stepwise when the convergence value cannot be distinguished due to excessively slow convergence.

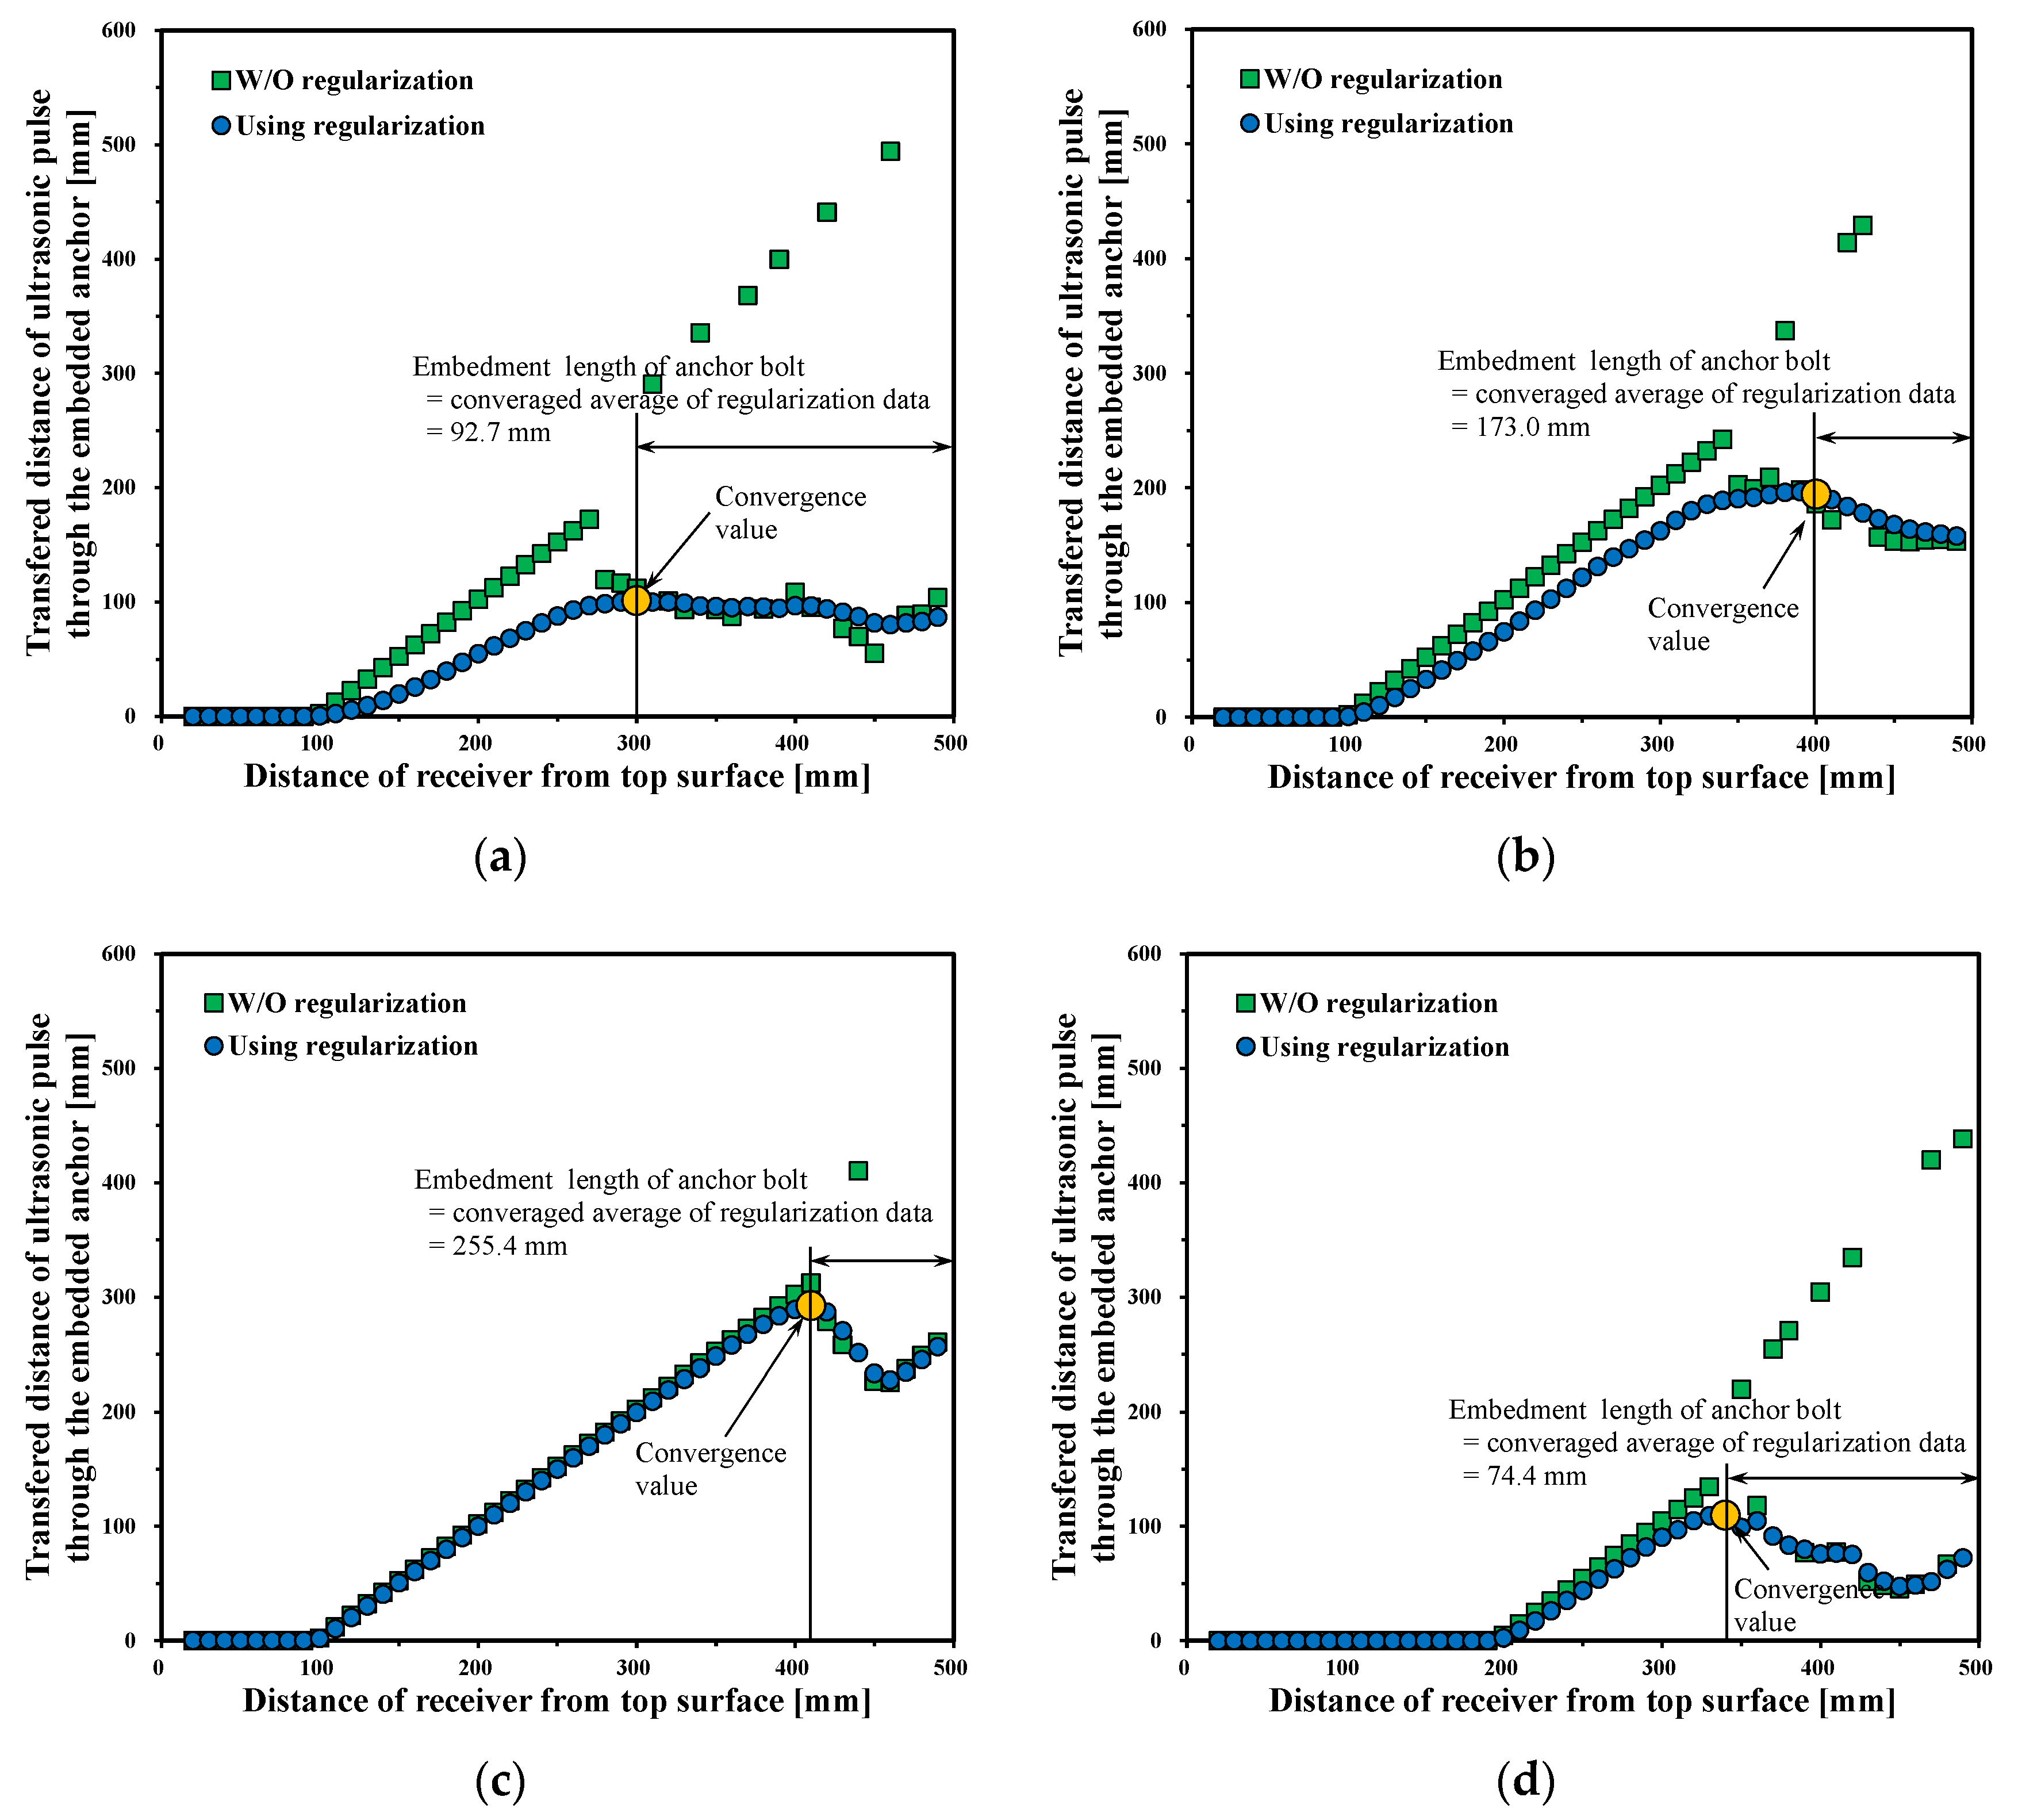
3.2. Experimental Verification

The specimens were made of concrete with a compressive strength of 27 MPa. The adopted cement was Type-I OPC with a Blaine fineness of 3414 cm2/g and density of 3.15 g/cm3. The fly ash of Class F type as defined in [41] and the ground granulated blast-furnace slag (GGBFS) powder was also introduced. The density and surface area of fly ash were 2.13 g/cm3 and 3850 cm2/g, respectively, and those of GGBFS were 2.89 g/cm3 and 4330 cm2/g, respectively. Natural sand and crushed limestone with a maximum particle size of 5 and 25 mm, respectively, were used as the fine and coarse aggregates. Products with SiO2 content larger than 98% were adopted as aggregate. Fly ash and GGBFS were admixed at weight ratios to binder of 15% and 25%, respectively. The water-to-binder ratio was 0.45. Polycarboxylate polymers were also adopted as superplasticizer to secure the workability of fresh concrete and provided a slump of 150 mm. Table 3 arranges the mixture proportions and properties of concrete.
Two specimens were fabricated with anchors embedded to depths of 100 and 200 mm according to the conditions mentioned above. The dimensions of the concrete specimens were 500 × 500 × 500 mm3 and the exposed length of the anchor was 100 mm. In addition, the two specimens were fabricated to have different cover thicknesses of 100 and 200 mm on their sides. Figure 9 shows a photograph together with the details of the specimens. The designation of the specimens for each considered case was the same as that in the numerical verification.
The travel time of the ultrasonic pulse was measured using the Ultracon-170 ultrasonic detector developed by MKC Korea. The ultrasonic transducer has a transmission pulse frequency 52 kHz and the travel time was acquired with a resolution of 0.1 μs. A thin layer of petroleum jelly was used at the interface between the transducers and specimen to dispel air between them. As shown in Figure 9, the transmitter was disposed at the head of the exposed part of the anchor and the receiver was displaced sequentially downward from the top of the concrete to measure the arrival time of the ultrasonic pulse.
Figure 10 shows the measured and theoretically calculated values for the arrival time of the ultrasonic pulse in each specimen. As shown in Figure 10a, as the distance of the receiver from the top surface of concrete increased, the arrival time of the ultrasonic pulse gradually lengthened because the transferred distance of ultrasonic pulse through the concrete and anchor bolt increased. When the receiver was located on the upper part of concrete, the arrival time of ultrasonic pulse was dominantly influenced by the cover thickness, and the values were almost similar regardless of the embedment length of the anchor bolt in the case of the same cover thickness. However, as the location of the receiver became further from the top of the concrete, there was a clear difference in the arrival time of the ultrasonic pulse due to the difference in the embedment depth of the anchor bolt. Figure 10b shows a comparison of the measured arrival time of the ultrasonic pulse with that calculated using Equation (2). The error between the measured value and the theoretically calculated value was found to be within about 5%.
Figure 11 plots x i were obtained by substituting the measured arrival time of the ultrasonic pulse into Equation (6) with respect to the position of the receiver for the considered specimens. Here, the adopted P-wave velocities in the anchor bolt and concrete were those actually measured in the specimens and were, respectively, 5906 and 4126 m/s. For specimen E100C100, the value of 0.02 that was used in the numerical verification was applied for the regularization factor and the corresponding results are shown in Figure 11a. However, for specimens E200C100, E300C100 and E100C200, the transferred distance of the ultrasonic pulse through the anchor did not converge within the measurement range when using 0.02 for the regularization factor and the embedment length of the anchor could not be determined. Subsequently, the regularization factor was adjusted to 0.01 to secure the convergence for the specimens E200C100, E300C100 and E100C200. This decrease in the regularization factor resulted in a slight loss of the accuracy in the estimation of the embedment length of the anchor due to the wider dispersion of the results. The results for E200C100, E300C100 and E100C200 are plotted in Figure 11b–d, respectively. The values of the measured arrival time of the ultrasonic pulse include noises from various variables such as the error in the P-wave velocity in concrete and the anchor, the error brought by the material heterogeneity of concrete, the error due to the difference in the position of the transmitter and receiver, and the error caused by the refraction and reflection of the wave at the interface between the anchor and the concrete [22,42]. However, the results were seen to resemble the theoretical result shown in Figure 3.
The distance of the receiver from the top surface at which the value of the transferred distance of the ultrasonic pulse through the anchor starts to converge was determined to be approximately 300 mm for specimen E100C100 by the engineer’s decision. Then, the embedded depth of the anchor was estimated via the ultrasonic pulse by the average of the values of the transferred distance of ultrasonic pulse through the anchor for the distances of the receiver from the top surface larger than 300 mm. The embedment length of the anchor for specimens E100C100, E200C100, E300C100, and E100C200 estimated by this approach were, respectively, 92.7, 173.0, 255.4, and 74.4 mm of which errors were 7.3, 13.5, 14.9, and 25.6% compared to the actual depths (see Table 4). The higher accuracy of the estimation achieved for specimen E100C100 compared to the other specimens can be explained by the relatively faster convergence of the transferred distance of the ultrasonic pulse through the anchor, which provided a larger number of data to calculate the average that is used to estimate the embedment length. In addition, the utilization of a relatively greater regularization factor for E100C100 also helped in the improvement of the accuracy. For specimens E200C100, E300C100 and E100C200, the position of the receiver at which the transferred distance of the ultrasonic pulse through the anchor started to converge was relatively larger than the specimens’ height, which provided a lesser number for calculating the average. Moreover, the adoption of a relatively smaller regularization factor increased the error. In addition, concrete may deteriorate and shrink due to chemical reaction and moisture movement, and cracks may occur inside as well as on the surface, which can greatly attenuate the propagation velocity of ultrasonic P-waves [43,44]. These factors are also considered to have an effect on the error of the estimated results. Nevertheless, the error remains at an acceptable level considering that the specimens were offered an environment similar to that of the anchor bolt in a real bridge and the presence of fabrication error in the specimens.

4. Conclusions

This study presented a new ultrasonic NDT method using an inverse analysis approach to estimate the embedment depth of anchor bolts in concrete. The P-wave with frequency range of 50–100 kHz usually used for concrete was exploited to formulate analytically the time taken by the pulse emitted from the top of the anchor bolt to arrive to the receiver attached to concrete. The so-derived formula was defined by the inverse analysis using the EEE, and the instability generated in the inverse analysis was controlled by the regularization. The embedded depth of the anchor bolt obtained from the optimization problem converged to the actual embedment depth according to the location of the receiver. A numerical verification and an experiment in laboratory were conducted considering various embedded depths of the anchor bolt and different concrete cover thicknesses. The proposed method estimated the embedment lengths of the anchor bolts with less than 15% error for the covering depth of 100 mm and less than 26% error for the covering depth of 200 mm. The regularization factor selection issue was settled by providing a guideline in the numerical verification.
The proposed method may not be convenient comparing to other NDTs such as the ultrasonic frequency range for steel, since multiple measurements must be made on one specimen. The suggested method, however, is useful when only a P-wave generator for concrete is available. Thus, the suggested method adopted the ultrasonic device-generating P-wave for the NDT of concrete is expected to contribute t various fields of safety inspections.

Author Contributions

Conceptualization, C.S., and K.-Y.P.; methodology, K.-Y.P.; validation, Y.J.K., and W.J.C.; formal analysis, K.-Y.P.; investigation, C.S., and C.B.C.; resources, C.S., C.B.C.; data curation, C.S.; writing—original draft preparation, C.S., and K.-Y.P.; writing—review and editing, C.S., and K.-Y.P.; visualization, C.S.; supervision, K.-Y.P.; project administration, Y.J.K.; funding acquisition, Y.J.K. All authors have read and agreed to the published version of the manuscript.

Funding

This research was funded by the Korea Institute of Civil Engineering and Building Technology (KICT) of the Republic of Korea, Project No. 2020-0038.

Conflicts of Interest

The authors declare no conflict of interest.

References

  1. Ahmed, H.; La, H.M.; Gucunski, N. Review of non–destructive civil infrastructure evaluation for bridges: State–of–the–art robotic platforms, sensors and algorithms. Sensors 2020, 20, 3954. [Google Scholar] [CrossRef] [PubMed]
  2. Gibb, S.; La, H.M.; Le, T.; Nguyen, L.; Schmid, R.; Pham, H. Nondestructive evaluation sensor fusion with autonomous robotic system for civil infrastructure inspection. J. Field Robot. 2018, 35, 988–1004. [Google Scholar] [CrossRef]
  3. Gucunski, N.; Kee, S.; La, H.; Basily, B.; Maher, A. Delamination and concrete quality assessment of concrete bridge decks using a fully autonomous RABIT platform. Struct. Monit. Maint. 2015, 2, 19–34. [Google Scholar] [CrossRef] [Green Version]
  4. La, H.M.; Gucunski, N.; Kee, S.H.; Van Nguyen, L. Data analysis and visualization for the bridge deck inspection and evaluation robotic system. Vis. Eng. 2015, 3, 1–16. [Google Scholar] [CrossRef]
  5. La, H.M.; Gucunski, N.; Dana, K.; Kee, S.H. Development of an autonomous bridge deck inspection robotic system. J. Field Robot. 2017, 34, 1489–1504. [Google Scholar] [CrossRef] [Green Version]
  6. Prasanna, P.; Dana, K.J.; Gucunski, N.; Basily, B.B.; La, H.M.; Lim, R.S.; Parvardeh, H. Automated crack detection on concrete bridges. IEEE Trans. Autom. Sci. Eng. 2014, 13, 591–599. [Google Scholar] [CrossRef]
  7. Kim, S.H.; Mha, H.S.; Lee, S.W. Effects of bearing damage upon seismic behaviors of a multi–span girder bridge. Eng. Struct. 2006, 28, 1071–1080. [Google Scholar] [CrossRef]
  8. Filipov, E.T.; Fahnestock, L.A.; Steelman, J.S.; Hajjar, J.F.; LaFave, J.M.; Foutch, D.A. Evaluation of quasi–isolated seismic bridge behavior using nonlinear bearing models. Eng. Struct. 2013, 49, 168–181. [Google Scholar] [CrossRef]
  9. Yakut, A.; Yura, J.A. Evaluation of low–temperature test methods for elastomeric bridge bearings. J. Bridge Eng. 2002, 7, 50–56. [Google Scholar] [CrossRef]
  10. Choi, E.; DesRoches, R.; Nielson, R. Seismic fragility of typical bridges in moderate seismic zones. Eng. Struct. 2004, 26, 187–199. [Google Scholar] [CrossRef]
  11. Xu, C.; Heping, C.; Bin, L.; Fangfang, Z. Modeling of anchor bolt pullout in concrete based on a heterogeneous assumption. Nucl. Eng. Des. 2011, 241, 1345–1351. [Google Scholar] [CrossRef]
  12. Lu, J.; Zhang, Y.; Muhammad, H.; Chen, Z.; Xiao, Y.; Ye, B. 3D analysis of anchor bolt pullout in concrete materials using the non–ordinary state–based peridynamics. Eng. Fract. Mech. 2019, 207, 68–85. [Google Scholar] [CrossRef]
  13. Pitrakkos, T.; Tizani, W. Experimental behaviour of a novel anchored blind–bolt in tension. Eng. Struct. 2013, 49, 905–919. [Google Scholar] [CrossRef]
  14. Korea Institute of Civil Engineering and Building Technology (KICT). Development of Safety Improvement Technology for Bridge Weak Connection and Seismic Equipment to Secure Evacuation and Recovery Route in Earthquake; KICT 2019–043 Technical Report; KICT: Goyang-si, Korea, 2019. [Google Scholar]
  15. Hashimoto, J.; Takiguchi, K. Experimental study on pullout strength of anchor bolt with an embedment depth of 30 mm in concrete under high temperature. Nucl. Eng. Des. 2004, 229, 151–163. [Google Scholar] [CrossRef]
  16. Shirvani, M.; Klingner, R.E.; Graves, H.L. Breakout capacity of anchors in concrete part 1: Tension. ACI Struct. J. 2004, 101, 812–820. [Google Scholar]
  17. Lee, N.H.; Kim, K.S.; Chang, J.B.; Park, K.R. Tensile–headed anchors with large diameter and deep embedment in concrete. ACI Struct. J. 2007, 104, 479–486. [Google Scholar]
  18. Petersen, D.; Zhao, J. Design of anchor reinforcement for seismic shear loads. ACI Struct. J. 2013, 110, 53–62. [Google Scholar]
  19. McCann, D.M.; Forde, M.C. Review of NDT methods in the assessment of concrete and masonry structures. NDT E Int. 2001, 34, 71–84. [Google Scholar] [CrossRef]
  20. Oh, T.; Kee, S.H.; Arndt, R.W.; Popovics, J.S.; Zhu, J. Comparison of NDT methods for assessment of a concrete bridge deck. J. Eng. Mech. 2013, 139, 305–314. [Google Scholar] [CrossRef]
  21. Drinkwater, B.W.; Wilcox, P.D. Ultrasonic arrays for non–destructive evaluation: A review. NDT E Int. 2006, 39, 525–541. [Google Scholar] [CrossRef]
  22. Demirboğa, R.; Türkmen, İ.; Karakoc, M.B. Relationship between ultrasonic velocity and compressive strength for high–volume mineral–admixtured concrete. Cem. Concr. Res. 2004, 34, 2329–2336. [Google Scholar] [CrossRef]
  23. Yeih, W.; Huang, R. Detection of the corrosion damage in reinforced concrete members by ultrasonic testing. Cem. Concr. Res. 1998, 28, 1071–1083. [Google Scholar] [CrossRef]
  24. Watanabe, T.; Trang, H.T.H.; Harada, K.; Hashimoto, C. Evaluation of corrosion–induced crack and rebar corrosion by ultrasonic testing. Constr. Build. Mater. 2014, 67, 197–201. [Google Scholar] [CrossRef]
  25. Climent, M.Á.; Miró, M.; Carbajo, J.; Poveda, P.; de Vera, G.; Ramis, J. Use of non–linear ultrasonic techniques to detect cracks due to steel corrosion in reinforced concrete structures. Materials 2019, 12, 813. [Google Scholar] [CrossRef] [PubMed] [Green Version]
  26. Beard, M.D.; Lowe, M.J.S. Non–destructive testing of rock bolts using guided ultrasonic waves. Int. J. Rock Mech. Min. Sci. 2003, 40, 527–536. [Google Scholar] [CrossRef]
  27. Chaki, S.; Bourse, G. Guided ultrasonic waves for non–destructive monitoring of the stress levels in prestressed steel strands. Ultrasonics 2009, 49, 162–171. [Google Scholar] [CrossRef]
  28. Rizzo, P.; Han, J.G.; Ni, X.L. Structural health monitoring of immersed structures by means of guided ultrasonic waves. J. Intell. Mater. Syst. Struct. 2010, 21, 1397–1407. [Google Scholar] [CrossRef]
  29. Zielińska, M.; Rucka, M. Detection of debonding in reinforced concrete beams using ultrasonic transmission tomography and hybrid ray tracing technique. Constr. Build. Mater. 2020, 262, 120104. [Google Scholar] [CrossRef]
  30. Wilcox, P.; Lowe, M.; Cawley, P. The effect of dispersion on long–range inspection using ultrasonic guided waves. NDT E Int. 2001, 34, 1–9. [Google Scholar] [CrossRef]
  31. Abbas, M.; Shafiee, M. Structural health monitoring (SHM) and determination of surface defects in large metallic structures using ultrasonic guided waves. Sensors 2018, 18, 3958. [Google Scholar] [CrossRef] [Green Version]
  32. Yan, S.; Zhang, B.; Song, G.; Lin, J. PZT–based ultrasonic guided wave frequency dispersion characteristics of tubular structures for different interfacial boundaries. Sensors 2018, 18, 4111. [Google Scholar] [CrossRef] [PubMed] [Green Version]
  33. Robeyst, N.; Gruyaert, E.; Grosse, C.U.; De Belie, N. Monitoring the setting of concrete containing blast–furnace slag by measuring the ultrasonic p–wave velocity. Cem. Concr. Res. 2008, 38, 1169–1176. [Google Scholar] [CrossRef]
  34. Krautkrämer, J.; Krautkrämer, H. Ultrasonic Testing of Materials; Springer Science & Business Media: Berlin, Germany, 1990. [Google Scholar]
  35. Park, K.-Y.; Lee, H.S. Formulation of equation error estimator using measured displacement De–noised by temporal–spatial filter for system identification of elastic solids. Inverse Probl. Sci. Eng. 2020, 28, 1423–1452. [Google Scholar] [CrossRef]
  36. Solis–Carcaño, R.; Moreno, E.I. Evaluation of concrete made with crushed limestone aggregate based on ultrasonic pulse velocity. Constr. Build. Mater. 2008, 22, 1225–1231. [Google Scholar] [CrossRef]
  37. Rao, S.K.; Sravana, P.; Rao, T.C. Experimental studies in Ultrasonic Pulse Velocity of roller compacted concrete pavement containing fly ash and M–sand. Int. J. Pavement Res. Technol. 2016, 9, 289–301. [Google Scholar] [CrossRef] [Green Version]
  38. Palanichamy, P.; Vasudevan, M.; Jayakumar, T.; Venugopal, S.; Raj, B. Ultrasonic velocity measurements for characterizing the annealing behaviour of cold worked austenitic stainless steel. NDT E Int. 2000, 33, 253–259. [Google Scholar] [CrossRef]
  39. Gür, C.H.; Cam, I. Comparison of magnetic Barkhausen noise and ultrasonic velocity measurements for microstructure evaluation of SAE 1040 and SAE 4140 steels. Mater. Charact. 2007, 58, 447–454. [Google Scholar] [CrossRef]
  40. Kang, J.S.; Park, S.-K.; Shin, S.; Lee, H.S. Structural system identification in time domain using measured acceleration. J. Sound Vib. 2005, 22, 215–234. [Google Scholar] [CrossRef]
  41. ASTM C618–15. Standard Specification for Coal Fly Ash and Raw or Calcined Natural Pozzolan for Use in Concrete; ASTM International: West Conshohocken, PA, USA, 2015. [Google Scholar]
  42. Molero, M.; Segura, I.; Hernández, M.G.; Izquierdo, M.A.G.; Anaya, J.J. Ultrasonic wave propagation in cementitious materials: A multiphase approach of the self–consistent multiple scattering model. Ultrasonics 2011, 51, 71–84. [Google Scholar] [CrossRef]
  43. Nguyen, Q.D.; Kim, T.; Castel, A. Mitigation of alkali–silica reaction by limestone calcined clay cement (LC3). Cem. Concr. Res. 2020, 137, 106176. [Google Scholar] [CrossRef]
  44. Song, C.; Hong, G.; Choi, S. Modeling autogenous shrinkage of hydrating cement paste by estimating the meniscus radius. Constr. Build. Mater. 2020, 257, 119521. [Google Scholar] [CrossRef]
Figure 1. Defects occurring in bridge bearings due to the insufficient embedment depth of anchor bolts: (a) rupture of anchor bolt; (b) loosening of anchor bolt; (c) damage of anchor bolt; (d) cracking of bridge bearing pedestal [14].
Applsci 10 08848 g001
Figure 2. Schematic illustration of the ultrasonic test process conducted to estimate the embedded depth of anchor bolt: (a) three-dimensional view of the test specimen and set up; and (b) the cross-section of the plane α.
Applsci 10 08848 g002
Figure 3. Theoretical value for the transferred distance of the ultrasonic pulse through the embedded anchor bolt according to the distance of the receiver from top surface.
Applsci 10 08848 g003
Figure 4. Specimen for numerical verification.
Applsci 10 08848 g004
Figure 5. Results of the numerical verification for white noise and regularization in specimens with a cover thickness of 100 mm: (a) E100C100; (b) E200C100; (c) E300C100.
Applsci 10 08848 g005
Figure 6. Results of the numerical verification for white noise and regularization in specimens with a cover thickness of 200 mm: (a) E100C200; (b) E200C200; (c) E300C200.
Applsci 10 08848 g006
Figure 7. Variation in transferred distance of ultrasonic pulse through the embedded anchor bolt according to the error of ultrasonic velocity in the anchor bolt and concrete: (a) error of ultrasonic velocity in the anchor; and (b) error of ultrasonic velocity in concrete.
Applsci 10 08848 g007
Figure 8. Effect of the regularization factor on the transferred distance of the ultrasonic pulse through the embedded anchor bolt.
Applsci 10 08848 g008
Figure 9. Details of the specimens and the location of the transducer: (a) test specimen; (b) top view; (c) side A; (d) side B.
Applsci 10 08848 g009
Figure 10. Arrival time of ultrasonic pulse in the specimen with the different embedment lengths of the anchor bolt and cover thicknesses: (a) the variation in arrival time of the ultrasonic pulse according to the distance of the receiver from the top surface; and (b) the measured value vs. calculated value.
Applsci 10 08848 g010
Figure 11. Results of the experimental verification: (a) E100C100; (b) E200C100; (c) E300C100; and (d) E100C200.
Applsci 10 08848 g011
Table 1. Designation of the specimens in the numerical verification.
Embedment Depth (mm)
100200300
Cover Thickness
(mm)
100E100C100E200C100E300C100
200E100C200E200C200E300C200
Table 2. Estimated embedment depth of the anchor bolt in numerical verification.
Specimen IDNumerical Verification
(with 3% White Noise)
Estimated Value
(mm)
Error
(%)
E100C100100.10.1
E200C100202.21.1
E300C100298.40.5
E100C200102.92.9
E200C200199.90.0
E300C200315.95.3
Table 3. Mixture proportions and properties of fresh and hardened concrete.
Mixture Proportion (kg/m3)Fresh ConcreteHardened Concrete
BinderWaterFine
Agg.
Coarse
Agg.
SPSlump
(mm)
Air Content
(%)
Compressive Strength **
(MPa)
CementFly AshGGBFS *
255569416782793231504.527
* Ground granulated blast–furnace slag. ** Compressive strength at age of 28 days.
Table 4. Estimated embedment depth of the anchor bolt in experimental verification.
Specimen IDExperimental Verification
Estimated Value
(mm)
Error
(%)
E100C10092.77.3
E200C100173.013.5
E300C100255.414.9
E100C20074.425.6
Publisher’s Note: MDPI stays neutral with regard to jurisdictional claims in published maps and institutional affiliations.

