Abstract
Dual-energy X-ray absorptiometry (DEXA) provides a reliable and accurate measurement of bone density and bone mineral composition. This research examined the composition and bone density (bone mineral composition and bone mineral density; BMD) of the whole body and selected body parts using DEXA. The participants were 240 healthy adult men and women who were divided into three groups based on age. The total BMD of women amounted to an average of 1.14 g/cm2 for those aged 20–39 years, 1.14 g/cm2 for those aged 40–59 years, and 0.98 g/cm2 for those aged 60–73 years. For men, the average BMD was 1.25 g/cm2 for those aged 20–39 years, 1.20 g/cm2 for those aged 40–59 years, and 1.17 g g/cm2 for those aged 60–73 years. The decrease in age-specific BMD was shown to have a correlation with both age and body mass index, and it is determined that exercising on a regular basis can prevent a reduction in BMD by maintaining appropriate muscle mass.
1. Introduction
Dual-energy X-ray absorptiometry (DEXA) is the most widely used method to measure bone mineral density (BMD), chiefly because it uses X-rays, which are noninvasive and inexpensive [1,2,3]. This measurement tool calculates the density of bone mass by measuring the rate differences of radiation transmittance in the analyzed bone mass when the radiation from the tool penetrates the body [4,5]. By using a tube voltage of 80 Kv Cerium filter, DEXA utilizes photon energies of 40 keV and 80 keV [6]. Thus, it can be used to assess bone health conditions in any part of the body. It is widely used to measure and assess the regions of the body and is typically used to assess full-body BMD, such as the lumbar spine and proximal femur [7].
Bones undergo mineralization and remodeling during their life cycle [8,9]. An imbalance in the absorption and generation of osseous tissue generally occurs in both men and women as they age. This process causes mineral synthetic imbalances of different body parts, which leads to reduced average BMD. The rate of mineral synthetic imbalance has been reported to be 26.59% for women and 14.56% for men [10].
A reduction in BMD, which causes diseases such as osteoporosis, is responsible for pain in various body parts and contributes to disabilities associated with old age [11]. More specifically, a decrease in BMD due to aging exponentially amplifies the risks of bone fracture [12], which can lead to disabilities and death and, ultimately, to increased social costs [13]. Moreover, a decline in BMD increases the risk of additional secondary fracture [14]. Mortality due to a reduction in BMD has been reported to be higher in men than in women [15].
Although studies on the process of mineralization and bone reformation have been conducted, there is a paucity of data on therapies, such as hormone therapy, diet therapy, and therapeutic exercise, which have been deemed important for adults with decreased BMD. These interventions not only delay bone loss but also help in the maintenance and development of bones [16]. The importance of maintaining a high BMD is highly emphasized in the medical community.
DEXA is necessary for accurately assessing and identifying bone conditions. According to the International Society for Clinical Densitometry (ISCD), DEXA is recommended as the most appropriate BMD measurement method that can then be applied to the diagnostic criteria of the World Health Organization [17,18]. According to research on osteoporosis and fractures, DEXA measurement can predict and assess the risk of bone fracture. A BMD-estimated T-score of <−2.5 (defined as osteoporosis) has a close correlation with the development of bone fractures [19].
In light of these findings, this paper seeks to provide an important reference for the pathophysiology and treatment of bone diseases, including osteoporosis, by analyzing the BMDs of Koreans based on sex and age.
2. Materials and Methods
2.1. Participants
All 240 participants (120 men, 120 women) were healthy adults living in Seoul, Republic of Korea between 20 and 73 years of age. Prior to participating in the experiment, enrolled participants were informed of the objectives and procedures of the study, and they provided written consent to participate. Patients with diabetes mellitus, cardiovascular disorders, and/or hypertension were excluded. Participants were divided into three groups based on their age. Group A included adults aged 20–39 years, Group B included participants aged 40–59 years, and Group C included older adult participants aged 60–73 years. The physical characteristics of participants are presented in Table 1.

Table 1.
Physical characteristics of participants according to age and sex.
2.2. Experimental Procedure
The experimental procedure is shown in Figure 1.
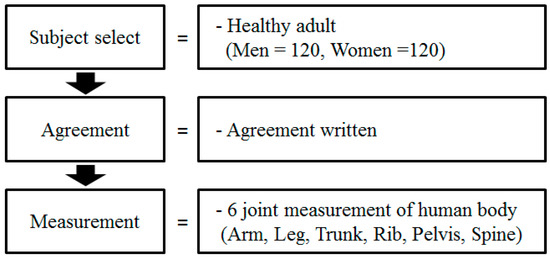
Figure 1.
Experimental procedure.
2.3. DEXA Measurement
Participants underwent DEXA measurement in the morning on an empty stomach. DEXA was used to measure BMD and bone mineral content (BMC) of the whole body. During the measurement, participants were lightly dressed and were asked to lie still in a supine position on the scanning table. The presets for the applied DEXA (Lunna Radiation corp., Madison, WI, USA) were photon energy of 66 KeV and 40 KeV by conducting collimation at 1.68 mm intervals. For Scan type, DPX-L (GE-Lunar Corp., Madison, WI, USA) was used, and the software version for acquiring data was 3.1. The BMC and BMD of the left and right arms, legs, torso, and whole body were measured.
2.4. Data Analysis
SAS version 9.2 was used for statistical analysis. Mean and standard deviation for sex, age, height, weight, BMD, and BMC were calculated, and a two-way analysis of variance (ANOVA) was used to determine whether there were differences among the different age groups, and between men and women. Tukey’s post-hoc adjustment was carried out for variables found to be statistically significant. The significance level (α) for testing hypotheses in this study was set at 0.05.
3. Results
3.1. Basic Statistics of BMD and BMC Factors Based on Sex and Age
The basic patient demographics of BMD and BMC based on sex and age are presented in Table 2 for men and Table 3 for women.
Table 2.
The mean values weight, height, BMD, and BMC in various body segments of male participants.
Table 3.
The mean values weight, height, BMD, and BMC in various body segments of female participants.
3.2. Differences in BMD Based on Sex and Age
The results of the two-way ANOVA for BMD of each sex according to age are presented in Table 4. In addition, the results of the post-hoc test are presented in Table 5 and Table 6.
Table 4.
The results of the two-way ANOVA for whole-body BMD of males and females according to age.
Table 5.
Tukey post-hoc test in male participants according to age.
Table 6.
Tukey post-hoc analysis in female participants according to age.
According to a two-way ANOVA based on sex and age, there was a significant main effect of participant sex on whole-body BMD (F(1,234) = 104.48 (p < 0.01)). There was also a significant main effect of age on whole-body BMD (F(2,234) = 35.91 (p < 0.01)), and a significant interaction of sex by age (F(2,234) = 9.53 (p < 0.01)). Post-hoc analyses revealed a significant difference between the whole-body BMD of males and females, and certain distinctions were found between Groups A, B, and C.
A one-way ANOVA based on age showed a significant difference in whole-body BMD between the age groups among male participants (F(2,111) = 6.57 (p < 0.01)). There was a significant difference between Group A and Group C in the Tukey post-hoc.
The one-way ANOVA based on age showed a significant difference in whole-body BMD between the age groups among female participants (F(2,123) = 44.38 (p < 0.001)). There was a statistically significant difference between Groups A and B compared to Group C.
These results demonstrate that the decline in whole-body BMD with age is closely related to loss of muscle mass and a decrease in BMC.
3.3. Differences in BMC Based on Sex and Age
The results of the two-way ANOVA for the BMC of each sex according to age are presented in Table 7. In addition, the results of the posteriori test are presented in Table 8 and Table 9.
Table 7.
The results of the two-way ANOVA for whole-body BMC of males and females according to age.
Table 8.
Tukey post-hoc in male participants according to age.
Table 9.
Tukey post-hoc in female participants according to age.
The two-way ANOVA based on sex and age showed a significant main effect of participant sex on whole body BMC (F(1,234) = 241.48 (p < 0.01)). There was also a significant main effect of age (F(2,234) = 24.43 (p < 0.01)) and a significant interaction of sex by age (F(2,234) = 4.88 (p < 0.01)).
The Tukey post-hoc tests demonstrated a significant difference in whole-body BMC between male and female participants, and differences based on age were found in each group. A one-way ANOVA based on age demonstrated a significant difference in whole-body BMC among male participants (F(2,111) = 14.00 (p < 0.01)). There was a statistically significant difference in whole-body BMC between Groups B and C compared to Group A in the Tukey post-hoc.
A one-way ANOVA based on age showed a significant difference in whole-body BMC based on age among female participants (F(2,123) = 16.65 (p < 0.01)). A Tukey post-hoc test demonstrated a statistically significant difference between Groups A and B compared to Group C.
Based on these results, the most influential factors for BMD were revealed to be sex and age. With age in particular, there was a decrease in BMD and BMC along with a decrease in height and weight. In addition, of the females, postmenopausal participants showed a significant decrease in BMC and BMD in the group over 60 years old. Therefore, it can be considered that changes in body composition due to aging drastically reduces whole-body BMD and BMC.
4. Discussion
The bones function to mechanically support the body and protect deep organs. They become the center of exercise and serve as a reservoir of various minerals. Bones continuously develop throughout the growth period, until the age of 30 to 40 years when the structural growth of the bone is completed. Therefore, BMD continues to increase throughout growth, resulting in peak bone mass and solidification at the end of structural development. The most common metabolic bone disease, osteoporosis, is a condition of reduced BMD. Osteoporosis is a serious metabolic disease accompanied by qualitative changes in bone microstructure and can lead to fractures of the spine, femur, and radius. Patients suffering from osteoporosis are at risk of bone fractures, even from less forceful impact to the bones [20]. Although osteoporosis is more common in women, previous studies have reported that osteoporotic fractures are also frequent in men [21,22]. Osteoporosis, therefore, should be recognized as a major disease that affects both women and men.
Based on this rationale, this study analyzed the relationship between BMC and age in adults to examine changes in bone density according to sex and age. The purpose of this research was to examine changes in the distribution of bone density in relation to menopause for various future medical purposes and practices related to osteoporosis.
DEXA is the most commonly used clinical tool for the diagnosis of osteoporosis. It is considered safe because it has relatively less radiation exposure and a short inspection time. In addition, it can directly measure total bone mass and has a rate of high diagnostic accuracy, sensitivity, and reproducibility.
The indicators of bone health are bone mass, BMC, and BMD, while BMD alone is used as a standard for diagnosing osteoporosis [23,24]. In this study, the mean BMD in male and female participants was inversely correlated with age. These findings were similar to the results of Ohmura’s study [25], which effectively demonstrated that the BMDs of Japanese women in their 20s and 70s were inversely proportional to their age. Moreover, the differences in BMC and BMD between age groups demonstrated the total mineral contents of males aged 20–39 years were the highest when compared to older age groups, and females aged 20–59 years had similar results. In addition, BMC was significantly different between age groups among both male and female participants, with BMC decreasing with age.
Park et al. [26] reported age has the highest inverse correlation with BMD. Other factors associated with BMD included race, family history of osteoporosis, estrogen hormone, calcium intake, weight, and physique. In addition, age was reported as a major predictor of BMD and osteoporosis [27]. In this study, male participants aged 20–39 years had the highest total BMC. Male participants aged 40–59 years also had a relatively high BMC in comparison to male participants aged 60–79 years. Female participants aged 20–39 years and 40–59 years demonstrated a similar pattern of relatively high BMC compared to older female participants (aged 60–73 years). These results are similar to those of previous studies [25,27], which showed a correlation between age and weight as factors that influence bone density. Our results are also consistent with the findings of Ohmura et al. [25], which showed that Japanese women have low BMDs, and the difference is several times greater for women after menopause.
Decreases in BMD and in BMC with increasing age are thought to be due to a decrease in lean mass, and increased bone resorption of osteoclasts caused by the lack of estrogen secretion from the ovaries after menopause. In addition, as noted by Tremollieres and Ribot [27], race, family history of osteoporosis, calcium intake, weight, and physique may affect BMD and BMC.
Our study was inconsistent with previous studies [28,29], which demonstrated a slight increase in BMC after the age of 30 years and a rapid decrease after the age of 50 years, both before and after menopause. Ohmura et al. [25] also mentioned that premenopausal Japanese women had 5% lower BMD than premenopausal Caucasian women in America or Europe, and this difference multiplied after menopause. Unlike women, osteoporosis in men can be classified as primary (with uncertain pathogenic determinants) and secondary (with clear underlying cause). Men more often suffer from secondary osteoporosis caused by low body mass index, smoking, excessive alcohol consumption, and lack of exercise.
In bone growth and maintenance, calcium is an essential nutrient that is necessary to lower the bone replacement rate and reduce bone resorption [30]. Reduced calcium absorption rates in the bone can lead to reduced bone density and bone mineral quantity in both men and woman as they age. In addition to reduced secretion of phosphorous- and calcium-regulating hormones, changes in bone metabolism, decreased physical activity, and inadequate diet can reduce BMD and BCD in both men and women. For older women after menopause, the reason behind the reduction in BMD and BMC in this study is considered to be reduced estrogen, which increases osteoclastic bone resorption. This was demonstrated in the female participants of our study, as there was a significant difference in BMD and BMC between those under the age of 60 years and those over the age of 60 years. We confirmed that there was no difference in BMC and BMC according to age before menopause, and - there was a change corresponding to the time when estrogen deficiency became apparent, as menopause typically occurs before the age of 60 years old. In contrast, low body mass index, smoking, excess alcohol intake, and a lack of exercise are thought to cause BMD reduction in tandem with the influences of hormones in men [31]. In our study, however, there was a significant difference in BMD and BMC between younger male participants (20–39 years) and older male participants (60–79 years) and not between middle aged male participants and either of the two other groups. It is thought that hormone changes are relatively small in the males of the same age group as females. It seems, therefore, that some factors affecting BMD and BMC for women and men are different.
This study indicates that the BMD of adult Korean women is remarkably lower than that of Caucasian women, and BMD reduction accelerates after menopause. This phenomenon is considered to have a close relationship with reduction in muscle mass, especially that of legs. Therefore, we suggest that exercising on a regular basis is critical to maintain muscle mass and BMD before menopause. Specific exercise-related education and nutrition guides are required according to sex and age. Finally, we hope that the findings of this study will be helpful to predict the risk of osteoporosis in the future by evaluating the bone density of Koreans according to age group. We believe that this study can help medical practitioners make appropriate decisions to help patients cope with reductions in the ability to exercise caused by aging and reductions in BMD due to changes in dietary habits. We hope this study also encourages the creation of detailed health education guides.
This study should be interpreted considering the limitation that results cannot be extrapolated to people living in different environments.
5. Conclusions
In order to prevent osteoporosis in middle aged adults, it is necessary to routinely measure BMD and BMC using accurate equipment such as DEXA. Sufficient protein, calcium, and vitamin D intake as well as resistive exercises can prevent older adults from becoming underweight and prevent reductions in BMD and BMC. Moreover, for women near or approaching menopause, proper dietary controls and continuous exercise can protect against drastic declines in body fat, muscle mass, and BMD. This study has identified age- and sex-specific differences in BMD and BMC in city-dwelling Koreans. Further studies, however, are required for extrapolation of these findings to a larger population. Comparative studies for adults with different living conditions, such as residents in large cities and rural areas, and studies that compare and analyze the correlation between factors related to BMD and BMC are suggested.
Author Contributions
Conceptualization, J.C.L., C.H.L. and J.Y.P.; methodology, D.W.C., H.J.L. and J.Y.P.; software, J.C.L.; formal analysis, J.Y.P. and H.J.L.; investigation, J.C.L. and J.Y.P.; resources, J.C.L.; data curation, C.H.L., J.C.L.; writing—original draft preparation, D.W.L., J.Y.P.; writing—review and editing, J.C.L., H.J.L. and J.Y.P.; visualization, C.H.L. and J.Y.P.; supervision, J.C.L. and J.Y.P.; project administration, C.H.L., and D.W.C. All authors have read and agreed to the published version of the manuscript.
Funding
This research received no external funding.
Conflicts of Interest
The authors declare no conflict of interest.
References
- Zhong, R.; Chen, Q.; Zhang, X.; Li, M.; Liang, J.; Lin, W. Bone Mineral Density Loss in People With Epilepsy Taking Valproate as a Monotherapy: A Systematic Review and Meta-Analysis. Front. Neurol. 2019, 10, 1171. [Google Scholar] [CrossRef] [PubMed]
- Batur, P.; Rice, S.; Barrios, P.; Sikon, A. Osteoporosis Management. J. Women Health 2017, 26, 918–921. [Google Scholar] [CrossRef] [PubMed]
- Gilsanz, V. Bone density in children: A review of the available techniques and indications. Eur. J. Radiol. 1998, 26, 177–182. [Google Scholar] [CrossRef]
- Blake, G.M.; Fogelman, I. Bone densitometry and the diagnosis of osteoporosis. Semin. Nucl. Med. 2001, 31, 69–81. [Google Scholar] [CrossRef]
- Jain, R.K.; Vokes, T. Dual-energy X-ray Absorptiometry. J. Clin. Densitom. 2017, 20, 291–303. [Google Scholar] [CrossRef]
- Lorente Ramos, R.M.; Azpeitia Armán, J.; Arévalo Galeano, N.; Muñoz Hernández, A.; García Gómez, J.M.; Gredilla Molinero, J. Dual energy X-ray absorptimetry: Fundamentals, methodology, and clinical applications. Radiologia 2012, 54, 410–423. [Google Scholar] [CrossRef]
- Lane, N.E. Epidemiology, etiology, and diagnosis of osteoporosis. Am. J. Obstet. Gynecol. 2006, 194, S3–S11. [Google Scholar] [CrossRef]
- Glimcher, M.J. Mechanism of calcification: Role of collagen fibrils and collagen-phosphoprotein complexes in vitro and in vivo. Anat. Rec. 1989, 224, 139–153. [Google Scholar] [CrossRef]
- Katsimbri, P. The biology of normal bone remodeling. Eur. J. Cancer Care 2017, 26. [Google Scholar] [CrossRef]
- Looker, A.C.; Orwoll, E.S.; Johnston, C.C., Jr.; Lindsay, R.L.; Wahner, H.W.; Dunn, W.L.; Calvo, M.S.; Harris, T.B.; Heyse, S.P. Prevalence of low femoral bone density in older U.S. adults from NHANES III. J. Bone Miner. Res. 1997, 12, 1761–1768. [Google Scholar] [CrossRef]
- Kim, H.S.; Jeong, E.S.; Yang, M.H.; Yang, S.O. Bone Mineral Density Assessment for Research Purpose Using Dual Energy X-ray Absorptiometry. Osteoporos. Sarcopenia 2018, 4, 79–85. [Google Scholar] [CrossRef] [PubMed]
- Watts, N.B.; Manson, J.E. Osteoporosis and Fracture Risk Evaluation and Management: Shared Decision Making in Clinical Practice. JAMA 2017, 317, 253–254. [Google Scholar] [CrossRef] [PubMed]
- Clarke, B.L.; Ebeling, P.R.; Jones, J.D.; Wahner, H.W.; O’Fallon, W.M.; Riggs, B.L.; Fitzpatrick, L.A. Predictors of Bone Mineral Density in Aging Healthy Men Varies by Skeletal Site. Curr. Radiol. Rep. 2002, 70, 137–145. [Google Scholar] [CrossRef] [PubMed]
- Bliuc, D.; Alarkawi, D.; Nguyen, T.V.; Eisman, J.A.; Center, J.R. Risk of Subsequent Fractures and Mortality in Elderly Women and Men With Fragility Fractures With and Without Osteoporotic Bone Density: The Dubbo Osteoporosis Epidemiology Study. J. Bone Miner. Res. 2015, 30, 637–646. [Google Scholar] [CrossRef] [PubMed]
- Van Der Klift, M.; Pols, H.A.; Geleijnse, J.M.; Van Der Kuip, D.A.; Hofman, A.; De Laet, C.E. Bone mineral density and mortality in elderly men and women: The Rotterdam Study. Bone 2002, 30, 643–648. [Google Scholar] [CrossRef]
- Hong, A.R.; Kim, S.W. Effects of Resistance Exercise on Bone Health. Endocrinol. Metab. 2018, 4, 435–444. [Google Scholar] [CrossRef]
- Kanis, J.A.; Glüer, C.C. An update on the diagnosis and assessment of osteoporosis with densitometry. Committee of Scientific Advisors, International Osteoporosis Foundation. Osteoporos. Int. 2000, 11, 192–202. [Google Scholar] [CrossRef]
- Kanis, J.A. Assessment of Fracture Risk and Its Application to Screening for Postmenopausal Osteoporosis: Synopsis of a WHO Report. WHO Study Group. Osteoporos. Int. 1994, 4, 368–381. [Google Scholar] [CrossRef]
- Stone, K.L.; Seeley, D.G.; Lui, L.Y.; Cauley, J.A.; Ensrud, K.; Browner, W.S.; Nevitt, M.C.; Cummings, S.R. BMD at multiple sites and risk of fracture of multiple types: Long-term results from the Study of Osteoporotic Fractures. J. Bone Miner. Res. 2003, 18, 1947–1954. [Google Scholar] [CrossRef]
- Ross, A.C.; Manson, J.E.; Abrams, S.A.; Aloia, J.F.; Brannon, P.M.; Clinton, S.K.; Durazo-Arvizu, R.A.; Gallagher, J.C.; Gallo, R.L.; Jones, G.; et al. The 2011 report on dietary reference intakes for calcium and vitamin D from the Institute of Medicine: What clinicians need to know. J. Clin. Endocrinol. Metab. 2011, 96, 53–58. [Google Scholar] [CrossRef]
- Schuitt, S.C.; Van der Klift, M.; Weel, A.E.; Laet, C.E.; Burger, H.; Seeman, E.; Hofman, A.; Itterlinden, A.G.; Van Leeuwen, J.P.; Pols, H.A. Fracture incidence and association with bone mineral density in elderly men and women: The Rotterdam Study. Bone 2004, 34, 195–202. [Google Scholar] [CrossRef] [PubMed]
- Dhanwal, D.K.; Cooper, C.; Dennison, E.M. Geographic variation in osteoporotic hip fracture incidence: The growing importance of Asian influences in coming decades. J. Osteoporos. 2010, 2, 757102. [Google Scholar] [CrossRef] [PubMed]
- Michaëlsson, K.; Wolk, A.; Langenskiöld, S.; Basu, S.; Warensjö Lemming, E.; Melhus, H.; Byberg, L. Milk intake and risk of mortality and fractures in women and men: Cohort studies. BMJ 2014, 349, 6015. [Google Scholar] [CrossRef] [PubMed]
- Warriner, A.H.; Saag, K.G. Osteoporosis diagnosis and medical treatment. Orthop. Clin. N. Am. 2013, 44, 125–135. [Google Scholar] [CrossRef] [PubMed]
- Ohmura, A.; Kushida, K.; Yamazaki, K.; Okamoto, S.; Katsuno, H.; Inoue, T. Bone density and body composition in Japanese women. Calcif. Tissue Int. 1997, 61, 117–122. [Google Scholar] [CrossRef] [PubMed]
- Park, K.K.; Kim, S.J.; Moon, E.S. Association between bone mineral density and metabolic syndrome in postmenopausal Korean women. Gynecol. Obstet. Investig. 2010, 69, 145–152. [Google Scholar] [CrossRef]
- Tremollieres, F.; Ribot, C. Bone mineral density and prediction of non-osteoporotic disease. Maturitas 2010, 65, 348–351. [Google Scholar] [CrossRef]
- Kopiczko, A. Bone mineral density in old age: The influence of age at menarche, menopause status and habitual past and present physical activity. Arch. Med. Sci. 2020, 16, 657–665. [Google Scholar] [CrossRef]
- Sanada, K.; Miyachi, M.; Tabata, I.; Miyatani, M.; Tanimoto, M.; Oh, T.W.; Yamamoto, K.; Usui, C.; Takahashi, E.; Kawano, H.; et al. Muscle mass and bone mineral indices: Does the normalized bone mineral content differ with age? Eur. J. Clin. Nutr. 2009, 63, 465–472. [Google Scholar] [CrossRef]
- Son, G.S. Effect of soybean intake on bone mineral density and bone turnover markers in postmenopausal Women. J. Korean Acad. Nurs. 2006, 36, 933–941. [Google Scholar] [CrossRef]
- Adler, R.A. Osteoporosis in Men: A Review. Bone Res. 2014, 2, 14001. [Google Scholar] [CrossRef] [PubMed]


Publisher’s Note: MDPI stays neutral with regard to jurisdictional claims in published maps and institutional affiliations. |
© 2020 by the authors. Licensee MDPI, Basel, Switzerland. This article is an open access article distributed under the terms and conditions of the Creative Commons Attribution (CC BY) license (http://creativecommons.org/licenses/by/4.0/).