1. Background and Scope
In the context of the climate change mitigation strategies, the European Union (EU) has taken on an international leadership role since the 1990s, designing energy and environmental policies that promote the innovation and radical transformation of the energy system. As part of Clean Energy Package, Directive (EU) 2018/2011 establishes that Member States must collectively ensure that the share of energy from renewable sources in the EU’s gross final consumption of energy in 2030 is at least 32%. This percentage could be increased by 2023, where necessary, to ensure compliance with the EU’s international commitments for decarbonization.
The European constraint of reaching 32% of renewables on final consumption in 2030 will result in a target of around 30% of renewable energy source (RES) in the energy mix for Italy. According to the forecasts of the Integrated National Plan for Energy and Climate, this goal will be achievable only through the installation by 2030 of around 40 GW of new renewable energy capacity, supplied almost exclusively from intermittent renewable energy sources (IRES) such as wind and solar. However, this transformation does not have a zero impact on the electricity system. The critical issues due to the increasing penetration of the IRES into the electrical grid concern the balancing between supply and demand (specifically at critical moments such as peaks and load ramps), stability and periods where supply exceeds demand. In particular, the task of matching supply with demand can lead to periods of curtailment and inefficient production and potentially affect the security of supply [
1]. The Power to Gas (PtG) technology can be the most suitable storage technology for energy curtailment reduction providing greater flexibility to electrical system [
2].
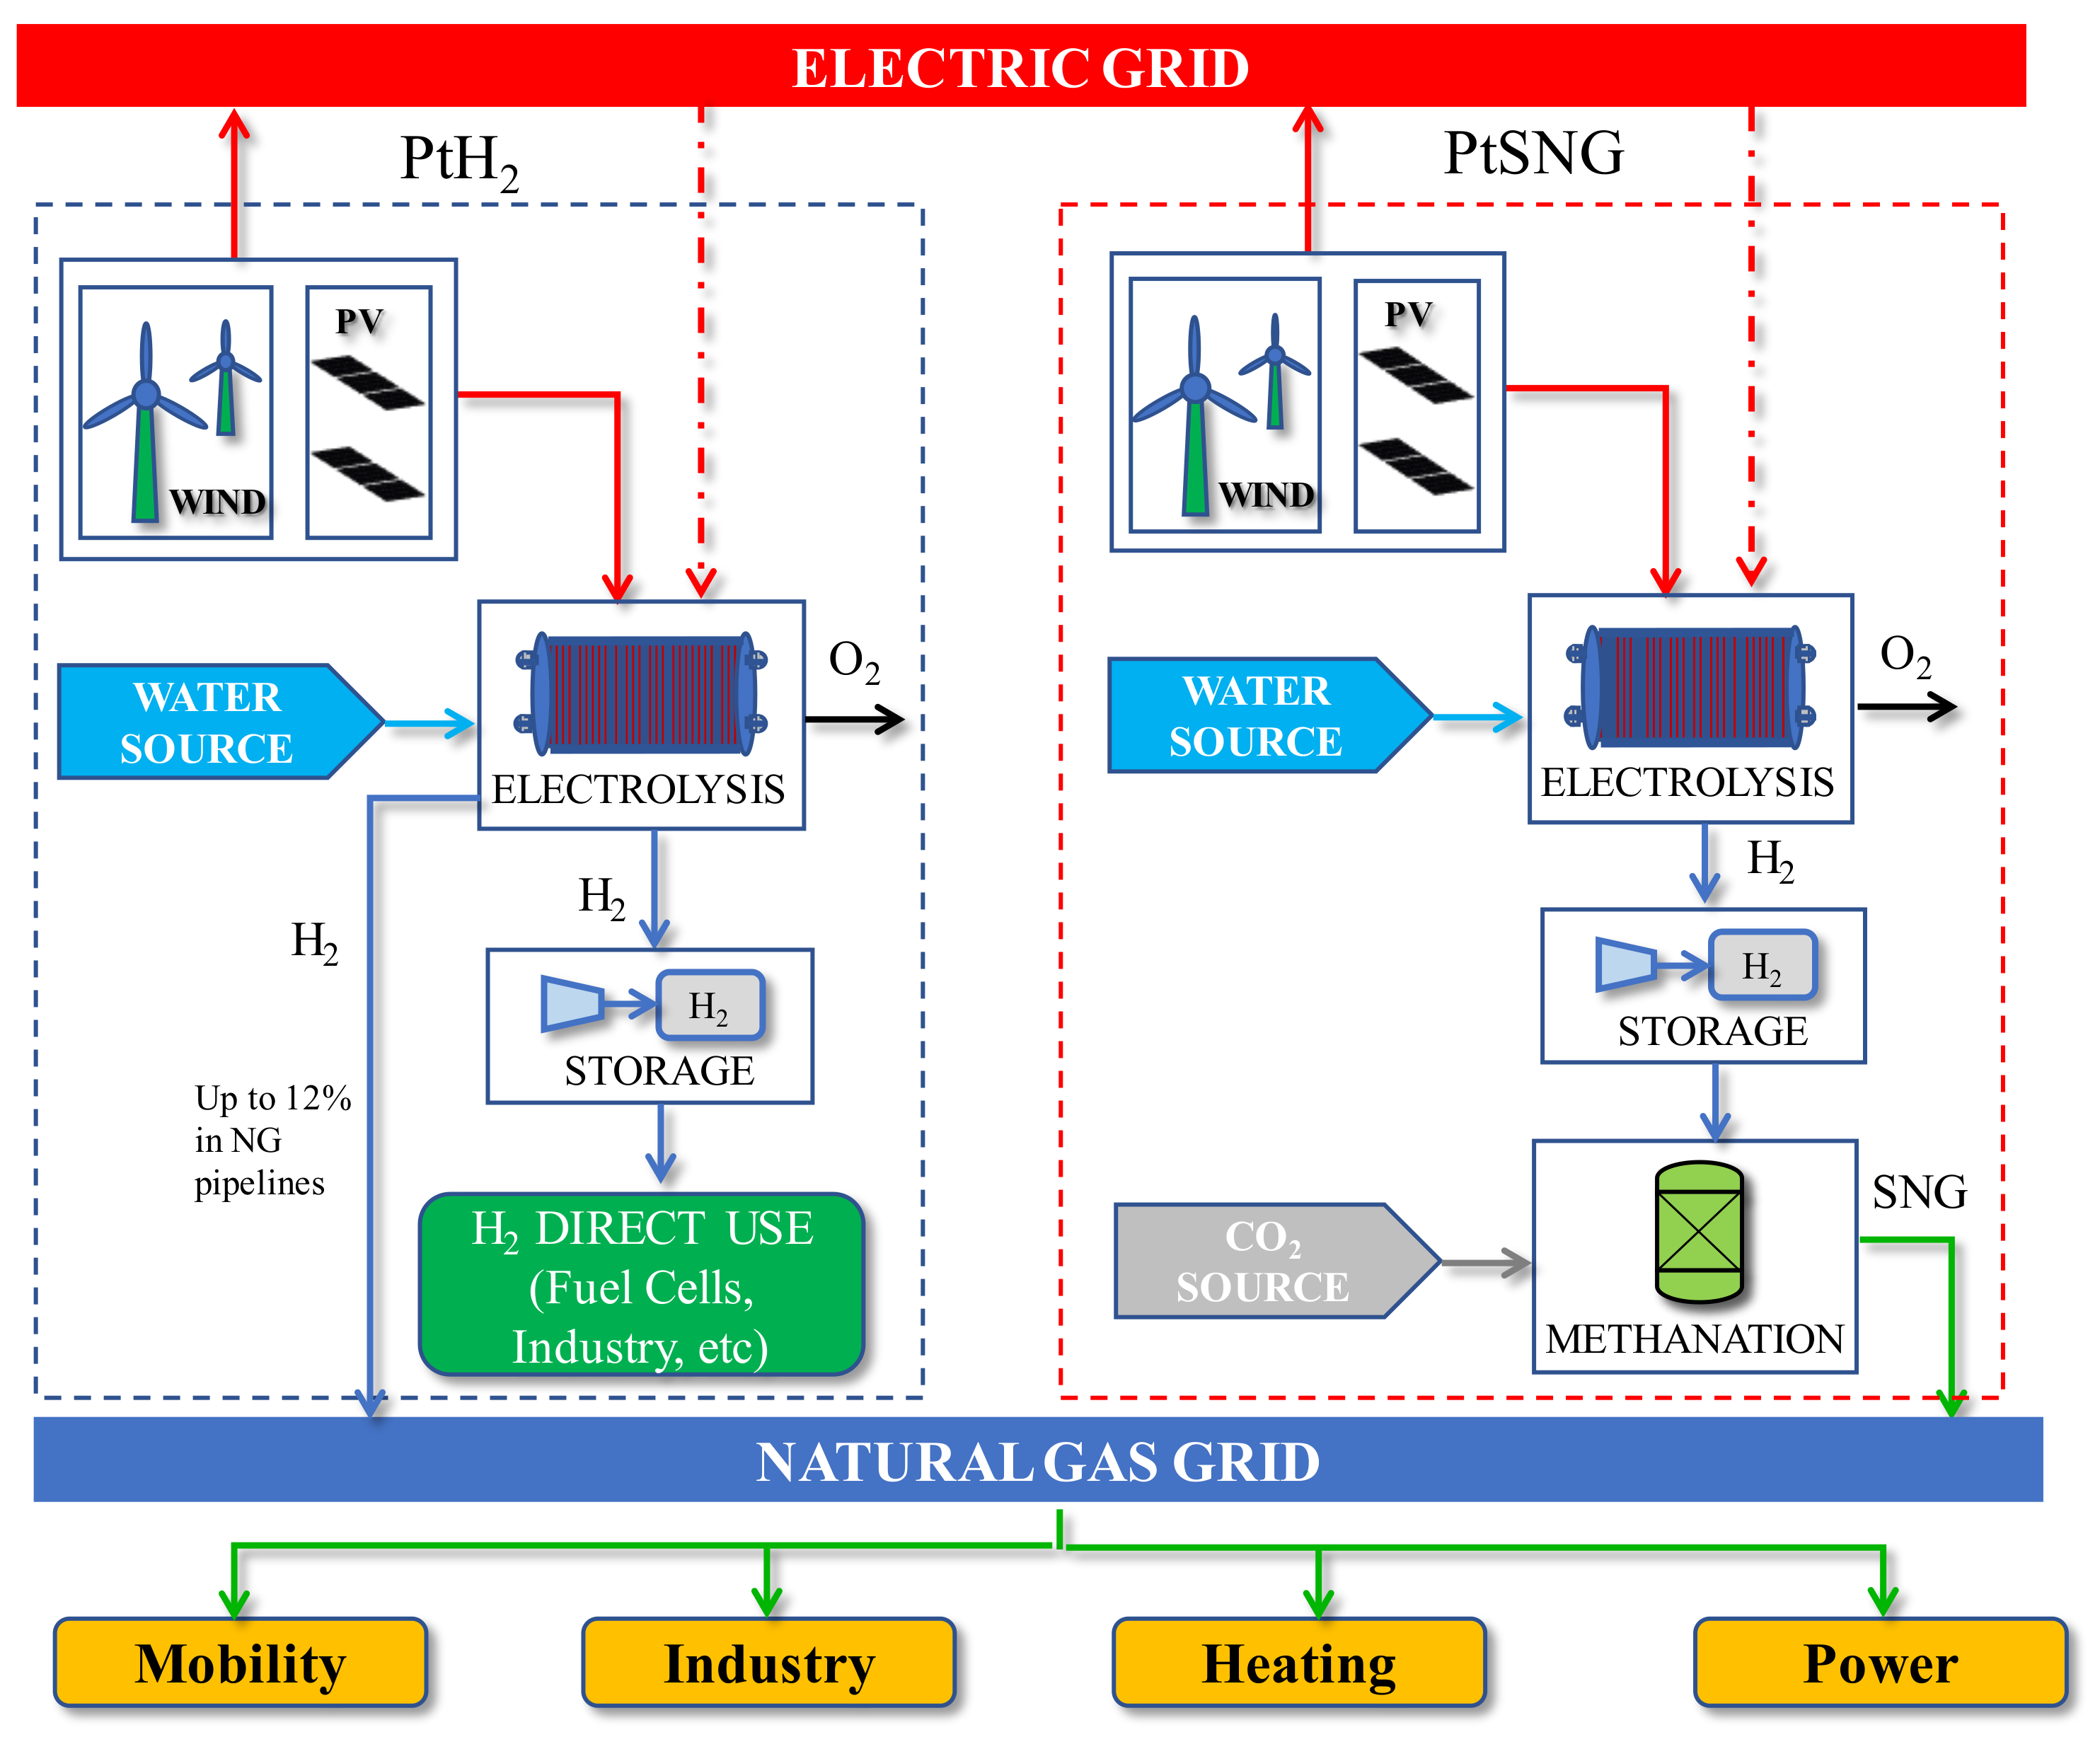
The PtG concept includes two options according to the final product gas, hydrogen (PtH
2 configuration), or synthetic natural gas (PtSNG configuration), as shown in
Figure 1. In the PtH
2 option, the renewable electrolytic hydrogen can be directly used as fuel or injected into the natural gas (NG) pipeline system. However, pipelines used in the NG grid have not been designed to withstand the specific properties of hydrogen such as higher permeation and air diffusion (+269%), worse pipeline durability (due to embrittlement), a lower density (−88%), heat value (−69%), and Wobbe Index (−9%) with respect to NG. Thus, for safety reasons, hydrogen concentration in the gas grids must be controlled within certain percentages (up to 12% vol. depending on national standards [
3,
4]). Such limitations make the option PtSNG an interesting and relevant solution for a short- and mid-term scenarios. In the PtSNG option, the renewable electrolytic hydrogen is used as reactant together with carbon dioxide in the methanation process (based on the Sabatier process [
5]) giving rise to the formation of methane (CH
4). The resulting gas mixture, known as synthetic natural gas or substitute natural gas, can be injected into the existing gas distribution grid without limitations because its physical and chemical properties are comparable to the NG ones.
The main advantages of the PtSNG option are [
6,
7,
8,
9,
10]: (i) the use of existing infrastructure, (ii) high energy density (methane has >1000 kWh/m
3 while hydrogen has 270 kWh/m
3 [
7]) and the less stringent safety constraints, and (iii) long-term and large-scale storage. The main disadvantages of the PtSNG technology are a relatively low efficiency and high investment management costs, also due to the limited operating hours of the plants [
3,
10,
11].
One of technical challenges to be faced is the integrated operation of the electrolysis and methanation subsystems. Electrolyzers are able to adapt to a highly fluctuating electricity load profile, whereas the methanation reactors take a long time to adapt to the variation of operating conditions for assuring the qualitative characteristics of the SNG produced. Thus, for ensuring the gas quality constancy, it is necessary to decouple the dynamics of the electrolysis unit from that of the methanation one [
6]. This can be performed by means of a hydrogen storage system. The control of the operation of the methanation unit and the hydrogen storage can increase the annual operating hours of the plant and consequently, the overall annual efficiency reducing the SNG production costs. The dynamic operation analysis (full load hours, partial load hours and standby hours, and number of shutdowns of the plant) is crucial for evaluating the annual performances, in terms of the annual plant efficiency and the SNG annual production and the techno-economic assessment of the PtSNG plants.
A series of studies on process and systems for power to SNG can be found in the scientific literature, but a few papers focus on dynamic operation.
Frank et al. [
12] developed a systematic method to calculate efficiencies and the annual performance of 1 MW PtSNG system The method considers all energy flows to and from the two subsystems electrolysis and methanation of a PtSNG system. Based on this, the authors calculated the annual performance of the system as the ratio of useable output and energetic input over 1 year, highlighting the dependency of annual performances from operating hours, duration of standby, and ramp-ups. The overall system efficiency calculated varies between 54.3% and 85.9% depending on heat use strategies.
Salomone et al. [
13] provided a comprehensive technical, managemental, and economic assessment of the coupling between a completely RES-based electric residual profile in a future scenario and a PtSNG plant. A PtSNG model was built in order to examine the PtSNG plant behavior when it was coupled with the RES-based intermittent electric profile. The overall low heating value (LHV-based) efficiency is around 77%, but the number of shutdowns of the plant is extremely high and equal to 356.
Uchman et al. [
14] analyzed the impact that the hydrogen production and the hydrogen storage system have on the operation of PtSNG installations. To this aim, the authors developed a dynamic model that allows simultaneous consideration of the working time of each system component and the entire installation. The authors provided a useful tool to consider the structural impacts of a PtSNG system on its operation, taking into account the size of the renewable energy source, hydrogen generator, and hydrogen storage capacity.
Simonis et al. [
15] have investigated various configurations of PtSNG system as a means for capturing excess wind power in the Emden region of Germany and transferring it to the natural gas grid or local biogas-CHP plant. Based on time series data, a model of the power flows and gas flows for Emden was developed to examine the capabilities of various PtSNG options. The results highlighted that PtSNG systems can be designed to achieve very high availability for absorbing large amounts of excess energy as the renewables penetration increases.
Gorre et al. [
16] examines the potential of reducing SNG production costs by determining optimal capacities of intermediate hydrogen storage and methanation for three electricity supplies. The results indicated potential cost reductions of up to 17% in SNG production by implementing well-balanced components and interim storages.
Thus, the purpose of this paper is to evaluate the energy storage potential and the technical feasibility of the PtSNG concept to store intermittent renewable sources under dynamic operation by estimating the plant operation hours (full load and partial load), the number of shutdowns, the annual overall efficiency, and the plant load factor. These parameters are very important for the effective plant sizing and design and for the techno-economic assessment of the plant.
Therefore, different plant sizes (1, 3, and 6 MW) are defined and investigated by varying the ratio between the renewable electric energy sent to the plant (in DC) and the total electric energy generated by the IRES facility based on a 12 MW wind farm. The analysis is carried out by developing a thermochemical and electrochemical model and a dynamic model. The first allows to predict the plant performance in steady state. The second allows to forecast the annual performance and the operation time of the plant by implementing the control strategy of the storage unit.
Hence, the main contributions of this study are: (i) to provide a detailed and comprehensive simulation model for PtSNG system analysis under steady state and dynamic operation and (ii) to define useful criteria for the PtSNG systems design and sizing.
2. The Adopted Technologies
The core of the PtSNG plant are the electrolysis unit and the methanation unit. With referring to the electrolysis unit, the proton exchange membrane electrolysis (PEMEL), which is currently close to commercial deployment, seems to be the most suitable for the power to gas application in comparison to the alkaline electrolysis (AEL), the most mature technology from a commercial point of view or the solid oxide electrolysis (SOEL), which is still under research and development. The main advantage regards the dynamic behavior to follow fluctuating power inputs and the fast start-up, essential requirements to make efficient and economically viable the power to gas concept [
3,
17,
18]. The most commercial solutions are available in the range of 1–2 MW with a system electricity consumption of 54–60 kWh/kg of hydrogen (4.9–5.5 kWh/Nm
3 of hydrogen) and delivery pressure between 20 and 30 bar. Compared to AELs, PEMELs currently have higher capital costs caused by lower level of technological maturity. However, further development of the technology is expected to reduce investment costs significantly, to below that of alkaline electrolyzers. Given technological advancements, PEM electrolyzers are also expected to technically outperform AEL thus becoming the dominant technology for PtSNG systems [
18].
Methanation of CO
2 is an exothermic reaction in which H
2 and CO
2 react to form CH
4 and H
2O. The reaction stoichiometry is:
The most widely accepted mechanism of the CO
2 methanation reaction is the combination of the endothermic reversed water gas shift (RWGS) as an intermediate reaction (R2) and the exothermic methanation (R3) of the CO produced from the RWGS:
Low temperatures, typically between 200 and 550 °C depending on the used catalyst, and high pressures favor the conversion of CO
2 to CH
4. In a simple one-stage process, and with an operating pressure of 20 bar and keeping the temperature at 450 °C, the carbon dioxide conversion reaches approximately 93% and an increase in the operating pressure does not significantly improve the methane yield [
19].
Thus, a significant issue in a methanation reactor is the temperature control in order to prevent thermodynamic limitation and catalyst sintering. The methanation process can be carried out in isothermal conditions or adiabatic conditions, and different reactor concepts (fixed beds, fluidized beds, three phase, and structured reactors) have been developed based on these approaches [
3]. Fixed-bed reactors present the state of the art for large-scale methanation applications [
20]. In adiabatic operation mode multiple fixed-bed reactors (2–5), operation at decreasing temperature levels and connected in series are necessary to achieve CH
4 content of 96–98% in the exiting SNG. Temperature control can be realized by recirculation of the reactor outlet gas streams and by intermediate gas cooling steps [
21]. Tøpsoe’s Recycle Energy-efficient Methanation Process (TREMP) technology developed by Haldor Topsøe is the most relevant fixed bed methanation based on adiabatic process [
21,
22,
23]. Isothermal methanation can be carried out inside cooled fixed bed reactors, which contain cooling tube bundles. With respect to the adiabatic reactors, the setup of the process is simpler, but the reactor is more expensive [
3,
24].
For PtSNG application, operational flexibility is a key issue because the methanation reactors are operated dynamically. Startup and shutdown are critical phases because temperature gradients can occur causing mechanical stress or leading to catalyst cracking or sintering [
3,
19].
In order to avoid catalysts deactivation, the reactors should be flushed with hydrogen or an inert gas. To minimize hydrogen discard during startup and shutdown and to avoid costly standby losses, the methanation should have the highest possible number of continuous operating hours. Moreover, in order to guarantee the specified gas quality, a minimum load is required (for adiabatic fixed-bed reactors this is 40% [
3]).
Therefore, one technical challenge of PtSNG operation is decoupling electrolysis and methanation, as these subsystems differ in dynamic behavior. This can be carried out by means of a hydrogen storage system. The best options for PtSNG application are high-pressure gas tanks and metallic hydrides [
25,
26]. Pressure tanks technology for hydrogen storage is the state-of-the-art technology, while metal hydride technology is still under research and development.
The size of the hydrogen storage depends on the profile of the electric energy input (i.e., the wind or solar) to the electrolysis unit and on the capacity of the methanation unit. In order to reduce the costs of the produced SNG, the size of the hydrogen storage and the capacity of the methanation unit should be chosen in such a way to minimize the number of shutdowns [
6,
18].
3. Plant Description
Figure 2 shows the layout of the proposed PtSNG plant. The plant consists of four sections: (i) the hydrogen generation unit based on the proton exchange membrane (PEM) electrolysis, (ii) the CO
2 methanation unit based on the fixed-bed technology, (iii) the hydrogen storage unit based on the pressure vessels technology, and iv) the SNG upgrading unit based on the membrane technology.
The demineralized water (1) is pumped (2) and heated (3) to the operating pressure and temperature of the PEM electrolysis unit (20 bar and 55 °C) where oxygen (4) and hydrogen (5) are generated. According to the control strategy of the storage unit, the product hydrogen (5) can be partially or totally sent to the methanation unit (7) and/or to the intercooled compressor H2COMP (6) for increasing the pressure up to the maximum storage value (45 bar). In the methanation unit working at 20 bar and consisting of four intercooled fixed bed reactors, the carbon dioxide and the hydrogen are converted to SNG.
At the exit of the reactor MR4, the CO
2 conversion achieves the 99.2% but the methane content is only about 32.1% due to the large amount of the water produced during the methanation process. The raw SNG (14M) is, therefore, cooled down to 45 °C in the heat exchanger MHE5 and sent to the flash unit where most of the water is removed. Nevertheless, in order to comply with the water dew point requirements of the pipelines, the SNG have to be further dehydrated. The technology used for the SNG drying is based on the membrane technology (a commercial Pebax
®-based membrane [
27]), so that a compression step is required for bringing the feed gas to the operating pressure of the dehydration membrane. The quality of the dry SNG exiting the upgrading section satisfies the pipelines specifications and can be directly injected to the low-medium pressure NG transmission grid.
It is assumed that the CO2 is always available for the PtSNG plant (supplied by sequestration from other power plant as a by-product or industrial processes) at storage pressure of 200 bar.
The PtSNG is operated in input-oriented mode [
6]. This means that the SNG production depends on the availability of electrical energy and reactants (H
2 and CO
2).
Finally, all the high-temperature equipment is thermally insulated in order to minimize heat dissipation, and it could be maintained in hot standby conditions using electrical trace heating to compensate the estimated heat losses [
6,
13].
4. Wind Power Source
The power source data (a collection of one-year hourly measurement data) used in this study refer to a 12 MW (overall capacity) real wind farm installed in Central Italy close to the NG transmission network. In
Figure 3, the power duration curve and the cumulative curve of the electric energy generated during a year of operation are reported.
The total electric energy generated is equal to 24,930 MWh and is mainly produced in about 6000 h.
Figure 4 shows the distribution of the electric energy production and the duration time for different power ranges.
It is worth noting that the wind farm works mainly in the 0–1 MW power range (4322 h) producing only the 3.4% of the electric energy generated in the year, whereas the highest production percentage (21.4%) is reached in the range 11–12 MW with a duration time of 459 h. This means that, in order to optimize the PtSNG plant from an energetic and economic point of views, the size of the electrolysis unit has to be a compromise between the operating time and the installed power.
A size parameter for the PtSNG plant is the stored energy factor, defined as the annual electric energy supplied to the electrolysis unit of the PtSNG plant,
, and the annual energy generated by the wind farm
:
In this parameter, the electric energy requirements of the other plant sections (hydrogen compressor or SNG compressor) are not accounted.
Using the wind farm energy data reported in
Figure 4, the electric energy consumption (MWh
AC/year) and the stored energy factor for different sizes of the electrolysis unit have been calculated and reported in
Figure 5.
The stored energy factor shows an exponential trend as the capacity of the electrolysis unit increases, so that 79% of the wind energy production can already be stored using a 6 MW electrolyzer.
Thus, in order to evaluate the energy storage potential and the technical feasibility of the PtSNG concept to store intermittent renewable sources, the PEM electrolysis units considered as power input sizes for the annual performance assessment of the plant are 1, 3, and 6 MWDC, corresponding to a stored energy factor (in AC) of 22%, 52%, and 79%. This means that the methanation unit and the hydrogen storage unit as well as the other plant equipment will be sized accordingly and will differ one from other only by a scale factor.
5. Plant Modeling
The energy model of the PtSNG plant has been built using the Aspen Plus software package, a commercial flowsheet simulator that allows simulating complex energy systems such as gas processing plants. Aspen Plus uses mathematical algorithms, based on thermodynamic models, physical relationships, and properties methods, to define mass and energy balances.
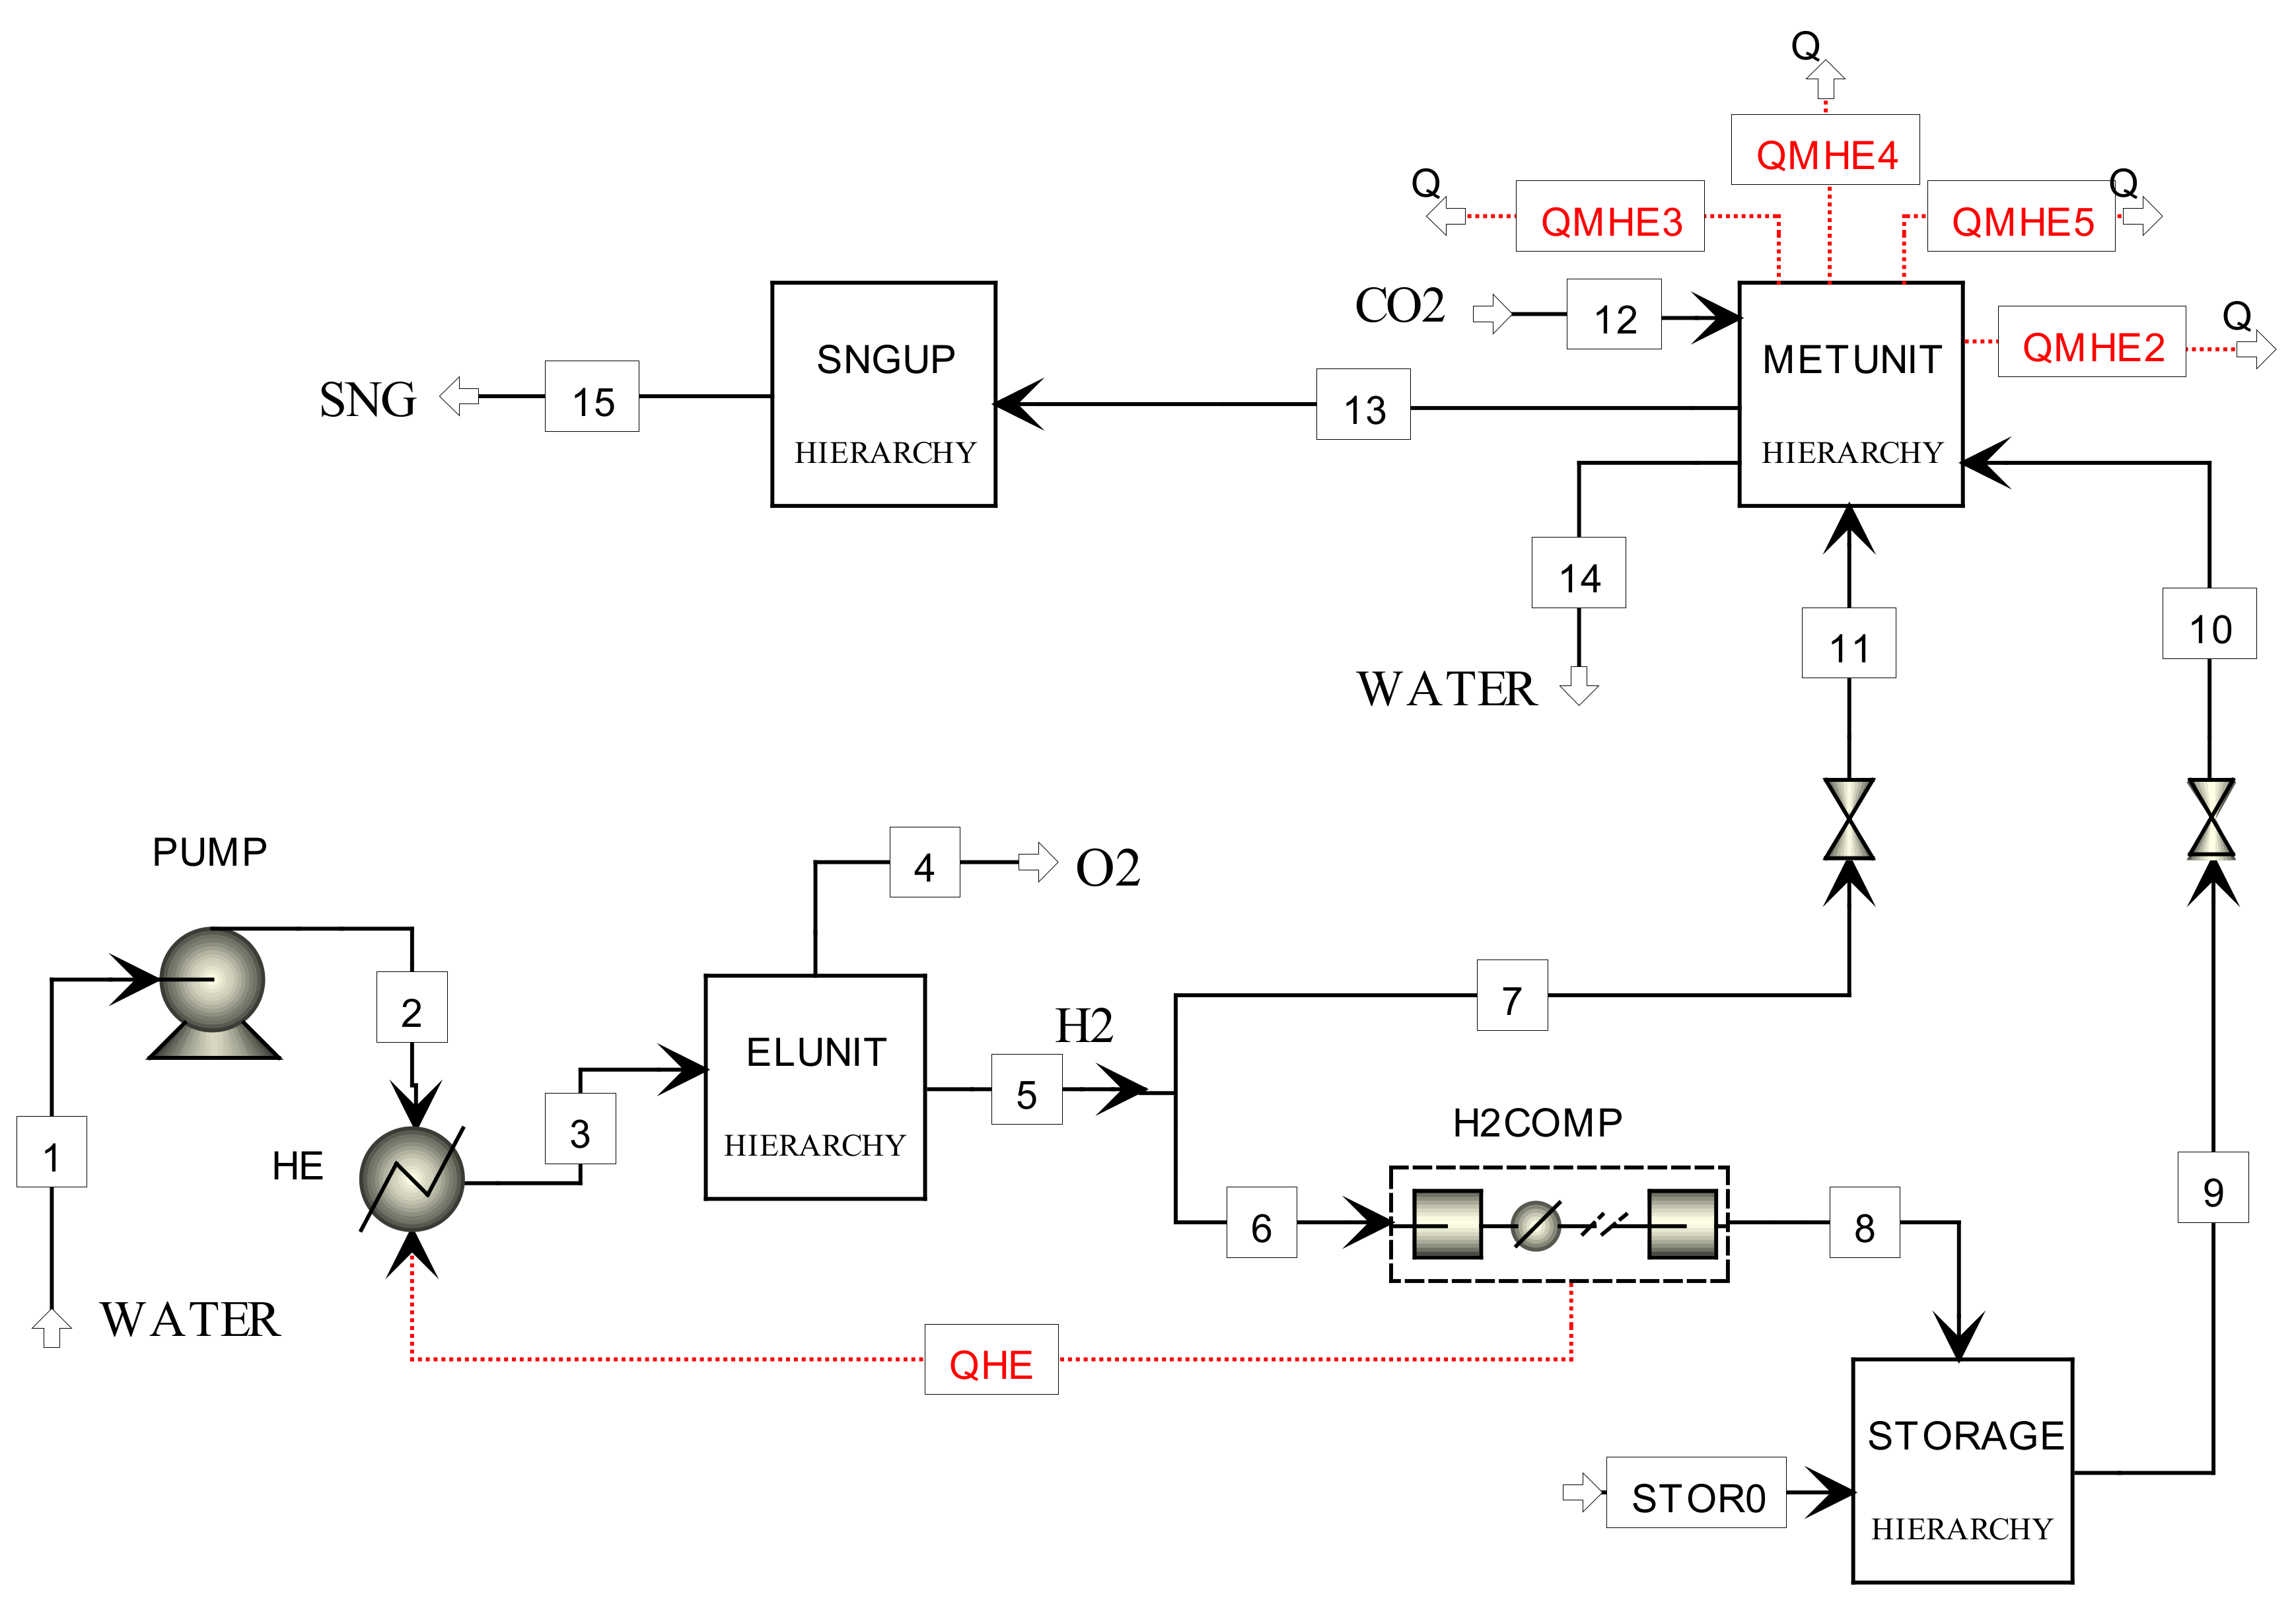
Figure 6 shows the flowsheet of the plant model. Each subsystem is simulated by means of Hierarchy blocks (ELUNIT, METUNIT, STORAGE, and SNGUP) interconnected through mass, energy, or information flows.
The input mass streams are the water (1) entering the electrolysis unit (ELUNIT) and the CO2 (12) feeding the methanation unit (METUNIT), whereas the output mass streams are the SNG leaving the SNG upgrading unit (SNGUP), the oxygen (4) produced by the ELUNIT, and the water (14) from the methanation unit. Each hierarchy block represents a specific section of the plant (i.e., the methanation unit, METUNIT, or the electrolysis unit, ELUNIT) and is modelled in a subflowsheet by combining operation blocks and calculator blocks for components and processes simulation. The operation blocks are defined in the software library, therefore, once the specific block is selected, the solving equations are defined. The calculator blocks are developed by the user by implementing the model equations in Fortran language. The Peng-Robinson cubic equation of state, which can accurately describe both the liquid and vapor phase for systems containing hydrocarbons and related compounds and for high H2 content systems in a wide range of pressure and temperature, has been used for evaluating properties and characteristics of each material stream.
5.1. Electrolysis Unit (ELUNIT Hierarchy)
The PEM electrolysis unit is built with a modular architecture. The module is formed by stacks each of which consists of cells. Therefore, the element of the system is the single cell. In
Figure 7, the flowsheet of the single cell of the PEM electrolysis unit is depicted. It is modelled by means of a RStoich operation block, where the water decomposition takes place, and a separator operation block. Mixers and splitters are also used for accounting of the water utilization factor in the anode side.
The electrochemical behavior of the electrolysis module is simulated by means of a Fortran calculator block in which the average cell polarization curve of each stack is calculated through the following equation that takes into account the polarization losses (i.e., activation overpotential, ohmic overpotential, and concentration overpotential):
In the above equation,
V0 (V),
b (V/dec),
R (Ω cm
2),
m (V), and
n (cm/A) are the fitting parameters calculated by applying a regression technique on the experimental data of the 3-cells stack reported in [
28] and operating at 20 bar and 54 °C, whereas
is the current density (A/cm
2).
By considering the cells stack number (
) and the cell area (
, cm
2), the electric DC stack power (kW) required at different current is:
The stack hydrogen production (mol/s) is calculated by applying the Fick’s law:
where F is the Faraday’s constant.
The electric power consumption of the electrolysis unit is:
where
is the modules number,
is the stack number per module, and
(kW) is the power adsorbed by the auxiliaries calculated as percentage of the nominal power consumption.
The specific electric consumption (kWh/kg) for hydrogen generation, that is a usual performance index of an electrolyzer, is calculated as:
where
is the hydrogen mass flow generated, expressed in kilogram per second.
5.2. Methanation Unit (METUNIT Hierarchy)
The parameters that control the CO
2 methanation are the temperature, the pressure, and the feed gases ratio. As previously discussed, the methanation is favored at temperatures in the range of 200–550 °C and at high pressure. In order to obtain a gas mixture with a high methane content, the ratio of the feed gases CO
2/H
2 must be equal to the stoichiometric value according to the reaction R1. Moreover, experimental data available in scientific literature [
19,
29] show how full chemical equilibrium is obtained when operating the CO
2 methanation reaction above the stoichiometric ratio of 4. As catalyst, nickel is considered to be the optimum choice due to its relatively high activity, good CH
4 selectivity, and low raw material price [
3], but require a high purity of the feeding gas.
The flowsheet of the developed model of the methanation unit, similar to the TREMP process, is shown in
Figure 8.
The methanation is modelled by assuming the chemical equilibrium and the adiabatic conditions in each chemical reactor. Thus, according to the plant layout reported in
Figure 1, the methanation unit mainly consists of four adiabatic reactors (MR1, MR2, MR3, and MR4) connected in series with intermediate gas cooling (the temperature of the streams exiting the heat exchangers MHE2, MHE3, and MHE4 is set to 250 °C), a heat exchanger (MHE1) (for preheating the feed gases up to the MR1 inlet temperature of 250 °C), and a flash drum for water removal from the wet SNG. Moreover, in order to control the temperature in the MR1, the product gas is partially recirculated to it by means of a splitter operation block (the recirculation factor is 0.70). The wet SNG leaving the MR4 reactor is cooled down to 229 °C (MHE5) before the flash drum operation block where the 99.7% of the product water is removed.
The chemical reactors are simulated using the RGibbs operation block, where the chemical equilibrium of a given set of species is solved through the minimization of the Gibbs free energy. This nonstoichiometric approach allows to find the equilibrium composition when the reactions system is unknown or very complex. Moreover, the hypothesis is that by reaching the chemical equilibrium the gas system can be formed by H2, CO, CO2, H2O, CH4, and C(s).
Thermal power (QMHE2, QMHE3, QMHE4, and QMHE5) is also available by recovering the cooling heat from the heat exchangers MHE2, MHE3, MHE4, and MHE5.
The proposed model has been validated by means of the experimental data reported in [
30]. In this case, the feeding gas is a syngas coming from a biomass gasification unit and only three methanation reactors are considered. The results of the model validation of the methanation unit are reported in
Appendix A.
5.3. Storage Unit (STORAGE Hierarchy)
The storage unit is modelled by means of mixer, splitter, and calculator block to simulate the storage conditions in steady state. The stream STOR0 (see
Figure 6) is a virtual stream needed to close the mass balance (it is equal to the hydrogen stored in the tank). In a calculator block, the mass balance of the storage tank is implemented.
5.4. SNG Upgrading Unit (SNGUP Hierarchy)
Figure 9 shows the flowsheet of the SNG upgrading model. The dehydration membrane is modelled by means of a separator operation block with an assigned separation efficiency. The SNG compressor is a two-stage intercooled compressor.
6. The Storage Control Strategy
The storage unit allows to decouple the dynamics of the PEM electrolysis unit from that of the methanation unit. The parameter that controls the start and the operation modes of the methanation unit is the hydrogen storage pressure. As management strategy, three operation modes are allowed: (i) full load in which the hydrogen flow rate is equal to the nominal value, (ii) partial load in which the hydrogen flow rate varies linearly from 40% to 100% of the nominal value according to the specified minimum and maximum storage pressures, and (iii) hot standby mode in which no hydrogen feeds the unit; in this operation mode, the heat losses of all the items of equipment have to be compensated by electrical heat tracing system [
12,
13].
Thus, it is assumed that at the beginning of the operation, the storage tank is empty. According to the wind energy supply, the product hydrogen is sent to the storage unit until the pressure in the tank reaches the maximum value (maximum storage pressure, ) and the tank is completely full. In this condition, the methanation unit starts at full load and the corresponding hydrogen flow rate is directly delivered from the electrolysis unit or from the storage unit or from both, depending on the electrical supply (i.e., if the product hydrogen is less than the required flow rate, the remaining is delivered from the storage). When the pressure in the storage tank decreases, the hydrogen flow rate sent to the methanation unit decreases too, and the operation mode is switched to partial load. This operation mode goes on until the storage pressure reaches a threshold value (shutdown pressure, ) beyond which the methanation unit is kept in hot standby.
When the methanation unit is in hot standby, the hydrogen generated from the electrolysis is sent to the storage unit until the pressure rises a threshold value (restart pressure,
) beyond which the methanation unit restarts under partial load conditions. During the shutdown and restarting phases, the reactors are flushed with hydrogen (1/12 of the nominal flow rate for 1 h, as reported in ref. [
6]).
The pressure in the storage tank is calculated by applying the EoS for ideal gases:
where
(Pa) and
(Pa) are the storage pressure at the time
t (h) and
t − 1 (h),
(kg) is the hydrogen mass produced in 1 h at the time
t,
(kg) is the hydrogen mass sent to the methanation unit in 1 h at the time
t,
is the hydrogen gas constant (J/kg K), and
(K) and
(m
3) are the storage temperature and tank volume, respectively.
The input parameters of the model are the storage capacity, expressed in kilogram of stored hydrogen, the storage temperature, the maximum and minimum storage pressures, the shutdown and restart pressure, and the hydrogen flow rate feeding the methanation unit at full load. In this study, the storage capacity is chosen for assuring 6.5 h of full load operation of the methanation unit.
The control strategy proposed has been implemented using the MATLAB package software. In the
Appendix A, the flow chart of the storage model is reported.
7. Results and Discussion
This section is organized as follows. In
Section 7.1 (Performance Parameters), the indexes used for the performance evaluation are defined. In
Section 7.2 (Plants Sizing and Performance Assessment at Nominal Conditions), the integrated thermochemical model is applied for evaluating the energy and mass balances and performance, in terms of SNG production and overall plant efficiency at nominal conditions. In
Section 7.3, the annual performances are presented.
7.1. Performance Parameters
The nominal efficiencies of the electrolysis unit and the methanation unit as well as the overall nominal efficiency of the PtSNG plant are defined as the ratio between the useful output powers (i.e., the chemical power of the hydrogen or the SNG) and the input powers (i.e., the wind electric power or the chemical power of hydrogen). Therefore, the nominal efficiency of the PEM electrolysis unit is:
where
is the chemical power of the produced hydrogen at nominal conditions calculated on LHV basis, and
is the electric power consumed by the electrolysis unit in DC. It is equal to the input renewable power multiplied by the rectifier efficiency.
The nominal efficiency of the methanation unit is:
where
and
are the chemical powers of the hydrogen feeding and the SNG exiting the methanation unit at nominal conditions, and
is the electric power consumption of recirculation blower.
The thermal power available from the heat exchangers is not accounted in this calculation. The nominal overall efficiency of the PtSNG plant results:
In the above equation, is the SNG chemical power generated, is the wind power supply to the electrolysis unit in AC, is the power consumption of the hydrogen compressor, is the power consumption of the SNG compressor, and is the hydrogen chemical power sent to the storage unit.
Because of the fluctuating behavior of the input energy source, the nominal efficiencies are not sufficient to evaluate the effectiveness of the plant, but it is necessary to evaluate the annual performance [
10]. This is defined as the ratio of usable system energy output to overall system energy input (electricity and possibly heat) [
10,
11]. Therefore, the annual efficiencies of the energy conversion units and the annual overall efficiency are calculated as the nominal efficiencies, by replacing the power with the energy (electric or chemical) consumed or generated in 1 year of operation. However, the thermal energy required to maintain the plant equipment in hot standby during the no production hours should be added as energy input:
where
and
are the thermal energy required to maintain system in hot standby during the no production hours, and
is the chemical energy of the remaining hydrogen in the storage tank.
A useful performance parameter for evaluating the correct sizing of the plant is the plant load factor. It compares the annual chemical energy production of the produced SNG with the maximum production in 1 year:
where
is the plant production at rated power.
7.2. Plants Sizing and Performance Assessment at Nominal Conditions
The integrated model described in the previous section has been applied for evaluating the mass and energy balance of the PtSNG plants at nominal conditions (full load mode). Because of the same operating conditions, the plants differ only for the input and output mass and energy fluxes.
Table 1 summarizes the common operating data and parameters.
The PEM electrolysis unit consists of modules of 1 MWDC that is the base module for all plant sizes considered. The chosen nominal operating conditions, in terms of current density and average cell voltage for each stack, are 2.99 A/cm2 and 2.17 V, respectively, and are derived from the polarization curve calculated by means of Equation (1). By fixing the cell area (1000 cm2) and the number of stacks per module (3), the number of cells per stack results equal to 55. The power consumption of the module auxiliaries is set to 2.8% of the rated power. At nominal conditions, the hydrogen generated by the module results equal to 16.8 kg/h with a specific energy consumption of 59.6 kWh/kg of the produced hydrogen.
The operating pressure of the methanation unit is set to 20 bar since higher methanation pressures do not have a significant impact on the methane content in the product gas mixture, as discussed in
Section 5.2. In order to contain the hydrogen storage tank capacity, the methanation unit is sized for processing the maximum hydrogen flow produced by the electrolysis unit. This choice makes the decoupling between the dynamics of the electrolysis unit and that of the methanation unit less effective but reduces the plant capital costs (based on the storage pressure of 50 bar, the cost is estimated 375 €/kg [
6]).
Moreover, the hydrogen storage unit is designed for assuring the full load operation of the methanation unit for about 6.5 h. The maximum storage pressure and the storage temperature are assumed equal to 45 bar and 30 °C, while the minimum pressure in the storage tank is set to 22 bar in order to allow the feeding of the methanation unit without a compression system.
In
Table 2, the mass and energy balances of the considered PtSNG plant sizes are reported. The electrolysis unit consists of 1, 3, and 6 modules and generates 16.8, 50.5, and 101.0 kg/s of hydrogen, respectively. The composition of the produced SNG is 95.9% mol CH
4, 3.3% mol H
2, 0.8% mol CO
2, and traces of H
2O, and its low heating value (LHV) is 49.2 MJ/kg, whereas the calculated Wobbe Index is 49.7 MJ/Nm
3. These values fill with the quality foreseen by the ongoing work on European standardization of power-to-hydrogen applications, for which most of the European natural gas infrastructure can withstand a volume concentration 10% of hydrogen. Depending on the electrolysis unit capacity (1, 3, or 6 MW), the SNG production is equal to 34.1, 102.4, and 204.9 kg/s, respectively, while the maximum amount of the stored hydrogen is 110, 325, and 650 kg, respectively. By considering the storage conditions (45 bar and 30 °C), the tank capacities are 30, 90
, and 180 m
3, respectively.
The nominal (full load) efficiencies of the energy conversion units and the overall nominal efficiency, calculated by applying Equations (7)–(9), are 56.0%, 83.0%, and 44.3%, respectively.
7.3. Dynamic Operation and Annual Mass and Energy Balance
The time-domain simulation of the PtSNG system has been performed using MATLAB computing software. The annual energy balance of the PtSNG plant has been carried out by assuming that each electrolysis module can operate between the 20% (200 kWh
DC) and 100% of its nominal load [
12], while, as previously discussed, the minimum load of the methanation unit for assuring the quality of the produced SNG is 40%. The isentropic efficiencies of the BoP components and devices such as the hydrogen compressor and the SNG compressor have been assumed constant because of their very small impact on the total electric consumptions (about 0.1% of the electric consumption of the electrolysis unit).
The efficiency of the electrolysis unit varies with the power supplied as well as the hydrogen production. Using the specific energy consumption defined in Equation (5) and reported in
Figure 10, the hydrogen production (kg) as function of the supplied wind energy (kWh) is obtained by the following equation:
where
(kWh
AC) is the hourly electricity supplied to the electrolysis unit (it depends on the stored energy factor), and
is the rectifier efficiency.
Therefore, by starting from the hourly electric energy generated by the wind farm and by applying the integrated PtSNG model, the hourly hydrogen production as well as the hourly mass and energy balances are calculated for each plant size. In
Table 3, the annual operation time of the electrolysis and methanation units are reported for the three plant sizes.
The annual operation time of the EU unit results equal to 5868 h with 477 shutdown and 117 ON/OFF cycles. While the annual operation time of the EU unit only depends on the wind energy availability, the full load and partial load hours strictly depends on the chosen size of the EU. Therefore, as expected (see
Figure 3), the full load time decreases from 4372 to 2813 h (−35.7%) and 1646 h (−63.2%). With respect to the annual operation time of the methanation unit, the greatest value (6047 h) is obtained for the PtSNG plant sized for 1 MW of energy input, whereas in the cases of 3 and 6 MW, it results smaller than the annual operation time of the electrolysis unit. In order to increase the annual operation time of the methanation unit, a smaller hydrogen flow rate at full load mode (i.e., the nominal hydrogen flow rate) has to be chosen, involving, however, the need of higher capacities for the storage. The calculated shutdowns are more than halved (212, 225, and 233), and the ON/OFF cycles are suppressed.
The flushed hydrogen flows are 641, 2142, and 4520 kg/year for 1, 3, and 6 MW, respectively.
Table 4 summarizes the annual mass and energy balance and the annual efficiencies of the PtSNG plants.
The annual overall efficiencies are decreasing with the plant size (from 43.7% to 41.6%), due to the growing impact of the energy required to balance the heat losses in the hot standby mode (the standby period increases from 2713 to 4590 h). This may suggest that, in the case in which the standby period is significant (this estimation should be made in terms of forecasting), it could be better to keep the system in cold standby, even if the start-up procedure use more energy depending on the duration of the plant downtime.
Finally, the plant load factor shows the greatest value (60.0%) in the case of 1 MW plant capacity and the smallest (35.4%) for the 6 MW plant capacity.
8. Conclusions
In this paper, a PtSNG plant coupled with a 12 MW wind farm has been defined and investigated by evaluating nominal and annual efficiencies for different sizes of the electrolysis unit.
The plant consists of four sections: (i) the electrolysis unit, (ii) the CO2 methanation unit, (iii) the hydrogen storage unit, and (iv) the SNG upgrading unit.
The main design specifications of the PtSNG plant regard the SNG composition (CH4 > 95%, H2 ≤ 5%, and CO2 balance), and the capacity of the storage unit (minimum size to assure about 6.5 h of full load for the methanation unit with a small number of shutdowns and ON/OFF cycles).
In order to define the plant operating conditions and the plant sizing in terms of mass and energy flows, an integrated thermochemical and electrochemical model has been developed. This model has allowed to assess the energy and mass balances as well as the performances of each plant section in steady state conditions (full or partial load).
The dynamic operation of the PtSNG plant has been investigated by developing a dynamic model that assess the mass and energy fluxes between the plant sections by following the control strategy of the storage unit, conceived to reduce the shutdowns and the ON/OFF cycles of the methanation unit with the minimum storage capacity.
The findings obtained by applying the integrated steady state model and the dynamic model are:
the nominal overall efficiency, referred to the LHV and calculated by considering only the SNG as useful product, is equal to 44% for all the three plant sizes considered; in the full load operation, the SNG production is equal to 34.1, 102.4, and 204.9 kg/h, respectively.
the rectifier efficiency (the efficiency of the AC/DC transformer) and the electrolysis unit efficiency mainly impact on the overall plant efficiency. Thus, using more efficient devices (i.e., by assuming 98% and 70%), the overall nominal efficiency is 58.1%.
in order to increase the plant performances, the heat generated during the methanation operation should be valorized using thermal storage or in power generation systems; to this end, further investigations and improvement of the developed models are required.
the operation time diminishes with the plant capacity, reaching the greatest value (6047 h) for the 1 MW size configuration that shows also the smallest number of shutdowns (212).
the annual overall efficiency as well as the plant load factor achieves the greatest values (43.7%, LHV basis and 60%) for the 1 MW size configuration. The annual SNG production is equal to 179,000 Nm3/year.
Furthermore, it has to be underlined that the results presented are valid only for the specific hypotheses and technologies adopted as well as for the specific profile of the electrical input and the chosen plant management strategy.
Finally, the modular structure of the developed models makes it possible to easily modify the plant configurations of the various units. Therefore, the developed models can be a useful tool for the technical–economic evaluation of the SNG.
Author Contributions
Conceptualization, M.D., A.P., G.S.; Methodology, M.D., A.P., G.F.; Software, L.M.; Validation, L.M., L.C.; Formal Analysis, L.M., L.C.; Investigation, A.P., L.M.; Resources, M.D., A.P., G.S.; Data Curation, L.M., L.C.; Writing-Original Draft Preparation, A.P., G.F., L.M.; Writing-Review & Editing, A.P., G.S., G.F., M.D.; Visualization, G.F.; Supervision, M.D.; Project Administration, M.D.; Funding Acquisition, M.D.I. All authors have read and agreed to the published version of the manuscript.
Funding
This research was supported by Regione Lazio, Progetti Strategici 2019 Progetto SINBIO “Sistemi INtegrati di produzione e immissione in rete di BIOmetano e gas sintetici da fonti rinnovabili,” Grant number F82I20000300002.
Conflicts of Interest
The authors declare no conflict of interest.
Acronyms
| AC | Alternating current |
| AEL | Alkaline electrolysis |
| BoP | Balance of plant |
| CHP | Combined heat and power |
| DC | Direct current |
| EU | Electrolysis unit |
| IRES | Intermittent renewable energy sources |
| LHV | Low heating value |
| MU | Methanation unit |
| PEMEL | Proton exchange membrane electrolysis |
| PtG | Power to gas |
| PtSNG | Power to SNG |
| RWGS | Reverse water gas shift |
| SNG | Synthetic natural gas |
| SOEL | Solid oxide electrolysis |
| TREMP | Tøpsoe’s Recycle Energy-efficient Methanation Process |
Appendix A
Appendix A1. Validation of the Methanation Unit Model
TREMP process was developed by Danish company Haldor Topsøe in 1970 through the experimental activity carried out within the Einzelspaltrohr-Versuchsanlage (EVA I), Single Splitting Tube Test Facility and Anlage mit drei adiabaten Methanisierungsanlagen (ADAM I), Facility with Three Adiabatic Methanation Reactors), Germany projects [
30,
31]. The TREMP technology addresses the essential question of minimum recycle cost and heat recovery most efficiently by recovering the heat as high-pressure superheated steam. In order to apply such a heat recovery concept, it is essential to recover the reaction heat at high temperature. Due to the unique MCR-2X methanation catalyst supplied by Haldor Topsøe, TREMP can operate in a wide temperature range, from 250 to 700 °C [
23]. The reactions in take place in adiabatic fixed bed reactors. The exothermicity of methanation reaction result in a high outlet temperature, which allows the reaction heat to be recovered for generation of superheated high-pressure steam in the downstream exchangers. The outlet gas from the first reactor is partially recirculated in order to control the temperature increase in the reactor itself. The exit gas from the first reactor after being cooled enters the subsequent methanation reactors operating at decreasing temperature levels. The number of methanation reactors depend on the operating condition, such as pressure, as well as the SNG product specification.
In order to validate the proposed TREMP model, shown in
Figure A1, a comparison of experimental data reported in [
30] with the simulated results using the present model was performed. The experimental data refers to results obtained by experiments on high-temperature methanation carried out in the bench-scale unit ADAM I [
31]. The methanation plant ADAM I consisted of three adiabatic fixed bed methanation reactors including recycle according to the TREMP process. As shown in
Table A1, a good agreement is observed between the experimental data and results predicted from the proposed model. The feeding gas flow rate is 535 Nm
3/h (composition is 65.45% mol H
2, 9.84% mol CO, 8.96% mol CO
2, 11.3% mol CH
4), at 300 °C and 27.3 bar.
Figure A1.
Flowsheet of the methanation process model.
Figure A1.
Flowsheet of the methanation process model.
Table A1.
Simulation results compared with experimental data of Anlage mit drei adiabaten Methanisierungsanlagen (ADAM I) methanation plant
Table A1.
Simulation results compared with experimental data of Anlage mit drei adiabaten Methanisierungsanlagen (ADAM I) methanation plant
| | R1 Inlet | R1 Exit | R2 Exit | R3 Exit | SNG |
|---|
| | [30] | model | [30] | model | [30] | model | [30] | model | [30] | model |
| Temperature (°C) | 300 | 299 | 604 | 595 | 451 | 451 | 303 | 302 | 23 | 23 |
| Pressure (bar) | 27.2 | 27.3 | 27.1 | 27.1 | 27.05 | 27.05 | 27 | 27 | 27 | 27 |
| Flow rate (Nm3/h) | 1416 | 1416 | 1255 | 1252 | 348 | 346.6 | 334 | 336.2 | 191 | 190.4 |
| Gas composition (vol. %) | |
| H2 | 36.88 | 36.74 | 20.96 | 19.29 | 8.10 | 7.50 | 1.77 | 1.63 | 3.11 | 2.88 |
| CO | 4.28 | 4.30 | 1.17 | 0.94 | 0.00 | 0.05 | 0.00 | 0.00 | 0.00 | 0.00 |
| CO2 | 6.13 | 5.93 | 4.46 | 4.09 | 2.07 | 1.81 | 0.95 | 0.37 | 1.67 | 0.66 |
| CH4 | 28.12 | 28.16 | 37.44 | 38.40 | 44.36 | 44.64 | 47.28 | 47.55 | 82.95 | 83.96 |
| H2O | 19.19 | 19.25 | 29.82 | 30.94 | 38.84 | 39.21 | 43.06 | 43.45 | 0.10 | 0.14 |
| N2 | 5.41 | 5.61 | 6.15 | 6.35 | 6.64 | 6.80 | 6.93 | 7.00 | 12.16 | 12.37 |
Appendix A2. The Storage Control Strategy Flow Chart
Figure A2.
Flowchart of the storage control strategy.
Figure A2.
Flowchart of the storage control strategy.
References
- Gangoli Rao, A.; Van den Oudenalder, F.S.C.; Klein, S.A. Natural gas displacement by wind curtailment utilization in combined-cycle power plants. Energy 2019, 168, 477–491. [Google Scholar] [CrossRef]
- Mazza, A.; Bompard, E.; Chicco, G. Applications of power to gas technologies in emerging electrical systems. Renew. Sustain. Energy Rev. 2018, 92, 794–806. [Google Scholar] [CrossRef]
- Götz, M.; Lefebvre, J.; Mörs, F.; Koch, A.M.; Graf, F.; Bajohr, S.; Reimert, R.; Kolb, T.E. Renewable Power-to-Gas: A technological and economic review. Renew. Energy 2016, 85, 1371–1390. [Google Scholar] [CrossRef]
- Marcogaz (Technical Association of the European Natural Gas Industry). Overview of Test Results and Regulatory Limits for Hydrogen Admission into Existing Natural Gas Infrastructure and End Use, 2019. Available online: https://www.marcogaz.org/publications-1/documents/01-10-2019-TF_H2-427 (accessed on 24 November 2020).
- Chein, R.; Chen, W.; Yu, C. Numerical simulation of carbon dioxide methanation reaction for synthetic natural gas production in fixed-bed reactors. J. Nat. Gas Sci. Eng. 2016, 29, 243–251. [Google Scholar] [CrossRef]
- Gorre, J.; Ortloff, F.; van Leeuwen, C. Production costs for synthetic methane in 2030 and 2050 of an optimized Power-to-Gas plant with intermediate hydrogen storage. Appl. Energy 2019, 253, 113594. [Google Scholar] [CrossRef]
- Blanco, H.; Nijs, W.; Ruf, J.; Faaij, A. Potential of Power-to-Methane in the EU energy transition to a low carbon system using cost optimization. Appl. Energy 2018, 232, 323–340. [Google Scholar] [CrossRef]
- Wang, L.; Düll, J.; Wang, L.; Van Herle, J. Trade-off designs and comparative exergy evaluation of solid-oxide electrolyzer based power-to-methane plants. Int. J. Hydrog. Energy 2019, 44, 9529–9543. [Google Scholar] [CrossRef]
- Antenucci, A.; Sansavini, G. Extensive CO2 recycling in power systems via Power-to-Gas and network storage. Renew. Sustain. Energy Rev. 2019, 100, 33–43. [Google Scholar] [CrossRef]
- Van Leeuwen, C.; Mulder, M. Power-to-gas in electricity markets dominated by renewables. Appl. Energy 2018, 232, 258–272. [Google Scholar] [CrossRef]
- Tschiggerl, K.; Sledz, C.; Topic, M. Considering environmental impacts of energy storage technologies: A life cycle assessment of power-to-gas business models. Energy 2018, 160, 1091–1100. [Google Scholar] [CrossRef]
- Frank, E.; Gorre, J.; Ruoss, F.; Friedl, M.J. Calculation and analysis of efficiencies and annual performances of Power-to-Gas systems. Appl. Energy 2018, 218, 217–231. [Google Scholar] [CrossRef]
- Salomone, F.; Giglio, E.; Ferrero, D.; Santarelli, M.; Pirone, R.; Bensaid, S. Techno-economic modelling of a Power-to-Gas system based on SOEC electrolysis and CO2 methanation in a RES-based electric grid. Chem. Eng. J. 2019, 377, 120233. [Google Scholar] [CrossRef]
- Uchman, W.; Skorek-Osikowska, A.; Jurczyk, M.; Węcel, D. The analysis of dynamic operation of power-to-SNG system with hydrogen generator powered with renewable energy, hydrogen storage and methanation unit. Energy 2020, 213, 118802. [Google Scholar] [CrossRef]
- Simonis, B.; Newborough, M. Sizing and operating power-to-gas systems to absorb excess renewable electricity. Int. J. Hydrog. Energy 2017, 42, 21635–21647. [Google Scholar] [CrossRef]
- Gorre, J.; Ruoss, F.; Karjunen, H.; Schaffert, J.; Tynjälä, T. Cost benefits of optimizing hydrogen storage and methanation capacities for Power-to-Gas plants in dynamic operation. Appl. Energy 2020, 257, 113967. [Google Scholar] [CrossRef]
- Maric, R.; Yu, H. Proton exchange membrane water electrolysis as a promising technology for hydrogen production and energy storage. In Nanostructures in Energy Generation, Transmission and Storage; Fedorenko, Y., Ed.; IntechOpen: Liverpool, UK, 2019. [Google Scholar]
- McDonagh, S.; O’Shea, R.; Wall, D.M.; Deane, J.P.; Murphy, J.D. Modelling of a power-to-gas system to predict the levelised cost of energy of an advanced renewable gaseous transport fuel. Appl. Energy 2018, 215, 444–456. [Google Scholar] [CrossRef]
- Schaaf, T.; Grünig, J.; Schuster, M.R.; Rothenfluh, T.; Orth, A. Methanation of CO2-storage of renewable energy in a gas distribution system. Energy Sustain. Soc. 2014, 4, 2. [Google Scholar] [CrossRef]
- Bailera, M.; Lisbona, P.; Romeo, L.M.; Espatolero, S. Power to Gas projects review: Lab, pilot and demo plants for storing renewable energy and CO2. Renew. Sustain. Energy Rev. 2017, 69, 292–312. [Google Scholar] [CrossRef]
- Crossley, P. From coal to clean energy. In Routledge Handbook Energy Law; Routledge: Abington, UK, 2020; Volume 310, pp. 393–413. [Google Scholar] [CrossRef]
- Fendt, S.; Buttler, A.; Gaderer, M.; Spliethoff, H. Comparison of synthetic natural gas production pathways for the storage of renewable energy. Wiley Interdiscip. Rev. Energy Environ. 2015, 5, 327–350. [Google Scholar] [CrossRef]
- TOPSOE Haldor. From Solid Fuels to Substitute Natural Gas (SNG) Using TREMP; Technical Report; Halder Topsoe: Lyngby, Denmark, 2009. [Google Scholar]
- Ghaib, K.; Ben-Fares, F.-Z. Power-to-Methane: A state-of-the-art review. Renew. Sustain. Energy Rev. 2018, 81, 433–446. [Google Scholar] [CrossRef]
- Gahleitner, G. Hydrogen from renewable electricity: An international review of power-to-gas pilot plants for stationary applications. Int. J. Hydrog. Energy 2013, 38, 2039–2061. [Google Scholar] [CrossRef]
- Zhang, F.; Zhao, P.; Niu, M.; Maddy, J. The survey of key technologies in hydrogen energy storage. Int. J. Hydrog. Energy 2016, 41, 14535–14552. [Google Scholar] [CrossRef]
- Chauvy, R.; Dubois, L.; Lybaert, P.; Thomas, D.; De Weireld, G. Production of synthetic natural gas from industrial carbon dioxide. Appl. Energy 2020, 260, 114249. [Google Scholar] [CrossRef]
- European Commission. Horizon 2020-Programme Fuel Cells and Hydrogen Joint Undertaking (Fch 2 Ju) Topic H2020-Jti-Fch-2015-1: Improved Electrolysis for Distributed Hydrogen Production; Ga No. 700008; European Commission: Brussels, Belgium, 2020. [Google Scholar]
- Dannesboe, C.; Hansen, J.B.; Johannsen, I. Catalytic methanation of CO2 in biogas: Experimental results from a reactor at full scale. React. Chem. Eng. 2020, 5, 183–189. [Google Scholar] [CrossRef]
- Kopyscinski, J.; Schildhauer, T.J.; Biollaz, S.M. Production of synthetic natural gas (SNG) from coal and dry biomass–A technology review from 1950 to 2009. Fuel 2010, 89, 1763–1783. [Google Scholar] [CrossRef]
- Höhlein, B.; Niessen, H.; Range, J.; Schiebahn, H.; Vorwerk, M. Methane from synthesis gas and operation of high-temperature methanation. Nucl. Eng. Des. 1984, 78, 241–250. [Google Scholar] [CrossRef]
| Publisher’s Note: MDPI stays neutral with regard to jurisdictional claims in published maps and institutional affiliations. |
© 2020 by the authors. Licensee MDPI, Basel, Switzerland. This article is an open access article distributed under the terms and conditions of the Creative Commons Attribution (CC BY) license (http://creativecommons.org/licenses/by/4.0/).


 and
and 


