Article

Interaction Strength Analysis to Model Retweet Cascade Graphs

1
Institute for Informatics and Telematics (IIT) of the National Research Council of Italy (CNR), 56124 Pisa, Italy
2
Department of Information Engineering, University of Pisa, 56124 Pisa, Italy
*
Author to whom correspondence should be addressed.
Appl. Sci. 2020, 10(23), 8394; https://doi.org/10.3390/app10238394
Submission received: 13 October 2020 / Revised: 15 November 2020 / Accepted: 20 November 2020 / Published: 25 November 2020
(This article belongs to the Special Issue Social Network Analysis)

Abstract

:
Tracking information diffusion is a non-trivial task and it has been widely studied across different domains and platforms. The advent of social media has led to even more challenges, given the higher speed of information propagation and the growing impact of social bots and anomalous accounts. Nevertheless, it is crucial to derive a trustworthy information diffusion graph that is capable of highlighting the importance of specific nodes in spreading the original message. The paper introduces the interaction strength, a novel metric to model retweet cascade graphs by exploring users’ interactions. Initial findings showed the soundness of the approaches based on this new metric with respect to the state-of-the-art model, and its ability to generate a denser graph, revealing crucial nodes that participated in the retweet propagation. Reliable retweet graph generation will enable a better understanding of the diffusion path of a specific tweet.

1. Introduction

In recent years, the explosion of Web 2.0, blogs, microblogs and online social media dramatically changed information consumption and spreading. A recent survey revealed that, for the first time in the history, United States people consume more news from social media than newspapers (https://www.cnbc.com/2018/12/10/social-media-more-popular-than-newspapers-for-news-pew.html). Thus, tracking the information diffusion, especially in online communities, is a very important step which is useful for many applications, such as early warning systems, social bot and community detection, user location prediction, financial recommendations, marketing campaign effectiveness, political mobilization and protests, etc. [1,2,3,4].
Among online communities, social media represent preferable channels for information diffusion, and with more than 330 million monthly active users, Twitter is one of the most used social media platforms which is often considered as an information network [5,6]. Twitter offers four possible actions to express interest in specific content: favorite, reply, quote and retweet. Replying or liking a tweet does not involve the spread of the content, whereas quotes and retweets are actions used to share information with a wider audience. However, quoting or retweeting a message may indicate a different user behavior. A retweet is often considered an endorsement, i.e., the user supports the original tweet’s content, whereas quoting may be done in order to express a different idea [7].
In order to understand the connections among users, it is important to consider not only their social networks but also the way they interact with information, especially through retweets [5,6]. Thanks to the Twitter API service, it is possible to collect a huge amount of information regarding tweets, accounts, users timelines and social networks (i.e., following and followers). However, the Twitter API does not provide complete information about retweets and their propagation paths. More precisely, the only information carried by a retweet is the original author of the tweet, whereas possible intermediate steps (i.e., retweeting from a retweeter) are lost.
To estimate retweet cascade graphs, previous studies typically adopted strategies based on social network information (i.e., friends and followers) in conjunction with temporal information. These studies exploited the fact that users tend to interact more often with newer tweets [7], and thus a user is more likely to retweet the last friend who retweeted content. However, this approach is no longer a reliable way of estimating retweet graphs, as Twitter does not show content based on simple reverse chronological order, but according to user interests, trending topics and interactions (https://blog.hootsuite.com/twitter-algorithm/).
Another factor that needs to be considered is the time required to fetch all the required social network information. Due to the Twitter API rate limits, the time required to collect the list of friends and followers is six times greater with respect to downloading the user’s timeline (https://developer.twitter.com/en/docs/accounts-and-users/follow-search-get-users/api-reference/get-followers-ids), on average.

Research Objective and Contributions

Following the limitations of the existing approach to generate retweet cascade graphs, in this paper we introduce the concept of interaction strength (IS), a novel metric that describes the strength of the link between two accounts in terms of reciprocal interactions, including quotes, replies, and retweets. The concept of the IS metric follows preceding work that highlighted the importance of relationship strength [8] for several tasks, including event and friend recommendation [9,10]. However, to the best of our knowledge, this is the first time that user interaction strength has been studied to derive retweet cascade graphs.
Based on this new metric, we propose two novel approaches to estimate retweet cascade graphs. The first approach is the interaction strength-based network (ISN), where the graph is constructed by maximizing the overall IS value computed for each pair of accounts. The friend list was used only for accounts that did not interact with other users, and for which it was not possible to find the IS values. The second approach is called interaction strength-based network with author’s followers evaluation (ISN-AF). This approach is similar to ISN, but the author’s follower list is exploited to generate the first level of the retweet cascade graph. Indeed, on Twitter a follower of the author of the original tweet (i.e., the root of the graph) can only retweet from the author himself/herself. It should be highlighted that both ISN and ISN-AF require to fetch the friends list for a limited number of accounts, whereas in the traditional approach it is necessary to fetch the friends list for each retweeters in the graph.
Models aimed at constructing the retweet cascade graph suffer from the absence of a ground truth to check the correctness of the method. Despite this limitation, retweet information graphs can be extremely useful for analytics related to community detection and influencer node behavior. Following [11], we evaluated the proposed approaches in terms of network graph strength, considering several metrics.
The novelty and contributions of this paper can be summarized as follows:
  • We introduce the concept of interaction strength (IS), a metric that indicates the strength of the link between two users;
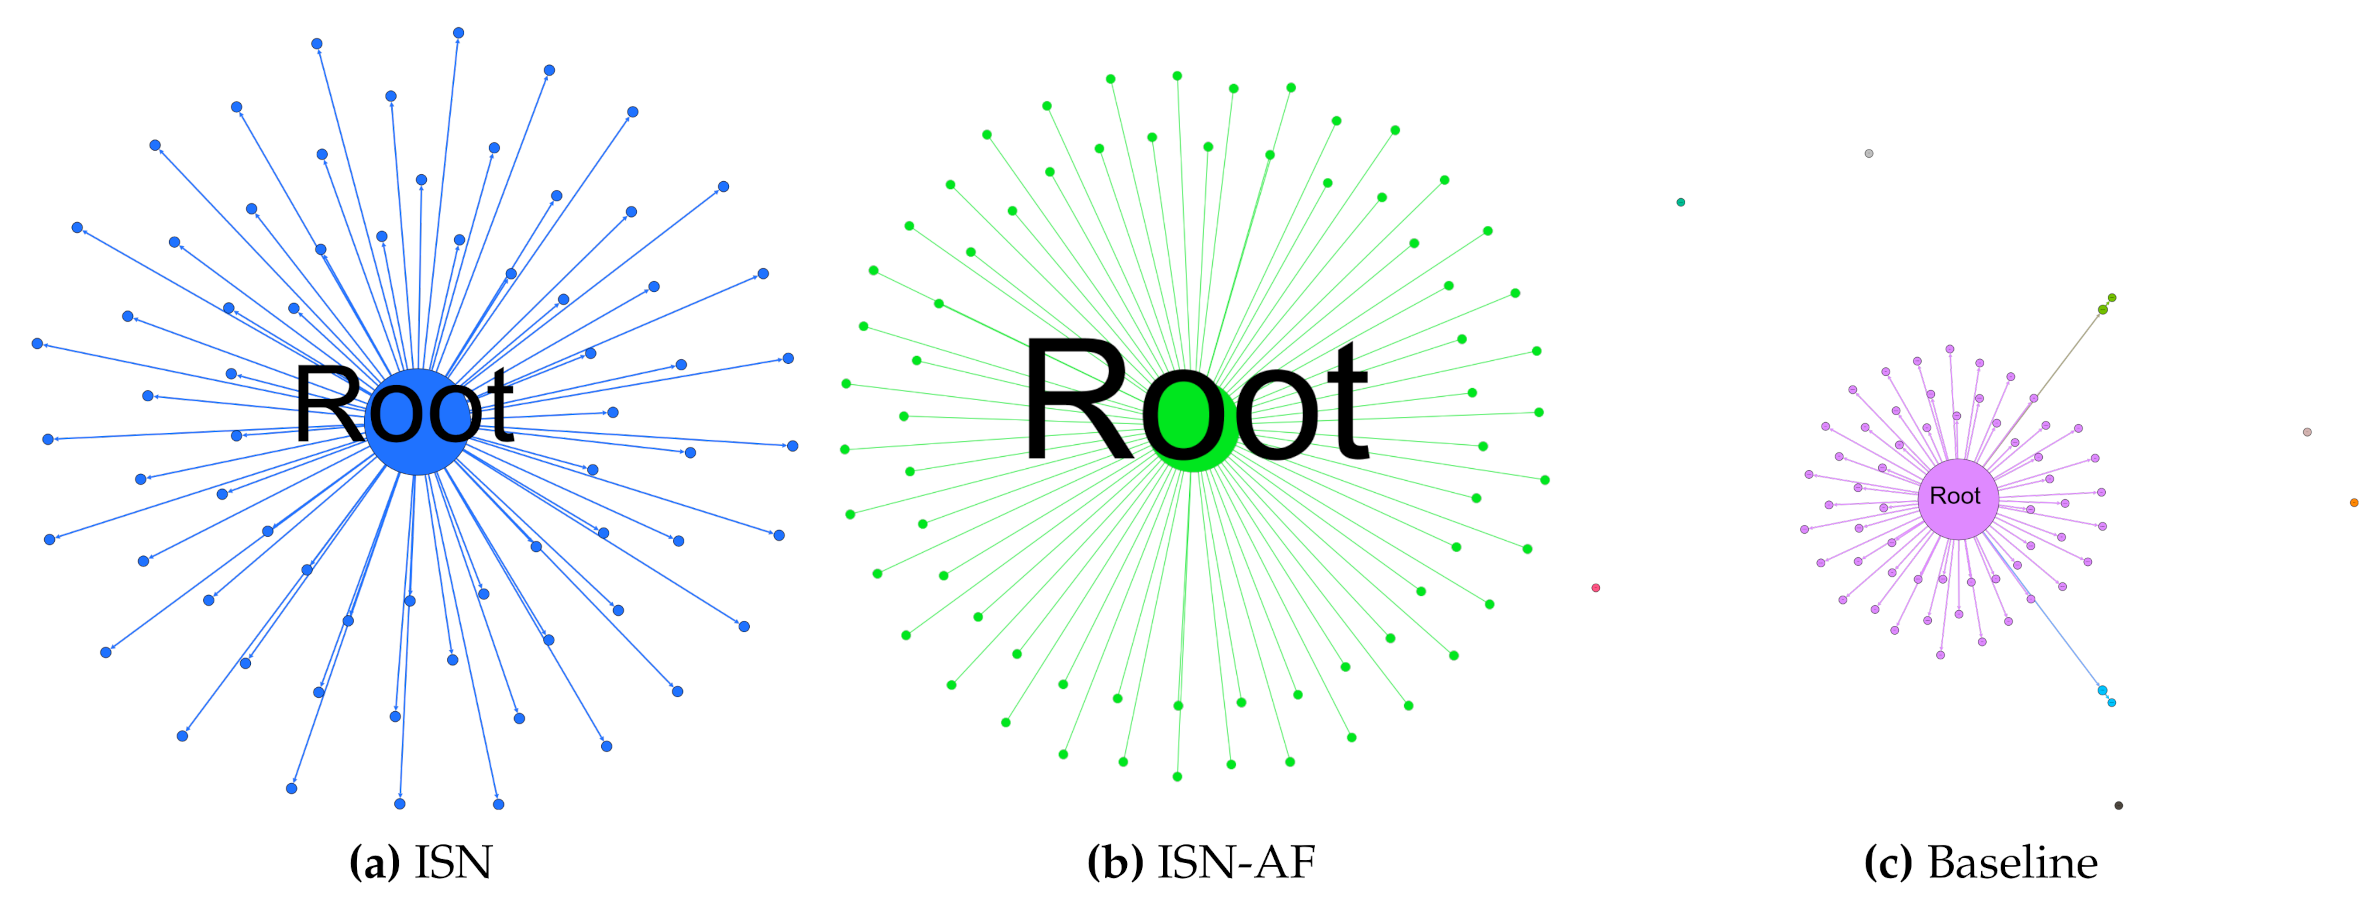
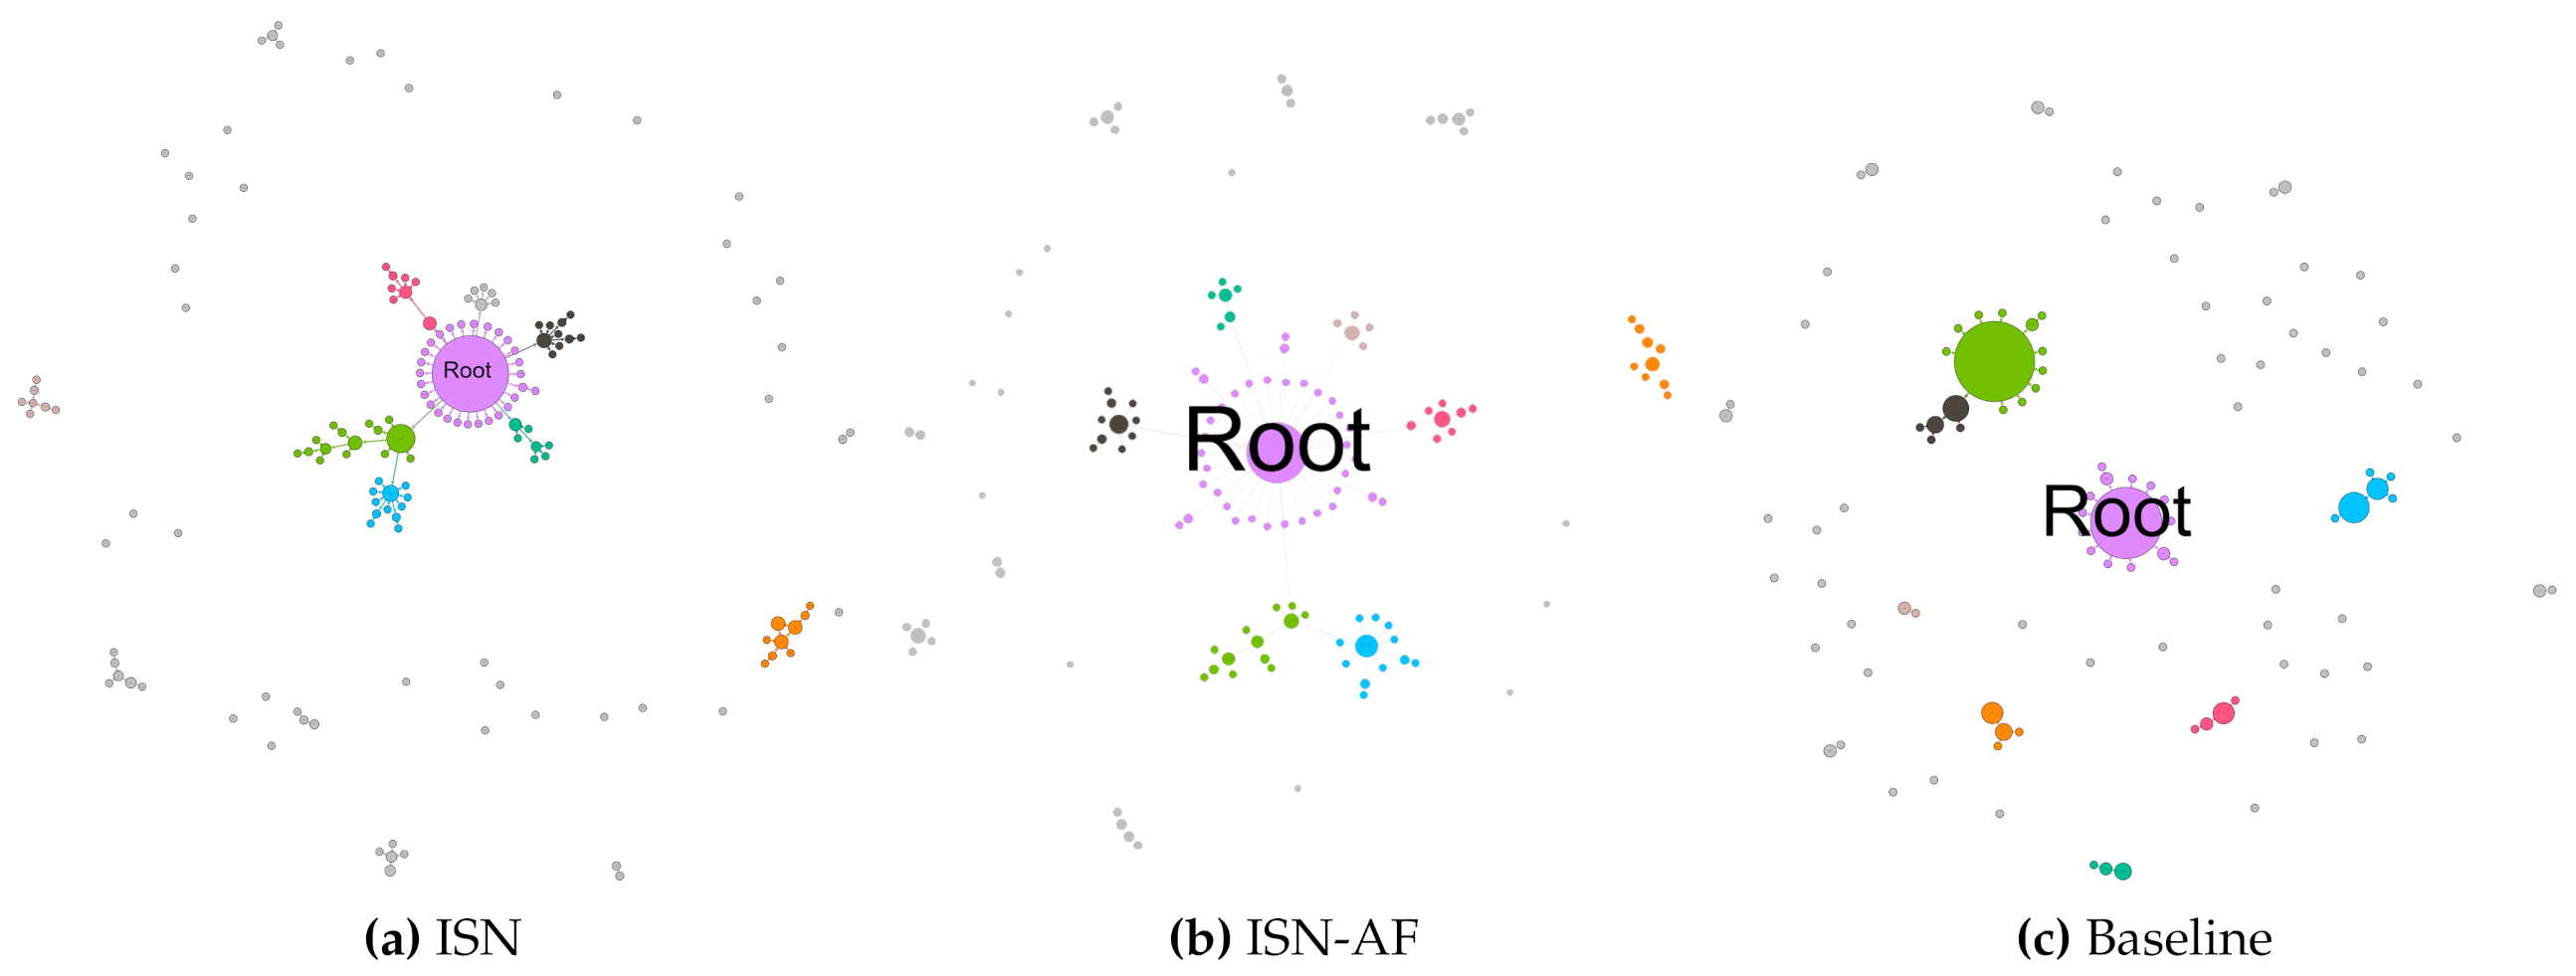
  • We propose two novel approaches based on IS to generate retweet cascade graphs—ISN and ISN-AF;
  • ISN aims to maximize IS values for each pair of nodes in the graph;
  • ISN-AF is similar to ISN, but the first level in the retweet cascade graph is based on the list of followers of the root user;
  • Both of the proposed approaches are mainly based on information contained in the users’ timelines, which can be conveniently retrieved through the free Twitter API service (compared to fetching the list of friends for each node as in the traditional approach, which is a substantially more time-consuming task);
In Section 2 we provide a detailed overview on previous work about information propagation and retweet cascade prediction. Then, in Section 3 the proposed IS concept is described jointly with the ISN model; in Section 4 we report the description of the ISN-AF approach. Section 6 details the dataset, and Section 7 reports the analysis of the results related to the IS metrics; and the comparison among the proposed ISN and ISN-AF with respect to the baseline are in Section 8. Finally, Section 9 concludes the paper.

2. Related Work

In Table 1 we report a summary, in chronological order, of a sample of previous work about information propagation on Twitter. Table 1 is composed of 14 columns, and each row represents a previous study, reported in the column Study. The second column named Target describes the paper scope with the acronyms reported in the table footnotes; then the columns Dataset, Dataset Size and Dataset Collection Date describe the datasets used. The following eight columns refer to a series of features which have been evaluated (X) or not (-) in the corresponding work. Finally, the column Method reports the acronym of the model proposed by the paper in the respective row. As Table 1 shows, the majority of works has focused on predicting retweet engagement (REP) in terms of total number of retweets. Other studies conducted a joint analysis between tweet information cascade (TIC) and REP, assuming that the retweet chains can be deducted from tweet content.
For instance, [13,15] derived the retweet propagation paths assuming that the user’s “ScreenName” reported in the text, such as “RT@ user ScreenName” indicates the user whose messagethe current user has read. However, as argued by [16], this assumption is mostly inaccurate. Moreover, the user information held in the current Twitter API is only related to the actual user retweeting the message and the original tweet author, thereby ignoring intermediate accounts [11]. More reliable retweet information cascades are the ones that merge temporal and social network information [18]. Scholars widely investigated factors affecting user retweet behavior (RB), finding that accounts with higher numbers of followers tend to be retweeted more often. However, there is not agreement on the minimum number of followers needed to be regarded as an “influencer” [6,16]. A relevant study in this field is [11], which analyzed four different options based on followed accounts to derive the possible retweet graph. Since there is no ground truth to compare the possible cascade options, the authors evaluated the options computing two metrics: the connectivity-rate and the root-fragmented-rate. Other works proposed the use of additional features, such as users’ metadata (e.g., number of followers, number of friends, status count, etc.) [19,20], text and topic similarity features [13], location information [23,31] and tweeting behavior (e.g., incidence of tweets or retweets in the user’s activity) [7]. Only two studies [24,31], as far as we know, integrated in the retweeting dynamic analysis the impacts of social relationships measured as the intensity of the interactions between two users. However, in both works [24,31], the authors measured the interactions in terms of retweets, which are, accordingly to the actual Twitter API information, not completed and miss intermediate steps introducing a bias. Thus, in this paper, we further refer to this bias as the retweet bias. Nonetheless, as argued by [32], trust between users is an important factor for information dissemination on distributed online social networks.
Therefore, starting from the findings in [32,33] and considering the limitations of the Twitter API service, in this paper we propose a novel approach to generated retweet cascade graphs based on a user’s interaction strength (IS), which is measured by taking into account not only retweets, but also quotes and replies.

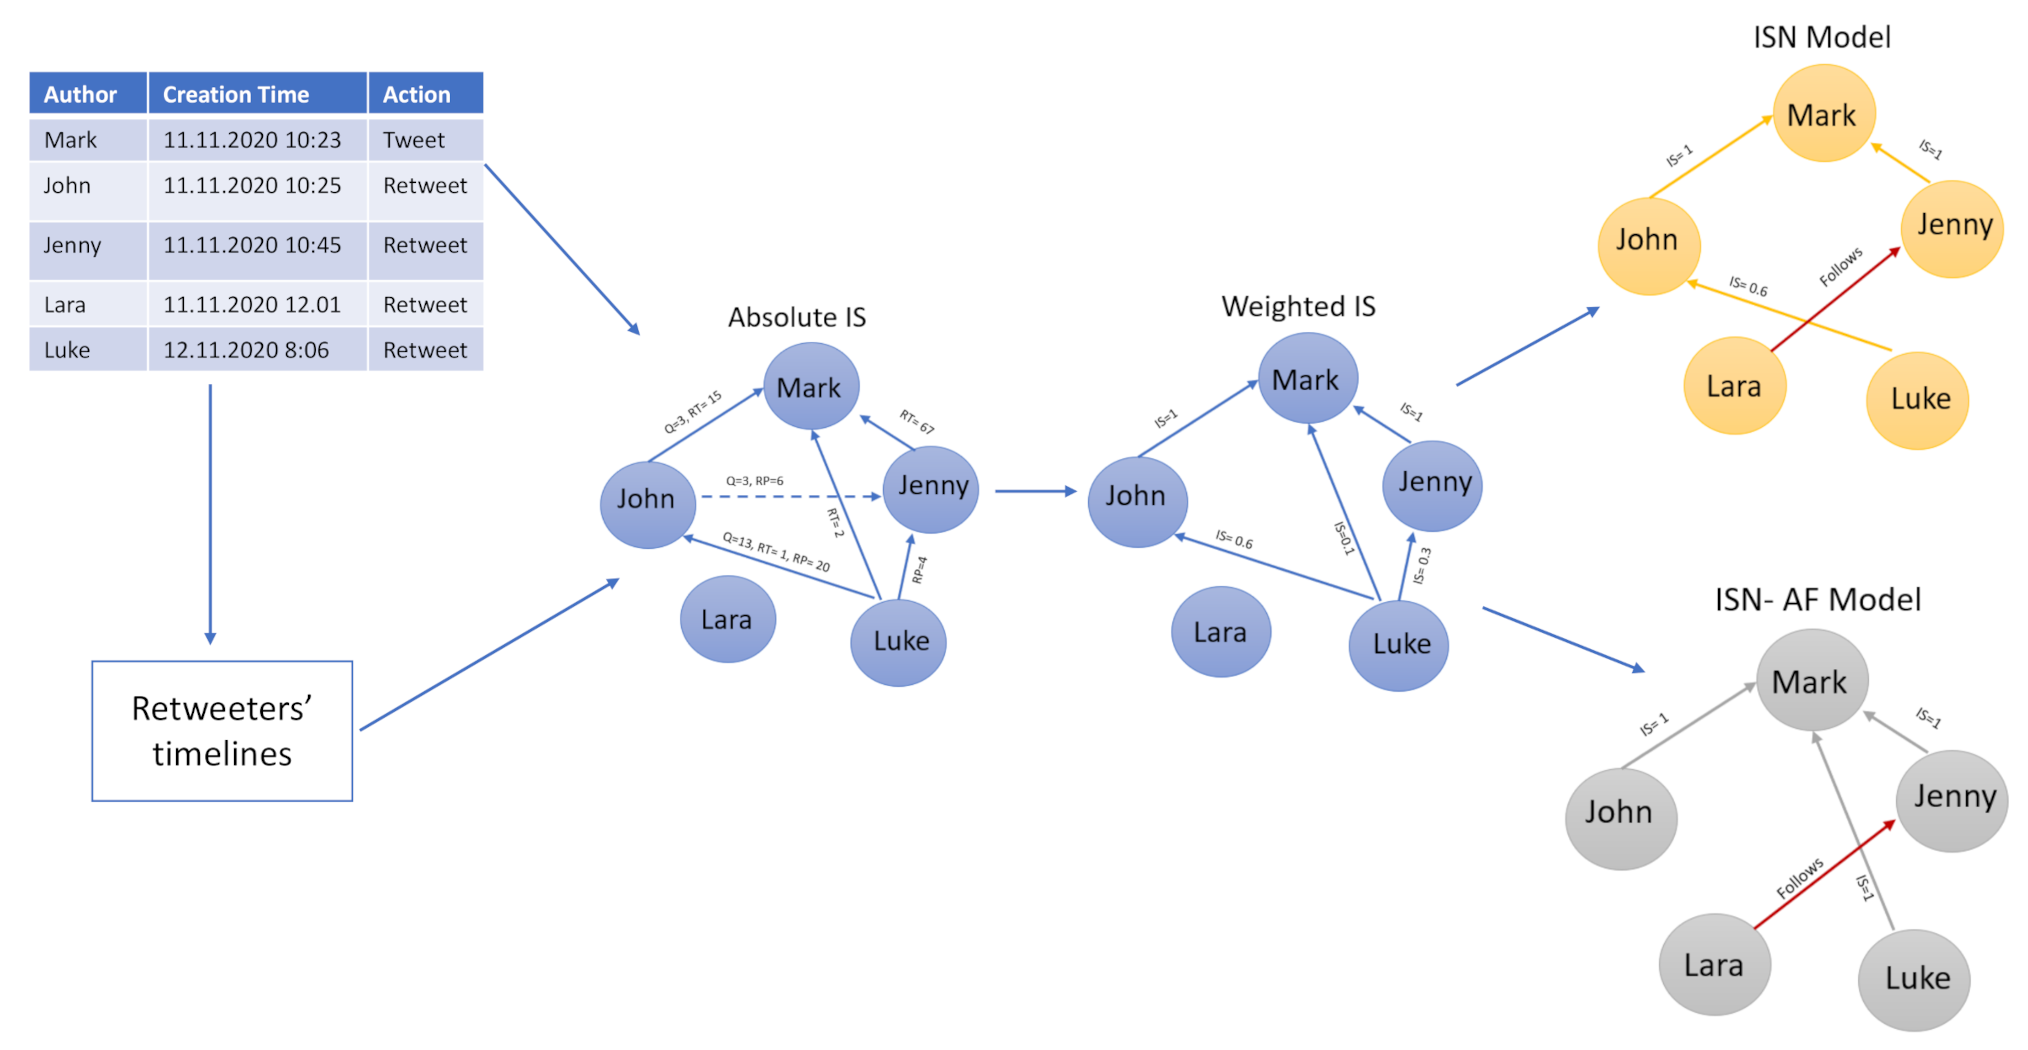
3. The Interaction Strength-Based Network (ISN) Approach to Generating Retweet Cascade Graphs

An information cascade C is defined as a directed graph C = ( V , E ) in which each node u V represents a user u and each edge ( u , y ) E represents the link from user u to user y. A retweet cascade graph is a class of information cascade characterized by a tree structure where the root node is the author of the original tweet ( r o o t a u t h o r ), which was posted at time r o o t t i m e .
Our purpose is to estimate the retweet information cascade graph using the following information:
  • The retweet’s creation time t r ;
  • The interaction strength between each couple ( u , w ) V , which reflects the trust between users;
  • The friend lists L F for the remaining nodes F V , for which no interactions were found (e.g., I S F = N u l l ).
A link in the cascade between any two nodes in V has to meet the following condition:
E ( u , w ) E u , w V t u > t w I S u , w s . t . I S u , w = max ( I S V \ { u } )
In other words, the user u is connected to the user w if w retweeted the message before u and if the IS of u with respect to w is the maximum of all the IS among user u and the other accounts that retweeted before u. The procedure to find the IS value is described in the next subsection. Whenever the user u V has no interactions with any other accounts, the proposed method adopts the approach based on social networks [11] collecting user u’s friends list L u such that:
E ( u , w ) E u , w V w L u t w = m i n ( t i t u ) i L u V \ { u } t i > t u
If there is no information about interactions, the node u is connected to the user in his/her friend list L u that retweeted the tweet r o o t a u t h o r before u, using an inverse chronological order, i.e., minimizing the difference between the user u posting time t u and t i , where i belongs to the set of users in L u . In the following, Section 3.1 and Section 3.2 describe the steps performed to find the interaction strength (IS) and to evaluate different sets of possible weights. Then, Section 3.3 explains how to connect remaining users according to social network information.

3.1. Twitter User’s Interaction Strength

Next, we describe the procedure that exploits the interactions to generate the cascade graphwhich is also depicted in Figure 1. For a user u, its timeline is first downloaded by means of the Twitter API. Then, its absolute interaction strength A b s o l u t e I S u , w is found with respect to any node w that is retweeted before u.
More precisely, to derive the A b s o l u t e I S u , w the following information is required:
  • The number of quotes Q u , w that user u expressed to the node w;
  • The number of replies R P u , w that user u did to w;
  • The number of retweets R T u , w that user u did for w.
The absolute interaction strength between u and w is defined as:
A b s o l u t e I S u , w = Q u , w + R P u , w + R T u , w .
The A b s o l u t e I S is found only with respect to nodes that were retweeted before u, and we also discarded interactions that happened after the root tweet creation ( r o o t t i m e ) and those that are too old to represent an ongoing trust relationship (trust relations tend to change over the years). In fact, as reported in the toy example in Figure 1, the dashed edge between John and Jenny is not considered for IS since John retweeted before Jenny, and thus the interactions are not needed to build the cascade graph. Moreover, we discarded interactions that occurred more than two years before the r o o t t i m e . We relied on r o o t t i m e as the threshold date for all the users’ relations involved in the cascade C since, in general, the tweet information cascade lifetime is short and concentrated in proximity of the tweet creation date. Figure 2 reports the retweet distribution given the time delay between the retweet action date and the original tweet posting time for all the 16,304 cascades in the sample. Figure 2 depicts the temporal dynamics of the retweets after the respective r o o t t i m e , showing a decreasing trend, as the highest number of interactions occurred soon after r o o t t i m e (the original tweet creation date).
After a weighted IS value W e i g h t e d I S u , w is found, by assigning different weights to quotes ( w q ), replies ( w r p ) and retweets ( w r t ):
W e i g h t e d I S u , w = w q Q u , w + w r p R P u , w + w r t R T u , w .
Finally, the I S u , w value is found by dividing W e i g h t e d I S u , w by the sum of all the weighted IS values for the user u. In this way, we obtained I S values for u that range within [ 0 , 1 ] , and are thus easier to evaluate and compare among retweets cascades. For instance, if I S u , w is 1, this means that w is the only user that retweeted before u and with whom u has interacted, as represented in Figure 1 in the edge between Jenny and Mark. The next section describes the grid search procedure adopted to derive the optimal weights ( w q , w r p , w r t ) .

3.2. Interaction Weights for Retweet Cascade Graph

To evaluate different weight values for the three interactions, we conducted experiments based on a grid search approach with 14 different sets of weights. Four sets are named guideline setups and are shown in Table 2: in the first guideline setup (weight set 0.0 ) all the weights are set to 1 and thus each interaction has the same impact on the approach; the remaining three guideline setups (sets 0.1 , 0.2 , 0.3 ) have only one weight set to 1, whereas the others are set to 0 to evaluate the impact of each interaction separately. Finally, ten experimental setups are shown in Table 3, which were used to identify the best weight sets for the proposed approaches.
After defining the set of weights, it is possible to derive the W e i g h t e d I S u , w for each pair ( u , w ) V . Thus, for each user u, we can find a collection of accounts O = V \ { u } that retweeted before u and that interacted with u, such that k O W e i g h t e d I S u , k 0 . As mentioned before, the I S u , w value is found by dividing by the highest weighted IS value for u.

3.3. Users without Interactions and Sparse Nodes

As a complementary step, when there are no available interactions by a user u, and thus no IS values between u and any other user, we attempt to find a link from the u to another user in the cascade according to the state-of-the-art method based on social networks. More precisely, we collect the user’s friend list by using the Twitter API, and every user’s friend that has retweeted at an earlier point in time is considered as a potential influencer [6,16,34]. To identify the influencer that more likely spread the tweet to user u, we consider the most recent influencer, i.e., u is linked to the last friend that retweeted the message. In Figure 1 the friends list has been investigated to find the link from Lara to Jenny; in fact, Lara was a sparse node during the first analysis based on users’ interactions. Users that still remaining without an edge after this second step are denoted as sparse nodes (SN).

4. Alternative Approach: Information Strength-Based Network with Author’s Followers Evaluation (ISN-AF)

As a further version of the model based on the IS concept (ISN approach) we also propose a modified algorithm that first exploits the tweet’s author followers network. In fact, Twitter preferably shows original content, and thus if a user directly follows the tweet’s author, he/she will retweet the original tweet without seeing the retweets from intermediate nodes. To exploit this Twitter feature, the ISN-AF approach first explores if a retweeter belongs to the tweet’s author followers network: followers are linked directly to the root in the cascade graph. For remaining nodes, ISN-AF uses the same approach as in the ISN model, namely, IS analysis and friends network for sparse nodes. An example of the differences generated by ISN and ISN-AF models in retweet cascade graphs is proposed in Figure 1, where Luke is connected to John according to the ISN procedure, whereas he is linked to the tweet’s author Mark for the ISN-AF model (Luke belongs to Mark’s followers list). This algorithm version allows one to reduce the computation costs related to the IS step but, at the same time, requires additional information which is the tweet’s author followers list, which can be time consuming if the account has a lot of followers. Moreover, this ISN-AF version suffers from the limitation reported in Section 1 about the possible divergence in terms of followers relationship between the date in which the retweet has been done and the time when the followers list is fetched.

5. Evaluation Metrics for Retweet Cascade Validation

Evaluating the models ability in deriving the retweet cascade graph is not a trivial task. The absence of ground truth information prevents the use of standard evaluation metrics such as accuracy. Following [11] we evaluate the retweet information graph considering all the cascade forest, i.e., including the unconnected components, and computing the following metrics:
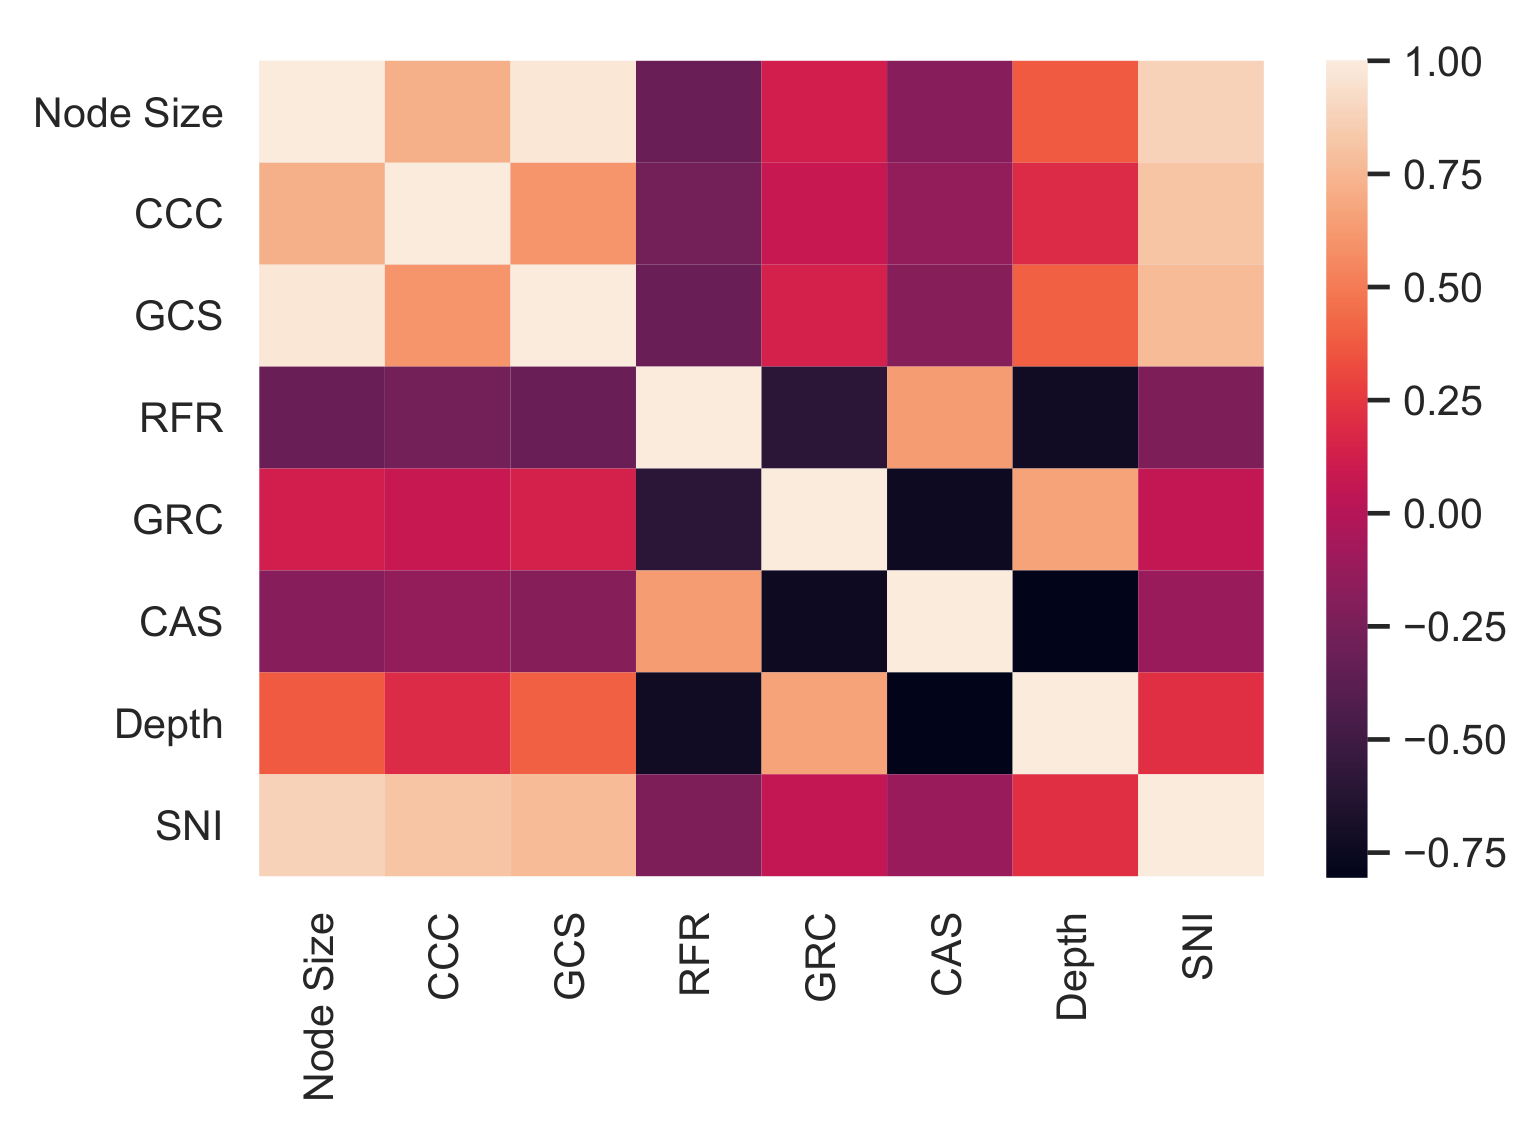
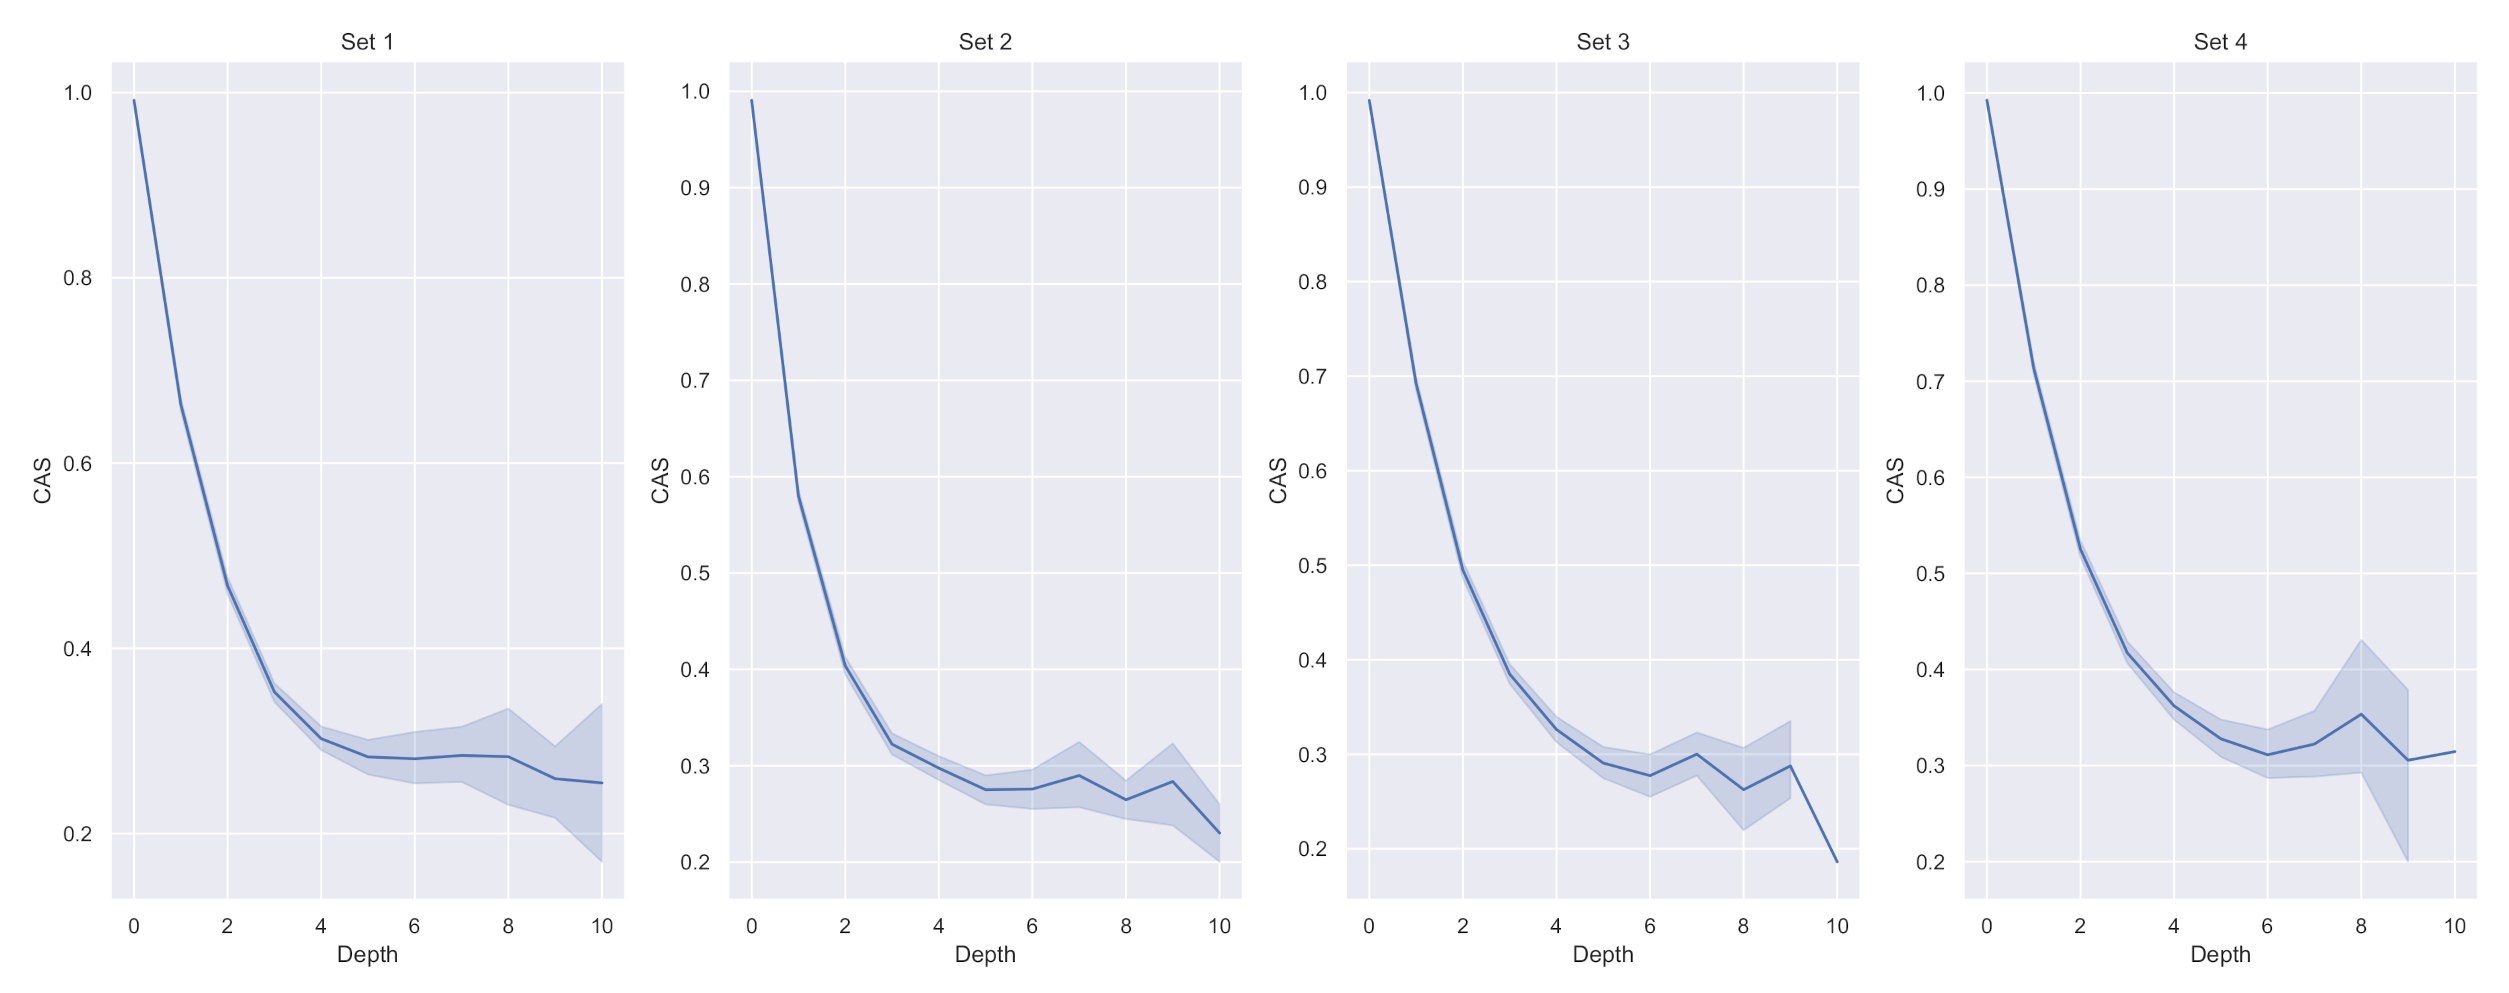
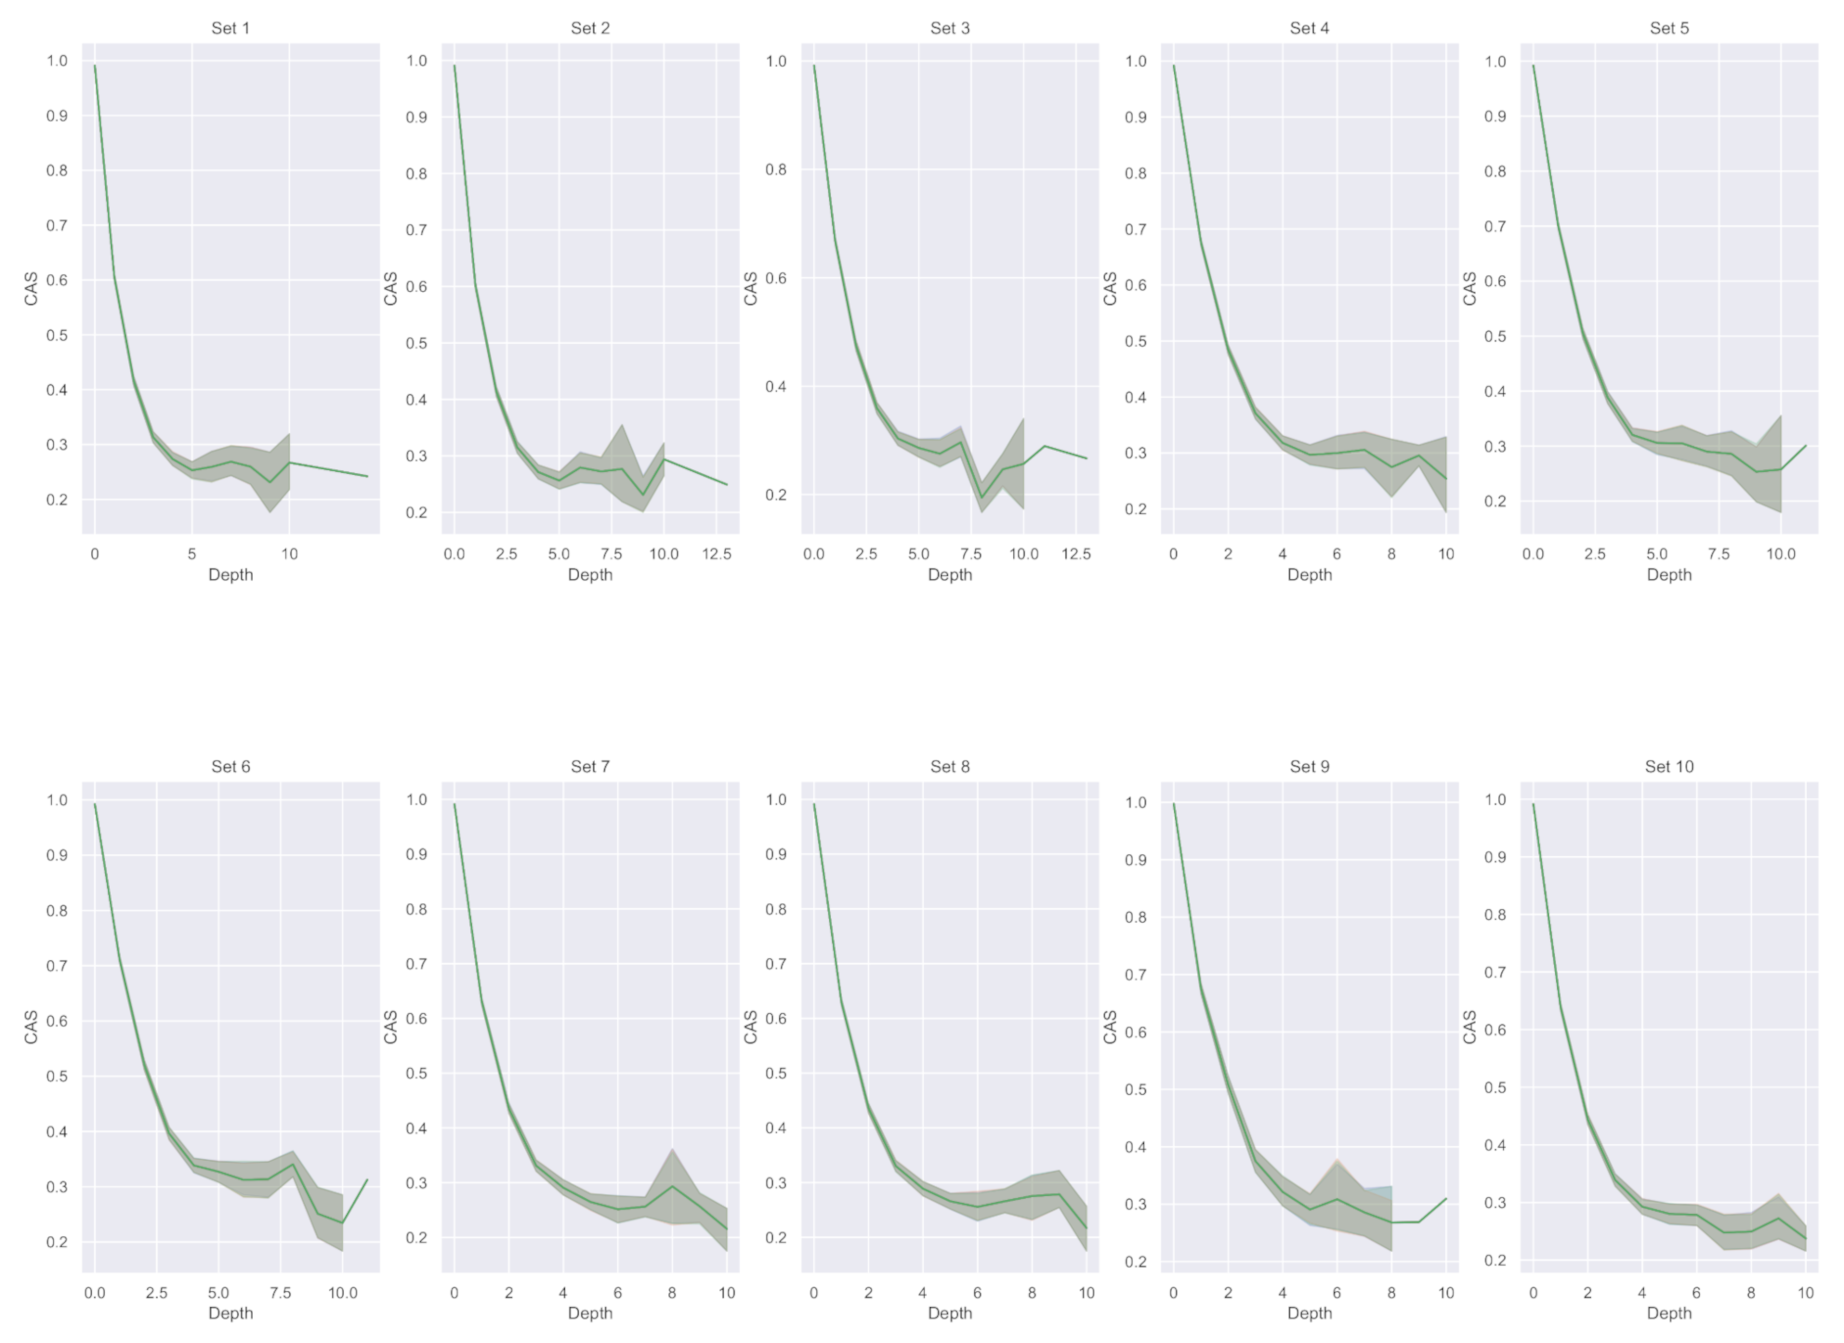
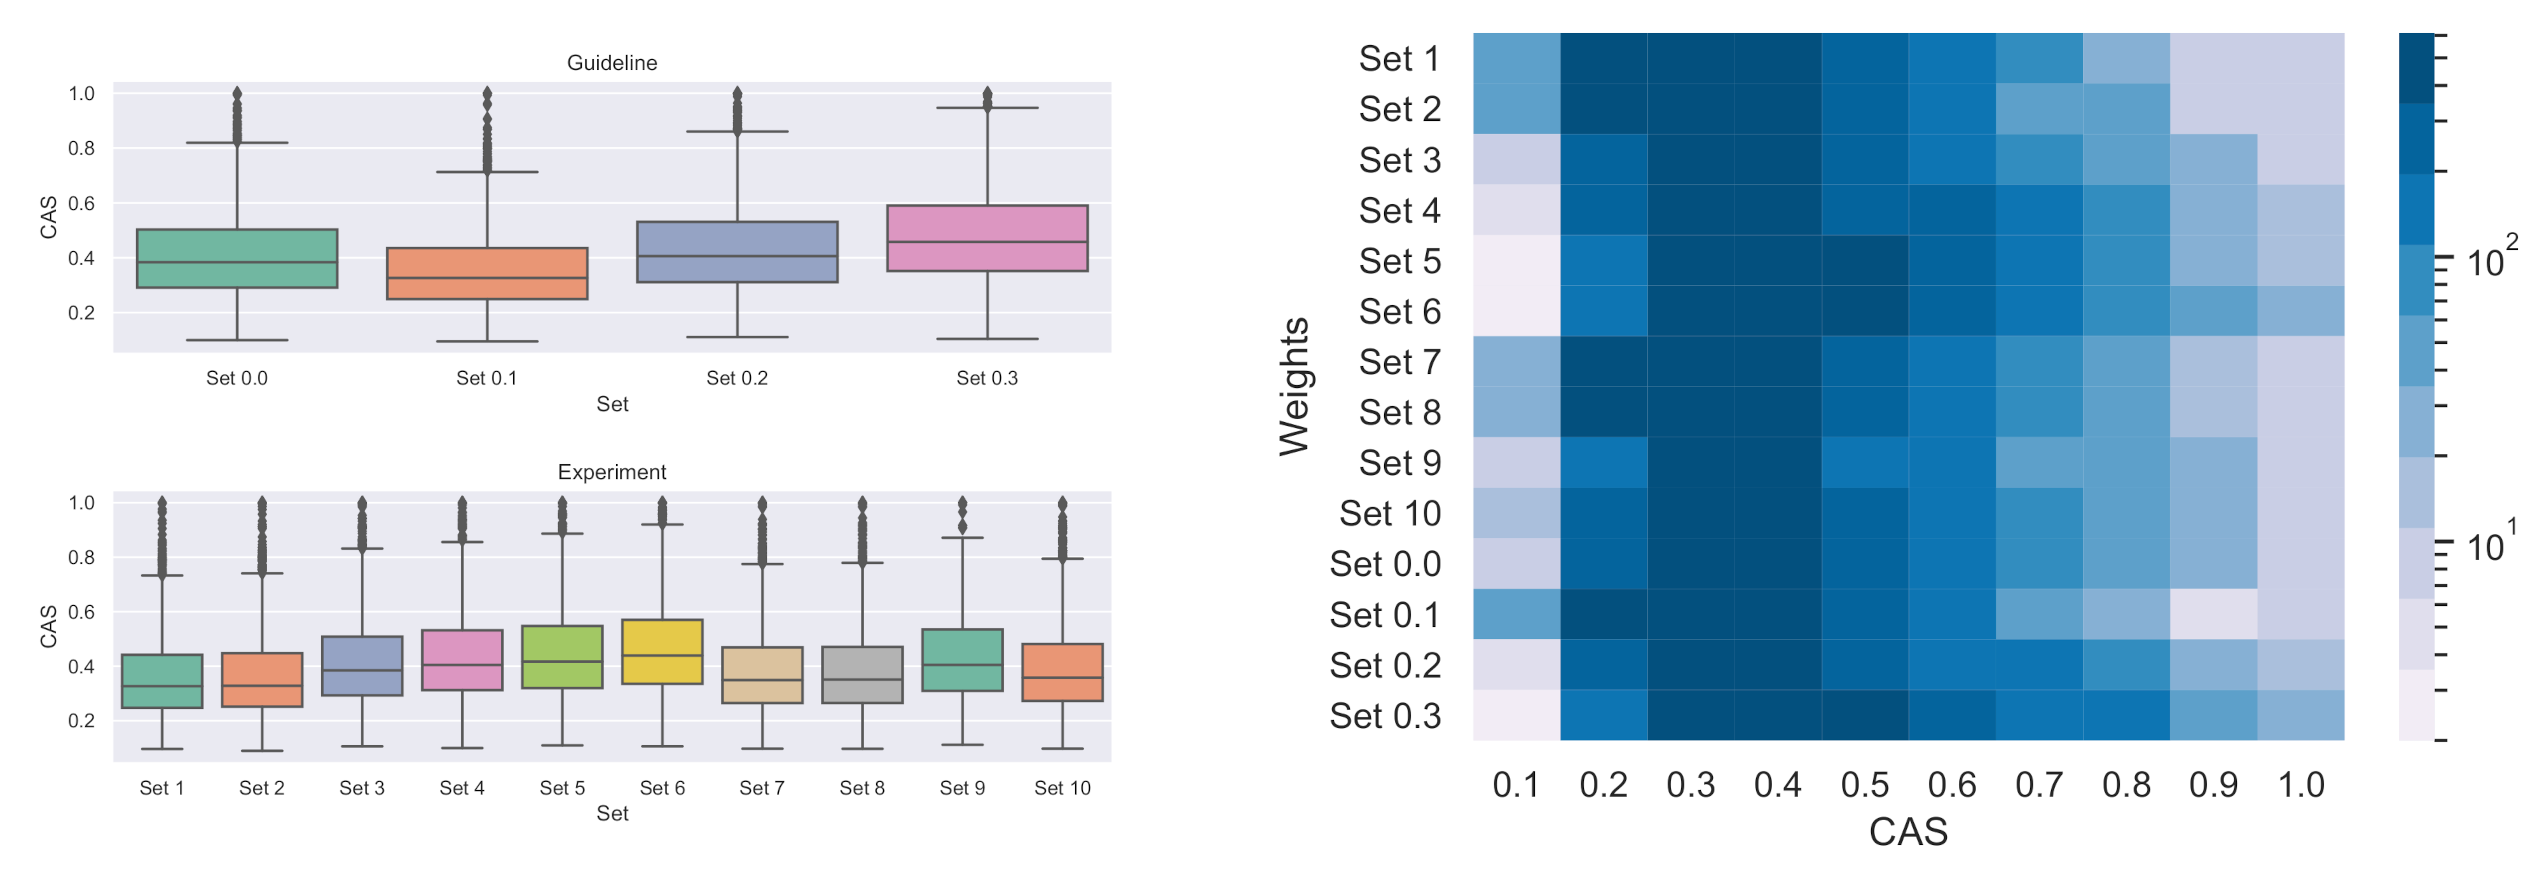
  • Cascade average strength (CAS): given the I S assigned to each edge ( u , y ) E we derive the CAS as the average of the maximum IS between each pair of edges in E such as:
    C A S = ( max ( I S u , y u , y E ) ) | E |
    The aim is to maximise CAS for each cascade graph.
  • Connected components count (CCC): returns the number of the connected components in the network. A connected component is a subgraph in which any two vertices v V are connected to each other by paths. This metric provide a description of the graph shape.
  • Root fan ratio (RFR): it assesses whether there is a path to the r o o t a u t h o r from every other user. In other words, it measures the percentage of nodes directly or indirectly connected to the root. In the ISN-AF model, the RFR asses the percentage of r o o t a u t h o r followers. A higher RFR reflects a very concentrated graph around the r o o t a u t h o r determining the typical star shape of the cascade graph [25].
  • Giant component size (GCS): the size, expressed in percentage of the cascade nodes, of the nodes present in the giant component (GC) which is the connected component with biggest size. The GCS is computed as follow:
    G C S = | u V u G C | | V |
    This metric provides a description of the graph shape in terms of node dispersion: The lower the GCS, the higher the dispersion of nodes in the graph, which can be sparse or connected. To further investigate the nodes’ dispersion we investigate the global reaching centrality and sparse node incidence.
  • Global reaching centrality (GRC): It is the average over all nodes of the difference between the node local reaching centrality and the greatest local reaching centrality of any node in the graph. The local reaching centrality, C R ( i ) , of node i is the proportion of all nodes in the graph that can be reached from node i via outgoing edges [35].
    G R C = i V ( C R m a x C R ( i ) ) | V | 1
  • Sparse node incidence (SNI): it measures the incidence (in percentage) of sparse nodes (i.e., nodes without links) with respect to the total number of nodes in the cascade. A lower SNI determines more connected and realistic retweet cascades.
Those metrics are computed in order to identify the best IS weights set among the proposed ones in Table 3. Moreover, the metrics are evaluated in order to compare the proposed ISN and ISN-AF methods with respect to the baseline approach proposed by [11].

6. Dataset

For the analysis, we collected a dataset of Tweets from the 1 January 2020 to the 31 March 2020 written in Italian and related to politics topic. The keyword used to fetch all the content was “politic*”, where the “*” metacharacter was used to include all the possible suffixes. The dataset was collected using the freely available Twitter streaming API service to catch all the retweets related to the original content. Table 4 reports a summary of dataset composition and, in order to reduce the computational costs, we conducted the experiments on a smaller sample of the data randomly chosen. The sample of tweets used to test the 14 weights set was composed by 16,304 tweets resulting in 228,256 cascades with more than 1.5 million nodes. In fact, even if the number of considered retweet cascades is smaller than in previous work, our IS-based models required all the user timelines, which can be up to 3200, resulting in a total of more than 130 million tweets to be processed to derive the AbsoluteIS and WeightedIS. The number of accounts involved in the analysis was 112,188, which corresponds to 41,592 unique accounts (i.e., not repeated entities).

7. Evaluation of IS Weights

We here report the results considering the IS weight sets investigated during the grid search procedure. The aim of this section is to evaluate the best setup in order to maximize the IS value and generate retweets cascades with high CAS. This step of the analysis is common for both ISN and ISN-AF models which will be evaluated in Section 8. Hence, this preliminary analysis was conducted without considering friend networks, in order to remove external factors in the weights evaluation.
Before investigating the properties of the proposed approach, we aimed to analyze the relations, in terms of correlation, among the considered metrics. Figure 3 shows that the CAS values, which represent the average cascade strength, are positively correlated with the RFR. In fact, the higher the concentration of nodes around the r o o t a u t h o r , the higher the IS between each node and the r o o t . Interestingly, there is a high negative correlation with the depth variable, which corresponds to the number of levels in the cascade tree. In fact, Figure 3 shows that the CAS is strongly negatively influenced by the depth, whereas the node count variable has a smaller incidence. It follows that even big cascades with few levels might achieve high CAS scores. At the same time, the higher the GRC, the smaller the CAS. Recalling that the GRC provides an average measure of all cascades’ nodes centrality, when the nodes in the cascade are central and might be reached by several paths, the strength of the cascade decreases since multiple edges exist among users, and thus the selected relations (maximum IS criterion) are weaker.

7.1. Experimental Results on the Entire Cascade Sample

Starting from the guideline sets’ results in Table 5, we got that the set 0.0 , which describes the proposed model when all the interactions have the same weight, reaches an average CAS of 87 % with 91 % of edges passing from the r o o t a u t h o r (RFR) and less than the 2 % of SNI. A growing SNI is visible for the guideline sets 0.1 , 0.3 and 0.2 , especially for the last two which are characterized by an average CAS of 84 % . Guideline set 0.1 is, in general, preferable to sets 0.2 and 0.3 in terms of CAS.
Concerning the analysis of the full sample of cascades computed, Table 6 reports the average metrics for each set of weights in the experimental setups. In general, all the proposed experiments reached a valuable CAS which was between 83 % and 87 % . The lowest CAS values (around 83 % ) were achieved by sets 1, 2 and 8, which were also characterized by a smaller retweet weight ( 0.0 and 0.1 respectively). In general, the proposed approach limits the incidence of sparse nodes (SNI), which is around 2 % , with an average cascade depth below 1. However, these results are computed on the entire sample of 16 , 304 tweets, thereby including cascades with few retweets that are characterized by a CAS value of one.
Figure 4 and Figure 5 plot on the x-axis the cascade depth, while on the y-axis there is the CAS achieved by each cascade for the guideline and experimental sets, respectively. Figure 4 and Figure 5 show the strong negative correlation between CAS and depth. The negative correlation is common among all the weights sets (both for guideline and experimental set), but it shows different behavior according to the incidence of retweets, quotes and replies. For instance, cascades with a higher retweet impact show a more linear decay without drops (sets { 0.0 , 5 } ), but a more interesting piece evidence is about quotes and replies effects. In fact, sets with identical retweet weight but with quote importance smaller than replies exhibit more variable dynamics with drops for deeper cascades (e.g., set 0.2 versus set 0.3 and set 3 versus set 4).
Table 7 reports the results of the analysis focused on deep cascades (cascades with more than six levels) in order to compare the impacts of quotes and replies in maximizing the CAS. It emerges that weight sets with higher quotes incidence are able to achieve higher CAS values (e.g., set 0.3 for group a or set 4 in group c), but, at the same time, when the relative difference between quote and reply weights is high, it also leads to a higher standard deviation. For example, for groups a and c, the difference between quotes and replies weights is high, generating higher average CAS for sets 0.3 and 4, but involving major variability in the results. It follows that, from Table 7, to limit the CAS decrease and ensure the absence of drops when the cascades are characterized by high numbers of levels, a solution is to overweight the quote interaction, limiting the relative difference with the reply interaction. In fact, Table 7 shows that the set able to minimize the standard deviation is the number 10, which also ensures a limited retweet weight (0.2) with respect to the quote and reply weights (0.5 and 0.3 respectively).

7.2. Experimental Results on Cascades with at Least Five Nodes

In terms of absolute CAS results, it is interesting to perform a more detailed analysis removing cascades with few nodes. Focusing on the graphs of the 90th percentile, which are cascades with more than five retweets, Table 8 reports the average of the computed metrics. The first four rows report the results for the weight sets of the guideline setups. Set 0.0 achieved an average CAS of 47 % , while cascades where the incidence of retweets was zero (set 0.1 ) achieved a CAS of 41 % , with a slightly increased SNI ( 16.96 % vs. 16.33 % for set 0.0 ). This suggests that quotes and replies have higher impacts on CAS with respect to retweets. In fact for the sets 0.2 and 0.3 , where the weights of quotes and replies were set to zero, the CAS value dropped to 38 % , with an increased incidence of sparse nodes and a reduction in terms of GCS. When observing the first six experimental setups, which used the same three weight values ( 0.0 , 0.3 , 0.6 ) assigned differently to the three interactions, the best CAS value was achieved by set number 4, where the priority was assigned to quotes, followed by retweets and replies. When observing the CAS distribution reported in the box plots in Figure 6a, it emerges that the highest median is related to set 6 followed by set 5. However, all the weights sets are characterized by similar distributions which tend to show positive asymmetry. In contrast, from the heatmap in Figure 6b, sets 5 and 6 are characterized by higher numbers of cascades, with CAS values above 0.5 . Nonetheless, due to the retweet bias, our choice is to prefer weight sets in which the impact of retweets is minimal with respect to the other two interactions.
Therefore, the ideal weight set should give less attention to retweets and importance to replies, and quotes should represent the interaction with higher priority. Among the remaining sets, 2 , 8 , 9 and 10, the maximum CAS was achieved by set 10 ( 44.7 % ). This set is also characterized by a smaller number of levels (2.38 levels on average), and a high percentage of edges passing thorough the r o o t a u t h o r (61%), similar to the guideline set 0.0 . Indeed, set 11 shows similarities to the guideline set 0.0 in terms of GCS, RFR and number of edges, but with a statistically significant difference in terms of CAS distribution, which is 2 p.p. (percentage points) lower than set 0.0 but respects the assumption of retweet bias.

8. ISN, ISN-AF and Baseline Comparisons

In this section we compute the retweet cascade graph for all the 16,304 tweets using the proposed ISN approach based on IS and, whenever the IS value is not available, on social network information. Moreover, we also report the results of the ISN-AF approach, where a preliminary check on r o o t a u t h o r followers is performed to generate the first level of the cascade graph. Results are then compared with a baseline model proposed by Taxidou et al. [11].
Table 9 reports the metrics for our two approaches and the baseline; the CAS value is only available for the IS and ISN-AF (the baseline model is not based on IS) achieving 85.29% and the 94.7% CAS, respectively. Hence, ISN-AF, which exploits the author’s followers list, outperforms ISN in terms of CAS. This is due to the probability equal to one assigned to edges connecting nodes to the r o o t a u t h o r , whenever the node is in the author’s followers list. Indeed, ISN-AF creates denser cascades around the root node, as indicate by the higher RFR and GRC values. However, as argued in Section 1, methods based on friends/followers lists have two major limitations: the computational time required to collect the information and, most importantly, the temporal gap between the date in which the retweet is collected and the date when the followers list is fetched. This latter limitation could introduce a form of bias in the cascade.
Comparing the proposed methods with respect to the baseline, a significant difference is apparent regarding the SNI: the two proposed models have an incidence of sparse nodes below 2%, whereas the baseline has an average SNI above 6%. This lower SNI could be linked to the ability of the proposed approach to overcome the limitations of the baseline, as discussed in Section 1 and Section 2. For instance, Twitter accounts might have a private network, which is not accessible, thus the baseline approach based has to classify these node as sparse, whereas the proposed approaches may still be able to find some interactions and find a link for these node in the graph. This ability of the proposed approaches is also confirmed by edge count, which is grater for ISN and ISN-AF with respect to the baseline approach. Moreover, the missing edges for the baseline involve a higher number of isolated connected components, which leads to higher CCC values. At the same time, the major incidence of sparse connected components reduces the giant component size, which is, in general, denoted by the r o o t a u t h o r component. In fact, the GCS value for the baseline is 4.99 % , while it reaches 6.65 % for ISN and 6.90 % for ISN-AF.
As a practical example, to highlight the difference between the baseline and the proposed approaches, we report four retweet cascade graphs with increasing node sizes. The cascade trees are implemented using Gephi version 0.9.2 and the node size represent the number of node’s descendent. In other words, the bigger the node, the higher is its importance for tweet propagation.
Figure 7 reports the comparison of the retweet graphs generated by the three approaches with a total number of 67 nodes. While the baseline graph is characterized by a deeper tree with some sparse nodes, the proposed models’ cascades (both ISN and ISN-AF) create a fully connected tree composed by only one level, since all the nodes are directly linked to the r o o t a u t h o r . Considering a bigger cascade, Figure 8 compares the three approaches when the retweet number is 106: this result visually explains the considerations about the higher number of isolated connected components created by the baseline algorithm. In fact, fromFigure 8c it is possible to observe the presence of numerous isolated connected components with nodes characterized by a valuable importance (node size) in terms of retweet propagation. It seems that the r o o t has a minimum impact on the message propagation, while the other nodes (the big green and the big blue nodes) casually found the tweet and spread it. In contrast, the cascades in Figure 8a,b propose a different retweet path, giving more importance to the r o o t and reducing also the number of single isolated nodes. In these two initial examples (Figure 7 and Figure 8) the proposed methods are showing similar or identical behavior, which are substantially different from the baseline.
The other two examples (Figure 9 and Figure 10) report cascades where ISN and ISN-AF produce different propagation paths. In this case, the retweet numbers are 1127 and 1180, respectively. For the baseline approach (Figure 9c and Figure 10c) the node sizes, describing the nodes influence in the graph, favor the r o o t . Conversely, the proposed ISN model shows propagation paths that highlight the importance of non-root nodes in retweet propagation. For instance, Figure 9a shows the presence of important nodes (the big green and blue ones) that helped the propagation. These nodes are also present in the ISN-AF model (Figure 9b), but with a minor impact.
A more visible difference between ISN and ISN-AF is apparent from Figure 10b. The number of nodes connected to the root according to the ISN-AF approach are 621, of which 538 links are derived by IS interactions and 21 by friend network analysis. Differently, Figure 10a reports the ISN-generated graph, which has 1146 nodes linked by timeline information, and is thus connected, adopting the IS metric. However, the two graphs clearly diverge, as for the ISN model, a central role is covered by non-root accounts (big gray dots) that infected specific communities (the orange, blue and green components), whereas the ISN-AF cascade is dominated by the central role of the r o o t , similarly to the baseline graph (Figure 10c). However, in terms of IS metric the result is close, as the average CAS related to the 1146 edges derived by the ISN model is equal to 38.94%, while for the 538 edges related to the ISN-AF approach the CAS is 39.99%.

Research Implications

As shown in the comparison figures (Figure 7, Figure 8, Figure 9, Figure 10), the proposed models give completely different reconstructions of retweet cascades with respect to the traditional method described in [11]. The difference mainly lies in the way in which the edges are derived. In fact, previous work mainly focused on user social networks, whereas we adopted a user social interactions approach combined with r o o t a u t h o r information, and as a residual step, retweeters’ friendship networks. Moreover, the proposed algorithms are able to assign to each cascade graph a metric (CAS) that is indicative of the strength of the solution found. The proposed approach is able to link a higher number of nodes, thereby creating denser graphs. Derived cascades diverge not only in their outline, but also in terms of evaluation metrics, especially for the SNI value. When the number of nodes involved in the cascade is relatively small, the priority is given to the root, which assumes a more relevant role (Figure 7). In contrast, when the number of nodes is higher, the proposed approach highlights specific nodes that shared the information across different communities (Figure 10). For instance, Figure 10c shows important differences with respect to the traditional approach, which was centered on the tweet’s root author. Differently, Figure 9a,b shows the presence of important nodes that were involved in the cascade and that spread the information within communities, and nodes that were able to spread the tweet across different communities. Thus, this information can represent a starting point for different future applications, such as social bot community detection [36].

9. Conclusions

In this paper we have proposed two novel approaches to derive retweet cascade graphs, both based on the concept of interaction strength (IS). The obtained information graphs can be useful for further analysis like the detection of influencer nodes and communities. Differently from state-of-the-art approaches that are mainly based on users’ social networks, the IS metric aims to enable a realistic estimation of Twitter information propagation considering the trust relationships among users, and giving more importance to frequent and strong interactions instead of considering the simple following relation. The two proposed approaches are the interaction strength-based network (ISN) and the interaction strength-based network with author’s followers evaluation (ISN-AF). The ISN approach consists of two steps: the first phase aims to discover interactions among nodes involved in the retweet cascade, identifying links able to maximize the cascade average strength (CAS); then, for the remaining nodes the state-of-the-art approach based on nodes’ social network is adopted. The ISN-AF approach also has a preliminary analysis of r o o t a u t h o r followers, which are used to generate the first level fo the cascade graph. This leads to an even more realistic graph, but also has some limitations.
The analysis and, in particular, the comparison with the baseline method show the differences between the proposed approaches, and their ability to highlight node importance in the retweet information propagation path. Notably, ISN and ISN-AF are able to reduce the impact of sparse nodes, diminishing the isolated connected components, and thus giving a more complete view of the retweet propagation phenomena. Hence, the study of the different propagation paths derived by ISN and ISN-AF (Figure 10) can offer a starting point for different future application such as social bot detection, inauthentic coordinated behaviors, etc. [36]. Moreover, differently from existing literature models, the proposed ISN and ISN-AF cascades can be evaluated through the CAS value, which gives to the analyst a proxy of the goodness of the obtained graph.
Notwithstanding the high number of experiments conducted, the absence of a ground truth is a limitation of the proposed evaluation. Additionally, further analysis may be performed in order to optimize the interaction weights starting from the findings achieved in this paper. Other aspects that we intend to explore in future work are the tweet contents and the sentiments included in quotes and replies. Moreover, given the obtained weighted retweet cascade graph, an interesting future application may consider community detection and reinforce the derived cascades based on modularity measure.
In conclusion, we believe that the proposed approaches represent a promising alternative solution to the problem of Twitter retweet cascade graph constructions, as they highlight nodes’ importance in information flows and overcome some of the limitations of the models based only on social network information.

Author Contributions

Conceptualization, P.Z., G.C.; methodology, P.Z.; software, P.Z.; validation, P.Z., G.C. and M.M.; formal analysis, P.Z.; investigation, P.Z.; resources, P.Z.; data curation, P.Z.; writing–original draft preparation, P.Z.; writing–review and editing, P.Z., G.C., M.M.; visualization, P.Z.; supervision, M.T.; project administration, M.T.; funding acquisition, M.T. All authors have read and agreed to the published version of the manuscript.

Funding

This work was partially supported by the scheme ‘INFRAIA-01-2018-2019: Research and Innovation action’, Grant Agreement n. 871042 ’SoBigData++: European Integrated Infrastructure for Social Mining and Big Data Analytics.

Acknowledgments

We want to thank the anonymous reviewers for their useful comments and suggestions.

Conflicts of Interest

The authors declare no conflict of interest.

References

  1. Avvenuti, M.; Cresci, S.; Marchetti, A.; Meletti, C.; Tesconi, M. Predictability or early warning: Using social media in modern emergency response. IEEE Internet Comput. 2016, 20, 4–6. [Google Scholar] [CrossRef]
  2. Zola, P.; Ragno, C.; Cortez, P. A Google Trends spatial clustering approach for a worldwide Twitter user geolocation. Inf. Process. Manag. 2020, 57, 102312. [Google Scholar] [CrossRef]
  3. Attia, A.M.; Aziz, N.; Friedman, B.; Elhusseiny, M.F. Commentary: The impact of social networking tools on political change in Egypt’s “Revolution 2.0”. Electron. Commer. Res. Appl. 2011, 10, 369–374. [Google Scholar] [CrossRef]
  4. Zola, P.; Cortez, P.; Brentari, E. Twitter alloy steel disambiguation and user relevance via one-class and two-class news titles classifiers. Neural Comput. Appl. 2020. [Google Scholar] [CrossRef]
  5. Myers, S.A.; Sharma, A.; Gupta, P.; Lin, J.J. Information network or social network? The structure of the twitter follow graph. In Proceedings of the 23rd International World Wide Web Conference, WWW ’14, Seoul, Korea, 7–11 April 2014; Companion Volume. ACM: New York, NY, USA, 2014; pp. 493–498. [Google Scholar] [CrossRef]
  6. Kwak, H.; Lee, C.; Park, H.; Moon, S.B. What is Twitter, a social network or a news media? In Proceedings of the 19th International Conference on World Wide Web, WWW 2010, Raleigh, NC, USA, 26–30 April 2010; ACM: New York, NY, USA, 2010; pp. 591–600. [Google Scholar] [CrossRef] [Green Version]
  7. Comarela, G.; Crovella, M.; Almeida, V.A.F.; Benevenuto, F. Understanding factors that affect response rates in Twitter. In Proceedings of the 23rd ACM Conference on Hypertext and Social Media, HT ’12, Milwaukee, WI, USA, 25–28 June 2012; ACM: New York, NY, USA, 2012; pp. 123–132. [Google Scholar] [CrossRef] [Green Version]
  8. Xiang, R.; Neville, J.; Rogati, M. Modeling relationship strength in online social networks. In Proceedings of the 19th international conference on World wide web 2010, Raleigh, NC, USA, 26–30 April 2010; pp. 981–990. [Google Scholar]
  9. Hoang, D.T.; Tran, V.C.; Hwang, D. Social network-based event recommendation. In Proceedings of the International Conference on Computational Collective Intelligence, Nicosia, Cyprus, 27–29 September 2017; Springer: Berlin/Heidelberg, Germany, 2017; pp. 182–191. [Google Scholar]
  10. Guo, D.; Xu, J.; Zhang, J.; Xu, M.; Cui, Y.; He, X. User relationship strength modeling for friend recommendation on Instagram. Neurocomputing 2017, 239, 9–18. [Google Scholar] [CrossRef]
  11. Taxidou, I.; Fischer, P.M. Online analysis of information diffusion in Twitter. In Proceedings of the 23rd International World Wide Web Conference, WWW ’14, Seoul, Korea, 7–11 April 2014; Companion Volume. ACM: New York, NY, USA, 2014; pp. 1313–1318. [Google Scholar] [CrossRef] [Green Version]
  12. Szabó, G.; Huberman, B.A. Predicting the popularity of online content. Commun. ACM 2010, 53, 80–88. [Google Scholar] [CrossRef]
  13. Yang, J.; Counts, S. Predicting the Speed, Scale, and Range of Information Diffusion in Twitter. editor = William W. Cohen and Samuel Gosling, publisher = The AAAI Press, year = 2010, url = http://www.aaai.org/ocs/index.php/ICWSM/ICWSM10/paper/view/1468, timestamp =Wed, 01 Sep 2010 13:23:29 +0200, biburl = https://dblp.org/rec/conf/icwsm/YangC10a.bib, bibsource = dblp computer science bibliography, https://dblp.org. In Proceedings of the Fourth International Conference on Weblogs and Social Media, ICWSM 2010, Washington, DC, USA, 23–26 May 2010. [Google Scholar]
  14. Cogan, P.; Andrews, M.; Bradonjic, M.; Kennedy, W.S.; Sala, A.; Tucci, G. Reconstruction and analysis of twitter conversation graphs. In Proceedings of the First ACM International Workshop on Hot Topics on Interdisciplinary Social Networks Research, Beijing, China, 12–16 August 2012; pp. 25–31. [Google Scholar]
  15. Yang, C.; Harkreader, R.C.; Zhang, J.; Shin, S.; Gu, G. Analyzing spammers’ social networks for fun and profit: A case study of cyber criminal ecosystem on Twitter. In Proceedings of the 21st World Wide Web Conference 2012, WWW 2012, Lyon, France, 16–20 April 2012; ACM: New York, NY, USA, 2012; pp. 71–80. [Google Scholar] [CrossRef]
  16. Cazabet, R.; Pervin, N.; Toriumi, F.; Takeda, H. Information Diffusion on Twitter: Everyone Has Its Chance, However, All Chances Are Not Equal. In Proceedings of the Ninth International Conference on Signal-Image Technology & Internet-Based Systems, SITIS 2013, Kyoto, Japan, 2–5 December 2013; IEEE Computer Society: Washington, DC, USA, 2013; pp. 483–490. [Google Scholar] [CrossRef]
  17. Zaman, T.; Fox, E.B.; Bradlow, E.T. A Bayesian Approach for Predicting the Popularity of Tweets. Ann. Appl. Stat. 2014, 8, 1583–1611. [Google Scholar] [CrossRef]
  18. Pramanik, S.; Saha, A.; Mukherjee, P.; Patni, A.; Dan, S.; Mitra, B. Modelling Retweet Dynamics Using Hawkes Process—A Temporal Approach. 2015. Available online: http://aseempatni.com/docs/retweet.pdf (accessed on 13 October 2020).
  19. Yu, L.; Cui, P.; Wang, F.; Song, C.; Yang, S. From Micro to Macro: Uncovering and Predicting Information Cascading Process with Behavioral Dynamics. In Proceedings of the 2015 IEEE International Conference on Data Mining, ICDM 2015, Atlantic City, NJ, USA, 14–17 November 2015; IEEE Computer Society: Washington, DC, USA, 2015; pp. 559–568. [Google Scholar] [CrossRef] [Green Version]
  20. Zhao, Q.; Erdogdu, M.A.; He, H.Y.; Rajaraman, A.; Leskovec, J. SEISMIC: A Self-Exciting Point Process Model for Predicting Tweet Popularity. In Proceedings of the 21th ACM SIGKDD International Conference on Knowledge Discovery and Data Mining, Sydney, NSW, Australia, 10–13 August 2015; ACM: New York, NY, USA, 2015; pp. 1513–1522. [Google Scholar] [CrossRef] [Green Version]
  21. Gao, J.; Shen, H.; Liu, S.; Cheng, X. Modeling and Predicting Retweeting Dynamics via a Mixture Process. In Proceedings of the 25th International Conference on World Wide Web, WWW 2016, Montreal, QC, Canada, 11–15 April 2016; Companion Volume. ACM: New York, NY, USA, 2016; pp. 33–34. [Google Scholar] [CrossRef] [Green Version]
  22. Kobayashi, R.; Lambiotte, R. TiDeH: Time-Dependent Hawkes Process for Predicting Retweet Dynamics. In Proceedings of the Tenth International Conference on Web and Social Media, Cologne, Germany, 17–20 May 2016; AAAI Press: Palo Alto, CA, USA, 2016; pp. 191–200. [Google Scholar]
  23. Rodrigues, T.; Cunha, T.D.S.; Ienco, D.; Poncelet, P.; Soares, C. RetweetPatterns: Detection of Spatio-Temporal Patterns of Retweets. In New Advances in Information Systems and Technologies; Springer: Berlin/Heidelberg, Germany, 2016; pp. 879–888. [Google Scholar] [CrossRef] [Green Version]
  24. Cao, Q.; Shen, H.; Cen, K.; Ouyang, W.; Cheng, X. DeepHawkes: Bridging the Gap between Prediction and Understanding of Information Cascades. In Proceedings of the 2017 ACM on Conference on Information and Knowledge Management, CIKM 2017, Singapore, 6–10 November 2017; ACM: New York, NY, USA, 2017; pp. 1149–1158. [Google Scholar] [CrossRef]
  25. Zhou, Y.; Zhang, B.; Sun, X.; Zheng, Q.; Liu, T. Analyzing and modeling dynamics of information diffusion in microblogging social network. J. Netw. Comput. Appl. 2017, 86, 92–102. [Google Scholar] [CrossRef]
  26. Stai, E.; Milaiou, E.; Karyotis, V.; Papavassiliou, S. Temporal Dynamics of Information Diffusion in Twitter: Modeling and Experimentation. IEEE Trans. Comput. Social Syst. 2018, 5, 256–264. [Google Scholar] [CrossRef]
  27. Bhowmick, A.K.; Gueuning, M.; Delvenne, J.; Lambiotte, R.; Mitra, B. Temporal Sequence of Retweets Help to Detect Influential Nodes in Social Networks. IEEE Trans. Comput. Social Syst. 2019, 6, 441–455. [Google Scholar] [CrossRef]
  28. Chen, G.; Kong, Q.; Xu, N.; Mao, W. NPP: A neural popularity prediction model for social media content. Neurocomputing 2019, 333, 221–230. [Google Scholar] [CrossRef]
  29. Liu, Y.; Bao, Z.; Zhang, Z.; Tang, D.; Xiong, F. Information cascades prediction with attention neural network. Hum. Centric Comput. Inf. Sci. 2020, 10, 1–16. [Google Scholar] [CrossRef]
  30. Kong, Q.; Rizoiu, M.A.; Xie, L. Modeling Information Cascades with Self-exciting Processes via Generalized Epidemic Models. In Proceedings of the 13th International Conference on Web Search and Data Mining, Houston, TX, USA, 3–7 February 2020; pp. 286–294. [Google Scholar]
  31. Wu, B.; Cheng, W.; Zhang, Y.; Cao, J.; Li, J.; Mei, T. Unlocking Author Power: On the Exploitation of Auxiliary Author-Retweeter Relations for Predicting Key Retweeters. IEEE Trans. Knowl. Data Eng. 2020, 32, 547–559. [Google Scholar] [CrossRef]
  32. Arnaboldi, V.; Gala, M.L.; Passarella, A.; Conti, M. Information diffusion in distributed OSN: The impact of trusted relationships. Peer Peer Netw. Appl. 2016, 9, 1195–1208. [Google Scholar] [CrossRef]
  33. Arnaboldi, V.; Passarella, A.; Tesconi, M.; Gazzè, D. Towards a Characterization of Egocentric Networks in Online Social Networks. On the Move to Meaningful Internet Systems: OTM 2011 Workshops—Confederated International Workshops and Posters: EI2N+NSF ICE, ICSP+INBAST, ISDE, ORM, OTMA, SWWS+MONET+SeDeS, and VADER 2011, Hersonissos, Crete, Greece, October 17–21, 2011. Proceedings. Springer, 2011, Vol. 7046. Lect. Notes Comput. Sci. 2011, 7046, 524–533. [Google Scholar] [CrossRef]
  34. Nies, T.D.; Taxidou, I.; Dimou, A.; Verborgh, R.; Fischer, P.M.; Mannens, E.; de Walle, R.V. Towards Multi-level Provenance Reconstruction of Information Diffusion on Social Media. In Proceedings of the 24th ACM International Conference on Information and Knowledge Management, CIKM 2015, Melbourne, VIC, Australia, 19–23 October 2015; ACM: New York, NY, USA, 2015; pp. 1823–1826. [Google Scholar] [CrossRef] [Green Version]
  35. Mones, E.; Vicsek, L.; Vicsek, T. Hierarchy measure for complex networks. PLoS ONE 2012, 7, e33799. [Google Scholar] [CrossRef] [PubMed]
  36. Mazza, M.; Cresci, S.; Avvenuti, M.; Quattrociocchi, W.; Tesconi, M. RTbust: Exploiting Temporal Patterns for Botnet Detection on Twitter. In Proceedings of the 11th ACM Conference on Web Science, WebSci 2019, Boston, MA, USA, 30 June–3 July 2019; ACM: New York, NY, USA, 2019; pp. 183–192. [Google Scholar] [CrossRef] [Green Version]
Figure 1. Toy example of the proposed approach.
Applsci 10 08394 g001
Figure 2. Number of retweets received after the original tweet’s creation date.
Applsci 10 08394 g002
Figure 3. Correlation matrix among the cascades’ evaluation metrics.
Applsci 10 08394 g003
Figure 4. Cascade average strength (CAS) and cascade depth for guideline sets.
Applsci 10 08394 g004
Figure 5. CAS and cascade depth for experimental sets.
Applsci 10 08394 g005
Figure 6. CAS on the set of tweets with at least five retweets.
Applsci 10 08394 g006
Figure 7. Retweet cascade graph comparison # 1 .
Applsci 10 08394 g007
Figure 8. Retweet cascade graph comparison # 2 .
Applsci 10 08394 g008
Figure 9. Retweet cascade graph comparison # 3 .
Applsci 10 08394 g009
Figure 10. Retweet cascade graph comparison # 4 .
Applsci 10 08394 g010
Table 1. Summary of related works.
StudyTarget aDataset bDataset c
Size
Dataset
Collection
Date
Topic
Features
Text
Features
Time
Variable
Users
Features
Users
Interactions
Social
Network
Location
Features
Users
Behaviour
Model d
Szabo et al. [12]REPYT, DYT: 7K, D: 850K U2007–2008--X-- LR
Yang et al. [13]TIC-REPTW--XXX----XF+EM
Cogan [14]TICTW33K T2012-----X--RCM
Comarela et al. [7]RBTW54M U2006–2009-XXX---XSVM, NB
Yang et al. [15]RBTW22M T2009X-X-----CHR
Remy et al. [16]TICTW362M T2011-----X--PL
Zaman et al. [17]TIC-REPTW52---XX----HB
Taxidou et al. [11]TICTW11M T2012--X--X--
Pramanik et al. [18]TICTW55K-X-X--X--H
Yu et al. [19]TIC-REPTWB320M U2011--XX---XNEWER
Zhao et al. [20]REPTW3.2B2011--XX----SEISMIC
Gao et al. [21]TIC-REPSW164---X-----RPP
Kobashy et al. [22]TIC-REPTW166K2011--XX-X--TiDeH
Rodrigues et al. [23]TICTW17K2013-XX--XX-GetMove
Cao et al. [24]REPSW, PC50K T, 35K P2016--X-X---DH
Zhou et al. [25]TIC-RBSW69.4M2013–2014X-XX-X-XBN
Stai et al. [26] TW35K2014–2016X-X- EpiM
Bhowmick et al. [27]TIC-KRTW8M T2015–2018--X--X--SmartInf
Chen et al. [28]REPTW20K2016-XX-----NPP
Liu et al. [29]TICTW, AM30K TW, 35K AM2016, 1996–2000--X-----ANN
Kong et al. [30]TICTW210 K---X--X--EP+H
Wu et al. [31]KR-TICSW50K M---XXX-X RL2R
in this workTICTW16K T2020--XXXX--W-RCM
a Target —key retwetters (KR), tweet information cascade (TIC), retweeting behavior (RB), retweet engagement prediction (REP). b Dataset—AMiner (AM), Digg (D), paper’s citations (PC), Sina—Weibo (SW), Twitter (TW), Tencent—Weibo (TWB), YouTube (YT). c Dataset size—thousand (K), messages (M), papers (P), tweets (T), users (U), YouTube videos (YT). d Model—attention neural networks (ANN), linear regression (LR), features (F), expectation maximization (EM), epidemic models (EP), support vector machines (SVM), naive Bayes (NB), relation base learning to rank (RL2R), retweet cascade modeling (RCM), Cox proportional hazard regression (CHR), power law (PL), neural popularity prediction (NPP), DeepHawakes (DH), SmartInfluencer (SmartInf), Hawkes process (H), epidemic model (EpiM), reinforcement Poisson process (RPP), networked Weibull regression (NEWER), hierarchical Bayesian approach (HB), 7 Metrics (7M), self exciting point process (SEISMIC), Bayesian networks (BN).
Table 2. Weight sets—guideline setups.
Set nrRetweet WeightQuote WeightReply Weight
0.01.01.01.0
0.11.00.00.0
0.20.01.00.0
0.30.00.01.0
Table 3. Weight sets—experimental setups.
Set nrRetweet WeightQuote WeightReply Weight
10.00.30.6
20.00.60.3
30.30.00.6
40.30.60.0
50.60.00.3
60.60.30.0
70.10.40.5
80.10.50.4
90.20.30.5
100.20.50.3
Table 4. Dataset description.
Full DatasetSampled Dataset
Tweets Count506,14716,304
Unique Users Count102,46841,592
Retweets Count683,189112,188
Table 5. Average metrics for setting up guidelines.
ClassSetEdge CountCCCGCS (%)RFR (%)GRC (%)CAS (%)DepthSNI (%)
Guideline0.05.881.086.2593.816.1987.06 , 0.531.98
Guideline0.15.881.086.2993.756.1885.39 , , 0.532.05
Guideline0.25.891.086.2793.686.1584.33 0.532.13
Guideline0.35.891.086.2993.686.1584.32 , 0.532.11
, , , —Statistically significant (p-value < 0.05 ) under a pairwise comparison when compared with the guideline sets: 0.0 ( ), 0.1 ( ), 0.2 ( ), 0.3 ( ).
Table 6. Average metrics for each weight set in the experimental setups, computed on the whole dataset.
SetEdge CountCCCGCS (%)RFR (%)GRC (%)CAS (%)DepthSNI (%)
15.881.086.2793.616.1283.53 , , 0.532.04
25.891.086.2593.596.1282.93 , , 0.532.01
35.891.086.2993.776.1786.32 , 0.532.08
45.891.086.2593.816.1987.23 , 0.521.98
55.801.086.2093.776.0684.63 , 0.522.03
65.801.086.2093.746.0684.21 , 0.522.04
75.801.086.2293.786.0784.80 , , , 0.522.11
85.881.086.2893.626.1583.45 , , , 0.531.98
95.881.086.2995.732695.7683.67 , , 0.541.98
105.881.086.3193.796.1886.63 , , 0.532.00
, , , —Statistically significant (p-value < 0.05 ) under a pairwise comparison when compared with the guideline sets: 0.0 ( ), 0.1 ( ), 0.2 ( ), 0.3 ( ) reported in Table 5.
Table 7. Cascade average strength (CAS) comparisons for deep cascades (best values in bold).
GroupWeightCAS
SetQuotesRepliesMeanSt Dev
a0.21.00.00.280.06
0.30.01.00.32 *0.08 *
b10.30.60.260.07
20.60.30.270.07
c30.00.60.280.07
40.60.00.30 *0.08
d50.00.30.290.07
60.30.10.310.08
e70.40.50.260.06
80.50.40.260.06
f90.30.50.280.09
100.50.30.260.05
g01.01.00.280.07
0.10.00.00.280.06
*—Statistically significant (p-value < 0.05 ) under a pairwise comparison when compared with the set within the group.
Table 8. Average metrics for all the setups (guideline and experimental), computed on the cascades with more than five nodes.
SetEdge CountCCCGCS (%)RFR (%)GRC (%)CAS (%)DepthSNI (%)
0.046.171.5441.9660.7632.8446.77 , , 2.3716.33
0.146.171.5642.3160.2932.7141.45 , , 2.3716.96
0.246.211.5642.0959.7832.5438.34 , , 2.4017.56
0.346.211.5542.2859.8032.5838.46 , , 2.4017.43
ine 146.171.5542.1359.3732.3536.09 , , 2.4316.81
246.211.5241.9259.4332.2735.90 , , 2.4316.54
346.211.5542.2860.5132.6543.65 , , 2.3917.14
446.211.5241.9560.7032.8248.31 , , , 2.3616.33
546.151.5642.1659.7532.5638.80 , , , 2.3916.96
646.151.5642.0959.5832.5437.71 , , , 2.3917.08
746.151.5642.3159.8332.5839.34 , , , 2.3917.64
846.171.5542.2059.4832.5336.39 , , , 2.4116.35
946.171.5542.1255.3631.1245.43 , , , 2.3716.43
1046.171.5542.4660.6332.7344.74 , , , 2.3816.47
, , , —Statistically significant (p-value < 0.05 ) under a pairwise comparison when compared with the guideline sets: 0.0 ( ), 0.1 ( ), 0.2 ( ), 0.3 ( ).
Table 9. Comparison between the two proposed approaches (with the best weight set) and the baseline approach.
Edge
Count
DepthCCCGCS (%)RFR (%)GRC (%)CAS (%)SNI (%)
ISN (weight set 10)6.090.561.266.6591.136.6085.292.31
ISN-AF (weight set 10)6.090.511.156.9094.227.2394.702.89
Baseline5.490.372.254.9992.236.32-6.66
Publisher’s Note: MDPI stays neutral with regard to jurisdictional claims in published maps and institutional affiliations.

