Article

Seismic Analysis of a Large LNG Tank Considering Different Site Conditions

1
State Laboratory of Coastal and Offshore Engineering, Dalian University of Technology, Dalian 116023, China
2
Department of Civil and Mineral Engineering, University of Toronto, Toronto, ON M5S 1A4, Canada
3
School of Civil Engineering, Shenyang Jianzhu University, Shenyang 110168, China
*
Author to whom correspondence should be addressed.
Appl. Sci. 2020, 10(22), 8121; https://doi.org/10.3390/app10228121
Submission received: 21 October 2020 / Revised: 6 November 2020 / Accepted: 11 November 2020 / Published: 16 November 2020

Abstract

:
Seismic resilience of critical infrastructure, such as liquefied natural gas (LNG) storage tanks, is essential to the safety and economic well-being of the general public. This paper studies the effect of different ground motions on large LNG storage tanks under four different site conditions. Key parameters of structural design and dynamic analysis, including von Mises stress of outer and inner tanks, tip displacement, and base shear, are analyzed to directly evaluate the safety performance of the large LNG tanks. Because the size of an LNG tank is too large to perform any experiments on a physical prototype, Smoothed Particle Hydrodynamics-Finite Element Method (SPH-FEM) simulation is used as a feasible and efficient method to predict its seismic response. First, the accuracy of the SPH-FEM method is verified by comparing sloshing frequencies obtained from theoretical formulation to experimental results and SPH-FEM models. Then, the seismic response of a real-life 160,000 m3 LNG prestressed storage tank is evaluated with different liquid depths under four site classes. Simulation results show that the tip displacements of the LNG tank at liquid levels of 25% and 50% under site class IV are nearly identical to that of 75% and 100% under site class II. In addition, the maximum von Mises stress of the inner tanks exceeds 500 MPa in all four site classes and jeopardizes the structural integrity of large LNG tanks. As a result, optimization of structural design and the establishment of an early warning system are imperative to the safety of LNG tanks at high liquid levels.

1. Introduction

LNG (liquefied natural gas) is a highly efficient energy source that has seen substantial market growth over the past few years due to an increasing shortage in oil resources. With a stronger demand for natural gas, LNG tanks have become a major component of urban infrastructure. In China alone, 69 large LNG tanks have been built, with an increase in capacity from 30,000 m3 to 160,000 m3. An additional 220,000 m3 of large storage tanks are under construction. Due to largely varying geological conditions within the Chinese territory, the types of construction sites where these LNG storage tanks are located also vary. Site classification is an important parameter for large LNG tank construction, because LNG tanks exhibit different seismic characteristics at different sites. Previously, many people have studied the effect of site conditions on high-rise buildings and bridges, but no one has investigated the dynamic analysis of large LNG tanks under different site conditions. This paper studies the effect of ground motion on large LNG storage tanks under four site classes, which has not been presented in existing literature. Therefore, the research findings of this paper are of great significance for the dynamic analysis and seismic design of large LNG storage tanks.
LNG storage tanks are especially vulnerable to damage during strong earthquakes due to their low redundancy, ductility, and energy-dissipating capacity compared to conventional structures [1]. In addition, the failure [2] of LNG tanks can result in secondary disasters such as fire and explosion that lead to casualties and property loss. Therefore, the seismic risks of LNG storage tanks are especially high compared to traditional buildings due to potential catastrophic consequences. For example, the 1964 Japan earthquake caused LNG tanks to explode and led to serious pollution. The bottom ring of a storage tank buckled during the 1976 Tangshan earthquake and caused liquid leakage [3]. As a result, reliability and accuracy is paramount to the design and analysis of large LNG tanks under earthquake loading.
Compared to ordinary buildings and bridges, the analysis of LNG tanks is established on different dynamic theories that consider the effect of solid-liquid interaction. In recent years, the study of liquid-solid coupling is of great significance in many engineering fields, such as aerospace, shipping, petroleum, chemical engineering, and marine engineering. More specifically, LNG tanks are subject to both inertial earthquake loading and hydrodynamic pressure, which result in liquid sloshing problems. In 1969, Edwards [4] used a finite element method to perform preliminary numerical simulation on the seismic response of a tank-fluid coupling system. Veletsos and Yang [5,6] proposed a single-degree-of-freedom system that assumed a flexible tank wall, which vibrated under a given bending deformation mode. In 1981, Haroun and Housner [7] developed a more realistic model that accounted for the coupled vibration effect. To address the dynamic interaction of liquid and the tank wall, this model divided the liquid into a convection component, a flexible impulsive component, and a rigid impulsive component. Subsequently, Tedesco et al. [8] summarized the results of a comprehensive analytical investigation concerning the seismic analysis of ground supported, cylindrical liquid storage tanks subject to a horizontal component of earthquake ground motion. In 2000, Malhotra et al. [9] proposed a simplified design method for cylindrical storage tanks on a rigid foundation considering the effect of impulsive and convective masses on flexible steel or concrete walls, and this method was adopted by European regulations. Based on fluid-solid interaction and other aforementioned dynamic theories, since the 1950s, many people have conducted research on the dynamic analysis of LNG storage tanks. Christovasilis and Whittaker [10] used mechanical models and finite element analysis to investigate the seismic response of a conventional and isolated cylindrical LNG tank. They obtained similar results from two numerical models and demonstrated that mechanical models could be applied to the preliminary analysis and design of such tanks. Zhang [11] presented a preliminary analysis of the potential effects of LNG tank insulation under earthquake conditions and assessed the potential for structural damage by comparing models with an insulation layer. Kim et al. [12] established a system for selecting the optimum friction material to meet the seismic performance requirements of an LNG tank with a friction pendulum system. Hou et al. [13] presented a theoretical solution for the von Mises stress on an LNG storage tank with elastic walls subject to seismic excitations. His solution was established based on the thin shell theory, and the precision of the theoretically simplified solution was proven with the simulation results. Chen et al. [14] studied the effect of impact loading on the dynamic response of a 160,000 m3 LNG prestressed concrete outer tank. Different types of impact damage were identified according to dynamic response results such as stress, energy, displacement, and critical impact velocity. Zhang et al. [15] investigated the effect of the multi-directional components of ground motion on an unanchored steel storage tank. They concluded that the vertical seismic component produced high compressive axial stress, which caused a significant increase in uplift and sliding at the tank bottom. Zhao et al. [15] applied an accurate and efficient Smoothed Particle Hydrodynamics-Finite Element Method (SPH-FEM) algorithm to evaluate the seismic response of a 160,000 m3 LNG prestressed storage tank at different liquid levels. The maximum stress of the inner tank with 100% LNG liquid level exceeded 500 MPa under the selected seismic waves and raised concerns for its structural safety. Despite an abundance of studies on the seismic analysis for LNG tanks, the impact of site conditions has largely been ignored. Therefore, discussions in this paper regarding site influence is an important addition to the dynamic analysis and seismic design of large LNG storage tanks.
In this study, the method of Smoothed Particle Hydrodynamics-Finite Element Method (SPH-FEM) is adopted to analyze the fluid-solid coupling problem in the seismic analysis of large LNG tanks. SPH-FEM methods inherent the advantages of SPH in modeling fluid behaviour while preserving the advantages of FEM in simulating FSI problems. Attaway et al. [16] first proposed the coupled SPH-FEM method using a master-slave algorithm to model the interaction between FE elements and SPH particles. Kalateh and Koosheh [17] used SPH-FEM to simulate the contact between a convergent-divergent nozzle and cavitating flow, and the resulted behaviour at liquid-vapour interface was confirmed by other numerical and experimental methods. Liang and Chen [18] applied the SPH-FEM method to a soil-structure interaction problem by conducting seismic analysis on a rectangular underground structure, and they were able to show that the magnitude of soil deformation and soil–structure contact status had an influence on the distribution and magnitude of seismic earth pressure. Fragassa et al. [19] coupled FEM and SPH to analyze the effect of air in FSI problems, and he concluded that air had considerable effect on the behaviour of the structure after the initial fluid impact. In the case of an LNG tank that is too large to allow any direct physical experiments, SPH-FEM simulation provides an accurate and efficient method to predict its seismic response in this study.
The findings of this paper are organized as follows: Section 2 presents details of the SPH-FEM that are applicable to the simulation of LNG tanks; Section 3 confirms the accuracy and feasibility of the SPH-FEM method by comparing the sloshing frequency of a small tank obtained through SPH-FEM, theoretical, and experimental methods; Section 4 performs seismic response analysis of a large LNG prestressed storage tank under 12 seismic waves for four different classes of sites; Section 5 concludes the study.

2. Methodology

2.1. Smoothed Particle Hydrodynamics (SPH) Theory

In the SPH method, the computational domain is dispersed into a series of randomly arranged particles. Adjacent particles interact based on smooth kernel functions in the forms of momentum exchange and energy transmission. The continuity equation can be expressed as:
d ρ d t + ρ 𝛻 × ν = 0
The differential expression of the momentum equation is shown as:
  ρ d v d t = 𝛻 P + ρ F
The SPH algorithm is formulated as two parts: the integral representation of the field function and the particle approximation [20]. The integral representation of the function f r is identified as [21]:
  f r = Ω f r δ r r d r
where f r represents a function of the three-dimensional position vector r, and the Dirac delta function is written as:
δ r r = 1 r = r 0 r r
If a Delta function kernel δ r r is replaced by a smoothing function W r r , h , the integral representation of f r can be shown as:
f r     Ω f r W r r , h d r
where h is the smoothing length that defines the area of influence of the smoothing kernel function W. W should satisfy three conditions:
(1)
the normalization condition stating:
Ω W r r , h d r = 1
(2)
when the smoothing length approaches zero, the Delta function property is obtained as:
l i m h 0 W r r , h = δ r r
(3)
the compact condition implies that:
W r r , h = 0 w h e n   r r > κ h
where κ represents a constant associated with the smoothing function of the point at r and defines the effective (non-zero) area for the smoothing function.
In this study, a cubic spline is employed as the kernel function W, and the expression of W can be shown as:
W r r , h = a 1 3 2 q 2 + 3 4 q 3 , 0 q 1 1 4 2 q 3 , 1 q 2 0 , 2 < q
The movement of particles in SPH method generally follows the law of conservation of mass, the law of conservation of momentum, and the law of conservation of energy. A continuous density particle approximation method approximates the density using the SPH approximation concept to transform the continuity equation. By applying different conversions and operations, different forms of the density approximation equations can be determined. For instance, SPH approximation can be applied to the velocity divergence, and the particle density in the continuity equation can be obtained in the form of a gradient:
D ρ i D t = ρ i j = 1 N m j ρ j ν j β W i j r i β
Approximate expression of unit gradient SPH central particles is shown below:
𝛻 1 = 1 𝛻 W r r , h d r = j = 1 N m j ρ j ν j β W i j r i β = 0
Therefore, another expression for the density approximation equation is obtained:
D ρ i D t = ρ i j = 1 N m j ρ j ν i j β W i j r i β
The particle approximation method for the momentum equation closely resembles the continuous density method but requires some transformations. Based on different transformations, the momentum equation approximation can be derived in differential form.
σ α β = p δ α β + τ α β
where σ denotes total stress tensor, p represents isotropic pressure, and τ is viscous pressure.
Using the SPH particle approximation method, the following equation can be obtained based on Equation (13) to transform the momentum equation:
D ν i α D T = j = 1 N m j p i ρ i 2 + p j ρ j 2 W i j r i α + j = 1 N m j μ i ε i α β ρ i 2 + μ j ε j α β ρ j 2 W i j r i β
The work performed by pressure can be represented by several approximation expressions. Therefore, there are many alternatives to the internal energy calculation for the work performed by pressure. The following form is the most commonly used:
D e i D T = 1 2 j = 1 N m j p i + p j ρ i ρ j ν i j β W i j r i β + μ i 2 ρ i ε i α β ε j α β
In ABAQUS, time stepping is explicit and is constrained by the Courant Condition as described below:
Δ t = m i n a 0.5 h / c s + 2 ξ μ h ρ
where cs is the local speed of sound. All simulations use a time step of 1.0 × 10⁻⁶ s to guarantee convergence [22].

2.2. Coupled Smoothed Particle Hydrodynamics-Finite Element Method (SPH-FEM)

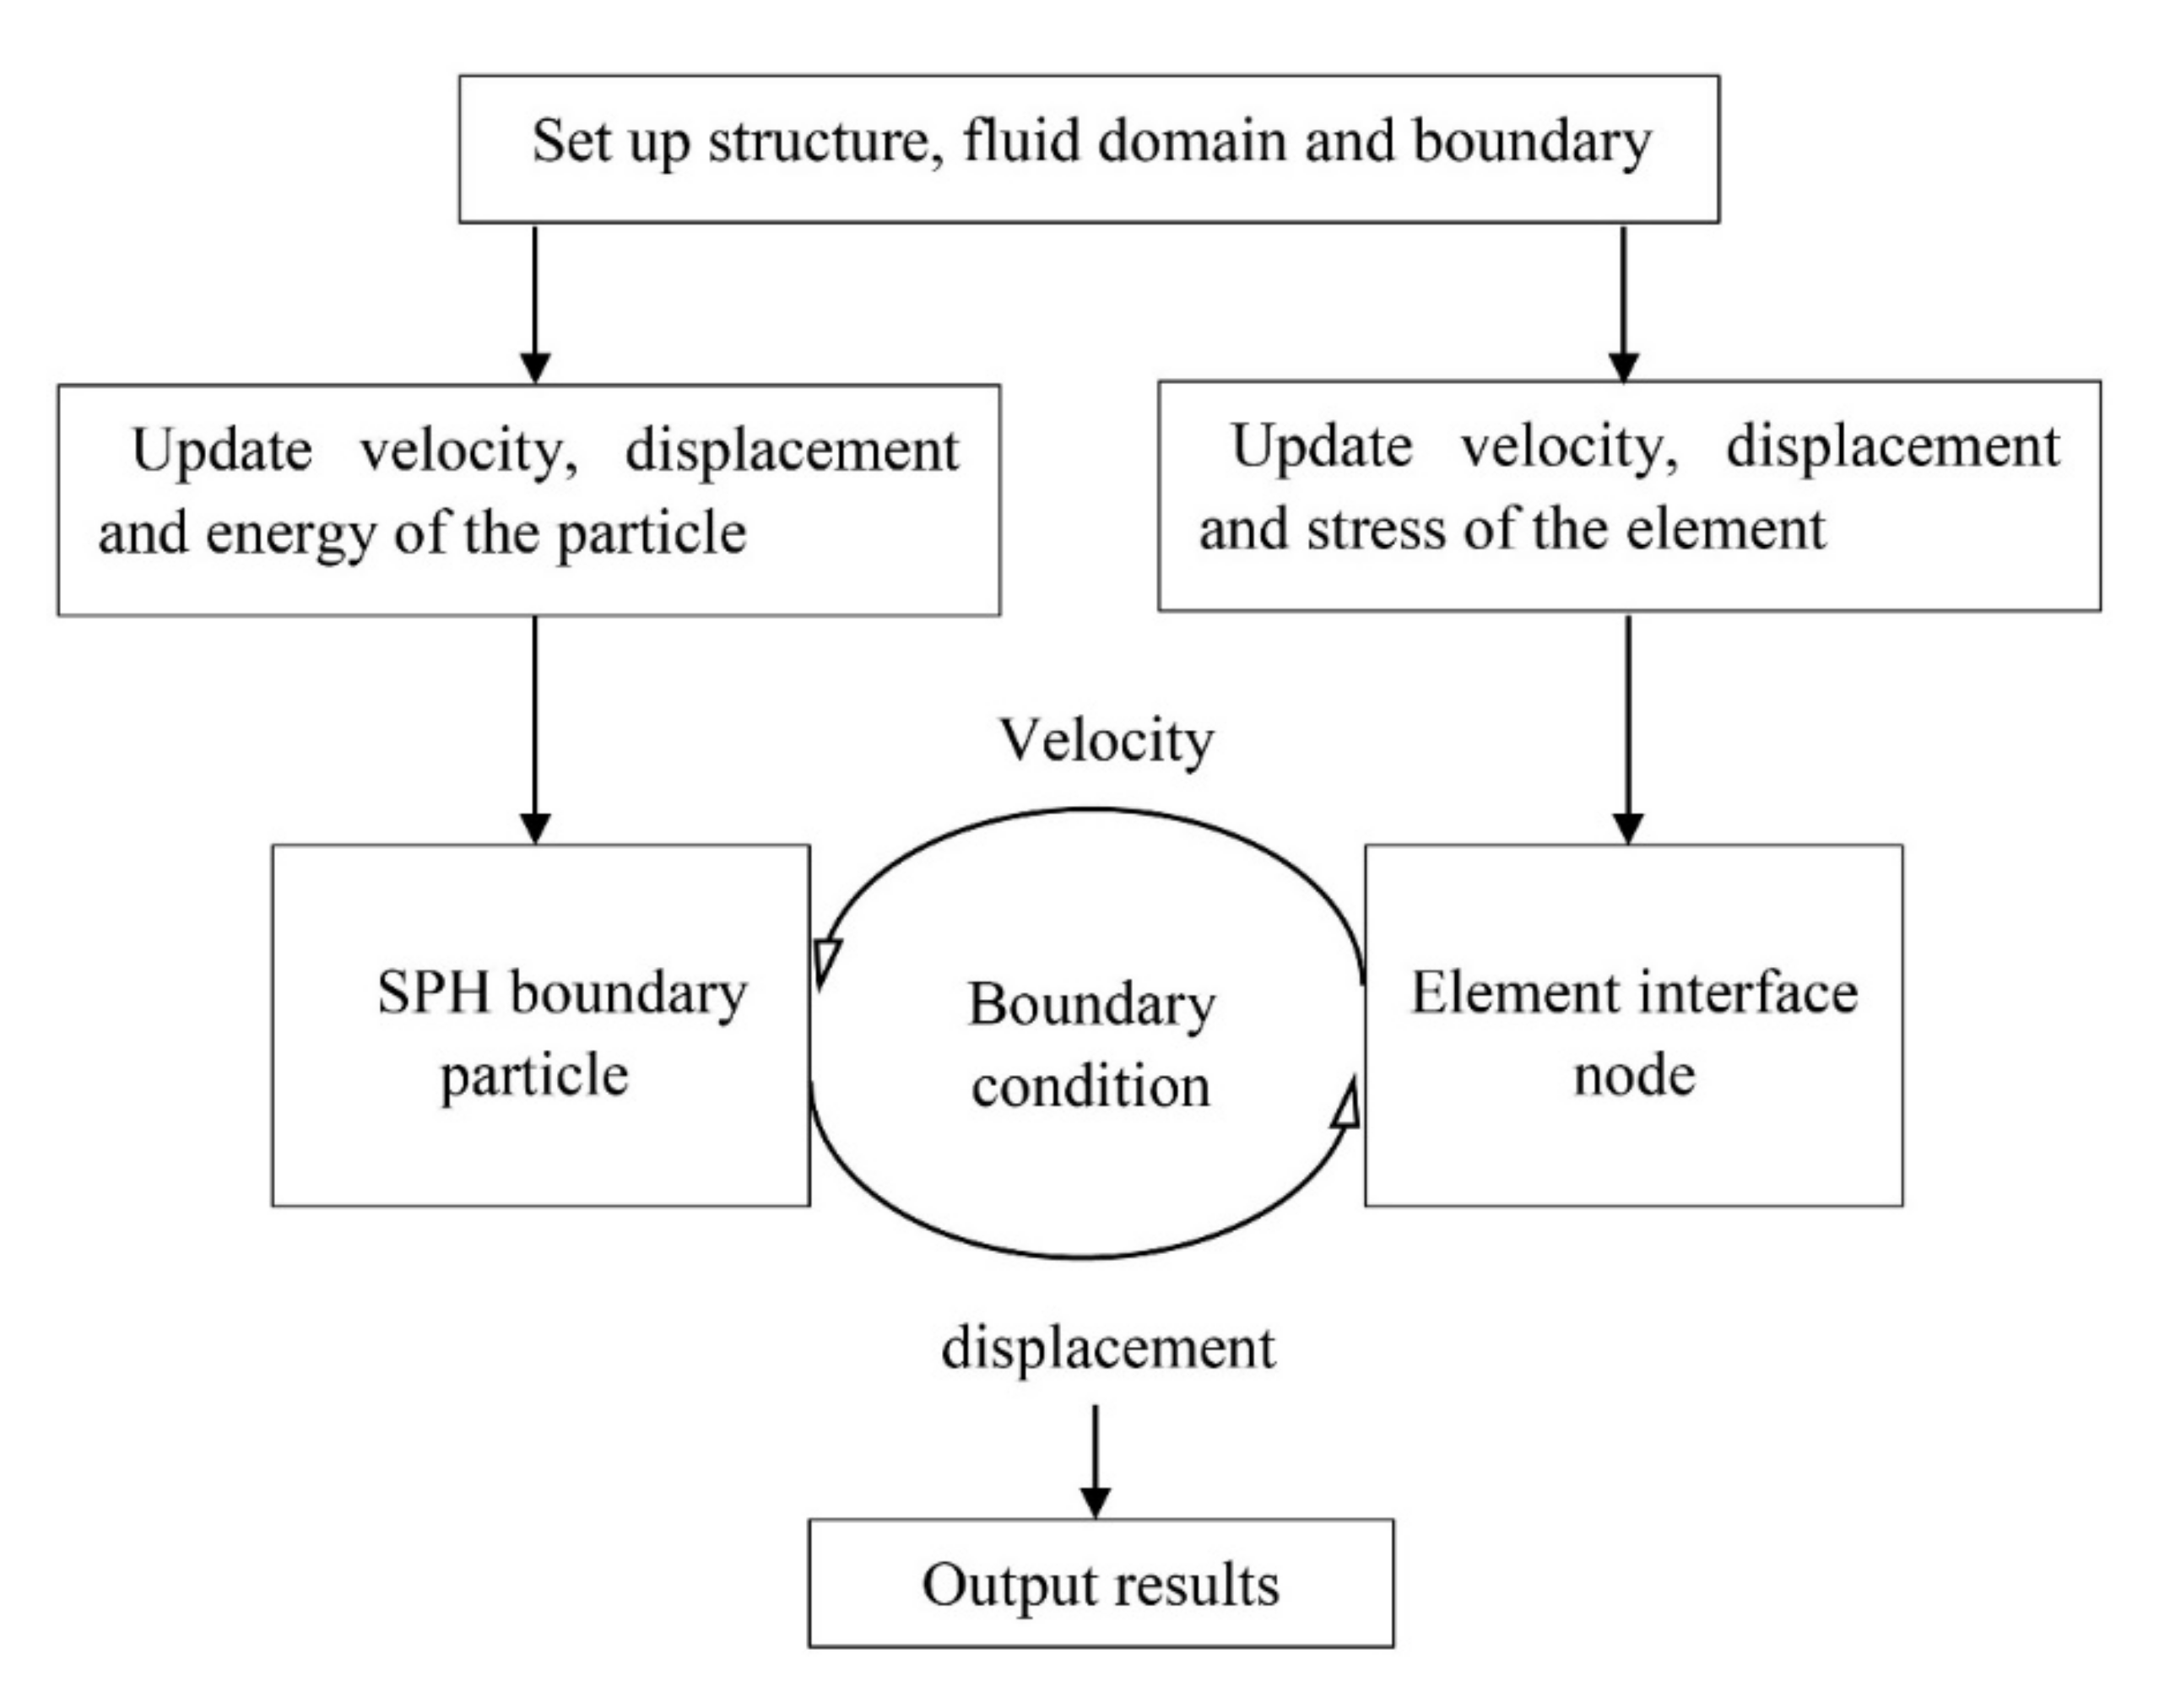
The relationship between the SPH and FEM algorithm is a key concept in the coupled SPH-FEM method. Velocity and displacement are transferred between SPH particles and FEM nodes in each time step. SPH particles provide boundary conditions for FEM, and FEM prevents the boundary effect by maintaining the continuity of the particles [23]. In this fluid-structure interaction study, the interactive forces between SPH and FEM are coupled by exchanging velocity and displacement fields on the solid-fluid interface. Figure 1 shows a schematic computational flowchart of the SPH-FEM coupling method.

3. Sloshing Frequency

The objective of this section is to examine the sloshing frequency of water in a small rectangular tank under excitation using the SPH-FEM method to verify its accuracy. To obtain an adequate resolution, different element sizes were tested to select a suitable size for the simulation. The simulation results are compared to theoretical and experimental results, and a high level of agreement is achieved.

3.1. Details of the Small Tank Model

A model of a small rectangular tank is developed to verify the accuracy the SPH-FEM algorithm and to determine the ratio of suitable element size to container size in a large LNG tank. The tank is 270 mm in length, 270 mm in width, and 300 mm in height, and contains water. The tank model is composed of glass with the following material properties: density p = 950 kg/m3, Young’s modulus E = 1.173 × 10⁹ N/m2, and Poisson ratio υ = 0.35. Liquid sloshing is an extremely complex behaviour, and an equation of state is applied to define the pressure, volume, and energy of the material. In this section, the Newtonian fluid constitutive material formulation is used for water. The Mie-Gruneisen equation of state defined in Table 1 describes the volumetric strength and density of a material. The isotropic pressure in the Mie-Gruneisen equation of state is stated as follows:
p ( ρ , e ) = 1 1 2 Γ 0 η P H + Γ 0 ρ 0 E m p H = ρ 0 c 2 η ( 1 s η ) 2 η = ρ ρ 0 1
where η is the volumetric compressibility, H is the Hugoniot curve, Em is the internal energy per unit mass, and c is the sonic speed of the material. The linear relationship between the shock velocity and the particle velocity can be used to describe the coefficients s and c:
U s = c + s U p
where U P is the particle velocity and U s is the shock wave velocity. This equation of state describes the fluid motion.
A model for the hydrodynamic material is provided by the equation of state U s U p , and the properties of water are shown in Table 1. In the model, only water is discretized as SPH particles. The SPH domain has a length of 270 mm on one side, a width of 270 mm on the other side, and a height ranging from 50 to 200 mm. The exterior Lagrangian mesh is composed of 5042 hexahedral elements in ABAQUS [24,25]. The entire simulation lasts for 2.76 s, and a horizontal base displacement is introduced with a constant velocity of 0.75 m/s in the first 0.2 s as shown in Figure 2.
The SPH algorithm employs a cubic spline as the interpolation polynomial. Smoothing length is an important parameter and has significant influence on the accuracy of the prediction [26,27]. By default, ABAQUS calculates a smoothing length at the beginning of an analysis where an element is associated with an average of approximately 30 to 50 particles. Every increment recomputes this local connectivity internally and computes kinematic quantities (normal and shear strains, deformation gradients, etc.) based on contributions from a cloud of particles centered around the particle of interest. Subsequently, stress is computed in a similar fashion as reduced-integration brick elements, which are in turn used to compute element nodal forces for the particles in the cloud based on the SPH formulation. In this study, a constant smoothing length is defined for the entire analysis. This modification is compliant with ABAQUS [22] standards and improves the quality of simulation.

3.2. Results

The first sloshing frequency for a rectangular tank is given by the formulation below [28]:
ω 2 = 5 2 g l tan h 5 2 h l
where h = height of water in the tank (m), l = length of the rectangular tank along the direction of excitation (m), and g = acceleration due to gravity (m/s2).
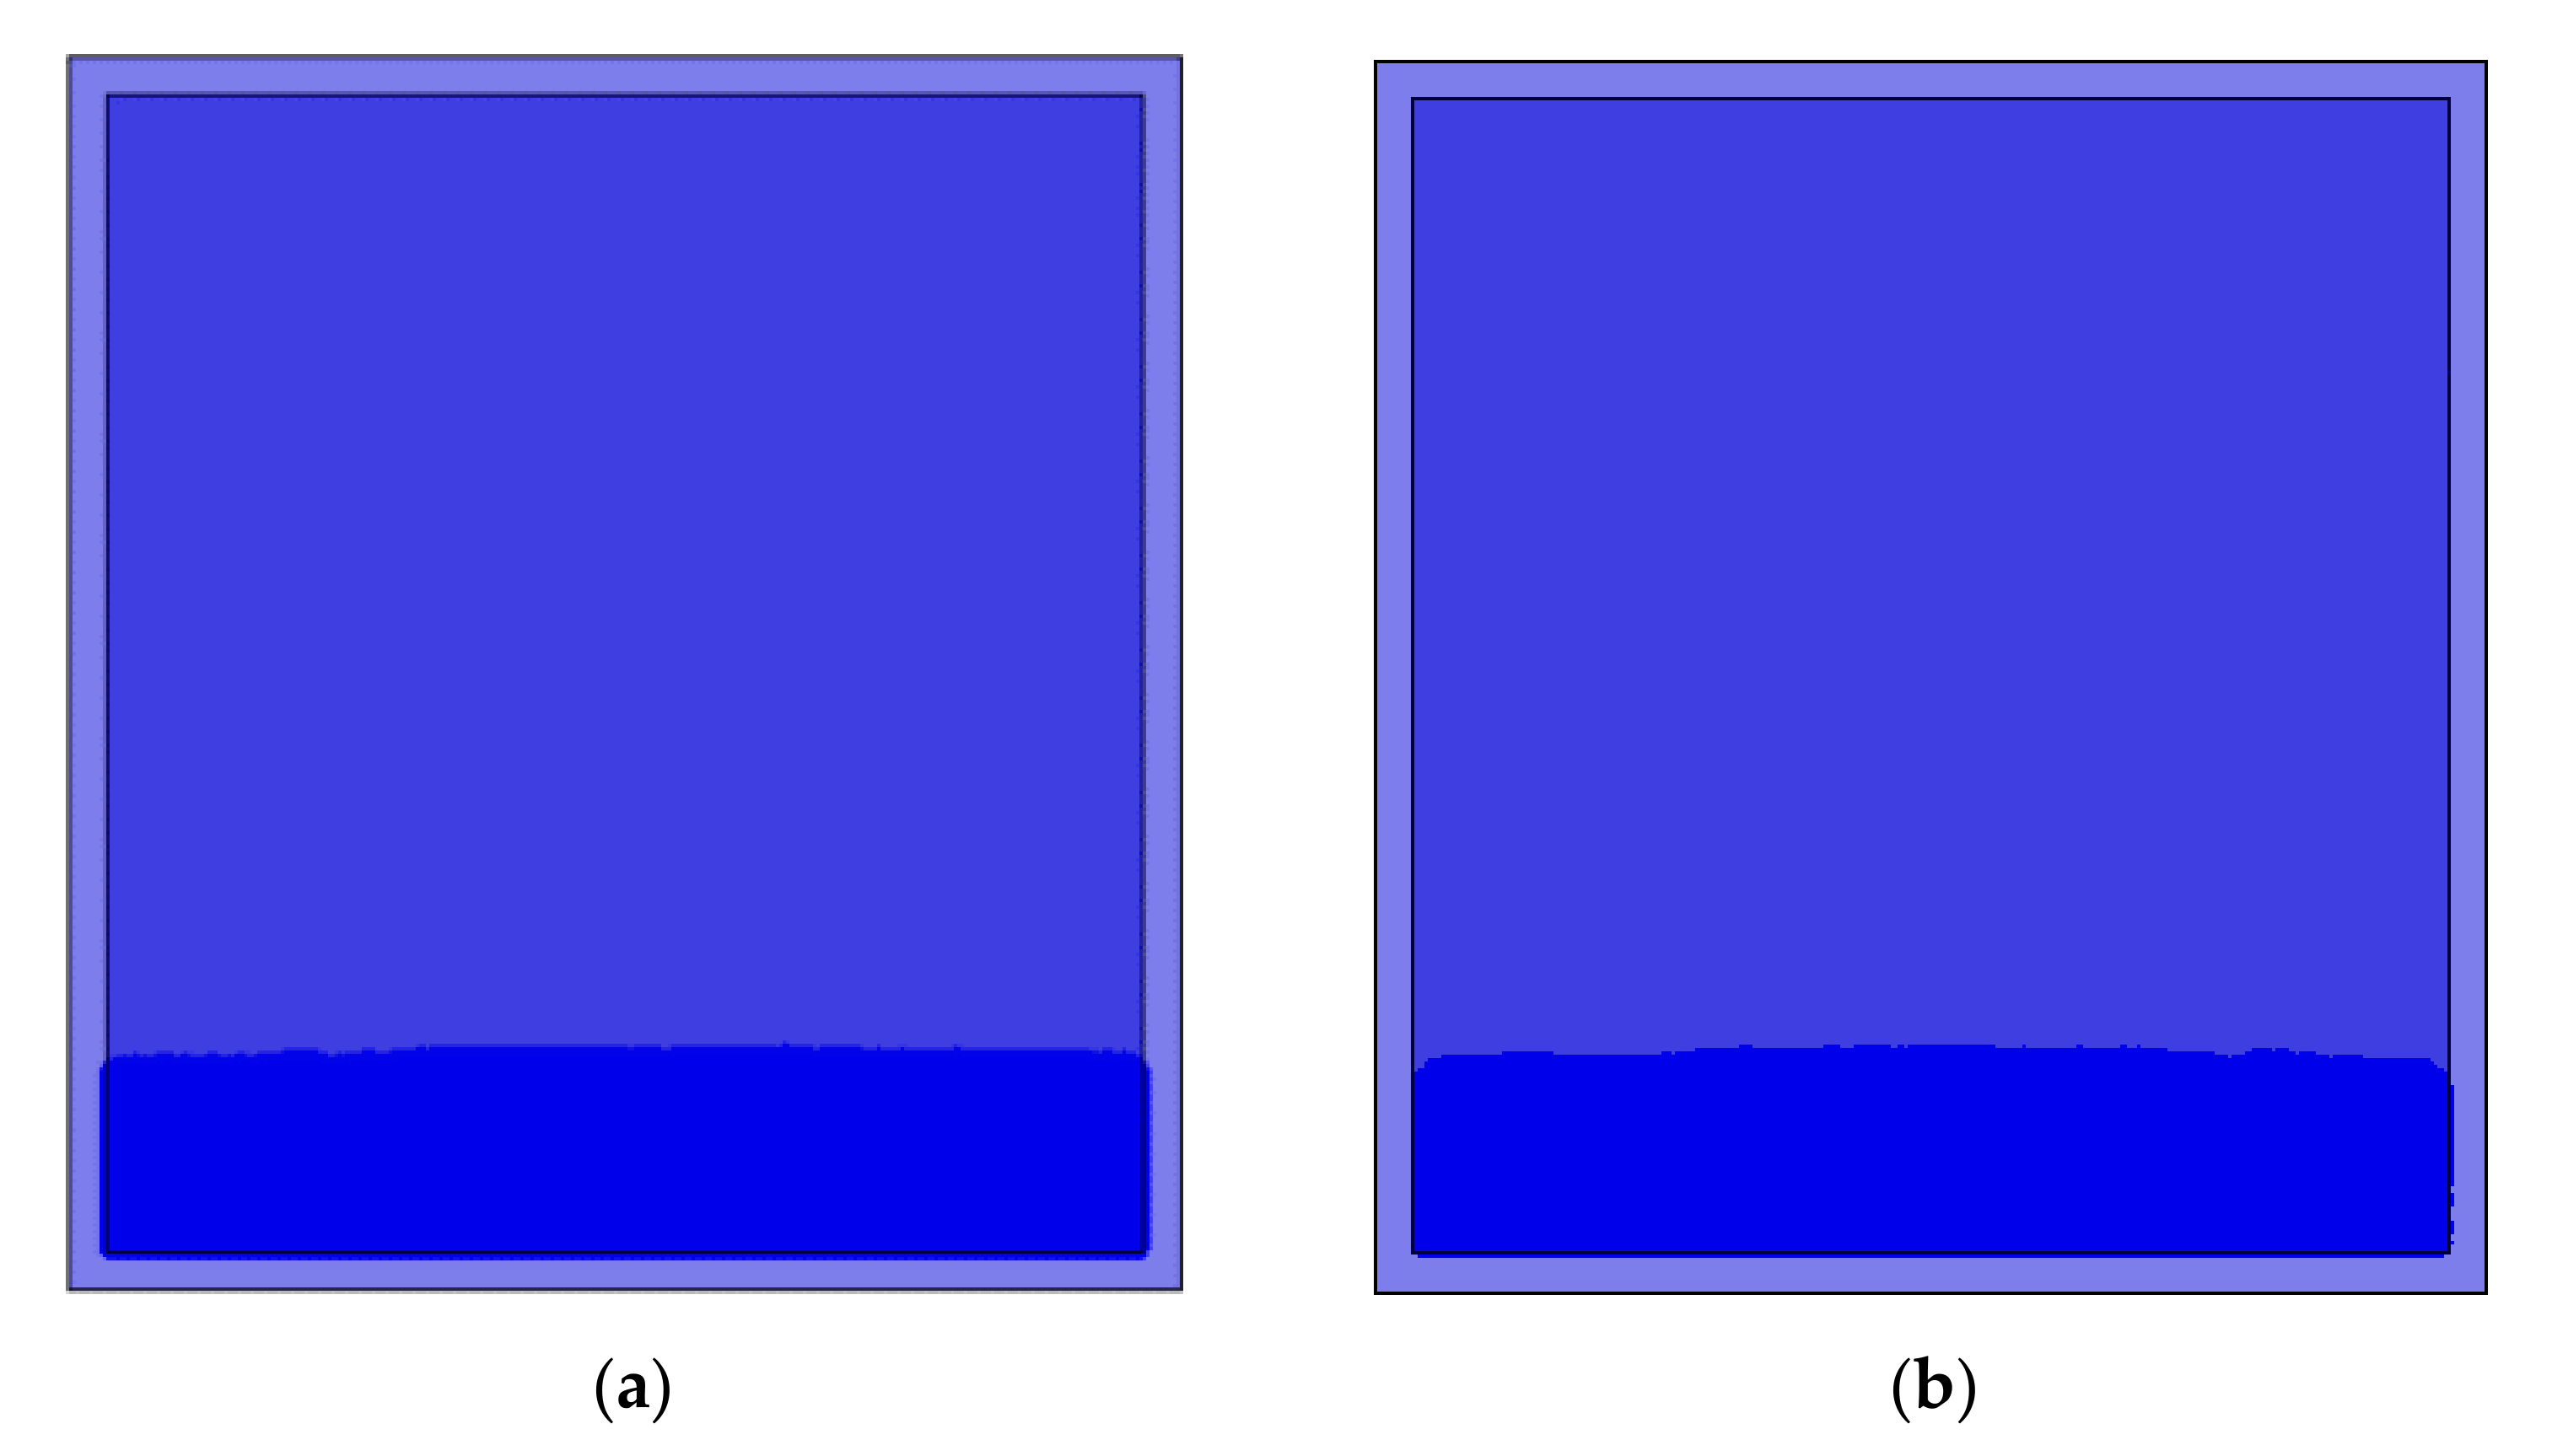
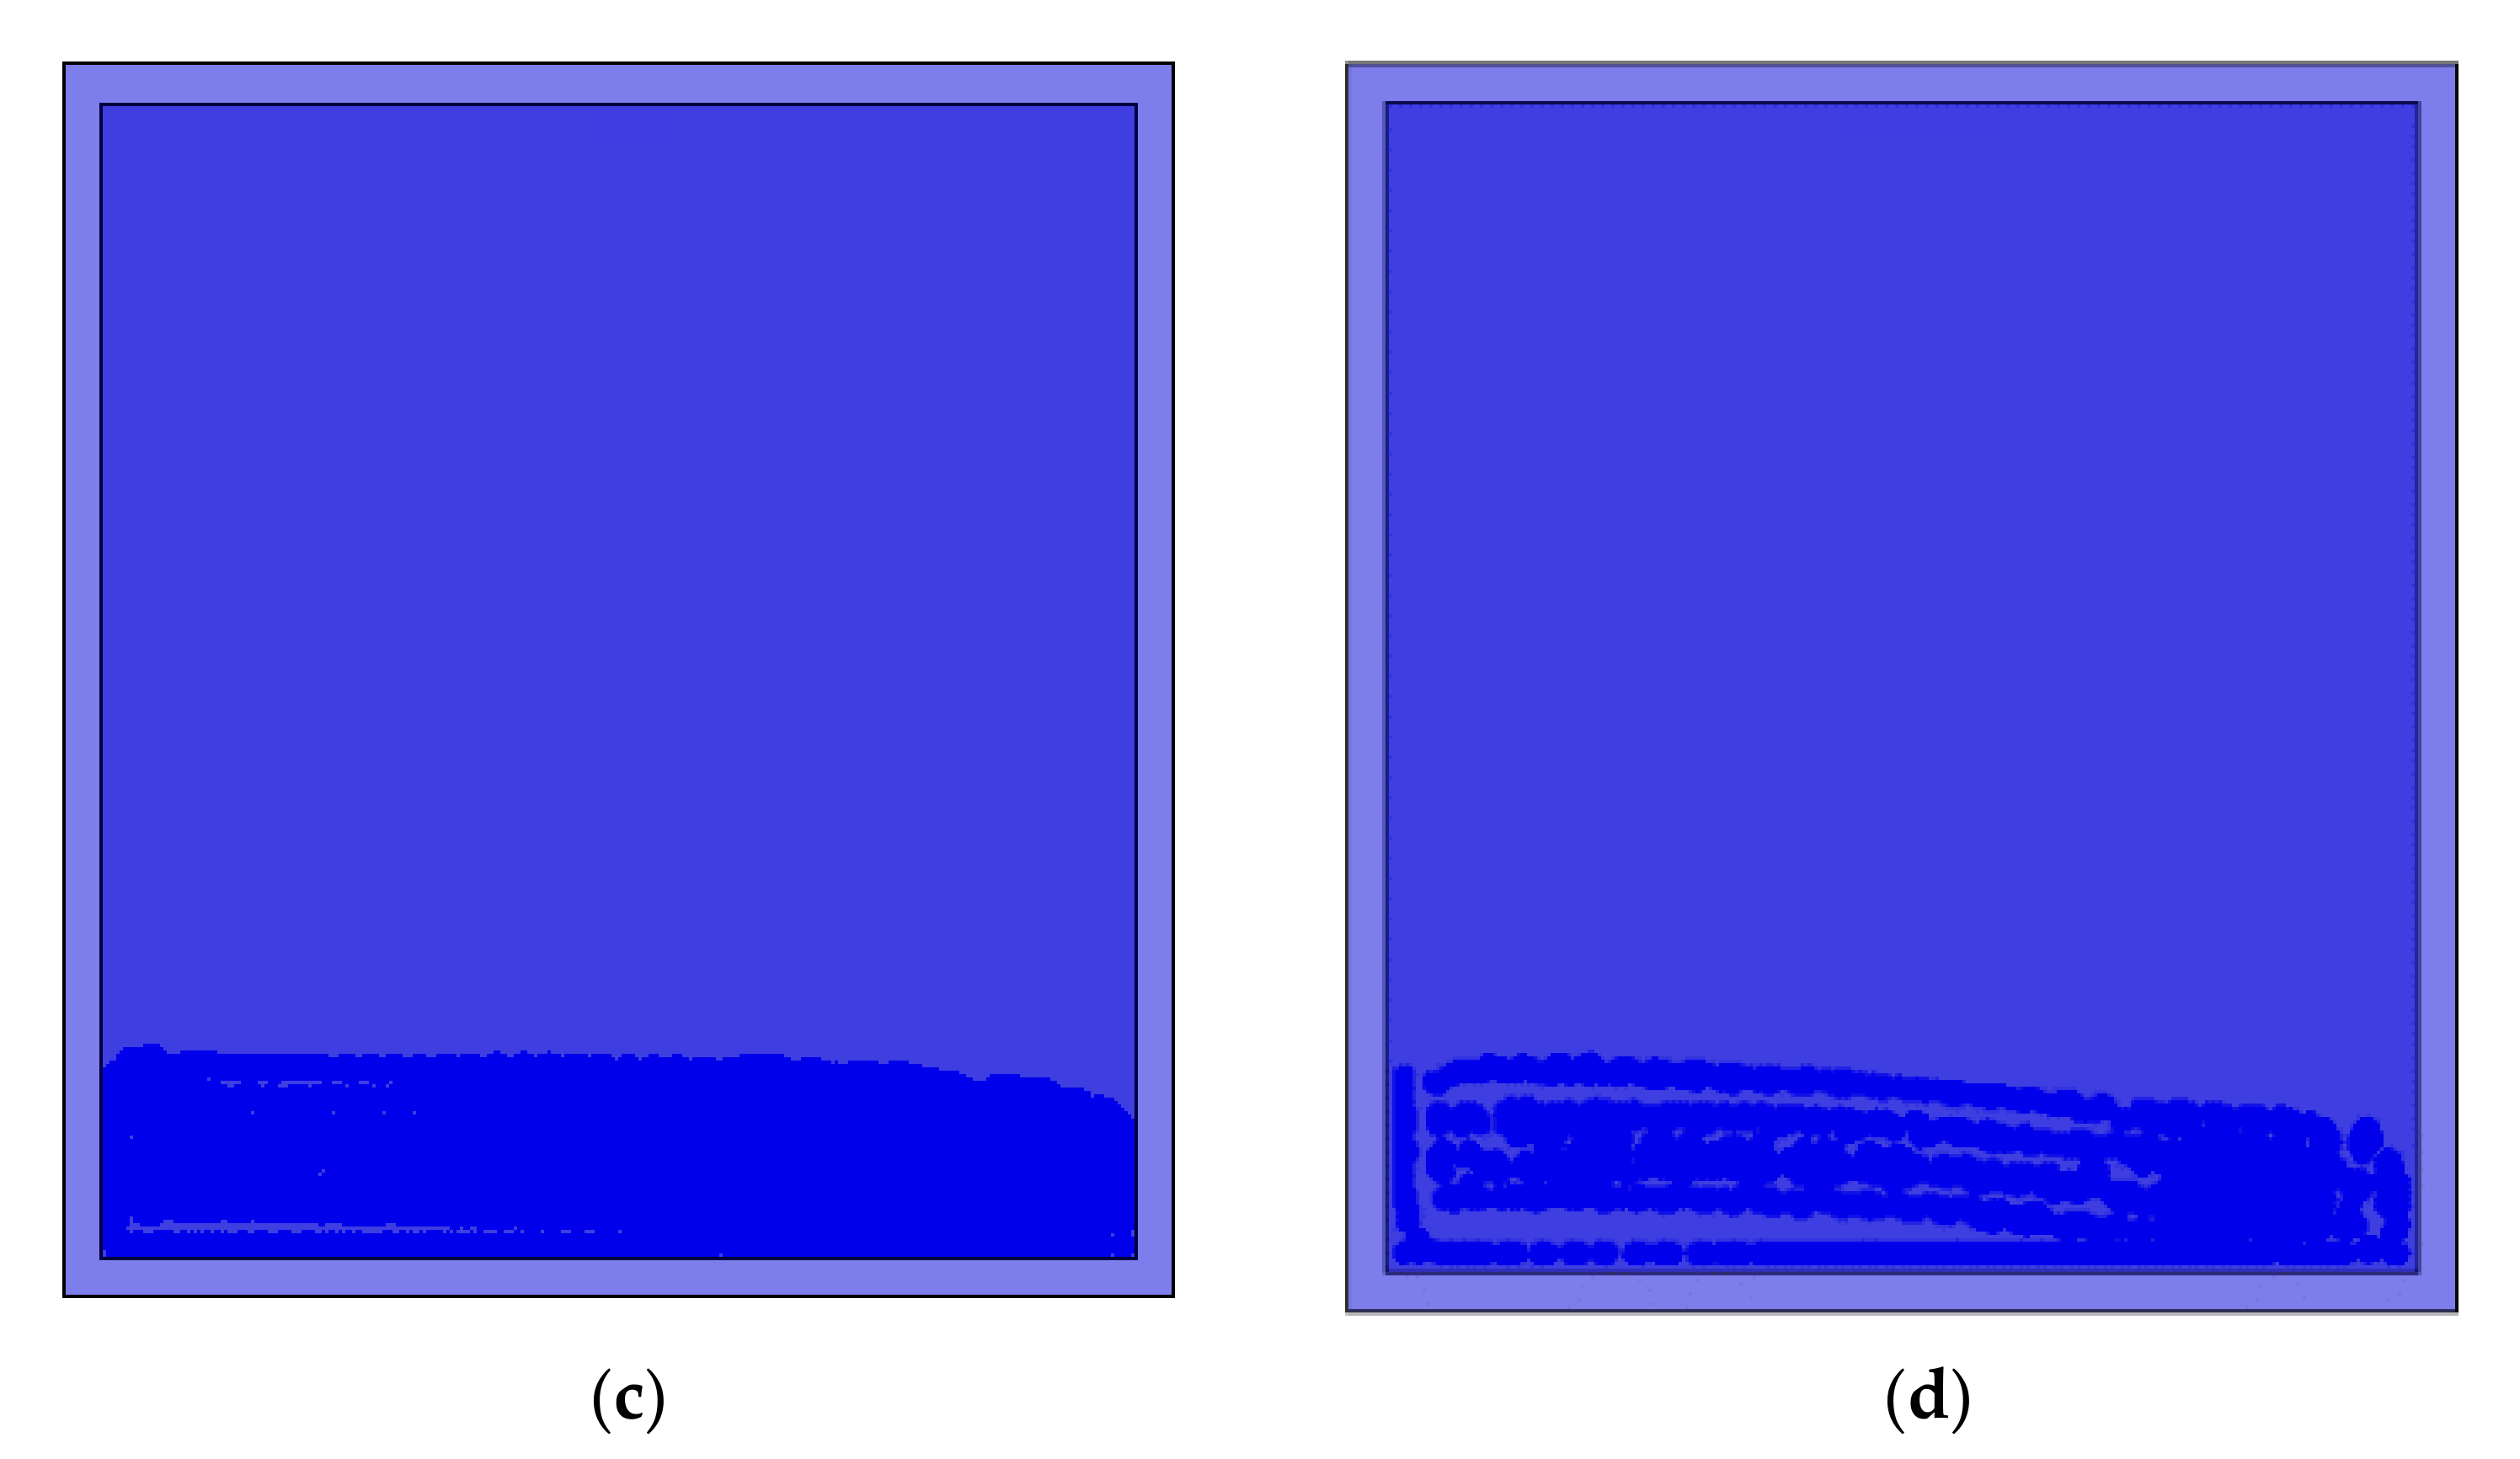
Four element sizes, namely 10, 7.5, 5, and 3 mm, are considered along with a 50 mm liquid height. The Fast Fourier Transform (FFT) results of sloshing frequency and simulation fluctuation results are then compared for different element sizes to determine the optimal choice. Figure 3 shows the SPH-FEM simulation of sloshing with different element sizes at 2.0 s. Element sizes of 10 and 7.5 mm are eliminated due to the amount of air entrapment as shown in Figure 3, as well as inaccurate FFT results as shown in Table 2. On the other hand, the FFT results of sloshing frequency for an element size of 5 and 3 mm are identical as seen in Table 2. Therefore, 5 mm is chosen to ensure accuracy while maintaining calculation efficiency. The ratio of the liquid element size to the side length of the container base is 5:270.
The theoretical result of sloshing frequency is obtained by Housner’s formula in Equation (19), and experimental results with the same container size are obtained from Jaiswal et al. [29]. The sloshing frequency results with different liquid heights from the SPH-FEM simulation exhibit good agreement with Housner’s theoretical results and experiment results [29] as shown in Table 3, especially in shallow water. Thus, fluid-structure simulation using the SPH-FEM method is feasible. The liquid element size can be scaled up based on the optimal ratio 5:270 and applied to the large LNG tank to ensure simulation accuracy.

4. Seismic Analysis of a Large Liquefied Natural Gas (LNG) Tank

4.1. Project Overview

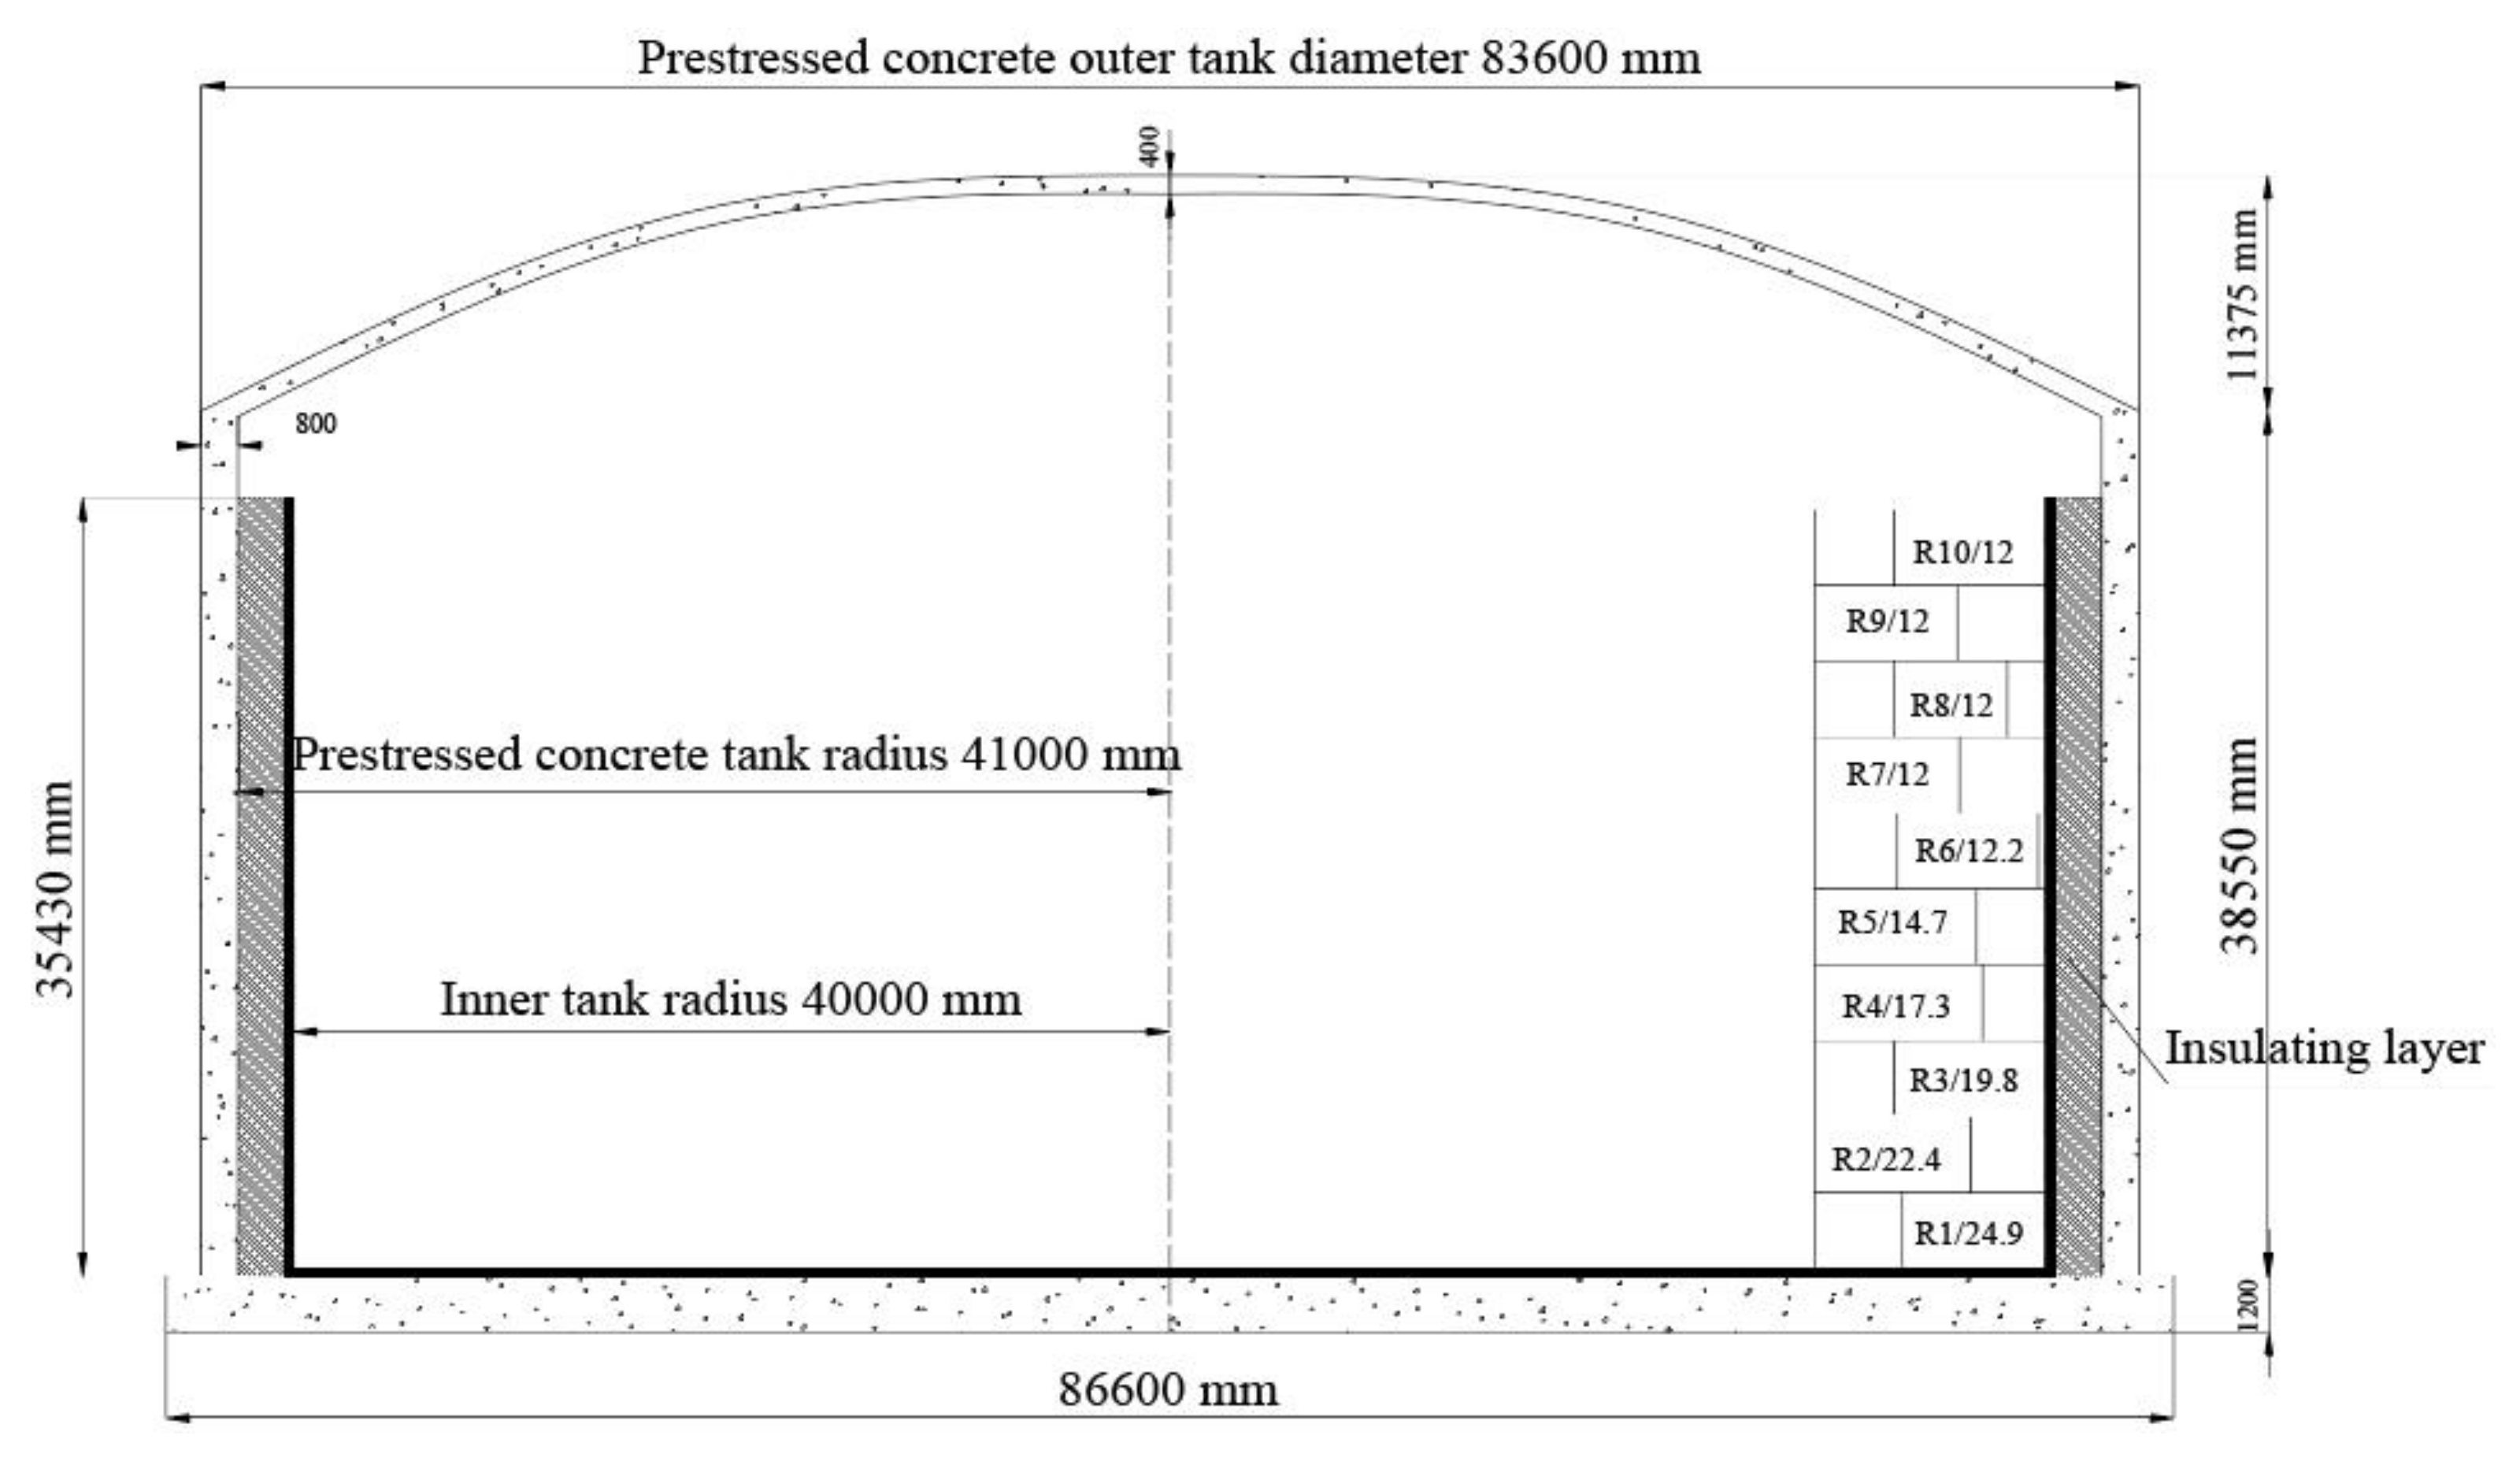
This study employs a 160,000 m3 LNG prestressed storage tank reproduced from an existing and widely-applied design as shown in Figure 4 [15]. The outer tank has an inner diameter of 82 m, a wall height of 38.55 m, a wall thickness of 0.8 m, and a dome thickness of 0.4 m. Additional components are embedded within the tank to keep the moisture-proof linings and roof-bearing rings in place.
The inner tank has a total of 10 layers each with a height of 3.55 m; as shown in the diagram, layer R1/24.9 refers to the first layer from the bottom with a thickness of 24.9 mm. Additional thinner layers rest on top the first layer as given in Table 4.
The LNG storage tank consists of four components including the LNG, an inner tank composed of 9% Ni steel, an insulation layer, and an outer tank. The tank is characterized by excellent low-temperature resistance [30,31], good weldability, and low susceptibility to cold cracks. The insulation layer consists of expanded perlite and resilient felt. The expanded perlite is attached to the inner wall of the outer tank, and the outer wall of the inner tank is lined with resilient felt that provides elastic properties for the perlite and prevents it from settling. This elasticity is essential due to temperature-induced tank shrinkage. The prestressed concrete external tank increases structural safety during LNG leakage. The material of the outer tank is chosen to be 60 MPa high-strength concrete according to the advice of Huang [32]. The respective material properties of the tank and the LNG are listed in Table 5 and Table 6.

4.2. Finite Element Model

This study uses the ABAQUS software [33,34] to establish a finite element model (FEM) as shown in Figure 5. Because the tank model is extremely large, the associated interactions are very complex. The ‘Embedded’ option in ABAQUS is used to embed rebar rods within the tank wall, which enables the rebar elements to work in relation to each other. The outer tank and the insulation layer are represented by C3D8R mesh elements [33,34]. The inner tank is represented by S4R shell elements [33,34] because its thickness is much lower than its radius of curvature. The aforementioned U s U p equation in Section 3 is used to discretize the LNG liquid into particles. The element size is chosen according to the small tank in Section 3 that produces an accurate sloshing frequency calculation. The ratio of liquid element size to container size of the large tank is identical to that of the small tank in Section 3.
The protective cover encompasses 19T15S steel cables with a tensile strength of 1860 MPa. The top and bottom of the concrete wall consist of 122 vertically anchored steel cables. 220 circumferential steel cables are anchored in semicircles on four vertical supporting columns at 90° [35].
Prestress in ABAQUS can be applied using different approaches, such as the initial stress method, the model predictive control (MPC) method, the single rebar element method, and the falling temperature method. The falling temperature method is used in this study to apply prestress by decreasing temperature. The initial temperature of the prestressed rebar is calculated with the following Equation:
Δ = N λ × E × A
where N is the tensile force in the prestressed rebar, which shall be no more than 75% of the prestressed rebar’s standard strength; λ is the thermal expansion coefficient; E is the elastic modulus; A is the cross-sectional area.
The bottom boundary of the model is fixed without considering any interaction between soil and structure. The static condition of the LNG tank is obtained based on its own weight to make sure that the LNG liquid reaches steady state.

4.3. Modal Analysis

Natural frequencies, such as the liquid-solid coupling frequency and the liquid sloshing frequency, are essential parameters in the design and analysis of LNG prestressed storage tanks. To determine the natural frequency, three methods are primarily used for extracting eigenvalues in ABAQUS: the subspace iteration method, the AMS eigensolver, and the block Lanczos algorithm. This study uses the Lanczos algorithm to calculate the first frequency of the empty tank as 3.753 Hz. According to specifications [36], the basic natural frequency of solid–liquid coupling is shown as:
f c = E δ R 2 H ρ 0.206082 0.0514 H R 0.0000377 H R 2 0.001053432 H R 3
where R is the radius of the inner tank; ρ is the density of the LNG liquid; E is elastic modulus of the inner tank; δ is the thickness of the inner tank at 1/3 of the total height; H is the height from the tank bottom to the liquid level.
In addition, according to specifications [36], the basic natural vibration period of liquid sloshing is shown in the following Equation:
T = 2 π D 3.68 g cth 3.68 H D
where D is inner tank diameter; T is the basic period; cth is the hyperbolic tangent function; g is the acceleration of gravity. The basic natural frequency of solid-liquid coupling and the basic natural frequency of liquid sloshing under different liquid levels are listed in Table 7 and Table 8.
As shown in Table 7 and Table 8, the simulation results of natural frequency of solid-liquid coupling and the basic natural frequency of liquid sloshing in large LNG storage tanks are in agreement with relevant theoretical results. More specifically, both simulation and theoretical results show that the basic natural frequency of solid-liquid coupling decreases with increasing liquid level, while the basic natural frequency of liquid sloshing increases with increasing liquid level. Therefore, the accuracy and feasibility of using numerical simulation for LNG tanks is demonstrated.

4.4. Records Selection

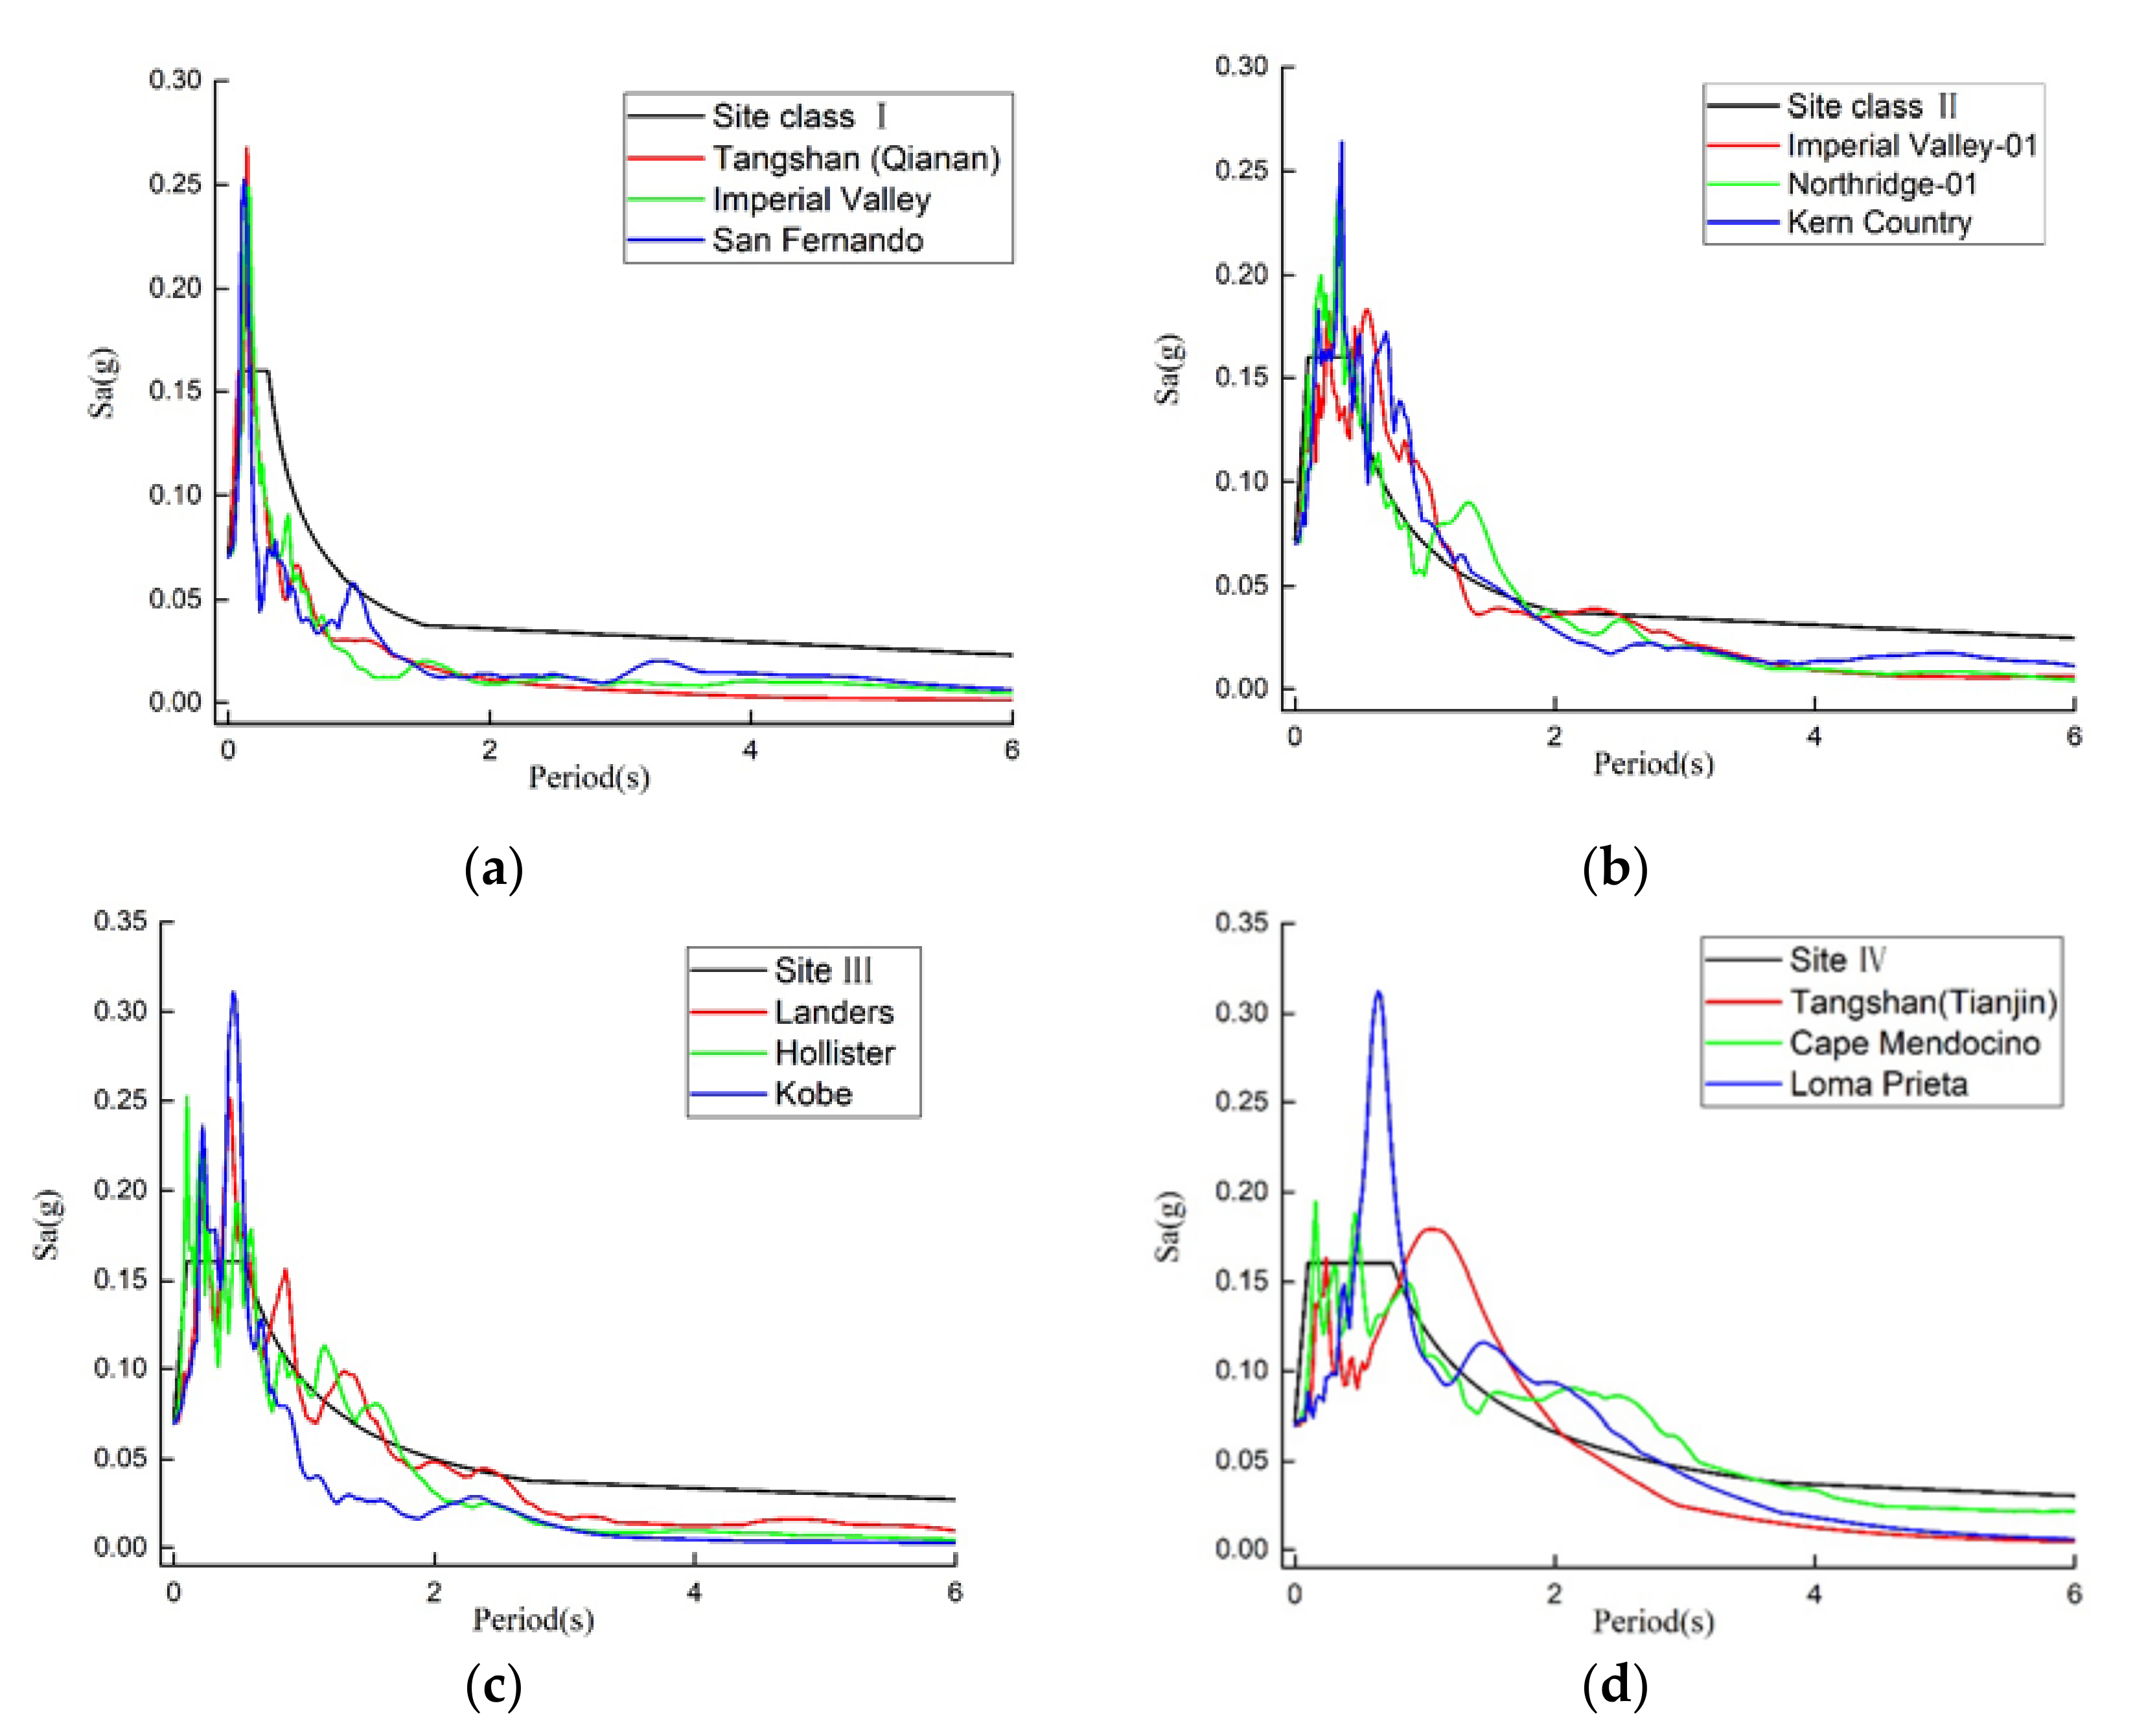
The Chinese seismic codes for large LNG storage tanks are based on the seismic codes of building structures [37]. The normative theoretical model, which is derived from the Housner rigid two-particle theoretical model, accounts for the influence of the elastic tank wall. Furthermore, the Chinese seismic code classifies the design objective for large LNG tanks into the second of three tiers, which means designing for repairable damage without collapse. In addition, the Chinese seismic code classifies seismic sites into four classes depending on soil stability, shear wave velocity, and thickness of overburden. Class I contains the strongest soil, and soil strength gradually weakens from Class II to Class IV. Structural behaviour observed during past earthquakes have shown that the same type of structure is often damaged to different degrees depending on the difference in soil layers that structures reside on. Selecting seismic records and response spectra according to corresponding sites leads to more reasonable response calculation results. Therefore, it is important to study the influence of site differences on system response. In the past, no one has studied the impact of location on large LNG tanks under earthquake loading in detail. In this paper, the seismic response analysis of a large LNG prestressed storage tank is performed under 12 seismic waves for four different classes of sites. Based on guidelines for seismic wave selection [37], 12 seismic waves are selected and scaled to ensure compatibility with the design spectrum at the chosen site. The scaling and matching process has been performed independently for each input motion. The spectra of the scaled seismic motions are compatible with the Chinese design response spectrum. The details for 12 ground motions (3 earthquakes in each site) are shown in Table 9, and the acceleration response spectra for ground motions as well as the code acceleration response spectra are shown in Figure 6.

4.5. Results

The simulation of a large LNG tank using the SPH-FEM algorithm is entirely performed on an ordinary personal computer. The computer has an Intel(R) Core(TM) i7-8700 CPU @ 4.10 GHz processor and an installation memory of 16.00 GB.
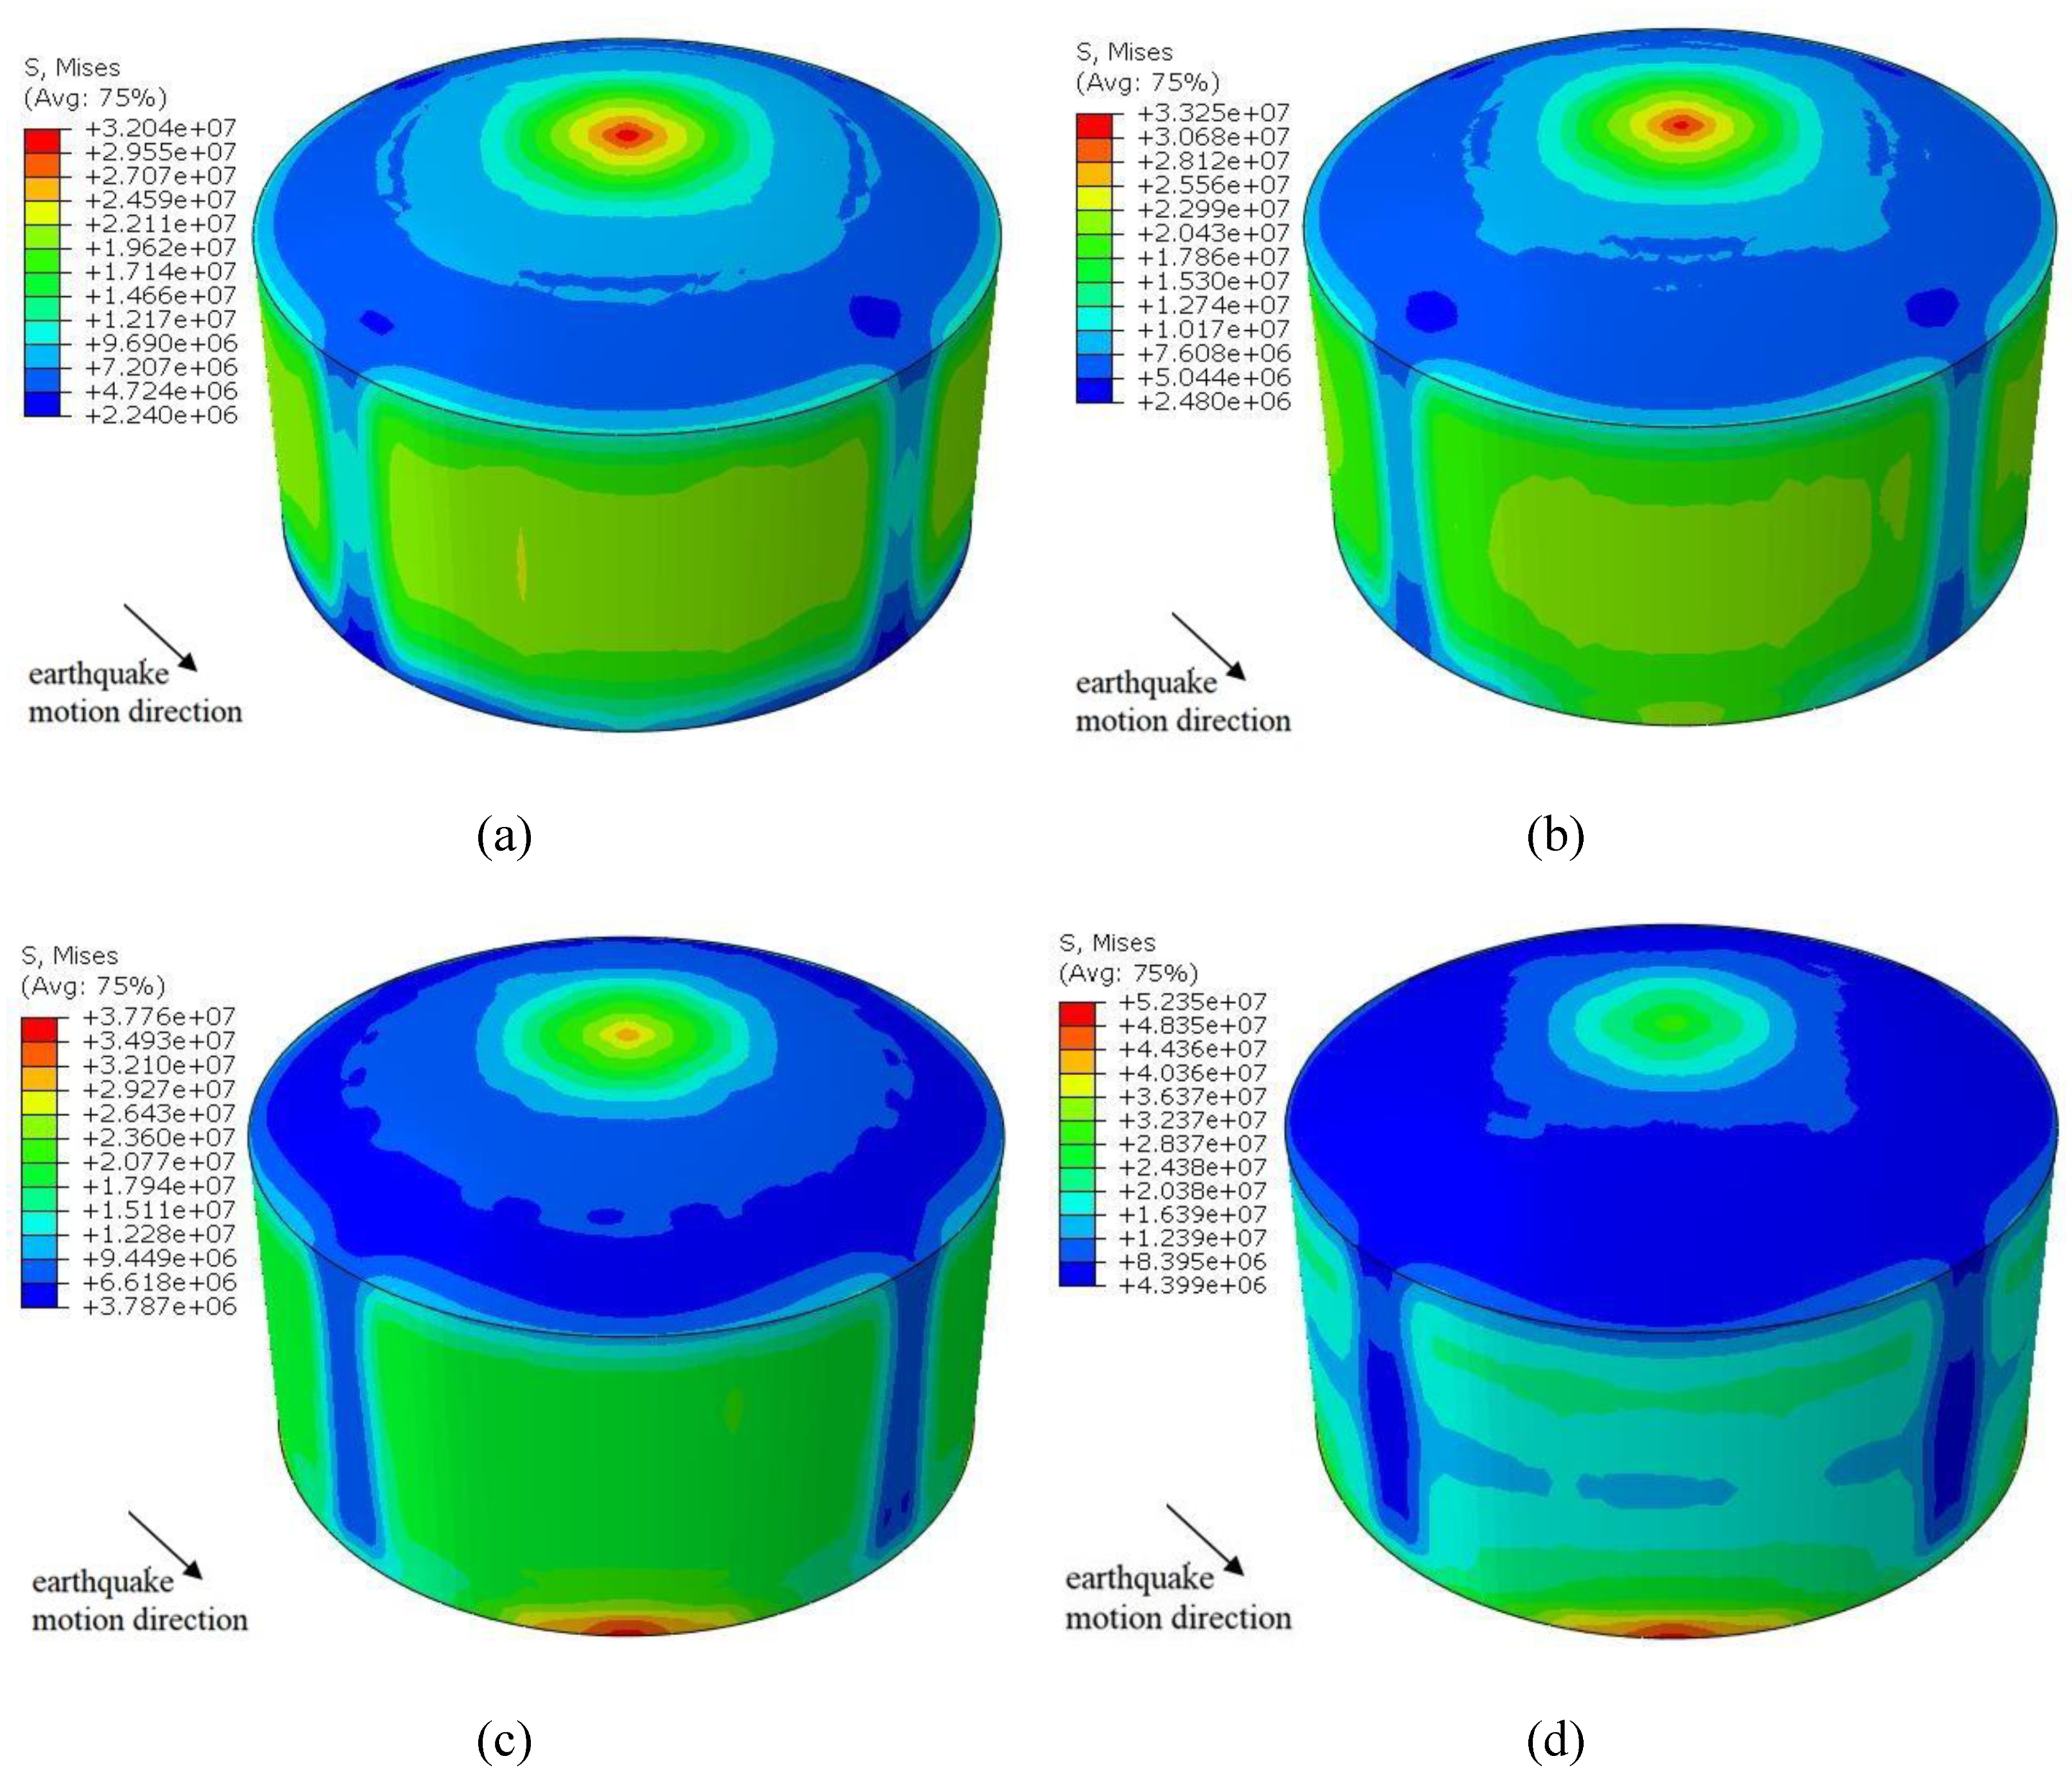
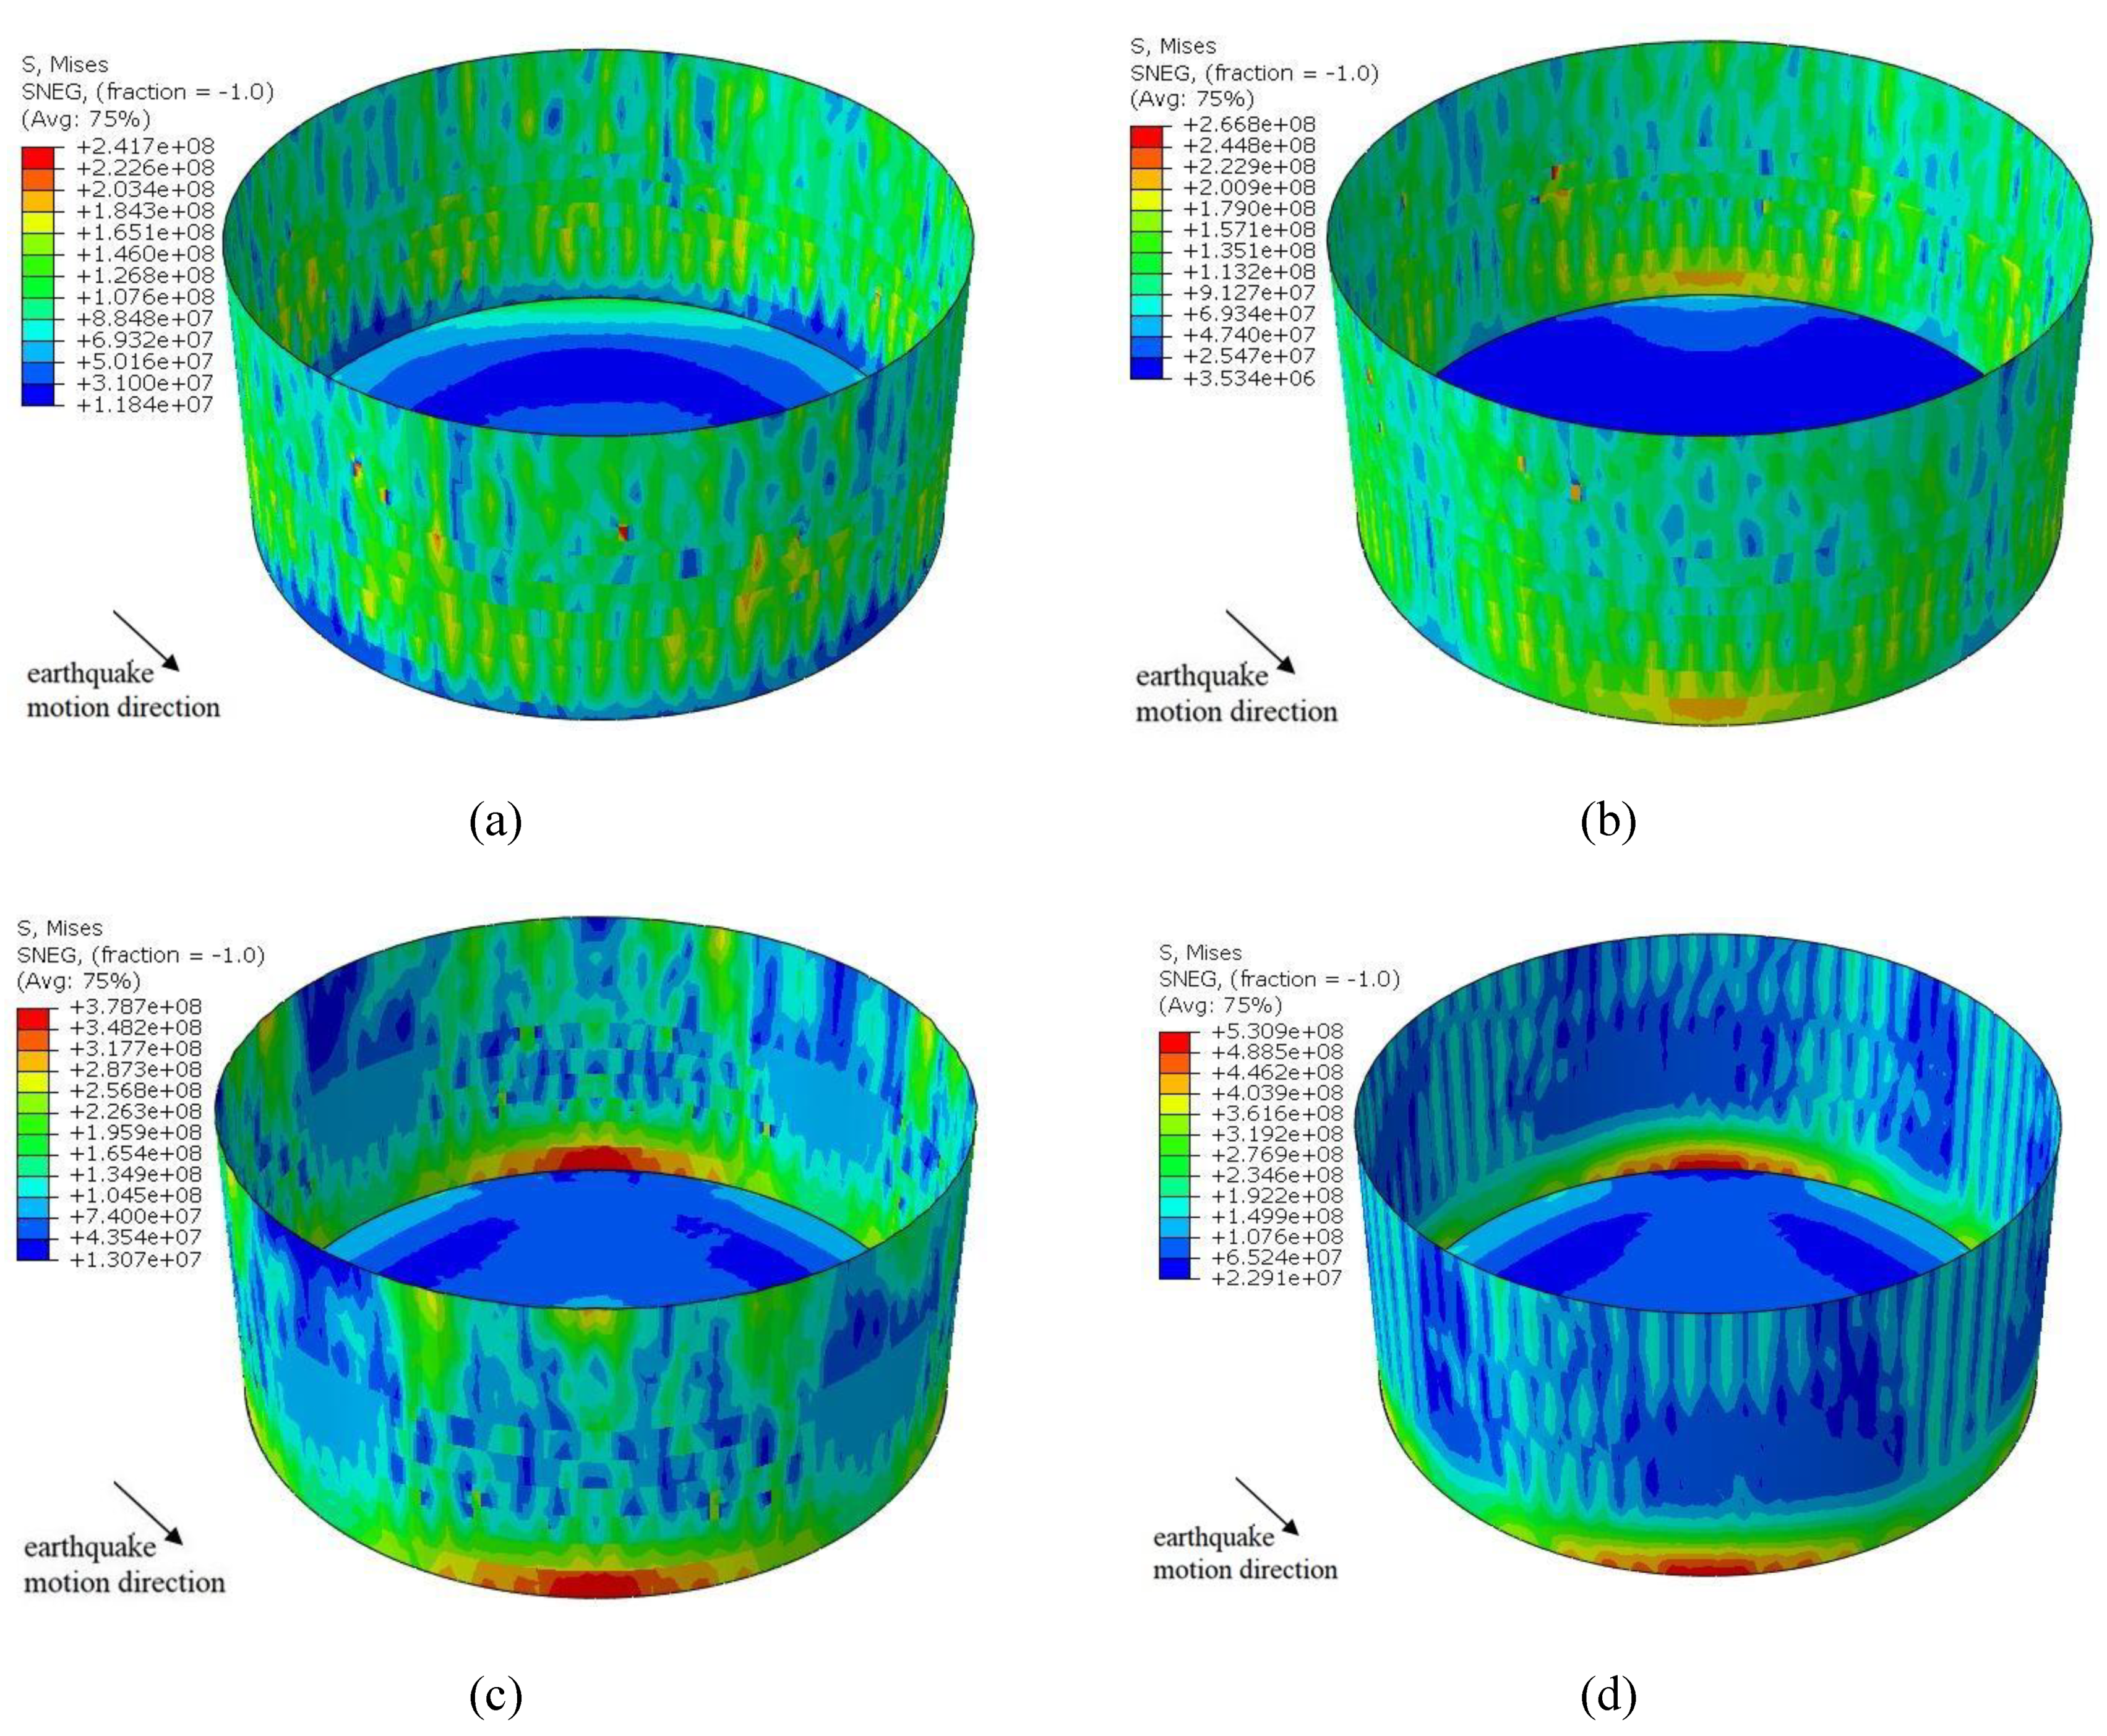
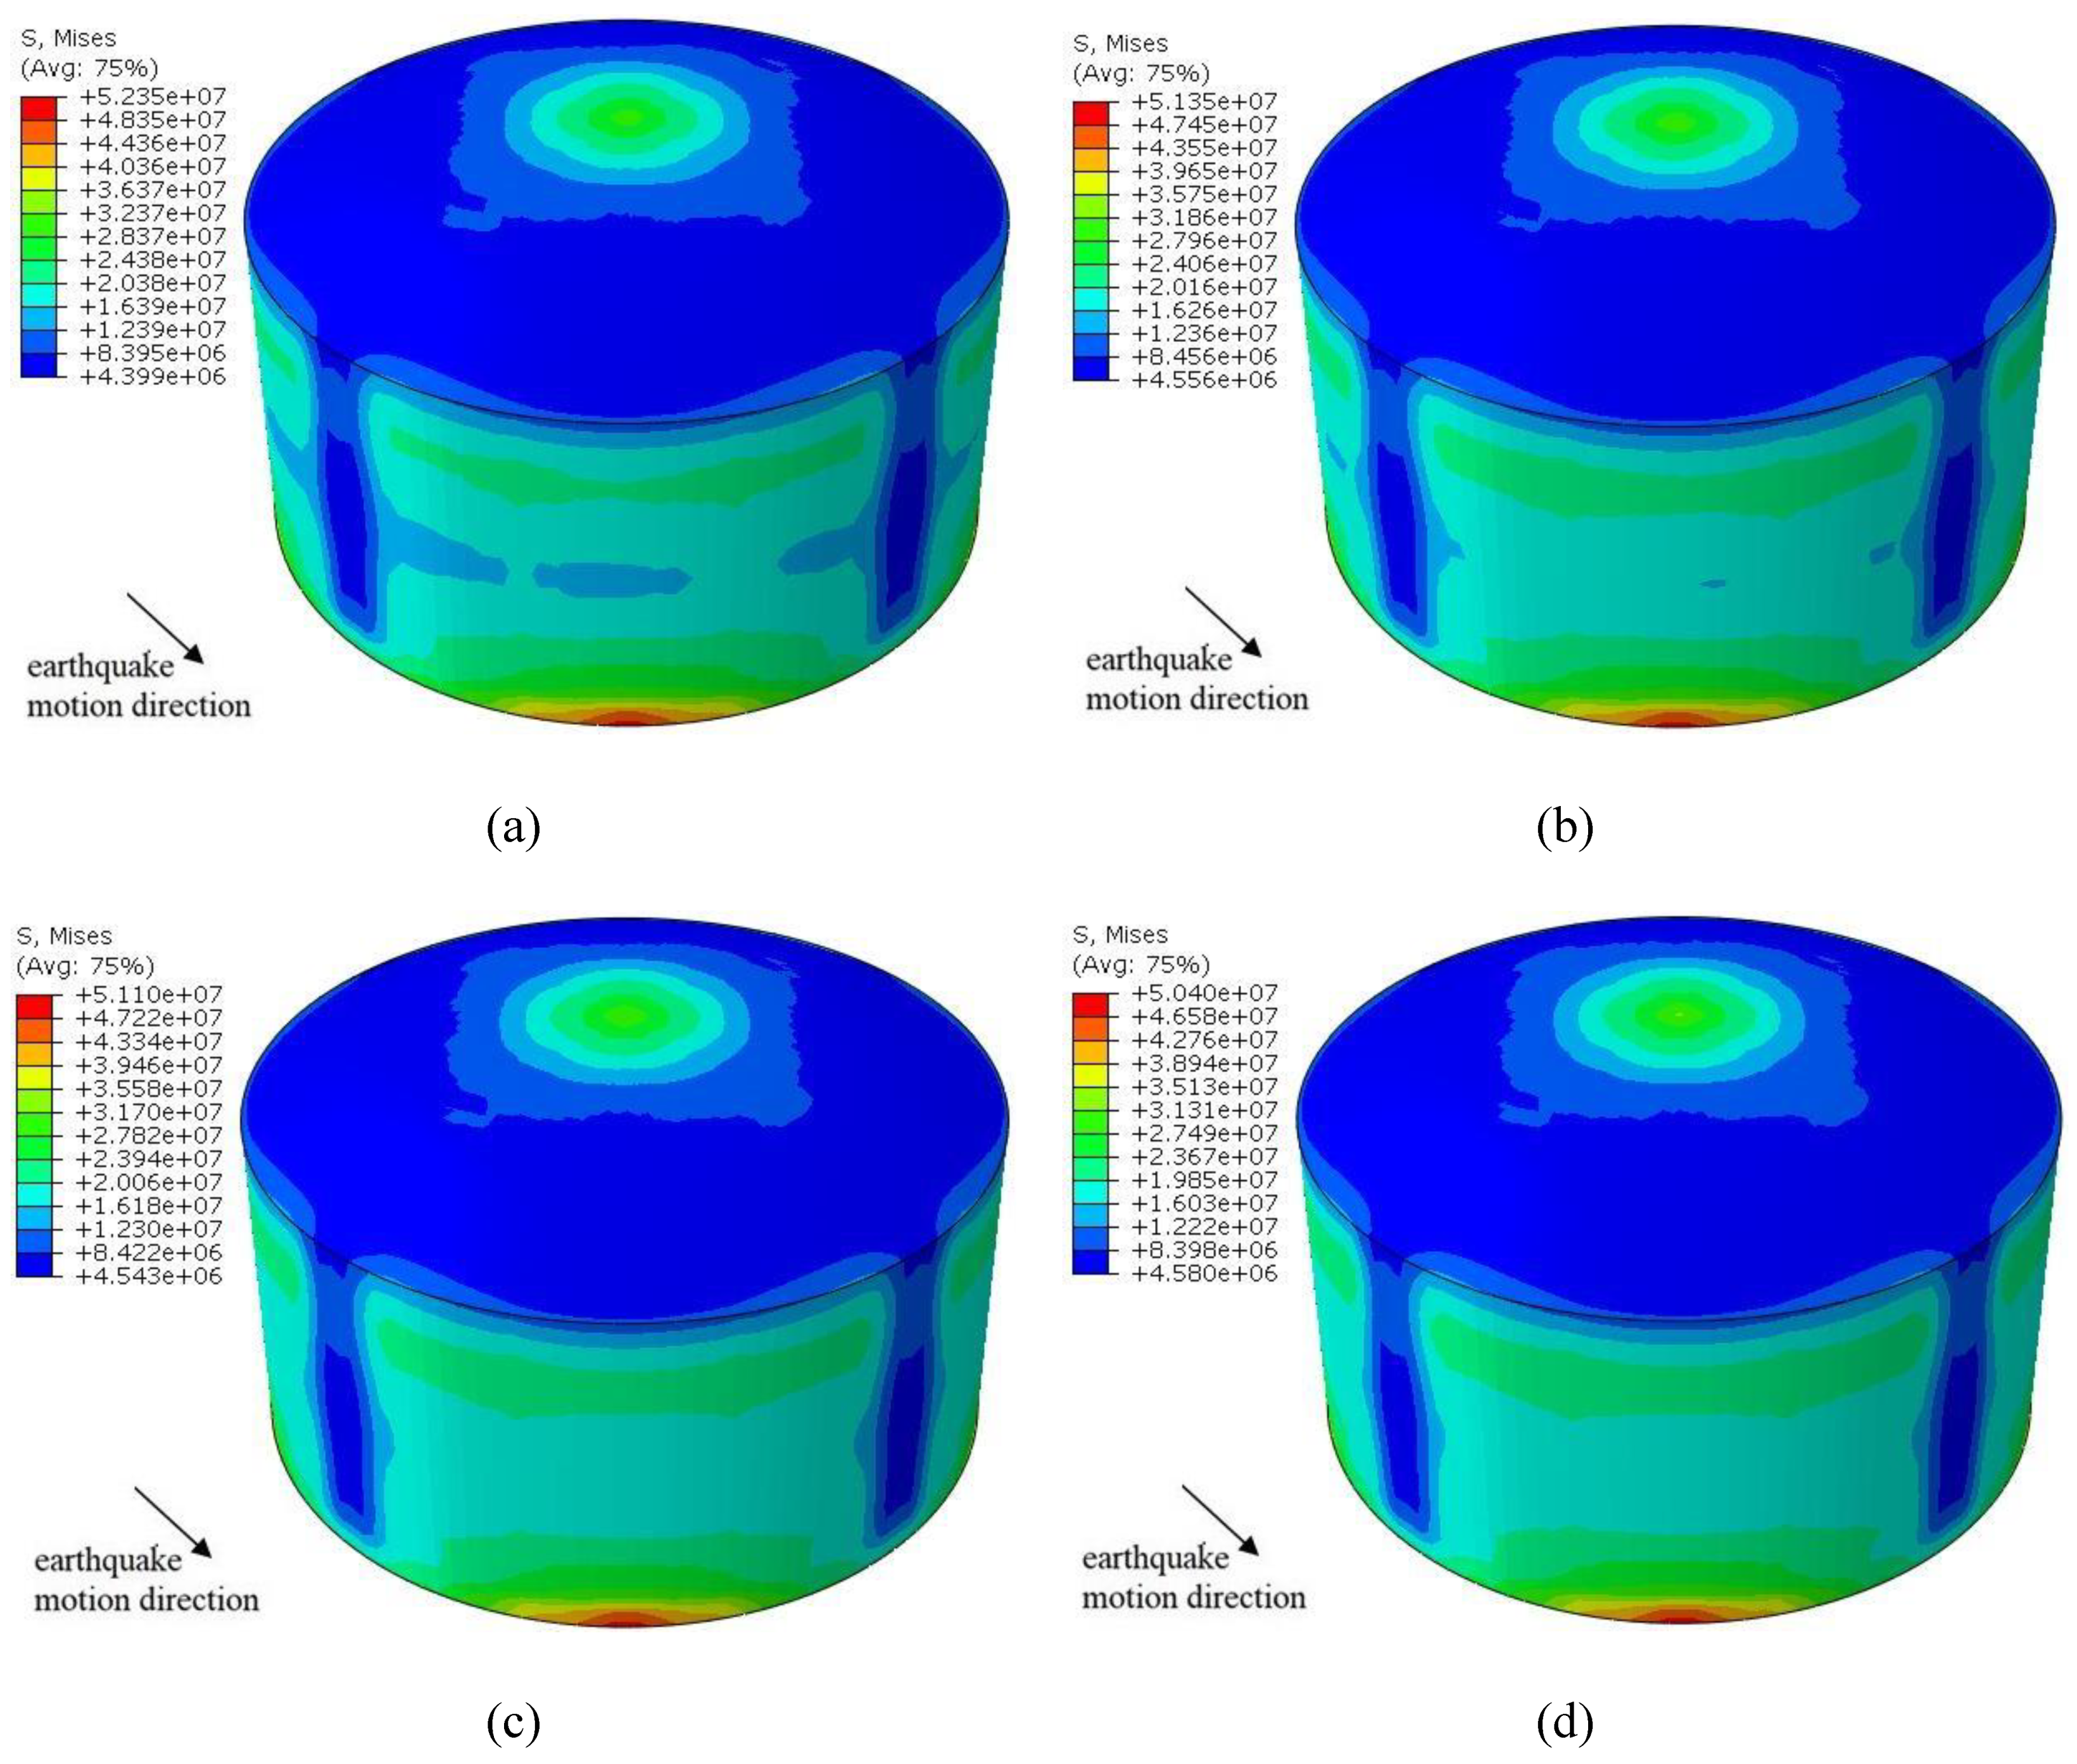
Out of the 12 seismic waves in four site classes, the San Fernando seismic wave produces the largest stress on the outer and inner tank under different liquid volume. Therefore, in Figure 7 and Figure 8, the San Fernando wave is selected to compare the maximum stress experienced by the outer and inner tank at different liquid volumes. In addition, to compare the maximum stress at different site conditions in Figure 9 and Figure 10, each site is represented by one of the three seismic waves that produces the greatest stress on the outer and inner tank. Therefore, Taft, Hollister, and Loma Prieta are selected for Class II, Class III, and Class IV, respectively. Furthermore, when comparing the four different site conditions, each model is filled with 100% LNG, which produces the greatest von Mises stress on the outer and inner tank compared to other liquid volumes.
In general, stress distribution on the outer tank exhibits a symmetrical trend about the X- and Z-axis. Figure 7 shows the respective maximum stress of the outer tank with LNG levels of 25%, 50%, 75% and 100%. Under the same liquid level, the level of stress on the outer tank is the largest in Class I, followed by Class II, Class III and Class IV, though their values are relatively similar. In addition, under the same site class, the stress distribution on the outer tank is minimally affected by different liquid levels. On the other hand, the location of maximum stress on the outer tank changes depending on liquid level. With LNG liquid levels of 25% and 50%, the maximum stress of the outer tank is located at the dome; however, with LNG liquid levels of 75% and 100%, the maximum stress of the outer tank is at the bottom of the tank. This phenomenon occurs because gravity plays a more important role than pressure with LNG liquid levels of 25% and 50%, and pressure at the bottom increases at a much faster rate relative to the dome as liquid level rises. Furthermore, the maximum stress of the outer tank is nearly identical at the liquid level of 25%, 50%, and 75%, but the maximum stress of the outer tank increases significantly from 75% liquid level to 100% liquid level. As a result, more extensive design and analysis considerations should be paid to the dome and bottom of large LNG tanks depending on the liquid level. The more vulnerable sections of the tank may need to be specifically strengthened.
When the tank is filled with 100% LNG, the maximum stress of the inner tank is above 500 MPa in all four site classes, which jeopardizes the safety of the structure considering the fact that the yield strength of 9% steel is between 500 MPa and 600 MPa [38]. Because the consequences of large LNG tank failure are severe, it is imperative to reduce the stress on the inner tank to ensure their safety. At the same time, an early warning system should be implemented to control the maximum liquid level. Different from the outer tank, the stress of the inner tank changes significantly with the liquid level. When the liquid level is at 25% and 50%, the maximum stress of the inner tank is below 300 MPa. At a liquid level of 75% and 100%, maximum stress exceeds 300 MPa and 500 MPa, respectively. With an increase in the amount of LNG, the stress at the base of the inner tank gradually increases to notable levels. Therefore, the bottom of the tank warrants close attention during design and construction.
The structural behaviour of the inner tank at different location types is also individually analyzed. Under the same liquid level, the inner tank behaves similarly to the outer tank with the stress in Class I being the largest, Class II being second largest, and Class III and IV being the smallest. Under 100% liquid level, the stress of the inner tank differs significantly under different site classes. Therefore, considering their behaviour at different location types, close attention should be paid to the design of LNG tanks under high liquid levels.
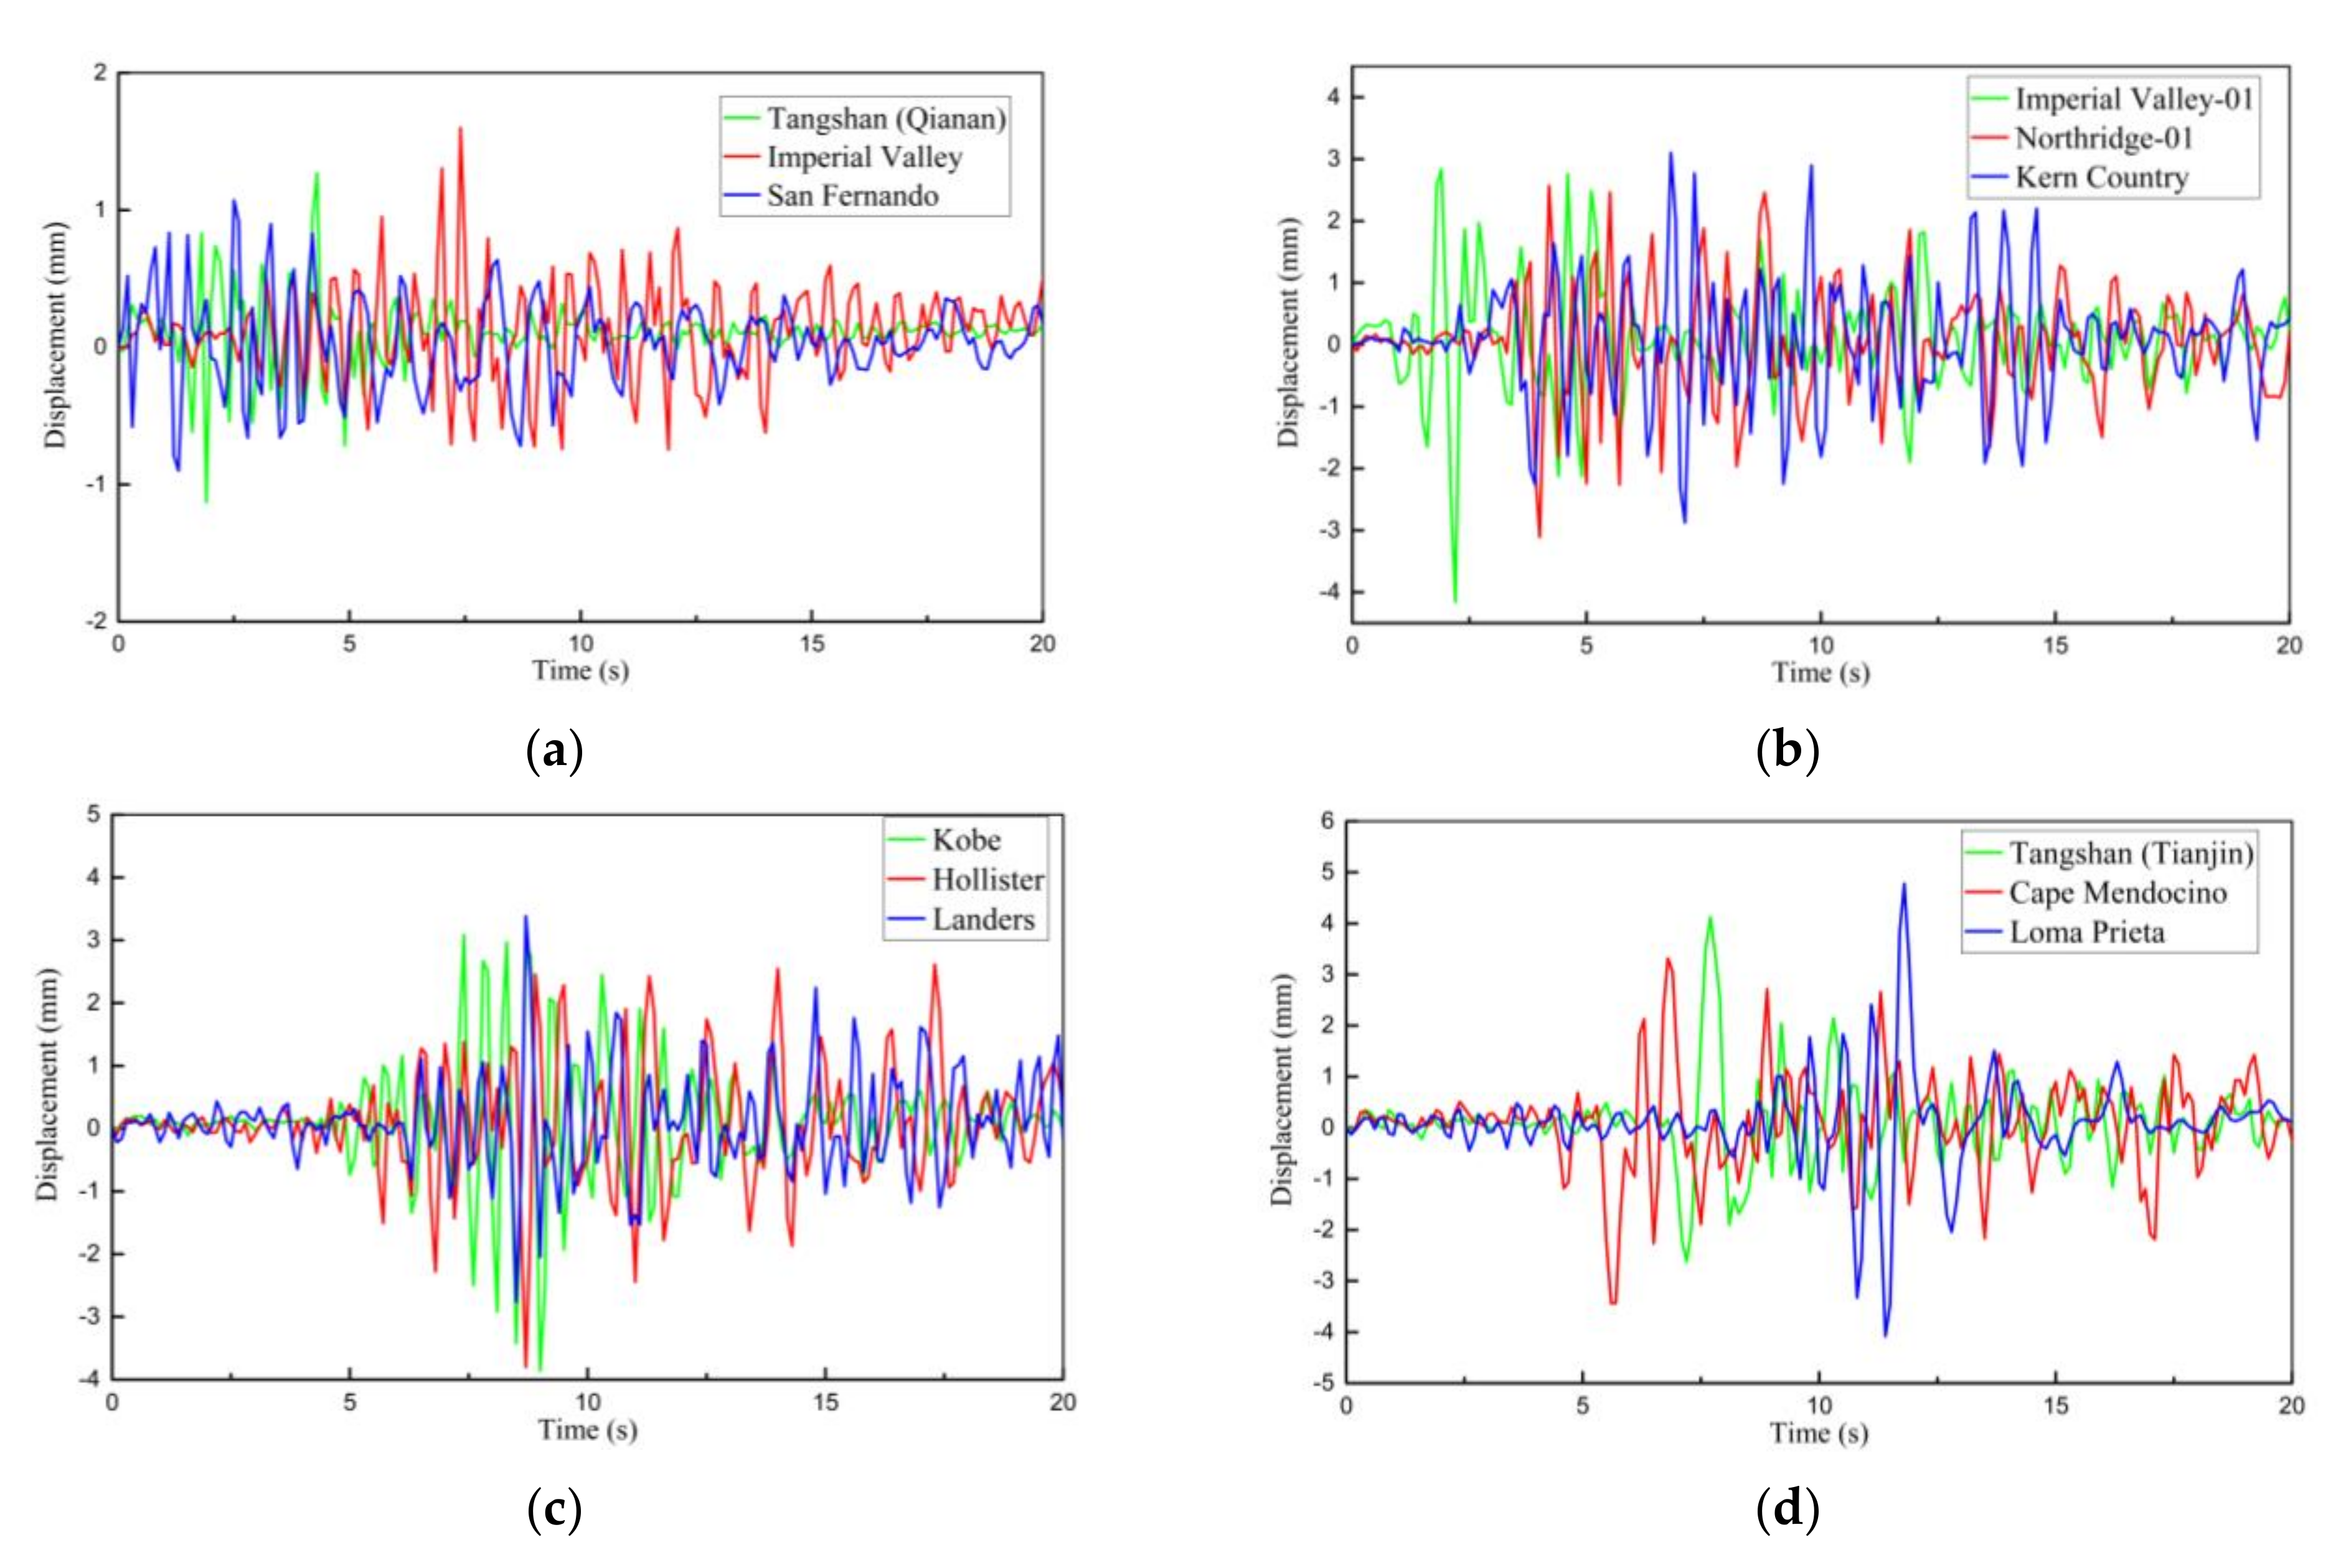
The rationale for selecting applicable conditions for displacement analysis of the outer tank is similar to the aforementioned rationale for stress analysis. To compare the effect of site conditions on the tip displacement of the outer tank, each case is modelled with 100% LNG as the most critical liquid level in Figure 11. In addition, to compare the tip displacement of the outer tank for different liquid volume, Class IV is selected for having the largest tip displacement, as shown in Table 10. The maximum tip displacements of the outer tank at different liquid volume and different site conditions are summarized in Table 10. A more concise summary is shown in Table 11 by averaging the maximum displacements produced by seismic waves within the same site condition. In most cases, under the same liquid height, Class IV experiences the largest displacement, followed by Class III, Class II, and Class I. This phenomenon indicates that less ideal site conditions correspond to greater tip displacements of an LNG storage tank. In addition, this phenomenon is consistent with the Chinese seismic code [37], which states that site differences directly affect the seismic design of the structure. An exception to this phenomenon is the El Centro seismic wave of site Class II with a displacement similar to the waves in site Class IV. Because the characteristic period of the El Centro wave is closer to the natural vibration period of the structure, the vibration of structures under the El Centro wave is more sensitive to increasing liquid levels. Other exceptions include Kobe and Landers waves under site Class III, where displacement decreases with the increase in liquid volume. More specifically, tip displacement of the outer wall is greater at 25% liquid level than at 50% liquid level. This phenomenon may be a result of the complicated relationship between frequency of solid–liquid coupling, sloshing frequency, and the characteristic period of seismic waves. The basic natural frequency of solid-liquid coupling decreases with the increase in liquid storage, while the basic natural frequency of liquid sloshing increases with the increase in liquid storage as mentioned in Section 4.3. As a result, the actual tip displacement is less predictable depending on the amount of influence from different contributing factors.
Under the same site class, the displacements produced by the three seismic waves are on a similar level. For the same seismic wave, general trends in the displacement graphs are nearly identical for different liquid volume, and the displacement increases with the increase in liquid volume. The maximum displacement in all four site classes reaches 4.78 mm when the tank is filled with 100% LNG under Loma Prieta wave; the minimum displacement is only 0.64 mm when the tank is filled with 25% LNG under Tangshan Aftershock (Qianan) wave. These values again demonstrate that the displacement response of an LNG storage tank varies according to different site classes and different liquid volume. In Class I and Class II, the displacement is nearly identical at the liquid level of 25% and 50%. However, from 50% liquid level to 75% liquid level, the displacement increases significantly. On the other hand, the tip displacements of the LNG tank at liquid level of 25% and 50% under site Class IV are nearly identical to the displacements at liquid level of 75% and 100% under site Class II. In summary, both liquid volume and site condition are important influencing factors in the dynamic analysis and structural design of LNG tanks.
When comparing the base shear of the tank at different liquid depths as shown in Figure 12 and Figure 13, both Class III and Class IV are selected to represent the most critical soil types. More specifically, Class III produces the greatest base shear under 75% and 100% liquid levels, followed by site Class IV, site Class II, and site Class I. Class IV produces the greatest base shear under 25% and 50% liquid levels, followed by site Class III, site Class II, and site Class I. When comparing the effect of site conditions on the base shear of the tank, each model is again modelled with 100% LNG as the most critical liquid level in Table 12. The maximum base shear values of the tank at different liquid volume and different site conditions are listed in Table 12 and Table 13 and further summarize the results by averaging the maximum values from the same site condition. The base shear produced by site Class III increases significantly from a liquid level of 25% to 100%. Again, as illustrated in the Chinese building code, site differences directly affect seismic design parameters of a structure including base shear. Generally, base shear increases with the increase in liquid volume with the exception of Tangshan Aftershock and San Fernando seismic waves of site Class I, as well as Tangshan Aftershock and Cape Mendocino seismic waves of site Class IV. For these waves, the base shear of the 50% liquid level is larger than that of 75% liquid level.
Under the same site class, base shear values of the three seismic waves are roughly in the same range. For the same seismic wave, general trends in the base shear graphs are nearly identical for different liquid volume. The variation of peak forces with different liquid volume are also very similar. The maximum base shear in all four site classes reaches 11.16 × 10⁴ KN when the tank is filled with 100% LNG under the Landers wave; the minimum base shear is only 2.75 × 10⁴ KN when the tank is filled with 25% LNG liquid volume under Tangshan Aftershock (Qianan) wave. In addition, the base shear of site Class II only varies slightly for a liquid level of 25% and 50%, but it varies significantly for a liquid level of 75% and 100%. These disparities demonstrate that the base shear of a LNG storage tank is strongly dependent on the corresponding site classes and the liquid level in the tank.
5. Summary and Conclusions

In this study, the modal analysis of large LNG tanks is verified by the basic natural frequency of solid–liquid coupling and the basic natural vibration period of liquid sloshing. A 160,000 m3 LNG prestressed storage tank subjected to 12 earthquake waves under 4 site classes is analyzed using stress distributions on the outer tank and inner tank as well as tip displacement and base shear. Because the sheer size of the LNG tank eliminates any possibility for direct experiments on a physical prototype, SPH-FEM simulation provides a feasible and efficient method to predict its seismic response. The main conclusions drawn from the numerical simulations can be summarized as follows:
  • Stress on the outer tank peaks at 52.3 MPa in Class I and diminishes from Class II, Class III, to Class IV, although the numbers do not vary significantly. In addition, stress on the outer tank is minimally affected by the liquid level.
  • The maximum stress of the inner tank is above 500 MPa at 100% liquid levels in all four site classes and creates significant safety hazards. The design optimization and the establishment of an early warning system are imperative to the control of high liquid levels.
  • Under the liquid level 75% and 100%, site class III exhibits the largest base shear, followed by Class IV, Class II, and Class I. Base shear values across four site classes only vary slightly for a liquid level of 25% and 50%, but they vary significantly for a liquid level of 75% and 100%.
  • Under the same liquid level, Class IV exhibits the greatest tip displacement, followed by site Class III, site Class II, and site Class I. This phenomenon indicates that less than ideal site conditions lead to greater tip displacement on the LNG storage tank. In addition, the tip displacements at liquid level of 25% and 50% under site Class IV are on a similar level as the tip displacement at liquid level of 75% and 100% under site Class II.
  • Because structures respond differently under different site conditions, the different stress, displacement, and base shear values can serve as a basis for determining safety factors associated with each site condition. Appropriate site-based safety factors can minimize material cost and improve economic feasibility without jeopardizing structural safety.
Therefore, liquid volume and site conditions are important influencing factors in the dynamic analysis and structural design of LNG tanks. A substantial growth of LNG consumption in China is accompanied by the construction of large LNG storage infrastructure that requires extra caution in its seismic design and analysis. Although site classification is an important design parameter that influences the seismic behaviour of LNG tanks, no previous literature has analyzed its effect in detail. Therefore, the research findings of this paper provide an important reference for the seismic design and dynamic analysis of large LNG storage tanks considering different site conditions.

Author Contributions

Conceptualization, Y.Z.; methodology, H.-N.L.; software, Y.Z.; data curation, S.Z.; formal analysis, O.M.; validation, C.Z.; writing—review and editing, Y.Z. and S.Z.; supervision, H.-N.L. and O.M. All authors have read and agreed to the published version of the manuscript.

Funding

This research was supported by the Natural Science Foundation of China (grant no.51738007), and Natural Sciences and Engineering Research Council of Canada (NSERC) Discovery (201606290) Program. Any opinions, findings, conclusions, and recommendations expressed here are those of the authors and do not necessarily reflect the views of the sponsors.

Acknowledgments

The authors would like to express their appreciation to Dong Zhiqian for his input and providing generously us with some data.

Conflicts of Interest

The authors declare no conflict of interest.

Nomenclature

W(x)kernel function
hsmoothing length
ρdensity, kg/m3
∆t Time Step Size
N number of particles
ggravitational acceleration
mmass of particle
cslocal speed of sound
ηvolumetric compressibility
σstress
νvelocity
αDirection of coordinates
βDirection of coordinates
υPoisson ratio
ξsmall positive number
ithe ith component of a vector

References

  1. Jia, J. Offshore Structures versus Land-Based Structures; Springer Science and Business Media LLC: Berlin/Heidelberg, Germany, 2016; pp. 73–106. [Google Scholar]
  2. Zhai, X.; Zhao, X.; Wang, Y. Numerical Modeling and Dynamic Response of 160,000-m3 Liquefied Natural Gas Outer Tank under Aircraft Impact. J. Perform. Constr. Facil. 2019, 33, 04019039. [Google Scholar] [CrossRef]
  3. Sun, J.G. Isolation of Large Vertical Storage Tanks: Theory, Methods and Test; Science Press: Washington, DC, USA, 2009. [Google Scholar]
  4. Edwards, N.W. A Procedure for the Dynamic Analysis of Thin Walled Cylindrical Liquid Storage Tanks Subjected to Lateral Ground Motions; University of Michigan: Ann Arbor, MI, USA, 1969. [Google Scholar]
  5. Veletsos, A. Seismic effects in flexible liquid storage tanks. In Proceedings of the 5th World Conference on Earthquake Engineering; Bulletin of the Seismological Society of America: McLean, VA, USA, 1974. [Google Scholar]
  6. Veletsos, A.; Yang, J. Dynamics of fixed-base liquid storage tanks. In Proceedings of the US–Japan Seminar for Earthquake Engineering Research with Emphasis on Lifeline Systems, Tokyo, Japan, 8–12 November 1976. [Google Scholar]
  7. Haroun, M.A.; Housner, G.W. Dynamic interaction of liquid storage tanks and foundation soil. In Dynamic Response of Structures: Experimentation, Observation, Prediction and Control; ASCE: Reston, VA, USA, 1981. [Google Scholar]
  8. Tedesco, J.W.; Landis, D.W.; Kostem, C.N. Seismic analysis of cylindrical liquid storage tanks. Comput. Struct. 1989, 32, 1165–1174. [Google Scholar] [CrossRef]
  9. Malhotra, P.K.; Wenk, T.; Wieland, M. Simple Procedure for Seismic Analysis of Liquid-Storage Tanks. Struct. Eng. Int. 2000, 10, 197–201. [Google Scholar] [CrossRef] [Green Version]
  10. Christovasilis, I.P.; Whittaker, A.S. Seismic Analysis of Conventional and Isolated LNG Tanks Using Mechanical Analogs. Earthq. Spectra 2008, 24, 599–616. [Google Scholar] [CrossRef]
  11. Zhang, R.; Weng, D. Assessment of the seismic effect of insulation on extra-large cryogenic liquid natural gas storage tanks. J. Loss Prev. Process. Ind. 2014, 30, 9–16. [Google Scholar] [CrossRef]
  12. Nguyen, D.-D.; Thusa, B.; Park, H.; Lee, H.; Lee, T.-H. Effects of mechanical properties of LRB on seismic performance of base-isolated NPP structures. In Proceedings of the 25th International Conference on Structural Mechanics in Reactor Technology (SMiRT 25), Charlotte, NC, USA, 4–9 August 2019. [Google Scholar]
  13. Hou, G.; Zhang, C.; Jia, X.; Song, T. Theoretical solution of Mises stress to the LNG storage tank with elastic walls under seismic excitations. J. Harbin Eng. Univ. 2015, 36, 1042–1048. [Google Scholar]
  14. Chen, Y.; Zhai, X.; Wang, Y. Numerical study on the dynamic response of a massive liquefied natural gas outer tank under impact loading. J. Zhejiang Univ. Sci. 2019, 20, 823–837. [Google Scholar] [CrossRef]
  15. Zhao, Y.; Li, H.-N.; Fu, X.; Zhang, S.; Mercan, O. Seismic Analysis of a Large LNG Tank considering the Effect of Liquid Volume. Shock. Vib. 2020, 2020, 1–18. [Google Scholar] [CrossRef]
  16. Attaway, S.; Heinstein, M.; Swegle, J. Coupling of smooth particle hydrodynamics with the finite element method. Nucl. Eng. Des. 1994, 150, 199–205. [Google Scholar] [CrossRef]
  17. Kalateh, F.; Koosheh, A. Simulation of cavitating fluid–Structure interaction using SPH–FE method. Math. Comput. Simul. 2020, 173, 51–70. [Google Scholar] [CrossRef]
  18. Liang, S.; Chen, Z. SPH-FEM coupled simulation of SSI for conducting seismic analysis on a rectangular underground structure. Bull. Earthq. Eng. 2018, 17, 159–180. [Google Scholar] [CrossRef]
  19. Fragassa, C.; Topalovic, M.; Pavlovic, A.; Vulovic, S. Dealing with the Effect of Air in Fluid Structure Interaction by Coupled SPH-FEM Methods. Materials 2019, 12, 1162. [Google Scholar] [CrossRef] [PubMed] [Green Version]
  20. Chen, J.K.; Beraun, J.E.; Jih, C.J. An improvement for tensile instability in smoothed particle hydrodynamics. Comput. Mech. 1999, 23, 279–287. [Google Scholar] [CrossRef]
  21. Liu, G.R.; Liu, M.B. Smoothed Particle Hydrodynamics: A Meshfree Particle Method; World Scientific Pub Co Pte Lt: Singapore, 2003. [Google Scholar]
  22. ABAQUS 6.13. Abaqus Analysis User’s Manual; Dassault Systèmes Simulia Core: Vélizy-Villacoublay, France, 2013. [Google Scholar]
  23. Li, Y.; Chen, Z.; Ren, X.; Tao, R.; Gao, R.; Fang, D. Experimental and numerical study on damage mode of RC slabs under combined blast and fragment loading. Int. J. Impact Eng. 2020, 142, 103579. [Google Scholar] [CrossRef]
  24. Li, J.; Guan, Y.; Wang, G.; Zhao, G.; Lin, J.; Naceur, H.; Coutellier, D. Meshless modeling of bending behavior of bi-directional functionally graded beam structures. Compos. Part B Eng. 2018, 155, 104–111. [Google Scholar] [CrossRef]
  25. Jin, Z.; Yin, Z.-Y.; Kotronis, P.; Jin, Y.-F. Numerical investigation on evolving failure of caisson foundation in sand using the combined Lagrangian-SPH method. Mar. Georesources Geotechnol. 2018, 37, 23–35. [Google Scholar] [CrossRef] [Green Version]
  26. Salehi, F.; Shamsoddini, R. SPH simulation of the penetrating object in the wet soil. Géoméch. Geoengin. 2020, 2020, 1–11. [Google Scholar] [CrossRef]
  27. El-Gammal, T.; Khalil, E.E.; Haridy, H.; Abo-Serie, E. Influence of Smoothing Length and Virtual Particles on SPH Accuracy. Int. J. Mater. Mech. Manuf. 2013, 1, 166–170. [Google Scholar] [CrossRef] [Green Version]
  28. Housner, G.W. Dynamic Pressures on Accelerated Fluid Containers; Bulletin of the Seismological Society of America: McLean, VA, USA, 1957; Volume 47. [Google Scholar]
  29. Jaiswal, O.; Kulkarni, S.; Pathak, P. A study on sloshing frequencies of fluid-tank system. In Proceedings of the 14th World Conference on Earthquake Engineering, Beijing, China, 12–17 October 2008. [Google Scholar]
  30. Lv, N.N.; Xie, J.; Yang, J.J. Review on Construction Technology of Large LNG Low Temperature Storage Tank. Unique Constr. 2010, 27, 105–108. [Google Scholar]
  31. Fang, H.; Wu, H.; Wang, D.G.; Chen, X.G. Review of research on seismic safety of liquid storage tanks. Earthq. Disaster Prev. Technol. 2012, 7, 144–151. [Google Scholar]
  32. Huang, S.N.; Wang, Z.Q. The first 160,000 m3 full capacity LNG storage tank in China. Pet. Eng. Constr. 2009, 35, 15–17. [Google Scholar]
  33. Wang, Y.Z.; Fu, C.G. Structural Engineering Analysis of Abaqus and Detailed Explanation of Examples; China Building Industry Press: Beijing, China, 2010. [Google Scholar]
  34. Shi, Y.P.; Zhou, Y.R. Example and Analysis of Finite Element Software ABAQUS; Machine Press: Beijing, China, 2006. [Google Scholar]
  35. Gu, A.Z.; Jin, Q.G.; Ju, Y.L.; Wang, J. Technical Manual for Liquefied Natural Gas; Machine Press: Beijing, China, 2010. [Google Scholar]
  36. Standard for Aseismic appraisal of Atmospheric Vertical Cylindrical Storage Steel Tanks; SH/T 3026–2005; Sinopec Publishing House: Beijing, China, 2006.
  37. Ministry of Housing and Urban-Rural Development of China. Code for Seismic Design of Buildings GB 50011-20102010; Ministry of Housing and Urban-Rural Development of China: Beijing, China, 2010.
  38. Standardization Administration Committee of the People’s Republic of China. 9% Nickel Steel Plates for Pressure Vessels with Specified Low Temperature Properties; Standardization Administration Committee of the People’s Republic of China: Beijing, China, 2010.
Figure 1. Computational flowchart of Smoothed Particle Hydrodynamics-Finite Element Method (SPH-FEM) coupling method.
Applsci 10 08121 g001
Figure 2. Displacement vs. time graph for the new loading condition.
Applsci 10 08121 g002
Figure 3. SPH-FEM simulation results of liquid sloshing with different element sizes at time 2.0 s; (a) 3 mm, (b) 5 mm, (c) 7.5 mm, (d) 10 mm.
Applsci 10 08121 g003aApplsci 10 08121 g003b
Figure 4. LNG storage tank cross section (unit: mm) [15].
Applsci 10 08121 g004
Figure 5. FEM of the LNG storage tank; (a) the entire LNG tank, (b) the outer tank, (c) the inner tank.
Applsci 10 08121 g005
Figure 6. Acceleration response spectra for ground motions and for code specifications; (a) Site class I, (b) Site class II, (c) Site class III, (d) Site class IV.
Applsci 10 08121 g006
Figure 7. The maximum von Mises stress distribution on the outer tank at different LNG liquid levels under San Fernando seismic wave; (a) At 25% full, (b) At 50% full, (c) At 75% full, (d) At 100% full.
Applsci 10 08121 g007
Figure 8. The maximum von Mises stress distribution on the inner tank at different LNG liquid levels under San Fernando seismic wave; (a) At 25% full, (b) At 50% full, (c) At 75% full, (d) At 100% full.
Applsci 10 08121 g008
Figure 9. The maximum von Mises stress distribution of the outer tank at 100% liquid volume under different site conditions; (a) Site class I, (b) Site class II, (c) Site class III, (d) Site class IV.
Applsci 10 08121 g009
Figure 10. The maximum von Mises stress distribution of the inner tank at 100% liquid volume under different site conditions; (a) Site class I, (b) Site class II, (c) Site class III, (d) Site class IV.
Applsci 10 08121 g010
Figure 11. Tip displacement of the outer wall of 100% liquid volume under different site conditions; (a) Site class I, (b) Site class II, (c) Site class III, (d) Site class IV.
Applsci 10 08121 g011
Figure 12. Base shear of the tank of site Class III under different liquid volume; (a) At 25% full, (b) At 50% full, (c) At 75% full, (d) At 100% full.
Applsci 10 08121 g012
Figure 13. Base shear of the tank of site Class IV under different liquid volume. (a) At 25% full, (b) At 50% full, (c) At 75% full, (d) At 100% full.
Applsci 10 08121 g013
Table 1. Material properties of water.
MaterialDensity (kg/m3)Sonic Speed (m/s)Dynamic Viscosity (kg/(m/s)Coefficients of the Equation of State
sΓ0
Water100014800.00100
Table 2. Sloshing frequency results of different element sizes obtained by the SPH-FEM method compared to theoretical and experimental results.
ResultsHousner’s ResultExperimental Result3 mm SPH-FEM Result5 mm SPH-FEM Result7.5 mm SPH-FEM Result10 mm SPH-FEM Result
value1.231.281.221.221.421.58
Table 3. Sloshing frequency results from SPH-FEM method compared to theoretical and experimental results.
Depth of Liquid (mm)Housner’s ResultExperimental ResultSPH-FEM Result
501.231.281.22
1001.541.521.56
1501.641.631.67
2001.681.671.72
Table 4. Thickness of each layer of the inner tank.
Layer12345678910
Thickness (mm)24.922.419.817.314.712.212121212
Table 5. Material characteristics of the LNG prestressed storage tank.
Parameter/MaterialDensity (kg/m3)Modulus of Elasticity (MPa)Poisson’s RatioYield Strength (MPa)
Prestressed concrete25003.6 × 10100.2-
Expanded perlite5611.250.15-
Resilient felt3008000.12-
Rebar HRB40078002 × 10110.3400
Steel cable78001.95 × 10110.31860
9% Ni steel78502.06 × 10110.3600
Table 6. Material properties of LNG.
MaterialDensity (kg/m3)Sonic Speed (m/s)Dynamic Viscosity (kg/(m·s))Coefficients of the Equation of State
sΓ0
LNG (liquid)48015000.0011300
Table 7. The basic natural frequency of solid-liquid coupling under different liquid volume.
Case25% Liquid Level50% Liquid Level75% Liquid Level100% Liquid Level
specification4.6373.0992.3811.923
simulation result4.6263.0652.3621.916
Table 8. The basic natural frequency of liquid sloshing under different liquid volume.
Case25% Liquid Level50% Liquid Level75% Liquid Level100% Liquid Level
specification0.07990.0980.1030.105
simulation result0.0810.0920.0980.108
Table 9. Details of 12 ground motions.
Site ClassEventStationTimeVs30
IGround Motion (GM) 1: Tangshan AftershockQianan Lanhe Bridge1976.8.6-
GM2: Imperial ValleySup-Superstition Mountain1979.10.15362
GM3: San FernandoFsd-Santa Felicia Dam1971.2.9389
IIGM4: Imperial Valley-01El Centro Array#91940.5.18213
GM5: Northridge-01Northridge-Saticoy1994.1.17281
GM6: Kern Country, CaliforniaTaft Lincoln School Tunnel1994.1.17385
IIIGM7: KobeNishi-Akashi1995.1.16609
GM8: HollisterHoll Diff Array #11986.1.26215
GM9: LandersIndio-Coachella Canal1992.6.28339
IVGM10: Tangshan AftershockTianjin Hospital1976.11.15-
GM11: Cape MendocinoFortuna-Fortuna Blvd1992.4.25457
GM12: Loma PrietaAlameda Nas Hanger1989.10.18190
Table 10. Maximum tip displacement of the outer wall of different liquid volume under different site conditions (unit: mm).
Site ClassEarthquakes25% Liquid Level50% Liquid Level75% Liquid Level100% Liquid Level
IGM1:Tangshan Aftershock0.640.831.231.27
GM2:Imperial Valley1.161.201.511.60
GM3:San Fernando0.931.011.021.07
IIGM4:Imperial Valley-013.093.103.674.16
GM5:Northridge-011.902.012.463.11
GM6:Kern County, California2.262.432.803.10
IIIGM7:Kobe2.722.443.033.90
GM8:Hollister2.642.563.093.80
GM9:Landers2.002.443.203.38
IVGM10:Tangshan Aftershock2.793.193.784.12
GM11:Cape Mendocino2.683.083.253.43
GM12:Loma Prieta3.594.004.604.78
Table 11. Average tip displacement under each site condition for an outer tank subjected to different liquid levels (unit: mm).
Site Class25% Liquid Level50% Liquid Level75% Liquid Level100% Liquid Level
I0.911.011.251.31
II2.422.512.983.46
III2.452.483.113.69
IV3.023.423.884.11
Table 12. Maximum base shear of the tank of different liquid volume under different site conditions (unit: 104 KN).
Site ClassEarthquakes25% Liquid Level50% Liquid Level75% Liquid Level100% Liquid Level
IGM1:Tangshan Aftershock2.754.043.834.31
GM2:Imperial Valley4.596.366.657.05
GM3:San Fernando3.213.453.443.74
IIGM4:Imperial Valley-015.335.496.226.62
GM5:Northridge-014.144.936.658.55
GM6:Kern County, California5.285.787.617.99
IIIGM7:Kobe4.766.447.178.62
GM8:Hollister5.207.228.148.44
GM9:Landers6.126.748.5911.16
IVGM10:Tangshan Aftershock6.067.876.778.62
GM11:Cape Mendocino6.227.066.907.58
GM12:Loma Prieta6.056.707.849.79
Table 13. Average base shear within each site class for a tank containing different liquid levels. (unit: 104 KN).
Site Class25% Liquid Level50% Liquid Level75% Liquid Level100% Liquid Level
I3.524.624.975.03
II4.925.46.837.72
III5.366.87.979.41
IV6.117.217.178.66
Publisher’s Note: MDPI stays neutral with regard to jurisdictional claims in published maps and institutional affiliations.