1. Introduction
In the automotive industry, the use of lightweight materials such as aluminum and magnesium alloys has been increasing steadily, with the aim of realizing weight reduction of vehicle bodies [
1,
2].
In the case of joining between aluminum alloys and steels by a conventional fusion welding process, the generation of Fe
xAl
y brittle intermetallic compounds at the joining interface is unavoidable, and thus the joining strength is greatly lowered [
3,
4]. To minimize this problem, friction stir spot joining and mechanical fastening processes such as the self-pierce riveting method have been tried in automotive industries [
5,
6,
7,
8,
9,
10]. One of the disadvantages of applying friction stir spot joining and mechanical fastening processes, compared with the resistance spot welding process, is low productivity and the consequent increase of manufacturing costs [
11].
The automated resistance spot welding process is very suitable for the high volume and high rate of production of car bodies. Thus, this welding process is widely used in automotive industries [
12].
In dissimilar metal welding which uses the resistance spot welding process, different material properties (e.g., thermal conductivity, electrical resistivity, and melting point) result in asymmetrical weld nugget formation. In contrast to the conventional spot welding process, the defining feature of DeltaSpot is process tape that runs between the electrodes and the sheets being joined. The reason for using the process tape in a DeltaSpot welding machine is to transfer the welding current while protecting the contact surfaces of the electrodes from contamination by aluminum, zinc, or organic residues. This protection results in a significantly increased service life for the electrodes. By using process tape, not only can the service life of the electrode be improved, but the heat generation characteristics during spot welding can also be changed according to the type of process tape. The problem of nuggets being generated asymmetrically during welding between dissimilar metals by spot welding can be reduced by applying different types of process tape [
13].
On the other hand, it is well known that galvanic corrosion occurs in welded joints of dissimilar material. When we make dissimilar metal welds of Al alloys and steel, an aluminum alloy having a low electrochemical potential becomes an anode, and steel having a high potential becomes a cathode in the corrosive environment [
14,
15,
16,
17]. In the case of dissimilar metal welding of steels and aluminum alloys, galvanic corrosion is more inhibited in galvanized steel and Al than in cold-rolled steel and Al [
18].
In this study, a 440 MPa-class galvannealed steel sheet, one of the materials used in vehicle bodies, was dissimilarly welded to an AA6061-T6 alloy by applying a DeltaSpot process to evaluate the ultimate tensile failure load and corrosion characteristics. Dissimilar welding specimens were prepared under three types of welding conditions: a specimen with only DeltaSpot welding applied, a specimen with adhesive and DeltaSpot welding applied, and a specimen with adhesive and DeltaSpot welding applied after roughening the specimen surface. The spot welded specimens were subjected to a salt spray test, and a tensile shear test was performed on the specimens after the corrosion test ended to compare the apparent shear strength of a single-lap joint-welded specimen by tension loading.
2. Experimental Methods
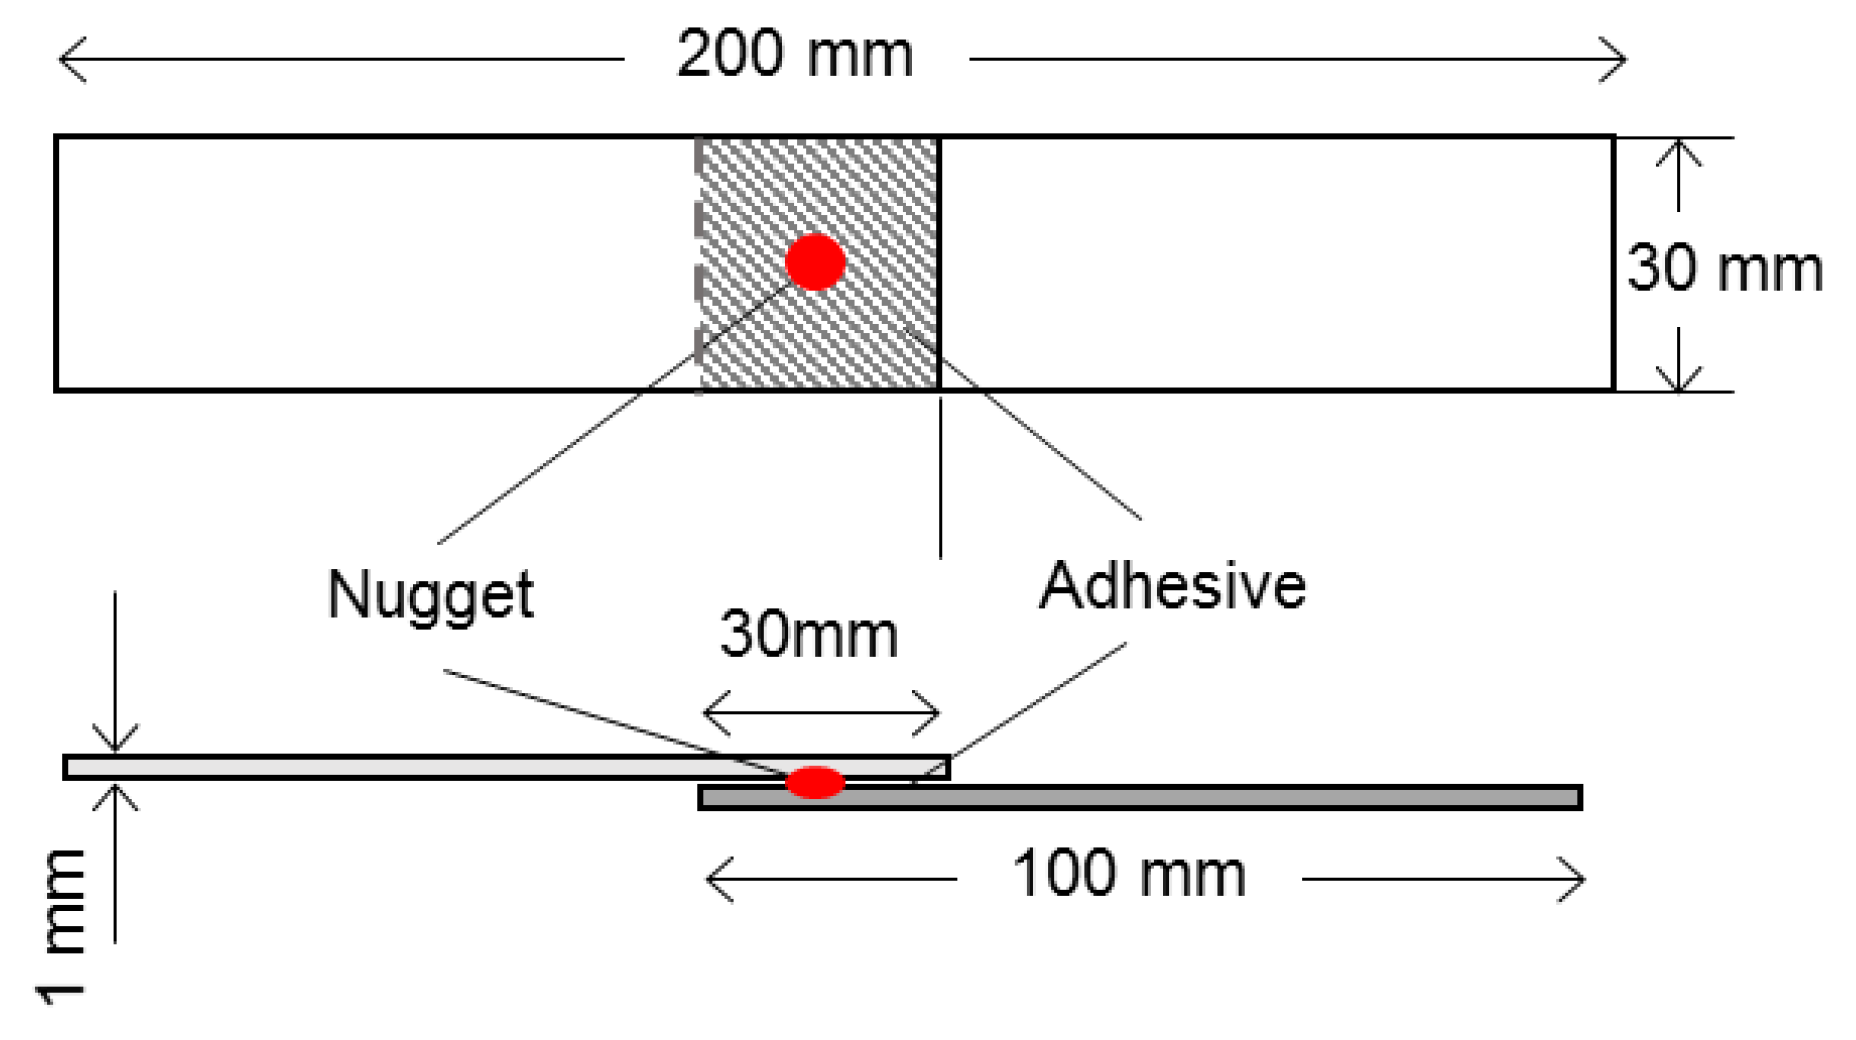
The materials used in this study were 1.0 mm thick 440 MPa-class galvannealed (GA) steel sheets and 1.0 mm thick AA6061-T6 aluminum alloy sheets, which is a heat-treatable alloy based on Al-Mg-Si. The nominal chemical compositions and mechanical properties of the two base materials are listed in
Table 1. Both the aluminum alloy and the galvannealed steel sheets were trimmed into rectangular coupons 30 mm × 100 mm in size, and the configuration and dimensions of the specimens welded for the tensile shear test are shown in
Figure 1.
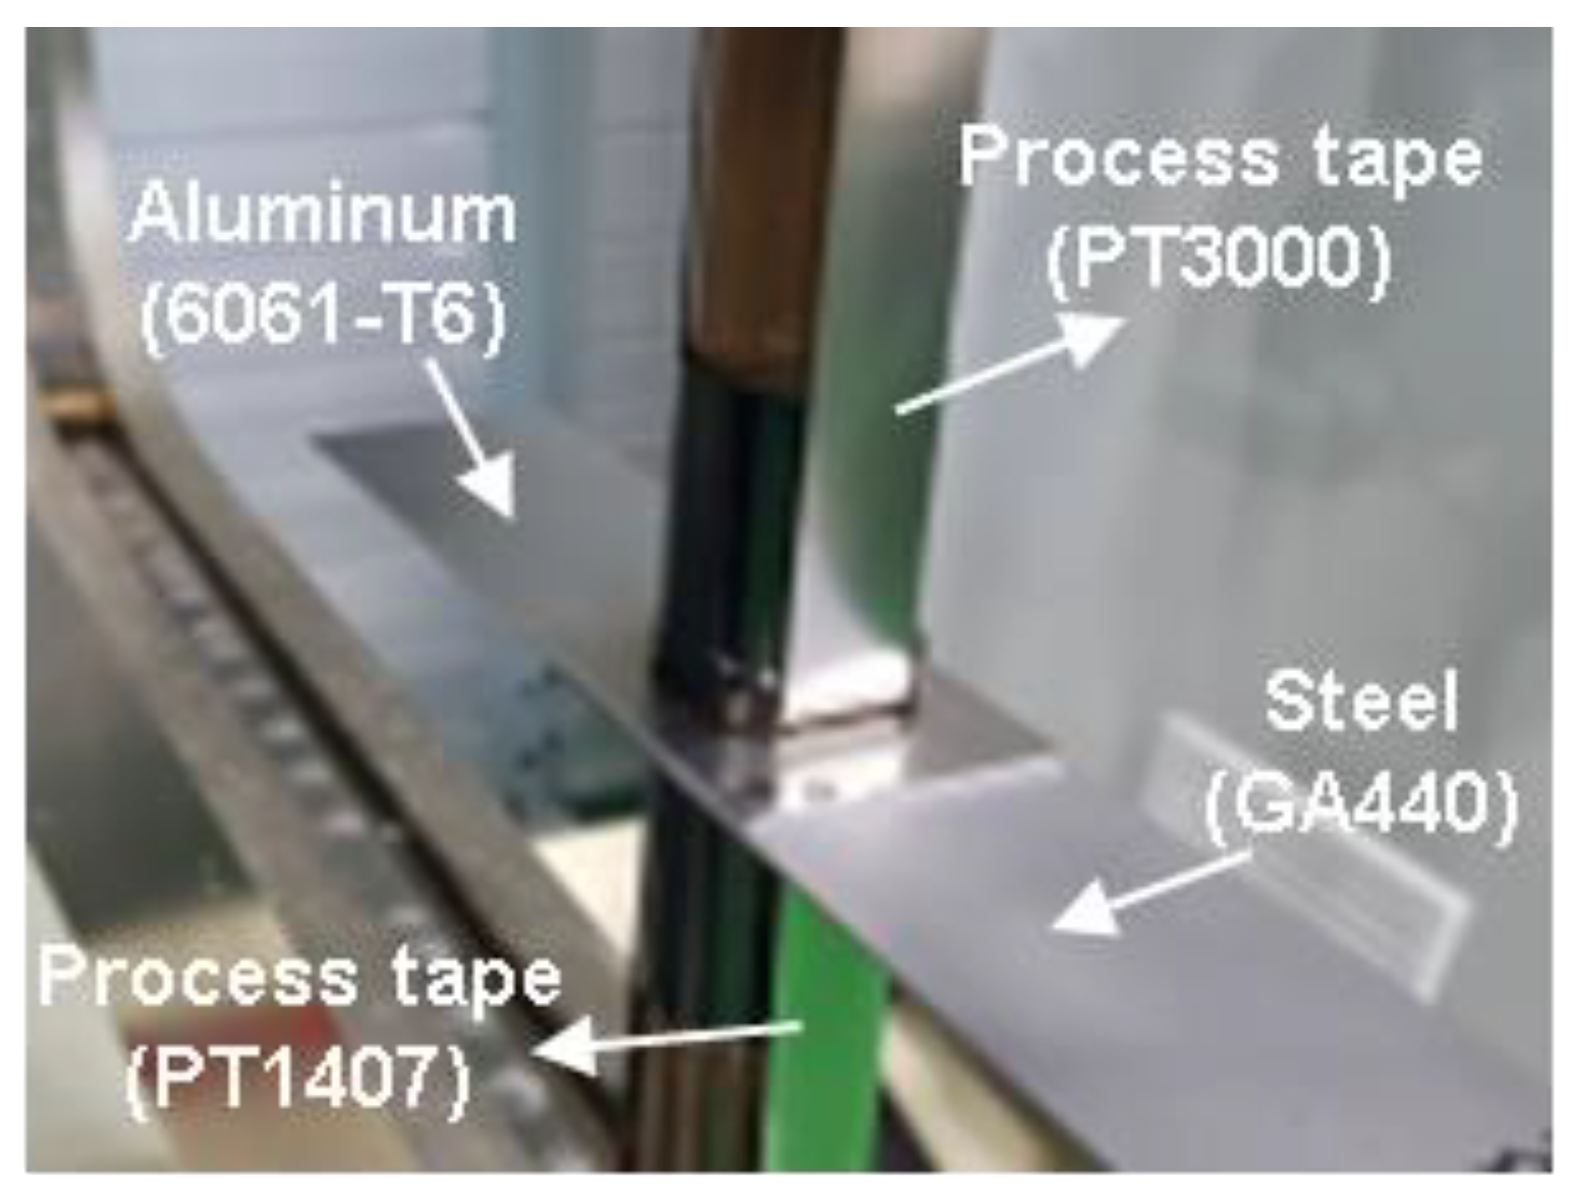
Figure 2 shows the arrangement of the electrodes and the base material for DeltaSpot welding. Different types of process tape were applied to the aluminum and steel sides for DeltaSpot welding. Namely, Cr-Ni-based PT3000 process tape was used on the AA6061-T6 aluminum alloy side, and steel-based PT1407 process tape was used on the galvannealed steel sheet side.
As shown in
Figure 3, three types of specimen combinations were spot welded, and these specimens were used for the salt spray test and tensile shear strength test. Namely, a conventional DeltaSpot-welded specimen (Type 1), a DeltaSpot-welded specimen with adhesive applied to the faying surface between the AA6061-T6 and galvannealed steel sheets (Type 2), and finally a surface-roughened specimen prior to applying the adhesive (Type 3) were prepared [
19,
20]. The epoxy-based D-type structural adhesive, which is generally used for automotive applications, was applied for preparing the Type 2 and Type 3 specimens [
21].
Firstly, the type of process tape and good spot welding conditions were selected by repeating the DeltaSpot test welding for the Type 1 specimen and then, based on this condition, the welding conditions were selected to achieve similar-sized weld nugget diameters for all other types of specimens.
In the case of the adhesive-applied specimens (2 and 3), the amount of heat generated decreased so that a good welding condition could be obtained by increasing the amount of electrode force and the welding current, compared with the normal DeltaSpot welding conditions. The selected welding conditions are shown in
Table 2.
The adhesive was applied to the surface of the AA6061-T6 alloy, and an attempt was made to manually apply the adhesive so it was as thin as possible. However, it was thought that there was a quantitative deviation regarding the amount of coating for each specimen. Upon completion of the adhesive’s application, the galvannealed steel sheets were overlapped, and spot welding was performed. After spot welding, heat treatment was performed at 170 °C for 30 min, according to the adhesive maker’s manual.
In the case of the fourth specimen, the faying surface of the AA6061-T6 specimen was roughened by 60 grit SiC abrasive paper, and then the adhesive was applied. After spot welding, heat treatment was carried out under the same conditions as the second and third specimens.
Table 2 shows the welding conditions for each specimen.
Upon completing welding for all types of specimens, a salt spray test was conducted, in accordance with the neutral salt spray test specified in ISO 9227. A 5% sodium chloride (NaCl) test solution was atomized at 35 °C within a sealed test chamber to create a saltwater mist, accelerating the corrosion of the materials being tested.
A total of 80 specimens were prepared to perform the salt spray test and the tensile lap shear test. Namely, 5 specimens were prepared for each group from 1 to 4, as shown in
Table 2. The salt spray test was conducted for 1920 h according to the test conditions in
Table 3. During the test, the specimens were taken out at 640 h, 1280 h and 1920 h to conduct tensile lap shear tests and, with a maximum fracture load, their relative corrosion resistance was assessed according to the welding conditions. Tensile lap shear testing was carried out at room temperature using a tensile testing machine (AG-X universal testing machine, with a maximum load of 250 kN) at a crosshead speed of 1.0 mm/min according to ISO 14273. The grip size of the specimen was 30 mm, and a shim plate was used to clamp the test specimen in the grips of the tensile testing machine. In addition, the fracture surface was observed by performing scanning electron microscopy (SEM) and further with energy dispersive X-ray (EDAX) spectrometer analysis.
3. Experiment Results and Discussions
3.1. Optimization of Weld Bonding Conditions
Spot welding was performed according to each welding condition (1–4), and a salt spray test was conducted with these welded specimens.
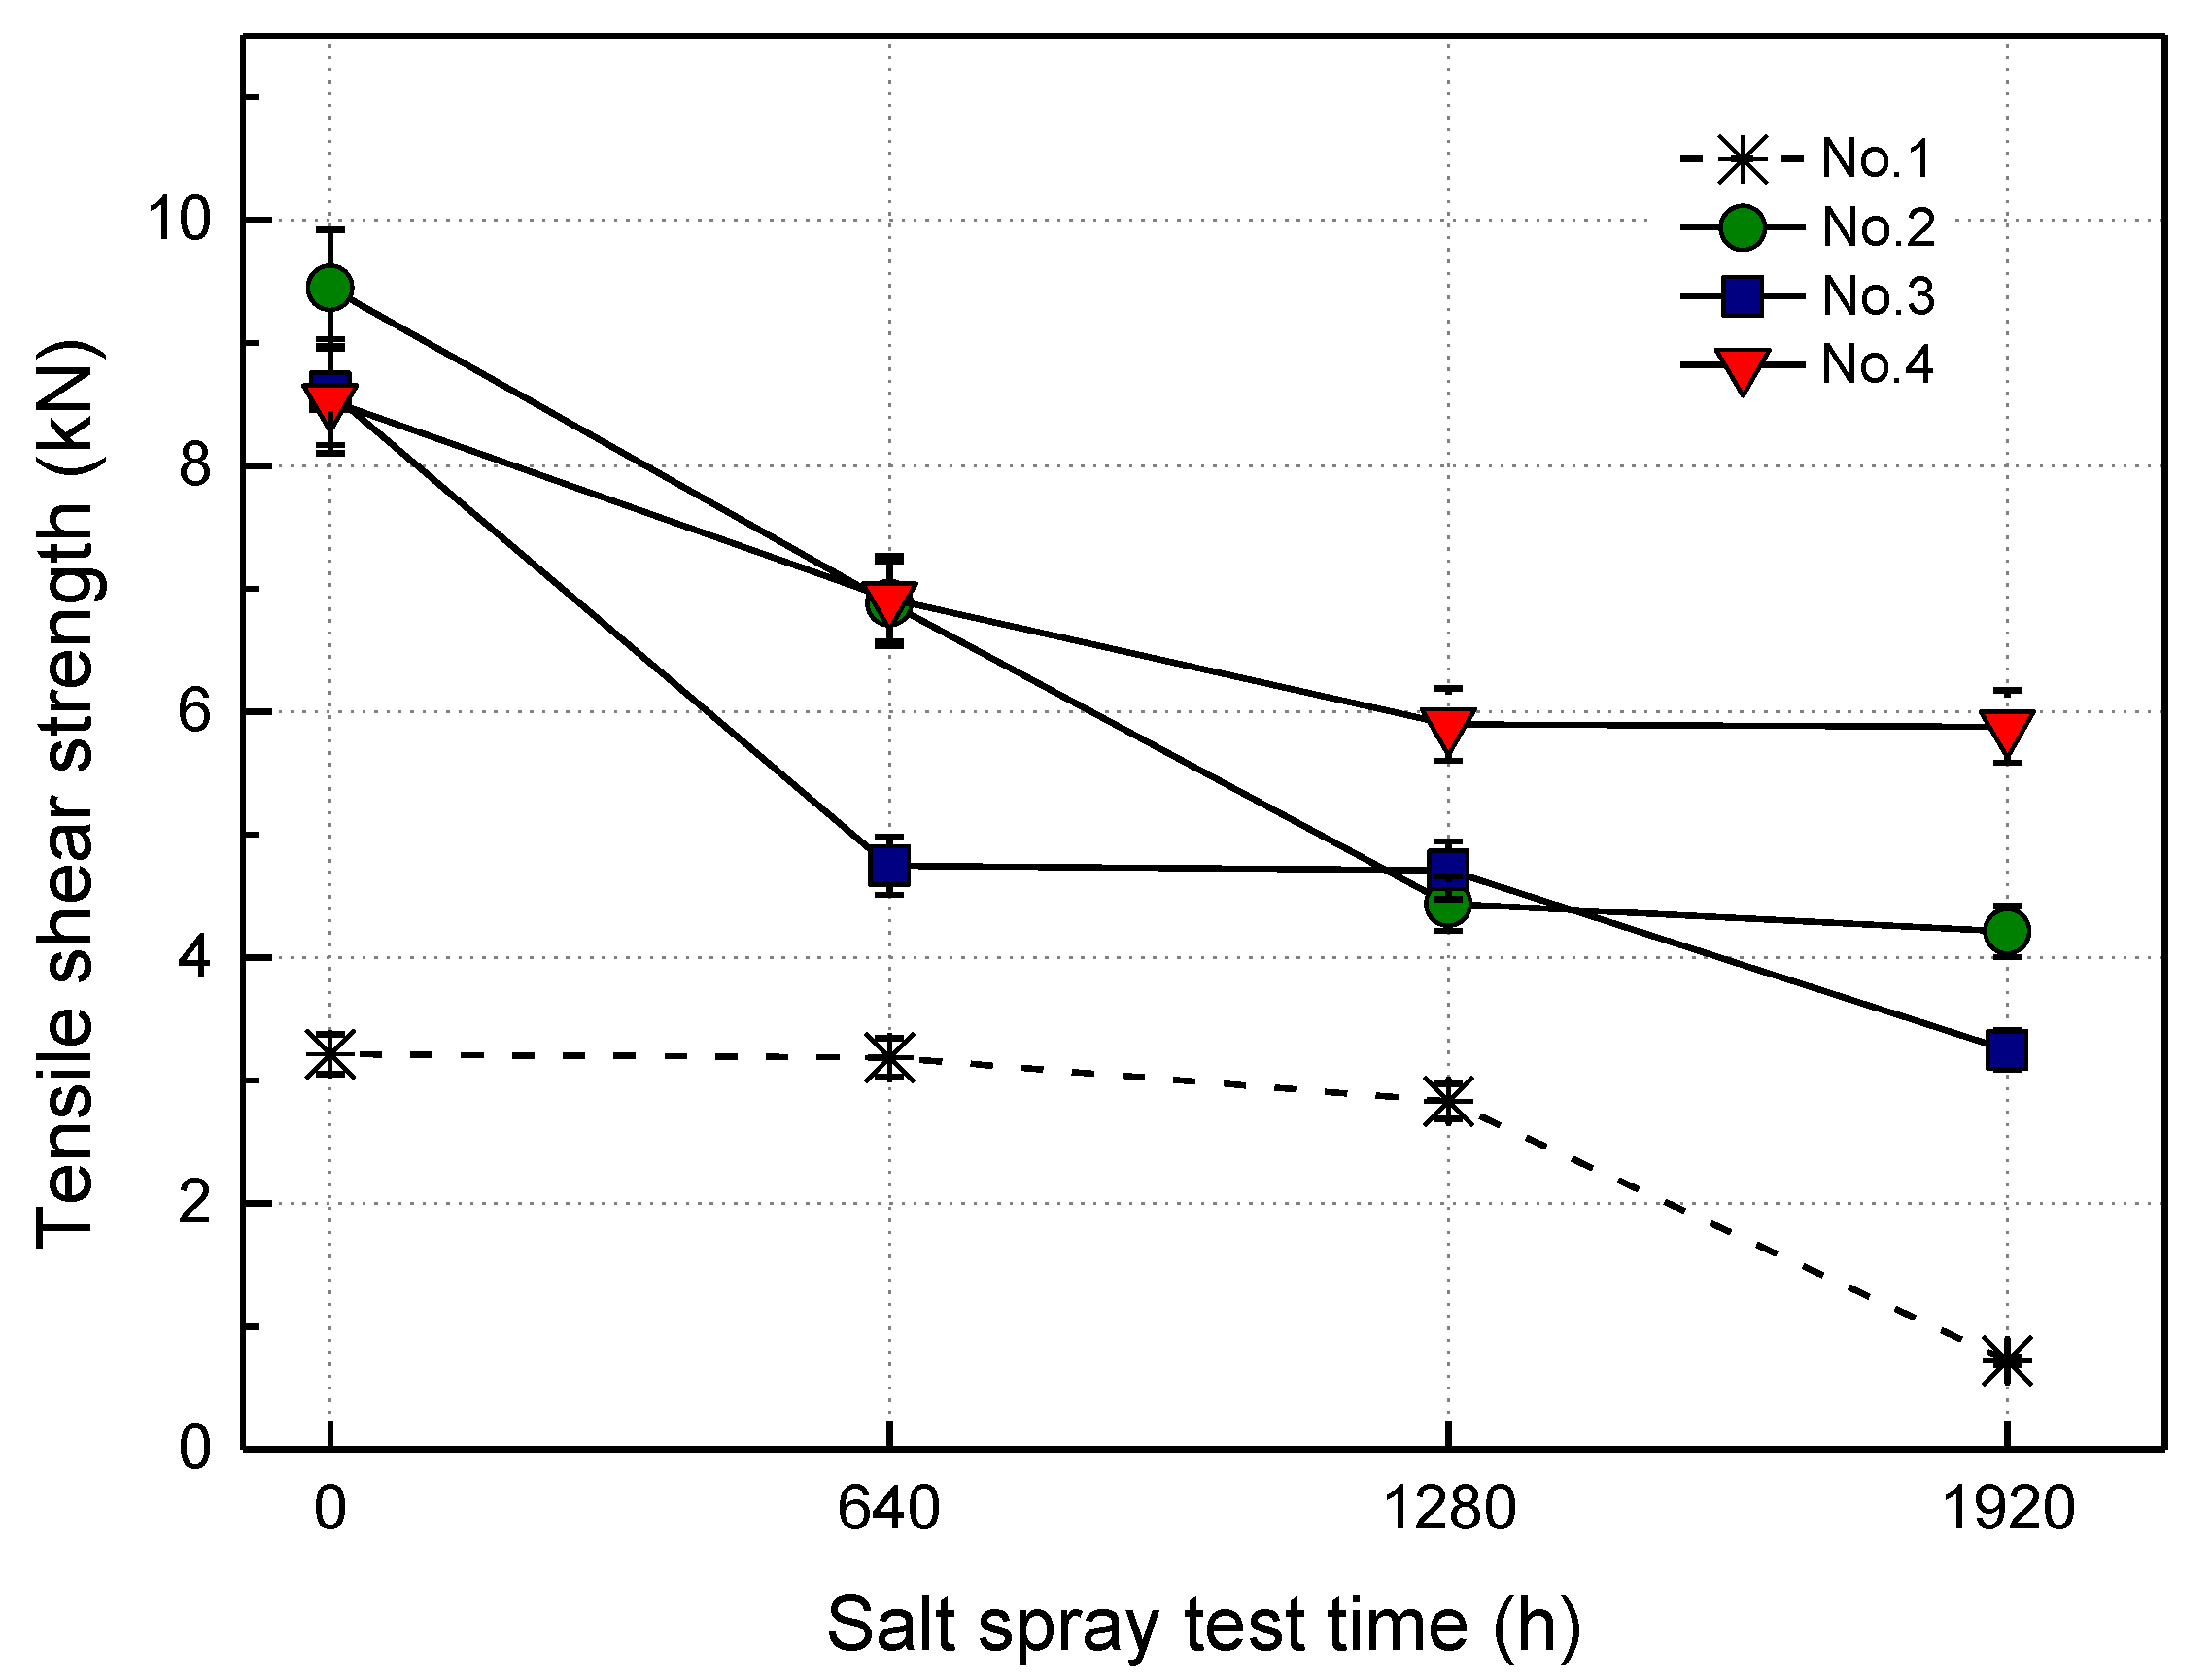
Figure 4 shows the results of the tensile shear tests on specimens as they reached 640 h, 1280 h, and 1920 h during the corrosion test.
In order to compare the tensile shear characteristics of the conventional spot-welded specimen and the adhesive-added spot-welded specimen (weld bonding), the apparent maximum tensile failure load was recorded instead of the stress unit. It was strenuous to calculate the area required for stress calculation of the conventional spot-welded specimen and the weld bonding specimen, to which an adhesive was added, so the failure load under the tensile lap shear test was compared.
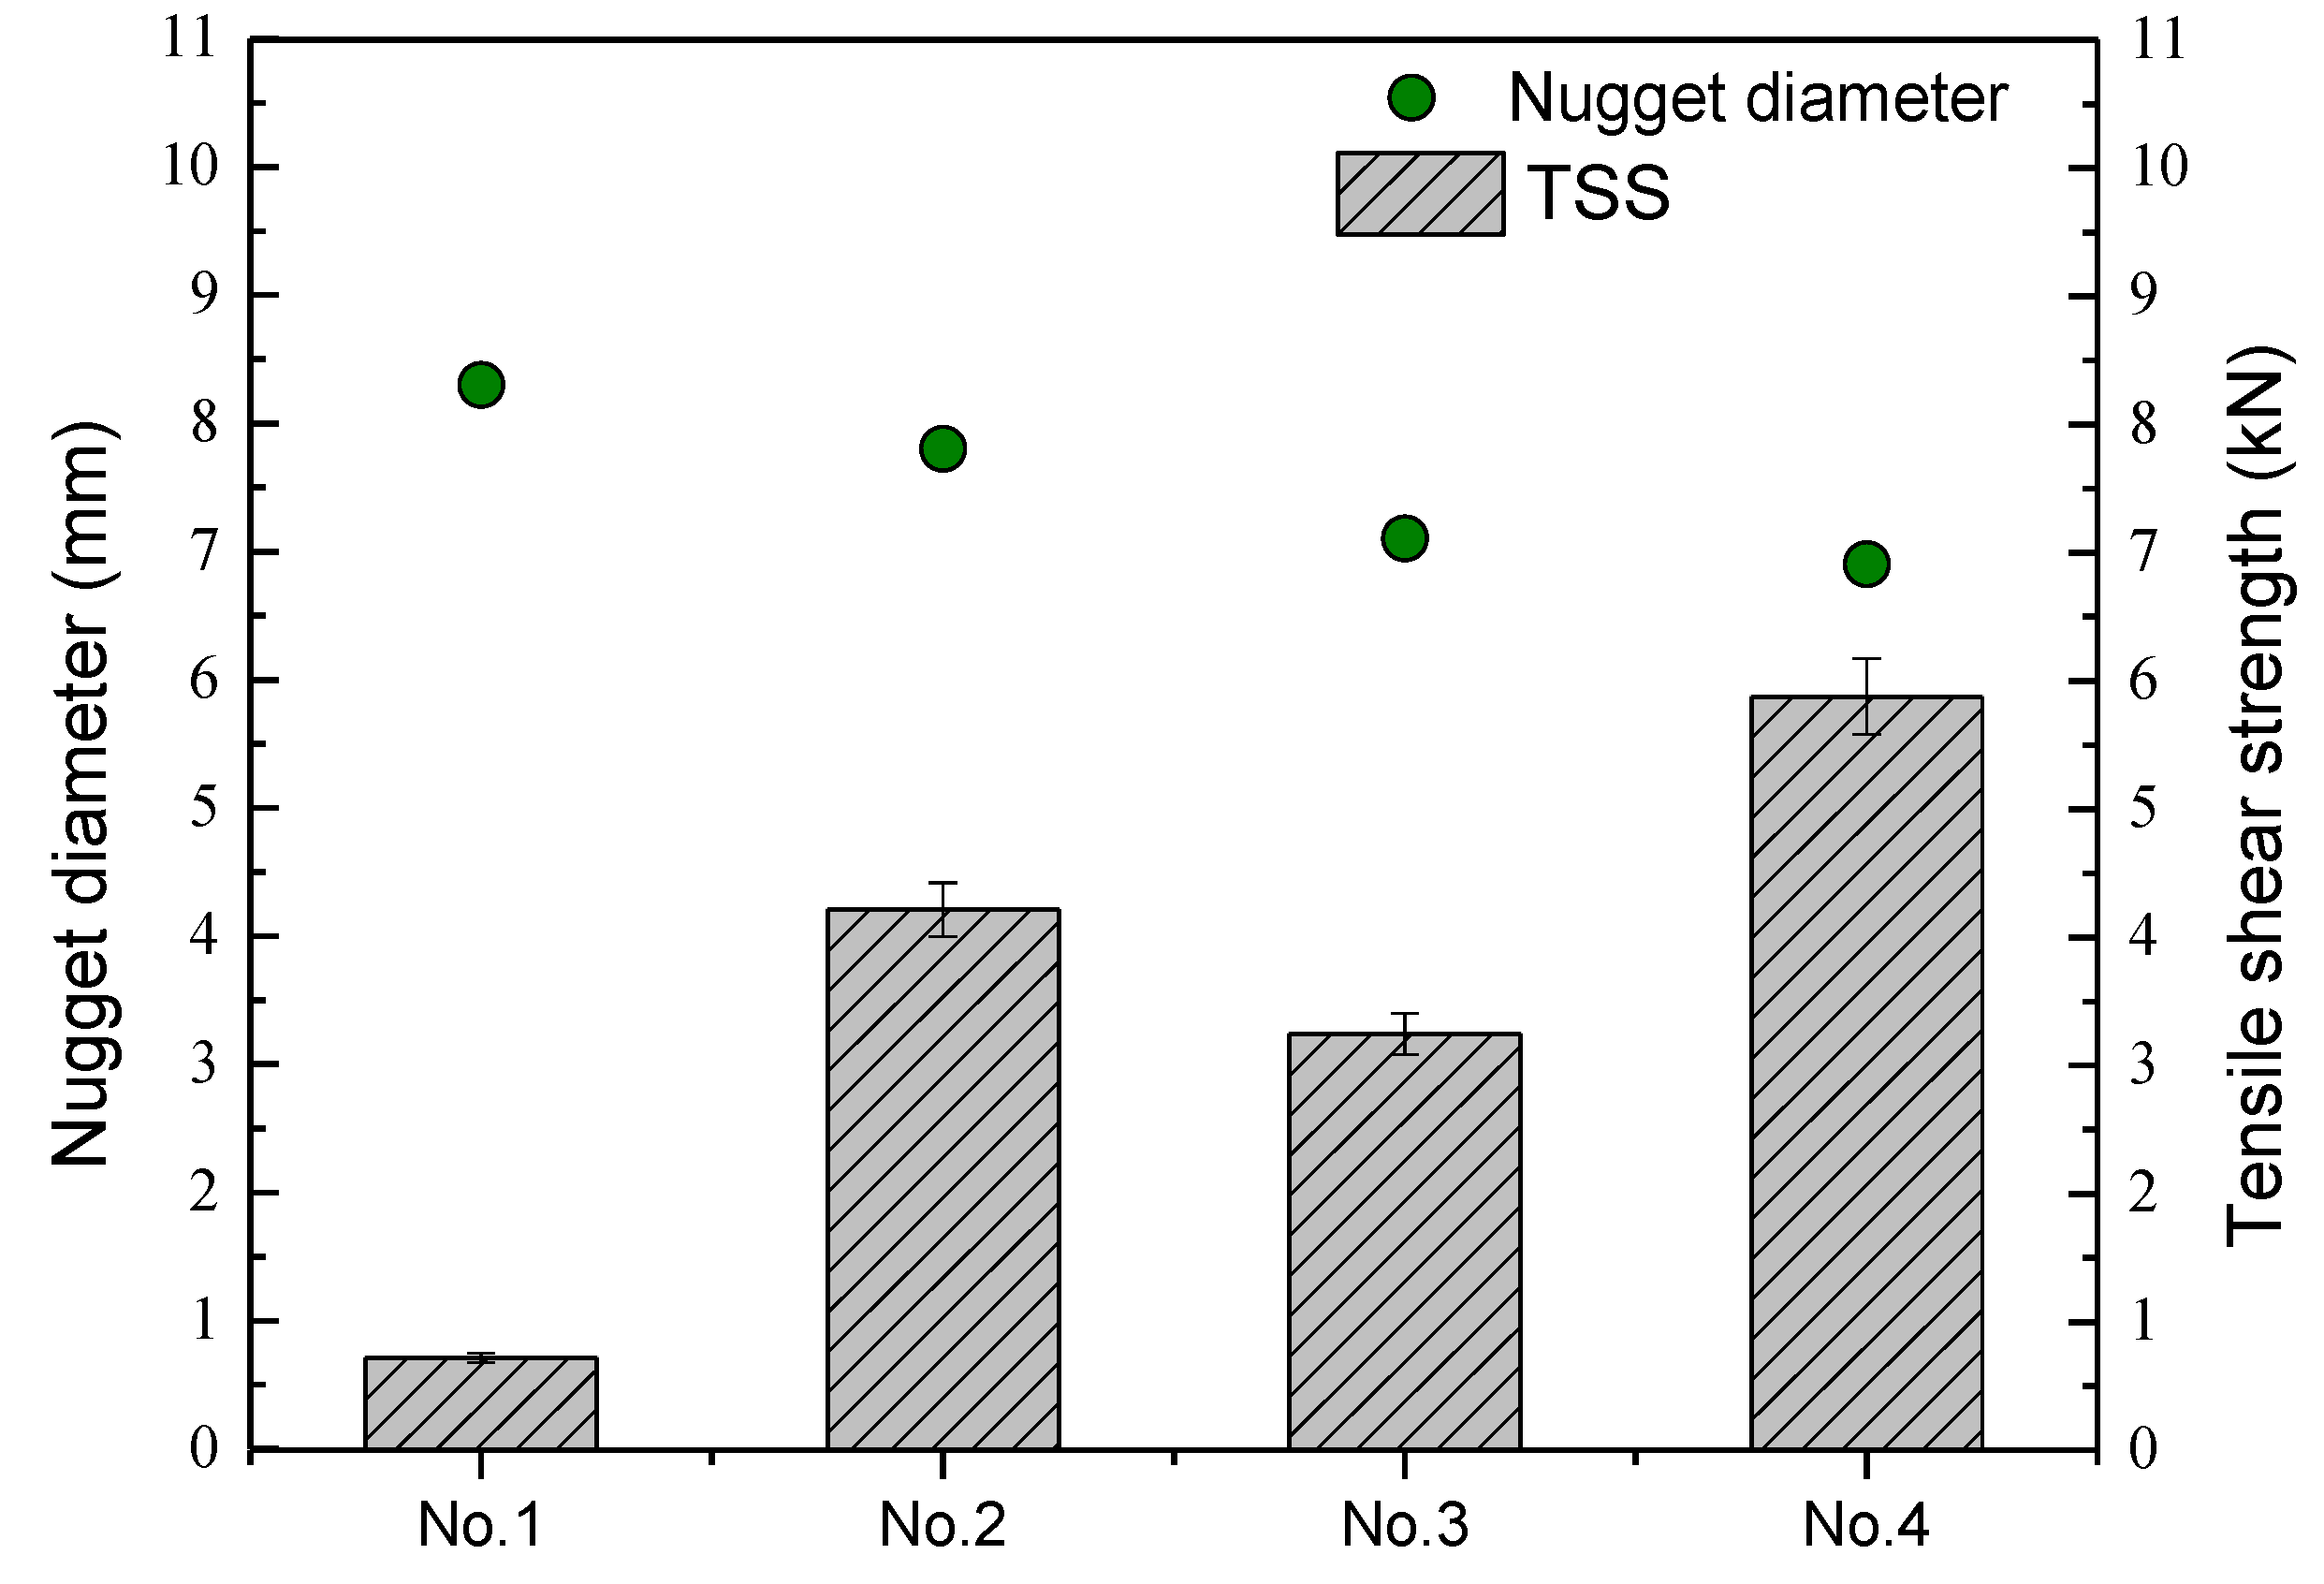
Among the results in
Figure 4, the maximum tensile shear loads at 1920 h are shown in
Figure 5, along with the weld nugget diameters of the as-welded specimens.
Specimen 1 had the largest nugget diameter, but the shear tensile strength before the corrosion test was the lowest. This is because the other specimens (except the first one) were not only spot welded, but also bonded with an adhesive so that the bonding area and the resulting strength increased. In addition, since it was a lap joint shape rather than a butt, during the shear tension test, the line of action of the force did not coincide during tensioning, resulting in a coupling force, and thus a tearing force at the joined interface was generated. In addition, Specimen 1 showed the greatest drop in shear strength as the corrosion test proceeded (
Figure 4). This is because the corrosion solution not only contacted the specimen surface, but also penetrated into the faying interface, overlapping between the specimens, and corrosion proceeded to the nugget region.
In the case of Specimens 2 and 3, the tensile strength also decreased as the corrosion time progressed. However, compared with Specimen 1, the decrease in strength was not significant, even after 1280 h, because the penetration of the corrosion solution at the faying interface of the specimen was delayed due to the adhesive, which slowed the corrosion progress. Comparing the welding conditions of Specimens 2 and 3, the nugget diameter of Specimen 2 was expected to be smaller than that of Specimen 3, because the welding time of Specimen 2 was shorter than that of Specimen 3. However, as a result of observing the cross section, contrary to expectations, the nugget diameter of Specimen 2 was observed to be larger than that of Specimen 3. The reason for this result was that the adhesive was applied manually, so there was variation in the thickness of the adhesive, which is thought to have affected heat generation and the resulting nugget sizes.
The important point is that the highest corrosion resistance was observed in Specimen 4, which had the roughened surface. It is well known that the tensile shear strength of spot welds increases as the nugget diameter increases [
22,
23]. Specimen 4 had the smallest nugget diameter, even though the welding conditions were the same as with Specimen 3, which is assumed to be due to the variation in contact resistance and adhesive thickness and the resulting change in the amount of heat generated. The tensile shear strength of Specimen 4 also decreased as the salt spray test time elapsed, but the strength drops were not significant after 1280 h. This is believed to be due to the fact that it could not prevent the decrease in strength. Due to corrosion on the outer surface of the specimen by the corrosion solution, penetration into the faying interface could be prevented for a longer period of time, compared with Specimens 2 and 3.
It was confirmed that the corrosion resistance increased by applying the adhesive, and the effect became greater when the adhesive was applied by increasing the roughness at the interface.
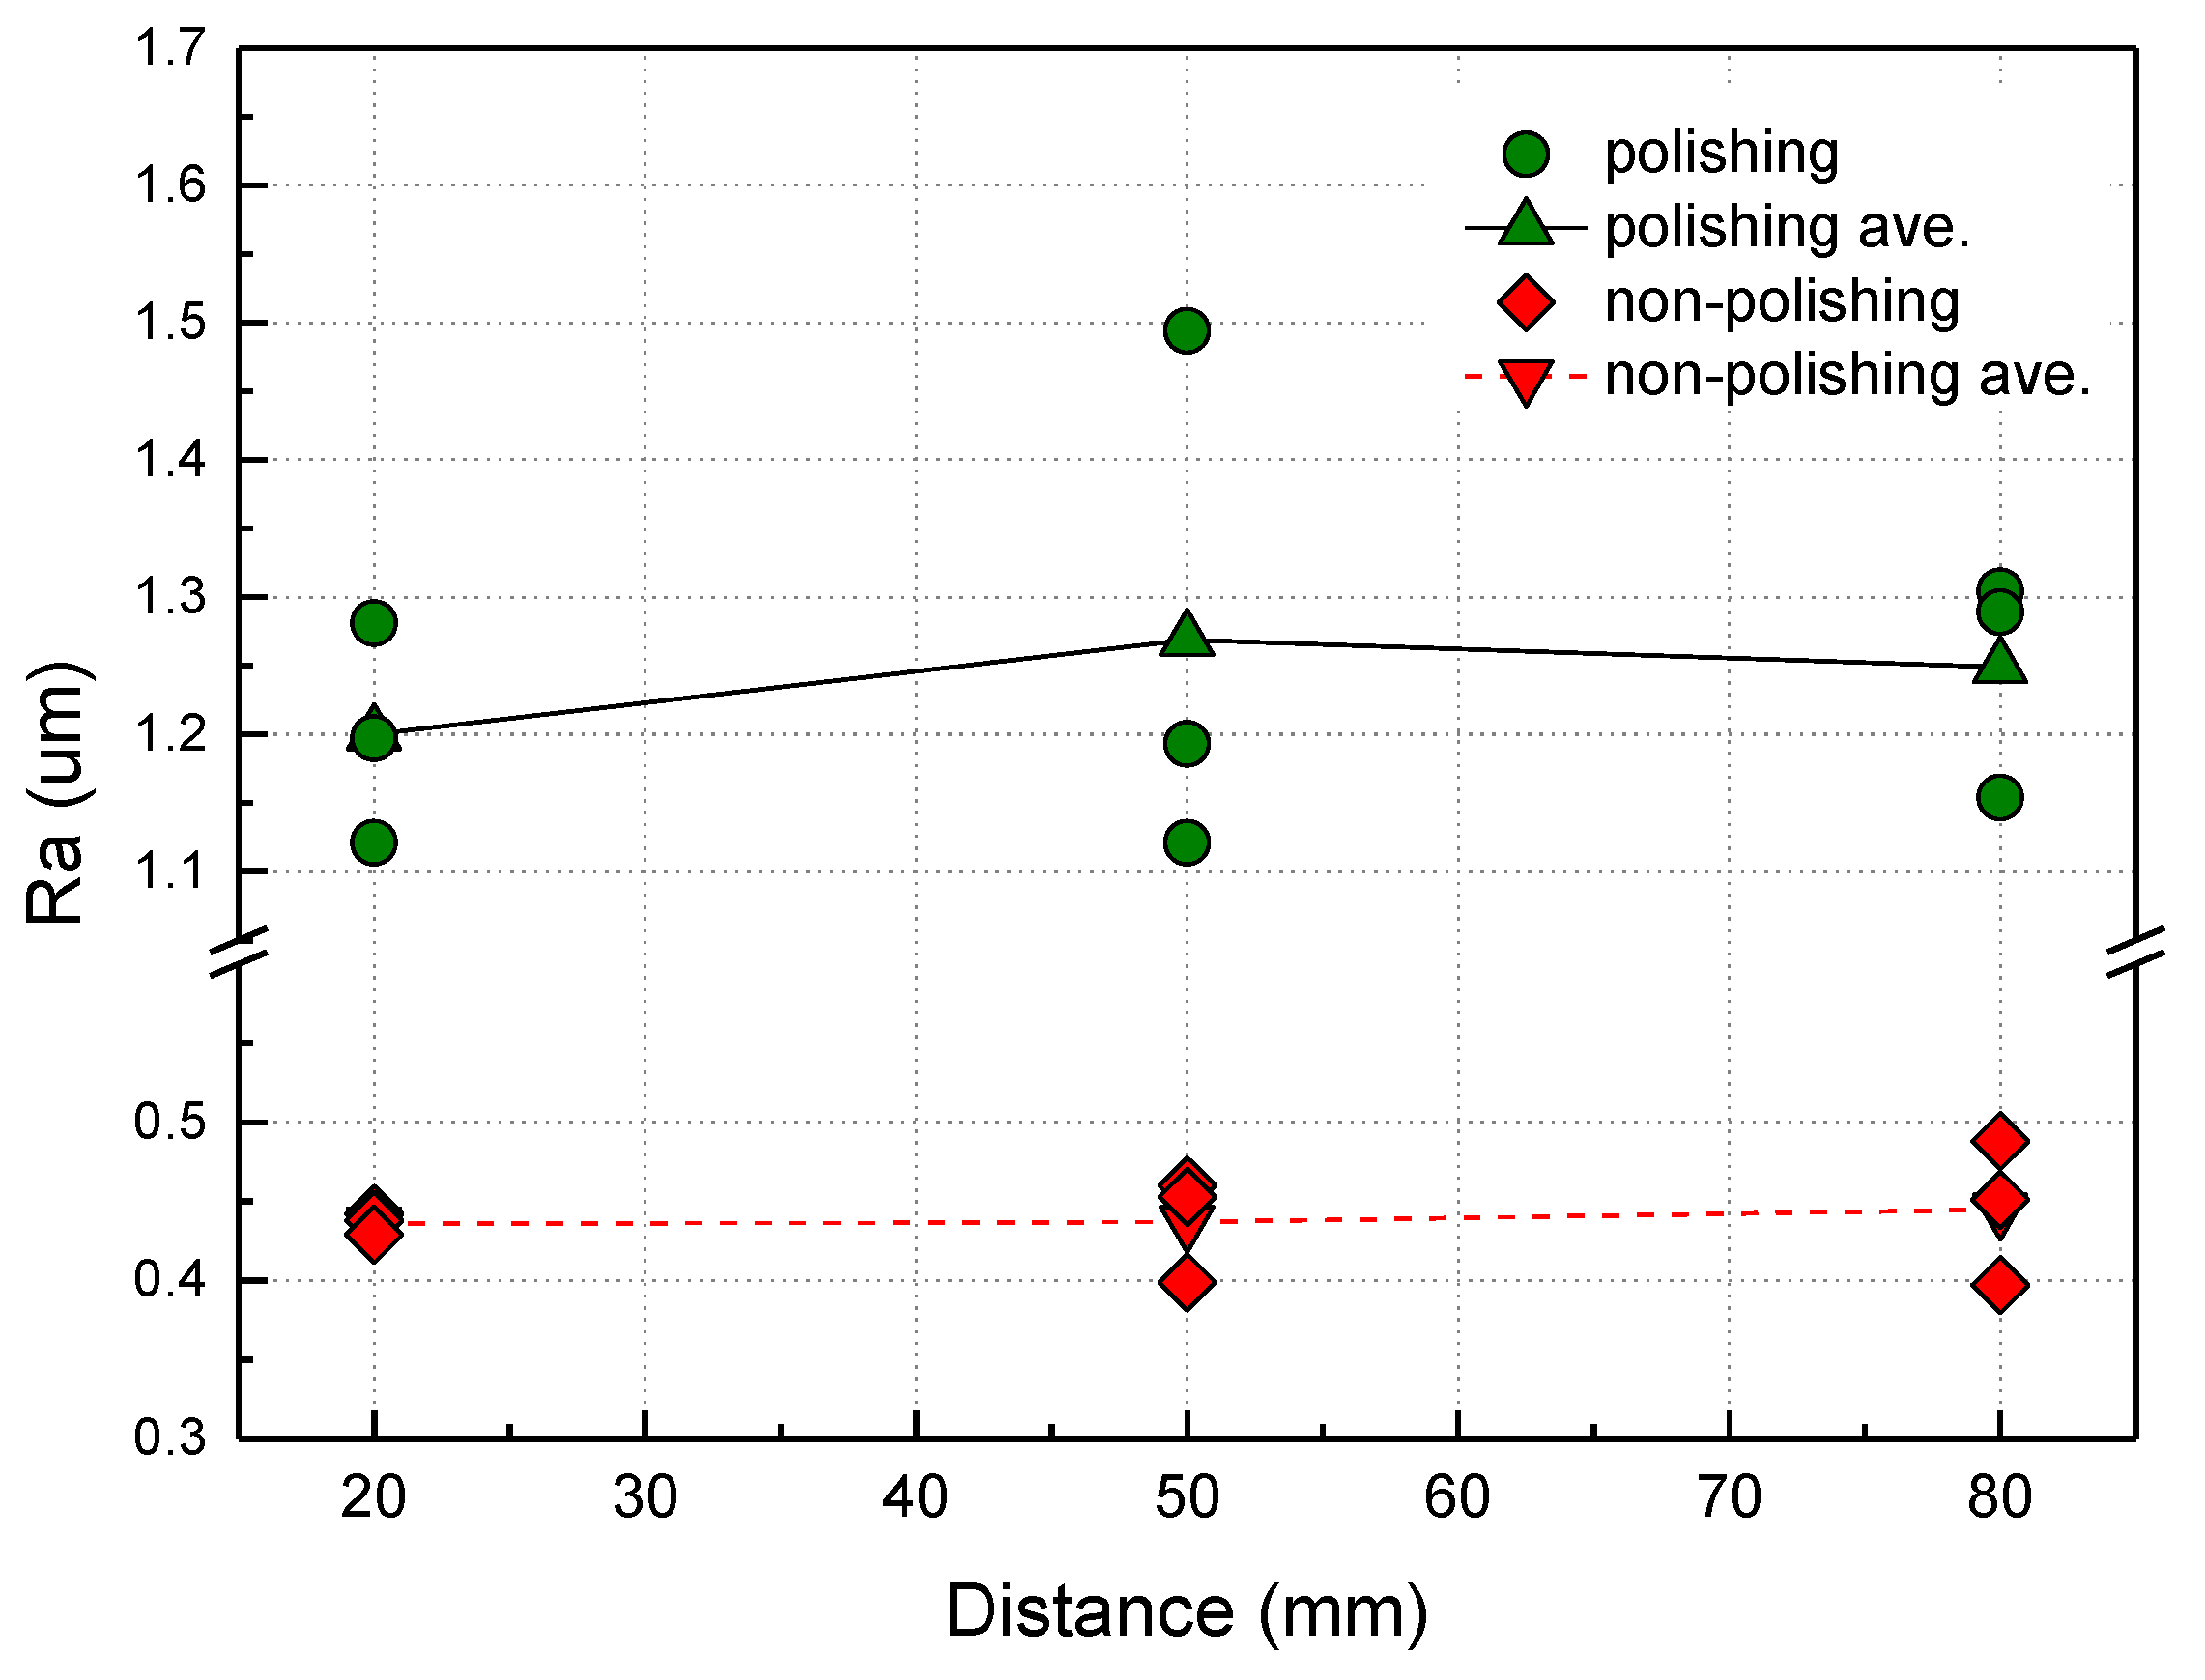
As a result of measuring the roughness by 3-D optical contour mapping on the specimen surface, as shown in
Figure 6 and
Figure 7, the average surface roughness of the roughened Specimen 4 (with 60 grit SiC abrasive paper) increased by about three times compared with that of the plain AA6061-T6 specimen.
3.2. Effect of Corrosion Amount on Tensile Shear Strength
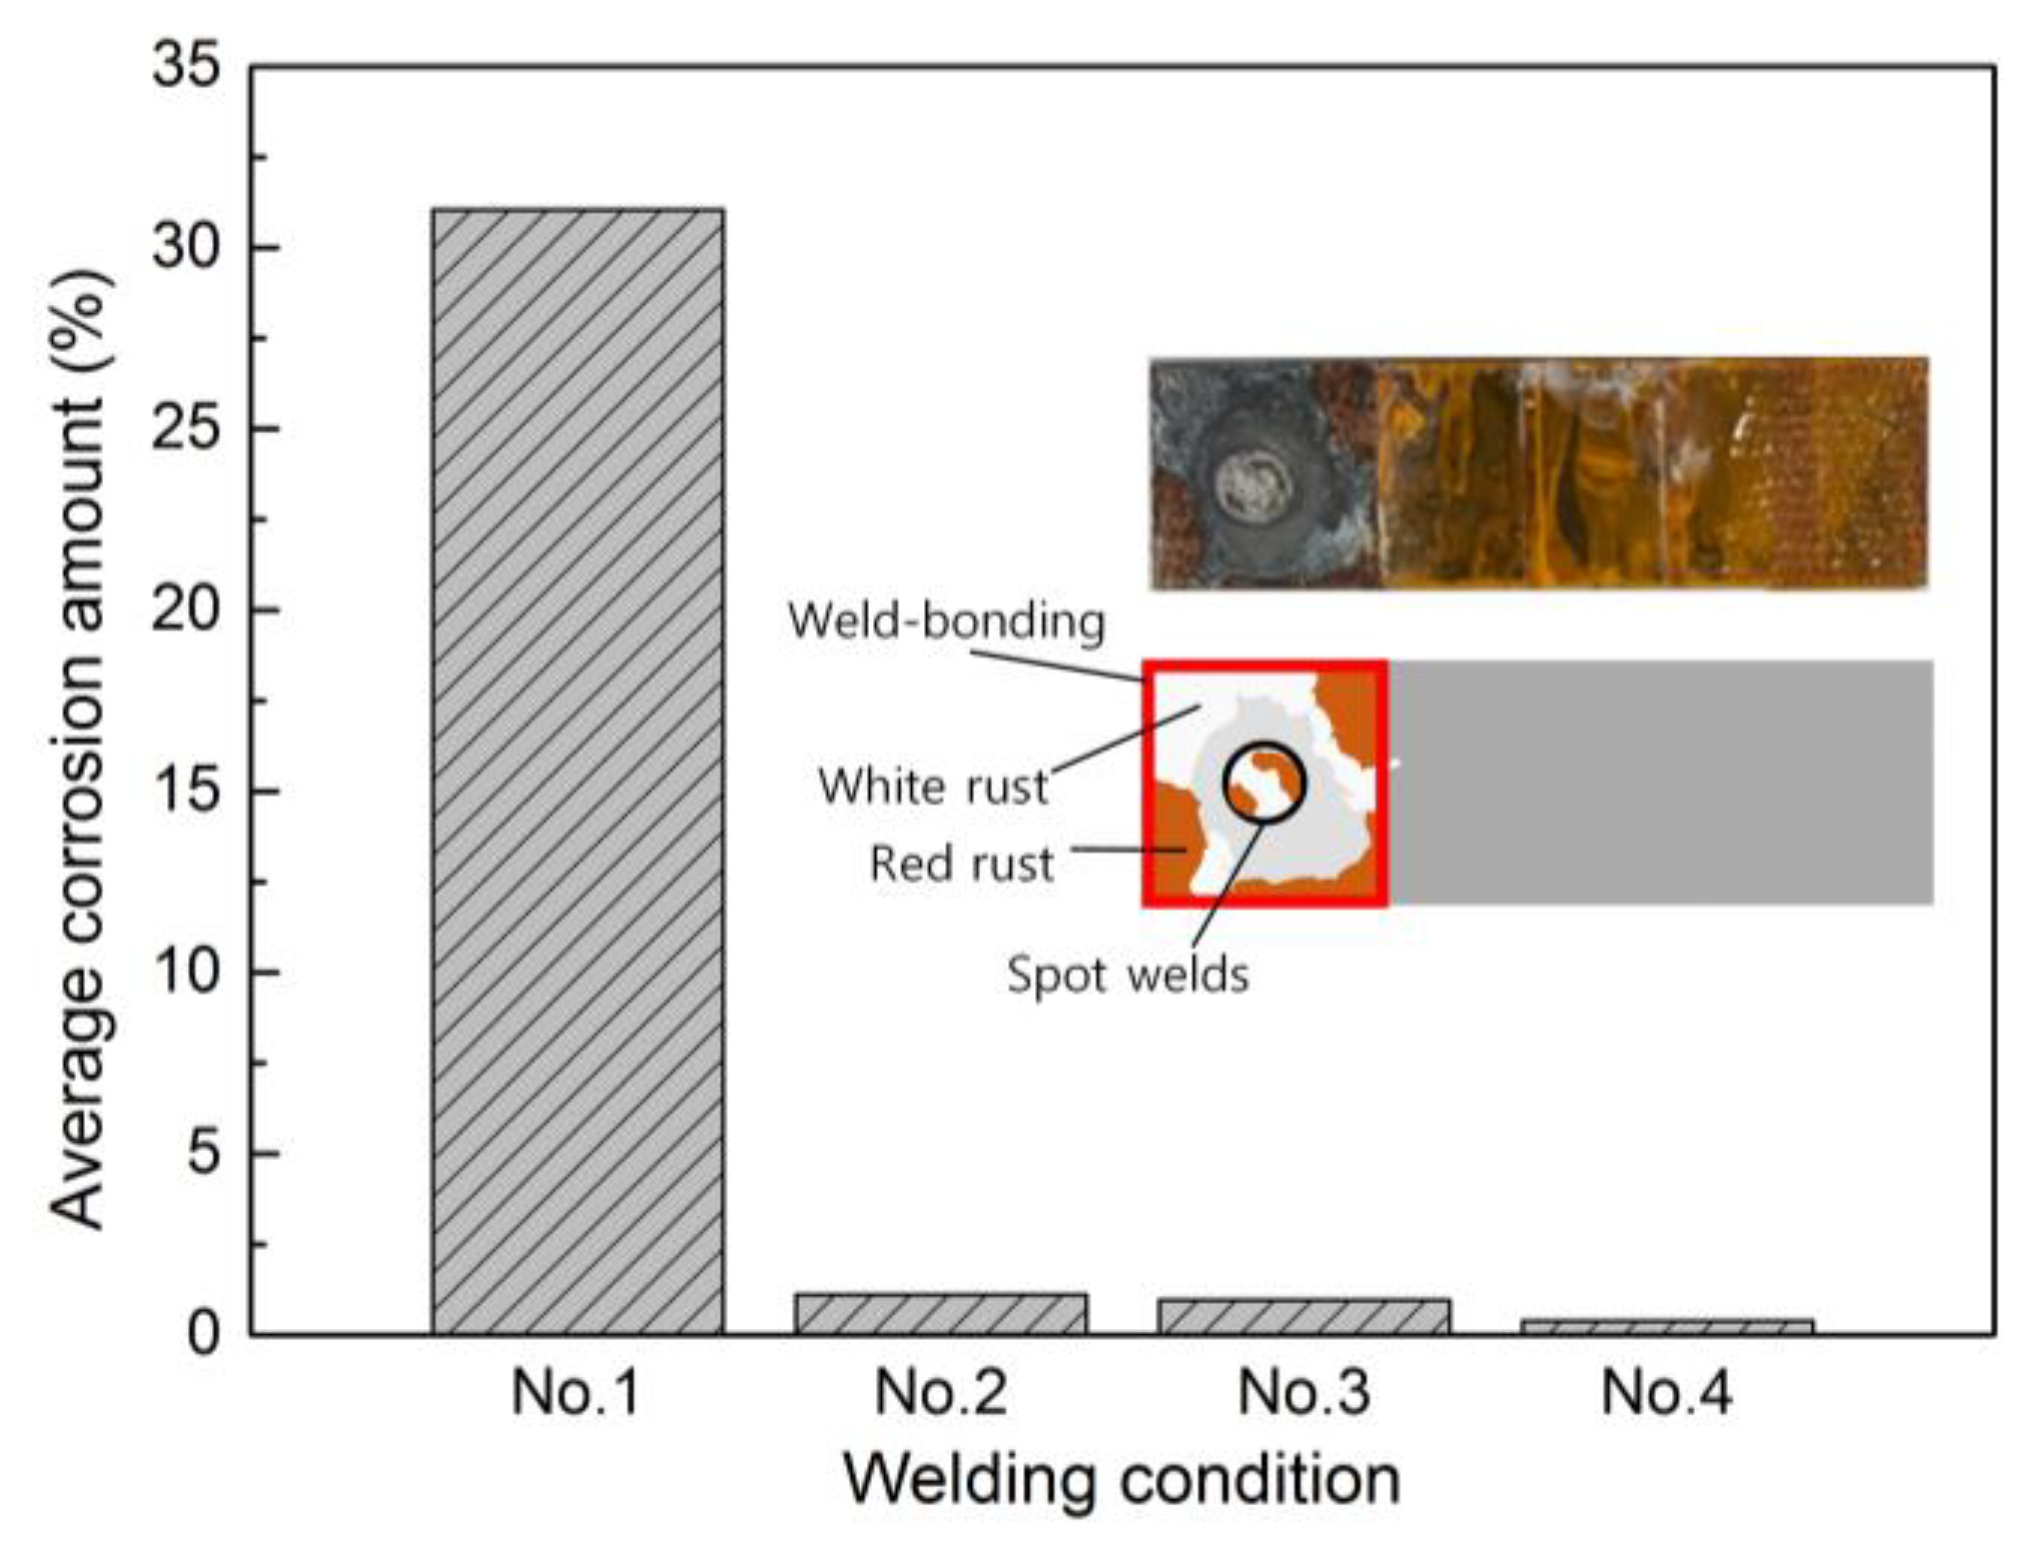
As the salt spray test increased, the tensile shear strength decreased in all welding conditions. In particular, compared with the weld-bonded specimen, more corrosion proceeded in Specimen 1, a relatively large amount of red rust was observed, and the decrease in the area of the nugget diameter due to corrosion was thought to be the cause of the low tensile strength.
In order to compare the amount of corrosion that progressed, the following equation was used:
where Vc is the total corrosion amount (%), Ac is the corrosion area, and Awb is the weld bonding area.
Figure 8 shows the average amount of corrosion, calculated from Equation (1), for each specimen. From the results, it can be seen that the amount of corrosion was very small in the weld bond welding condition, compared with the conventional DeltaSpot welding condition (Specimen 1). This was due to the delay of galvanic corrosion; the corrosion solution did not penetrate through because of the adhesive on the faying interface.
Among the specimens, it can be seen that the corrosion progress of Specimen 4 was the slowest, and this is considered to be the reason that the shear tensile strength was maintained at a high level, even under a long-term corrosion environment.
3.3. Investigation of Corrosion Aspects at Weld Fractures
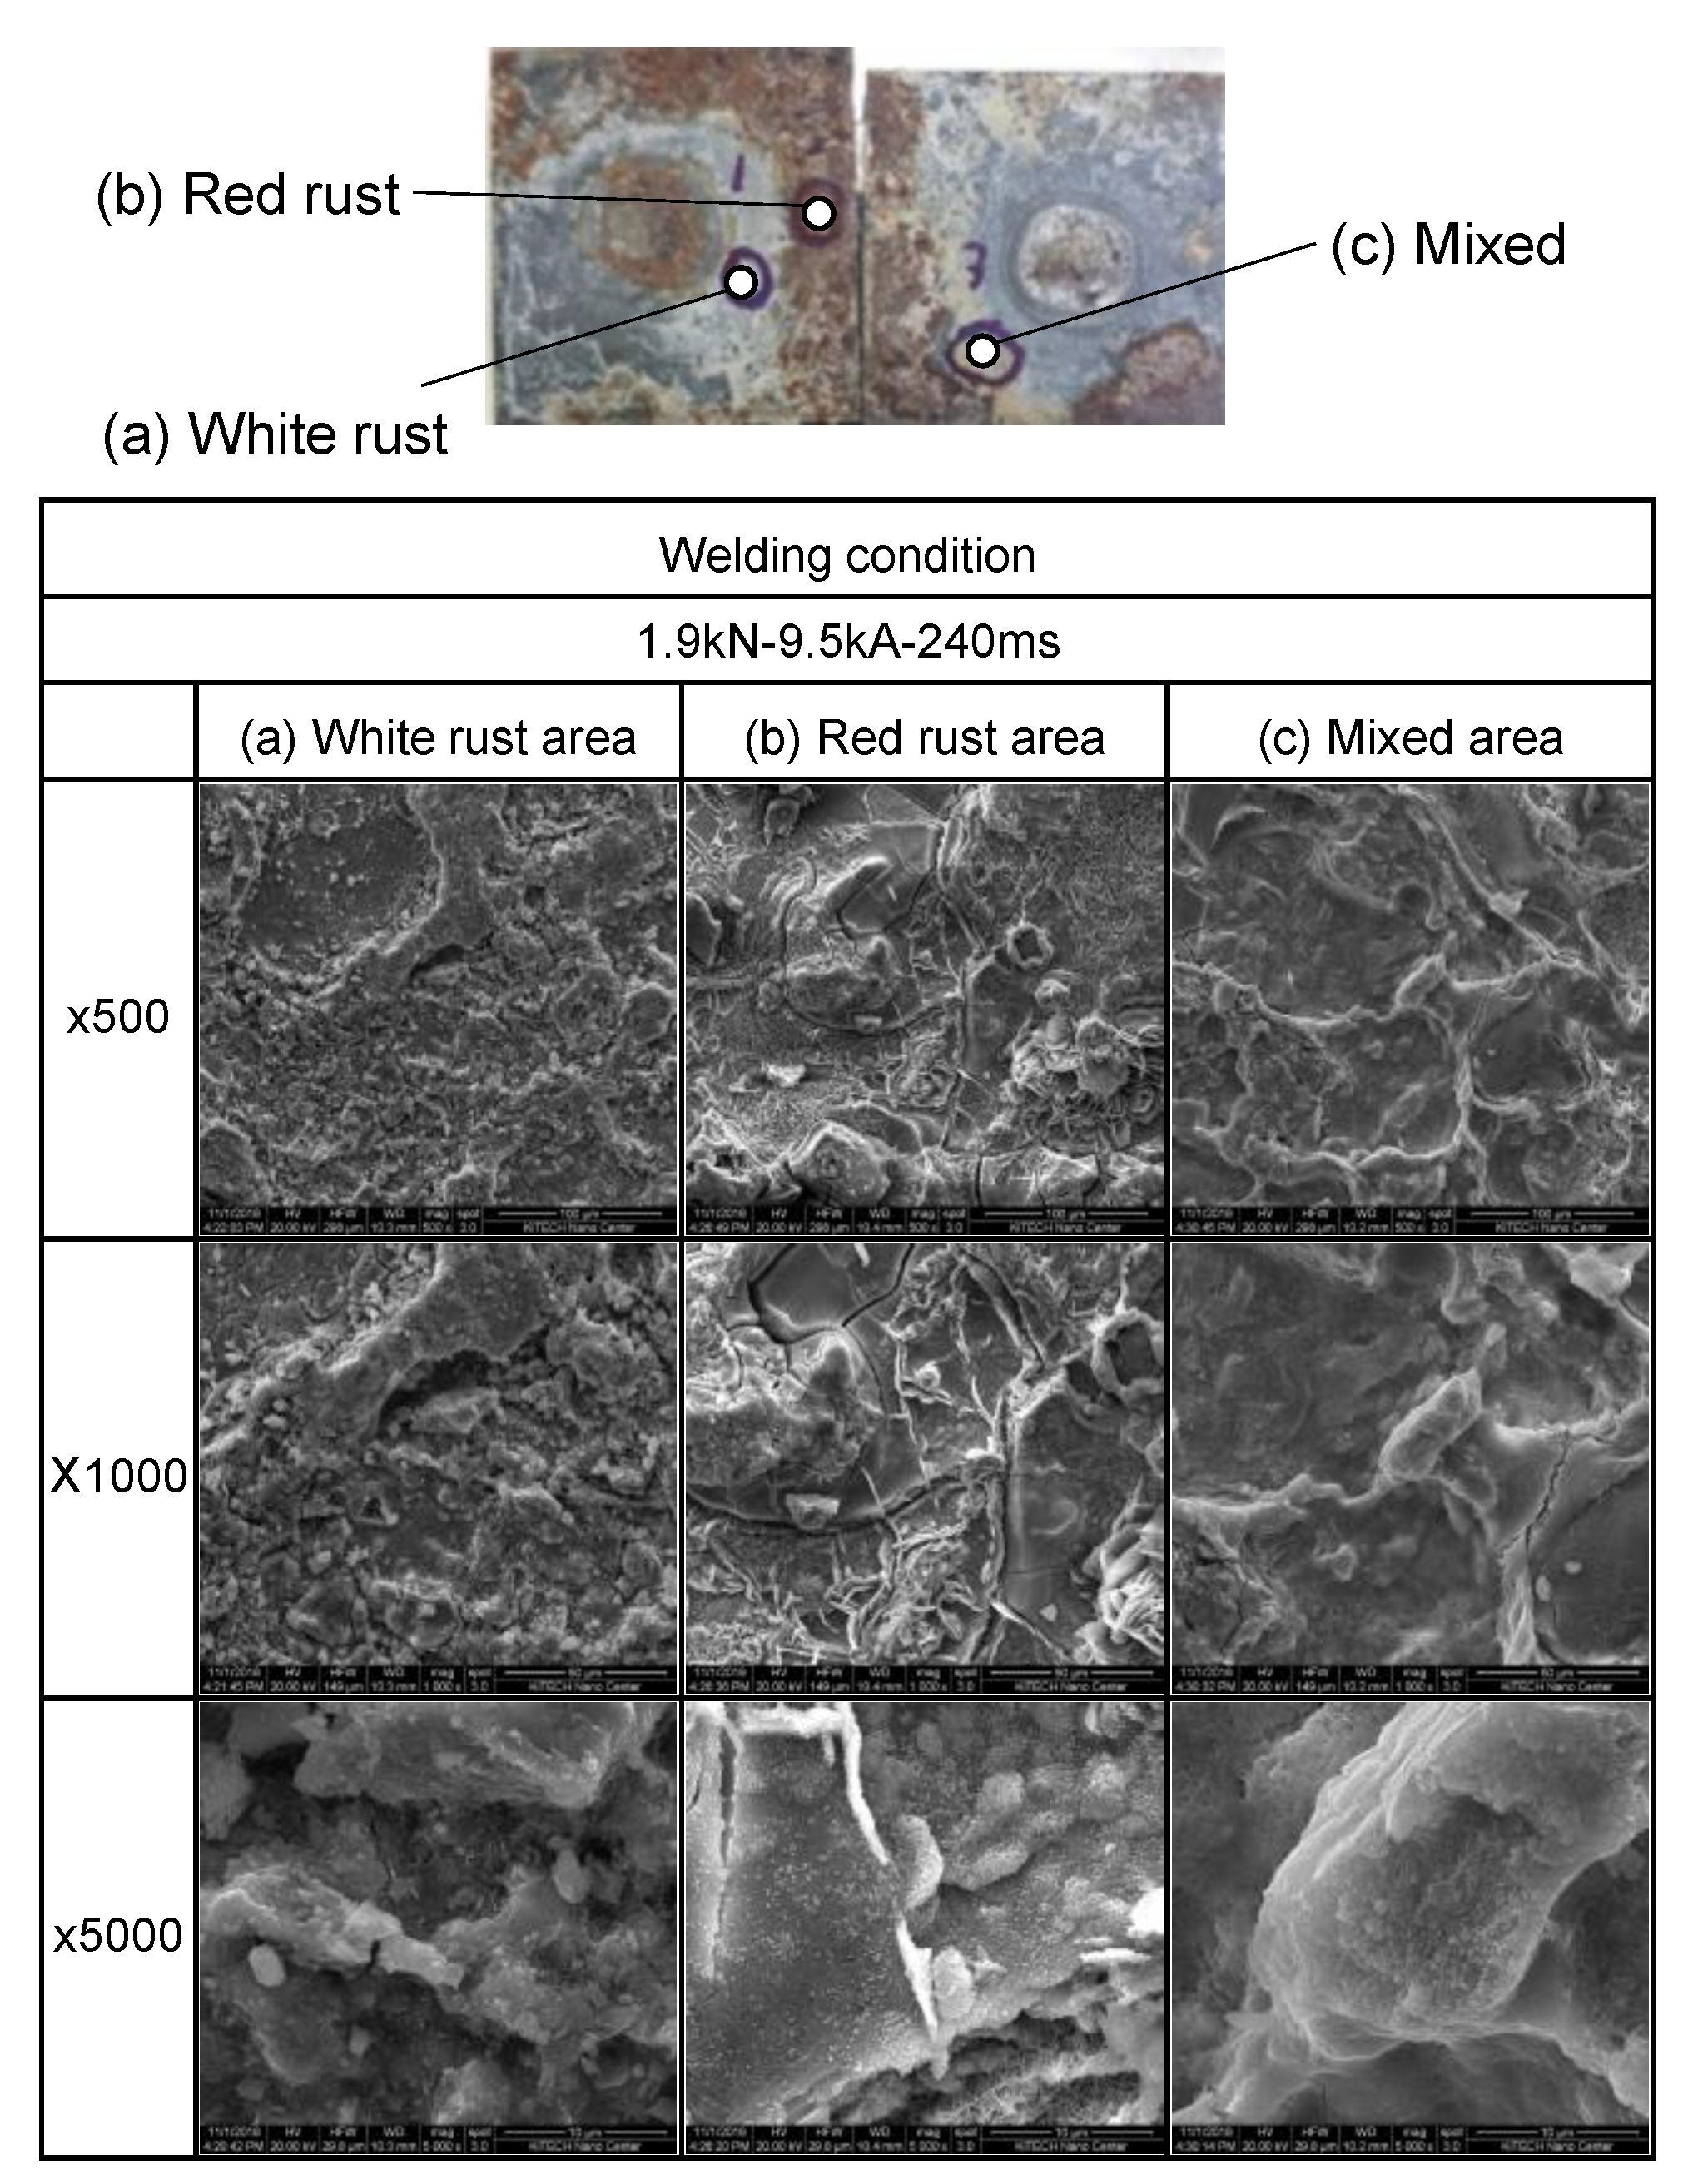
In order to investigate the welds with galvanic corrosion, the fractured site of the galvannealed steel specimen side, which had undergone a salt spray test and a tensile lap shear test, was observed by SEM and EDAX analysis.
Figure 9 shows the results of SEM observation at 500, 1000, and 5000 magnifications of the area around the weld of Specimen 1. In addition,
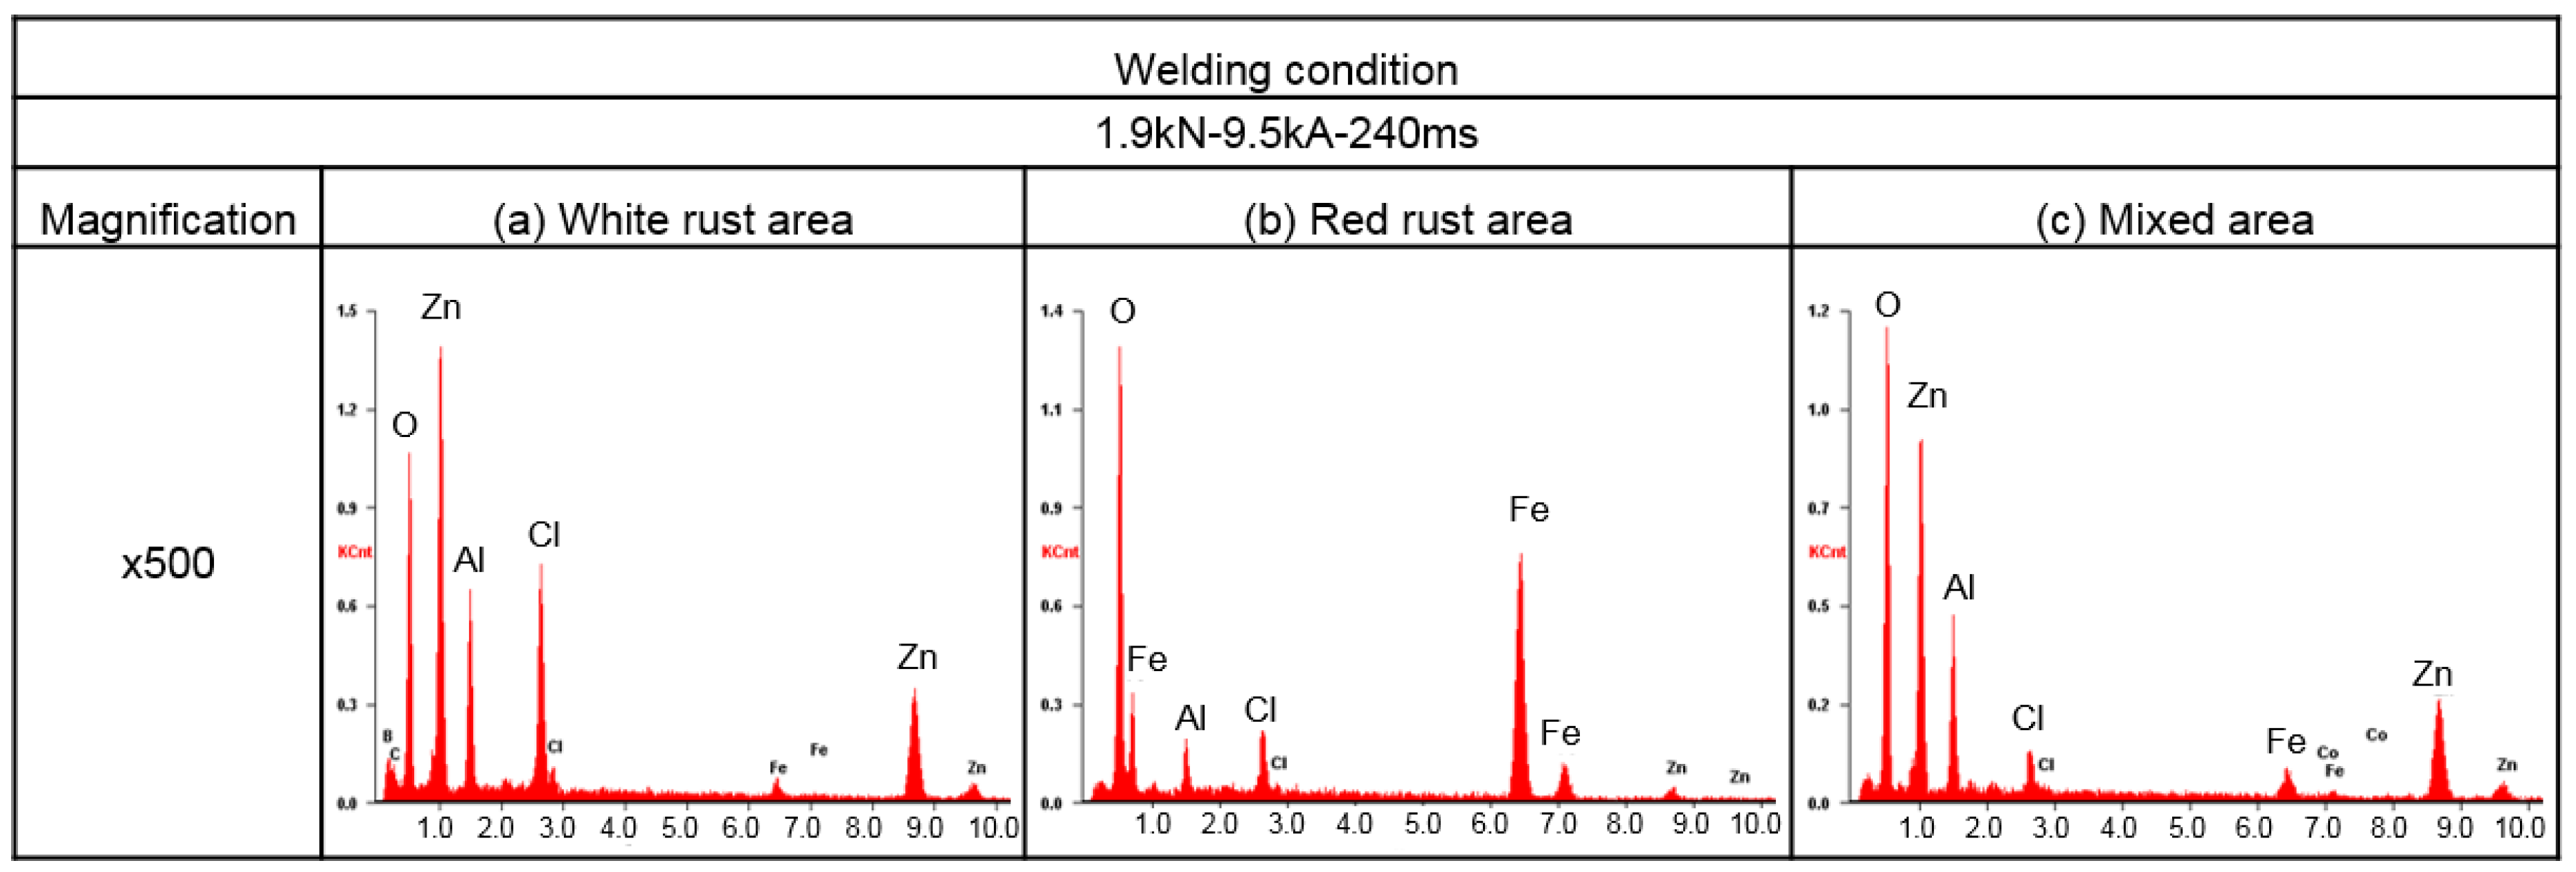
Figure 10 and
Figure 11 show the results of EDAX spectrometer analysis for the conventional DeltaSpot welding specimen (Specimen 1) and the weld bonding specimens (Specimens 3 and 4), respectively.
In the first condition, where the structural adhesive was not applied, Zn and O were detected in the fractured area, and Fe was detected in the red rusted area where corrosion progressed greatly. The fact that Zn was detected more than Al means that the corrosion of the steel side progressed more than the Al alloy side, and the dense alumina oxide film formed on the aluminum alloy surface was more resistant to corrosion than the Zn plated on the steel.
On the other hand, in the conditions of Specimens 3 and 4 in which the structural adhesive was applied, C and Al, which were components of the adhesive paste, were detected. Since the effect of corrosion on the specimens was relatively small, the bonding strength was maintained enough to cause fractures on the aluminum side rather than the steel side, and this is considered the reason why the higher tensile shear strength was maintained. Moreover, unlike conventional DeltaSpot welding, when the adhesive is applied, it is thought that the decrease in strength is not significant because it not only prevents galvanic corrosion due to potential difference, but also prevents crevice corrosion due to penetration of the electrolytic corrosion solution.
4. Conclusions
In this study, the DeltaSpot process, in which different process tapes were applied to the upper and lower electrodes, was used for dissimilar welding between an AA6061-T6 aluminum alloy and galvannealed steel. The lap shear tensile strength of the welded specimen was evaluated under a corrosive environment for the DeltaSpot-welded and weld-bonded conditions, to which the adhesive was applied, and the following conclusions can be drawn.
In the case of the weld bond condition, where the structural adhesive was applied, the tensile shear strength was higher at room temperature than when only DeltaSpot welding was applied, and this tendency was maintained even after the corrosion resistance test.
With the same weld bond condition, the shear tensile strengths after the salt spray test at 1920 h were 3.25 kN and 5.88 kN with and without the faying interface roughened specimen, respectively. Namely, when the structural adhesive was applied by increasing the surface roughness of the specimen, the shear tensile strength increased by 81%.
The specimen to which the adhesive was not applied showed rapid corrosion, and Zn and O were detected using SEM and EDAX analysis. Corrosion proceeded on the steel side, resulting in very low tensile shear test results.
At the fracture site of the welding condition where the adhesive was applied, it was confirmed that structural adhesive components such as C and Al were detected and Zn was not, so the corrosion hardly proceeded. This confirms the reason why the shear tensile strength was higher when compared with other welding conditions.
It was established that the application of a structural adhesive for dissimilar welding between aluminum alloy and steel by the DeltaSpot process was effective in preventing a sudden decrease in strength in a corrosive environment, and the effect can be enhanced by applying an adhesive with increased surface roughness.


