Abstract
Despite superior specific mechanical characteristics of carbon-fiber-reinforced polymers (CFRPs), a lack of understanding of their fracture mechanisms under different impact conditions has limited the application of CFRP energy-absorbing structures. To avoid complex and expensive tests on the final structure, it is more convenient to test flat elements. To prevent catastrophic crushing due to the global buckling, flat specimens must be supported by a specific fixture. Previously developed fixtures had shortcomings like tearing of the specimen, jamming of the fixture, short crushable length, or they were specifically designed only for one failure mode. This newly designed fixture overcomes the limitations of previously published solutions. The final configuration includes cylindrical anti-buckling columns 10 mm in diameter and spaced 65 mm apart with adjustable heights. The fixture is designed for rectangular specimens with dimensions of 150 × 100 mm and different thicknesses up to 16 mm, like the ones mandated by the ASTM D7137 standard test method for compression after impact analysis. Other features of this new fixture are the possibility to study the effects of different defects on the crashworthiness of composites, higher crushing area, and integration with Instron drop tower and hydraulic testing machines.
1. Introduction
Many studies have proven that composite materials have higher specific energy absorption (SEA) characteristics compared to their metallic alternatives [1]. However, a lack of understanding of their responses under various conditions and energy absorption mechanisms has hindered exploiting their full potential. Having a standard experimental way of exploring the crashworthiness of composites makes it possible to fully understand their mechanisms, define a proper mechanical material model and get the values for the material coefficients, and compare the materials with respect to their SEA.
In 1989, Farley investigated the energy absorption capability of composite tubes and beams and categorized four characteristic crushing modes: transverse shearing, brittle fracturing, lamina bending, and local buckling [2]. A year after, in 1990, Hull studied progressive crushing of fiber-reinforced composite tubes and characterized splaying and fragmentation as energy absorption mechanisms [3] which were respectively similar to lamina bending and brittle fracturing modes stated by Farley.
Carruthers et al. reviewed the experimental works up until 1998 and summed up the failure modes, categorizing them into five categories: transverse shearing, brittle fracturing, lamina bending, delamination, and local buckling [4]. These researchers stated that the actual crush of a composite is a combination of these modes and the SEA differs depending on which mode is the most prominent. This emphasizes the importance of having a fixture to study different modes of crushing under diverse conditions.
Since up to this date there is no standard test method to characterize the crashworthiness of composites, each researcher has chosen his or her own approach. Many have chosen self-supporting geometries like cylindrical [5,6], square [7], or conical [8] tubes, with sinusoidal [9] or omega (Ω)-shaped [10] structures also being considered. Wade [11], Palanivelu et al. [12], and other researchers compared the various energy absorption mechanisms of the same material with different geometries, dimensions, and triggering mechanisms. Their results proved that SEA is not an intrinsic property of the composites and is heavily dependent on the shape and geometry of the specimen.
To avoid the complexities and expenses of the manufacturing of self-supporting specimens, some research groups have tried to perform tests on plates. Since flat specimens, when submitted to lateral compressive loads, tend to buckle, application of an anti-buckling fixture to support the plates is mandatory. One of the first fixtures of this type found in literature is mentioned in the NASA contractor report 4562 [13] developed by Lavoie and Morton. With the application of knife-edge supports, those researchers were able to abolish the problem of the binding of the load transfer platen and achieved sustained crushing loads over long strokes.
However, the fixture did not permit frond formation, i.e., the typical result of the progressive failure mode, and the accumulation of debris near the crush zone caused jamming of the specimen [14]. Other research groups in universities and institutes have tried to overcome these problems and have manufactured their own fixtures. Table 1 gives a comparison of some of these fixtures [14].

Table 1.
Comparison of some of the fixtures already developed and reported in the literature [14].
This again emphasizes the importance of having a fixture capable of performing standardized tests under both quasi-static and dynamic conditions with reliable and reproducible results replicating the crush modes happening in a real component. Further, the test results obtained with a standardized fixture can be used to calibrate material card parameters in numerical investigations, which can then be used to predict component level damage as was done by [18].
All these aspects were considered during the fixture design process to create a fixture with reliable and reproducible results for future standardized tests of the crashworthiness of composite plates. To be in accordance with the already active standards for damage resistance and compressive residual strength measurement of composite flat plates, this fixture was designed to support specimens with the same dimensions of 150 × 100 mm. The position of supporting columns could be changed to study various unsupported heights and how they affect the crushing of the specimens. Cylindrical columns with a 10 mm diameter were used to avoid tearing of the test elements. The gap between the supporting plates allows the use of a high-speed camera and the observation of the energy absorption mechanism and crack propagations while crushing the elements. This new design allows up to 50 mm of material to be crushed without jamming due to the fronds and debris. Having this large crushable length allows researchers to study higher impact energies and crushing mechanisms far from triggers used for the initiation of the steady crushing.
Since the early days of the crashworthiness evaluation of composite structures, it was observed that the correct trigger mechanism is mandatory to initiate the progressive crush and maximize energy absorption [19]. Some researchers have used external triggers like chamfers in the fixtures [17,20] or metallic plugs [21], while others have studied internal triggers like less stiff and different stacking layers of fibers in the crush front [6,22] or different geometries such as steeple or chamfer [23], v-shaped [24], sawtooth [14], or other geometries. It was reported that sawtooth triggers allow the symmetric progressive crushing of the flat specimens with both splaying of the outer layers and fragmentation of the inner ones [14]. Thus, this trigger mechanism was chosen for the current research study.
In this study, with the help of simulations done with Altair HyperWorks for design and optimization purposes, a newly developed anti-buckling fixture was manufactured. Experimental tests were used to study the robustness of this new fixture. The results of experimental tests allow a better understanding of the different failure modes and identify the parameters needed for the mathematical criteria used to describe the related crashworthiness of composite plates. Different testing conditions were designed to carry out a comprehensive study assessing the repeatability of the tests and the reliability of the results.
2. Materials and Methods
2.1. Fixture Design
Instron drop tower testing apparatus was selected since it has already been used for numerous standards, such as those of ASTM (West Conshohocken, Pennsylvania, United States), ISO (Geneva, Switzerland), Boeing (Chicago, Illinois, United States), and Airbus (Leiden, Netherlands), to assess high-speed puncture, damage resistance, post-impact compressive strength, and other properties of composite materials [25]. The Instron 9450 drop tower, capable of delivering 0.59–1800 J of impact energy, equipped with 222 kN strain gauge load cell striker and an acquisition system with a sampling frequency of 1 MHz was used for the experimental analysis. The cylindrical striker hits the top plate of the fixture in the center, transferring the impact energy to the supported composite specimen, and measures the resistive force of the flat element being crushed.
The newly designed fixture included a base plate, four anti-buckling columns, a top plate, four guide columns, and four lateral supports fastened onto two support plates that held the specimen in its place, as seen in Figure 1. The two support plates could be translated laterally using a screw mechanism to ensure that the specimen was held in place. Four rubber inserts were added on the top of these two plates, two on each plate, that could absorb any residual energy not propagated away from the fixture by the crushing of the specimen to avoid permanent damage to the fixture. Finite element analysis (FEA) investigation using HyperWorks Suite was conducted to aid the design process for the fixture.
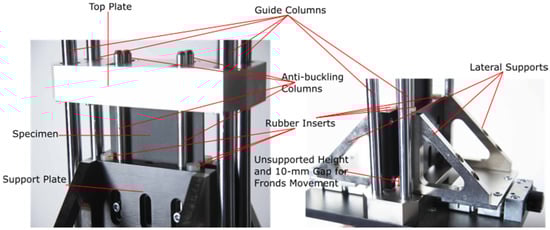
Figure 1.
Image of the newly developed fixture with the carbon-fiber-reinforced flat specimen.
2.1.1. Design Using FEA
In the design process, the fixture needed to be sufficiently robust to handle the maximum energy level of the drop tower, and the top plate was optimized for the same reason. The effects of different diameters and distances between anti-buckling columns were assessed by means of numerical simulation to arrive at their optimum values. After the design was finalized, a carbon-fiber-reinforced polymer (CFRP) plate 15 mm thick was tested, once again, using simulations to study the robustness of the fixture in coping with specimens made of different thicknesses and materials. The final design was a fixture suitable to conduct in-plane compression testing on composite plates made of a variety of materials with thickness up to 16 mm. Composite specimens with dimensions up to 100 × 150 mm could be tested, and provisions were made to allow smaller sized plates to be tested at up to 1850 J with unsupported heights up to 50 mm. Within the HyperWorks Suite, HyperMesh was used for preprocessing, HyperGraph and HyperView were used for post-processing, and Radioss was used as a solver. CFRP flat plates were modeled for the investigation due to the availability of material characterization data for the same.
The simulation model, as shown in Figure 2, was constructed. It was simplified as compared to the fixture seen in Figure 1 to reduce the effect of contact modeling on the results. As a result of the simplification, most constraints such as lateral supports and support plates were replaced with different boundary conditions and rigid body elements depending on the test being performed. The boundary conditions and rigid bodies used are defined in the subsequent sections, as they were dependent on the load case being analyzed.
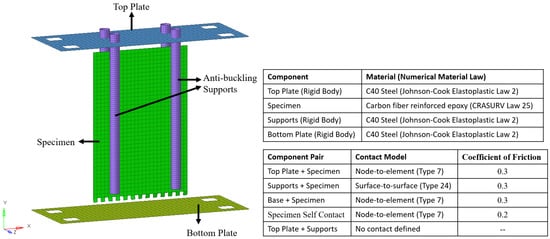
Figure 2.
Final model setup isometric view and relevant material and contact modeling information.
The numerical fixture model constituted a composite flat plate that stood on a steel base. It was laterally supported by four steel anti-buckling columns and impacted by a steel plate. The composite material was modeled using Law 25′s CRASURV formulation of the RADIOSS material model library, which modeled orthotropic behavior as elastic until yield and plastic (for shear) afterward. CRASURV formulation is a more robust formulation of the Tsai–Wu criteria. It allows different hardening (for shear) and failure parameters in all directions for tension, compression, and shear. Failure occurrence is strain- and/or energy-based and a combination of the two could be selected. For this study, failure initiation was modeled by a combination of the two based on which failure event occurred first. Equation (1) shows the yield-surface equation of the CRASURV formulation, where Wp represents plastic work, and puts in evidence how this is different from the classical Tsai–Wu formulation, wherein yield stresses are functions of Fij factors and are not a function of . No strain rate behavior was modeled as all tests were conducted between 4–8 m/s, a range too narrow to observe any strain rate effects.
where is the variable coefficients, is the plastic work per unit volume, is the stress in the material coordinate system, and are the principal directions.
Table 2 reports material information about the used carbon-fiber-reinforced epoxy material, properties of which were obtained from characterization tests undertaken according to ASTM standards D3039 (tensile), D0790 (flexural), D3518 (shear), and D3410 (compression). The energy failure value and compressive and shear residual stresses were obtained by the use of an optimization technique developed by Garg et al. [26]. The energy failure value is the described in Equation (1) and is one of the failure criteria available as part of the CRASURV model that retains the integrity of the element until the element absorbs energy equal to the failure value, after which softening takes place until the compressive and shear residual stress values shown in Table 2. As a macroscale model was used that modeled the composite plate with stacked shell elements only, to obtain computational efficiency, strain energy release rate (SERR) was not used, as SERR is typically used for mesoscale models where the interface is modeled. The tested CFRP material plate was composed of four plies made of 2 × 2 woven fabric material. The layup of the plies was [0 90 0 90]. The thickness of each ply was 0.64 mm, thereby resulting in a laminate 2.54 mm thick. Properties in 1 and 2 directions were assumed equal as the material was quasi-isotropic.
Table 2.
Material properties of carbon-fiber-reinforced epoxy specimen.
Steel components were modeled using the Johnson–Cook elastoplastic material model. An elastoplastic model was used because the top plate needed to be optimized for thickness to ensure there was no plasticity upon impact. After optimization of the top plate, the same material model for the top plate was used for the entire analysis as the optimization resulted in a top plate that only deformed in an elastic manner. C40 steel parameters were obtained from the Total Materia database [27] and are reported in Table 3.
Table 3.
Material properties of C40 steel [27].
Anti-buckling supports were modeled with a 1 mm element size to capture the curvature and were modeled as rigid bodies for all simulations to enable the respective elements belonging to the rigid bodies to deform synchronously. The boundary condition applied to the supports prevented them from any translational or rotational degrees of freedom (DoFs). The top and bottom plates were modeled with a 5 mm element size and were modeled as rigid bodies. An exception was the case where optimization was performed on the top plate to determine its appropriate thickness. In this case, the top plate was not modeled with a rigid body element, thereby permitting the elements to deform nonsynchronously. After optimizing the top plate and ensuring that the deformations were purely elastic, rigid body elements were introduced for the subsequent runs. Boundary conditions applied to the bottom plate were similar to those for the supports, thereby not allowing it to translate or rotate in any direction, resulting in zero DoFs. The top plate was only allowed to translate in the y-direction to permit crushing. Again, the exception was the optimization of the top plate thickness case, wherein no boundary conditions were applied for the same, thereby allowing all DoFs. All components were modeled with fully integrated Batoz shell elements. A 4 mm element size was adopted for the composite specimen, which was considered optimal, considering the tradeoff between accuracy and efficiency, based on previous studies conducted on the crashworthiness of composite materials that recommended an element size between 3 and 5 mm [6,18,28]. Additionally, a 4 mm element size enabled scaling up of the methodology to component testing without a significant increase in simulation run time, as the time step is dependent on the element size for explicit integration used. Property type 11 was used to model the thickness and orientation of each ply of the laminate. No boundary conditions were applied to the specimen. The final models consisted of approximately 12,500 elements and 6800 DoFs. Contact models are listed in Figure 2, together with the assumed values for friction coefficients obtained from the literature [29,30,31]. Thickness changes in the components were taken into account while calculating the stiffnesses between the components in modeling the contact. Of the four available options, the stiffness formulation shown in equation 2 was selected due to its robustness. Minimum stiffness of 1 kN/mm was used to eliminate the possibility of a “too soft” contact. Master and slave stiffnesses were calculated from equations 3 and 4, respectively. No maximum stiffness was inputted. No contact was modeled between the supports and the top plate as they were never in contact with one another.
where and are the respective stiffnesses, is the minimum stiffness, is the maximum stiffness, is a numerical stiffness factor that can be used to scale the stiffness, is the Young’s modulus, is the thickness, and and are slave and master elements, respectively.
2.1.2. Identification of the Thickness of the Top Plate
The top plate was initially designed to be 10 mm thick. However, when impacted with an energy of 1850 J using an impact mass of 145 kg and impact velocity of 5 m/s, plastic strains were observed at the point of impact and around the edges of the inserts for the anti-buckling supports, while a full elastic situation was desired. Although the drop tower used was only capable of delivering 1800 J of energy, the numerical analysis was conducted with 1850 J to allow a safety buffer of 50 J. The plate thickness was increased in increments of 5 mm until the deformations were completely within the elastic range. Plastic strains were still observed in two corners and in the middle of the plate when the thickness was increased to 20 mm. No plasticity was observed at 25 mm thickness; hence, the top plate was designed to be 30 mm thick, allowing 5 mm as a margin of safety justified by the plausible difference between the actual material properties and the ones used for the numerical model, which were obtained from an online database. Figure 3 shows the difference in the wideness of the plastic areas between the 10, 20, and 30 mm thick plates. The thickness of the bottom plate was fixed at 15 mm, and no plastic strains were observed as the specimen absorbed the impact energy. Hence, it was not necessary to optimize the thickness of the bottom plate.
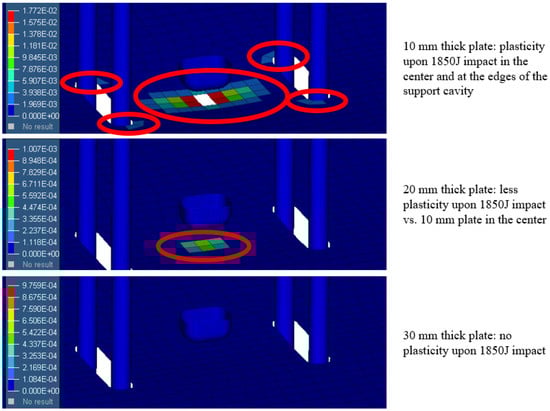
Figure 3.
Top plate optimization with 1850 J impact. Images show the equivalent plastic strain field. From top to bottom: 10 mm thick plate, 20 mm thick plate, and 30 mm thick plate.
2.1.3. Identification of Optimum Diameter, Spacing, and Unsupported Height of the Anti-buckling Columns
Three different geometrical parameters were considered in sequence for the design of the anti-buckling supports: column diameter, column spacing, and unsupported height. The investigation was conducted with a 550 J impact with a 22 kg top plate impacting at 7 m/s.
In order to assess the effect of the change in diameter of the anti-buckling columns on the deformation and impact behavior and arrive at the optimum value for the diameter, three different values were investigated: 5, 10, and 20 mm. As seen from Figure 4, a 20 mm diameter led to slight fronding on top and local buckling at the base with an extension of 30 mm along the length of the composite plate. The 5 mm diameter supports led to local buckling with an extension of 40 mm along the length of the composite plate, although no damage was observed at the top. The 10 mm diameter supports did not cause any damage on top and led to slight local buckling (as observed by the lighter shade of the elements) with an extension of 25 mm along the length of the specimen. Thicker 20 mm supports impeded fronding at the bottom and led to non-progressive damage at the bottom, which could have caused slight fronding to initiate at the top of the specimen. Thin 5 mm diameter supports did not offer enough lateral support against vibrations caused by the impact, which led to an increase in buckling when compared to that observed using 10 mm supports. Hence, 10 mm thick supports provided the best solution. Moreover, a 10 mm diameter allowed space for threaded inserts to be added, which were used to change the unsupported height. Unsupported height is the length of the specimen that is not held in place by the anti-buckling supports, effectively causing the supports to not touch the base plate.
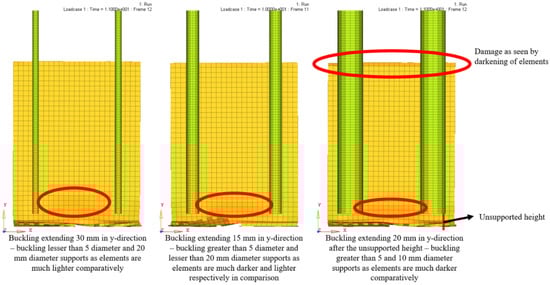
Figure 4.
Effect of change in anti-buckling column thickness at end of impact. From left to right: 5, 10, and 20 mm.
To assess the effects of distance between the anti-buckling columns on the deformation and impact behavior, three different distances, measured as the distance between the central axes of the supports, were investigated: 50, 65, and 80 mm. A 50 mm gap between the supports led to multiple local bucklings, possibly because the specimen became overconstrained in the center, whilst an 80 mm gap led to damage from the top, as seen in Figure 5. A large unsupported area on the top when the distance was 80 mm led to damage initiating from the top until the impact wave reached the bottom, causing the specimen to start crushing progressively. A 65 mm gap neither caused damage on the top nor multiple bucklings and was, therefore, selected as the final design distance. Additionally, provision was left in the final design to allow for a third anti-buckling column in case the buckling in the center was too high for some materials.
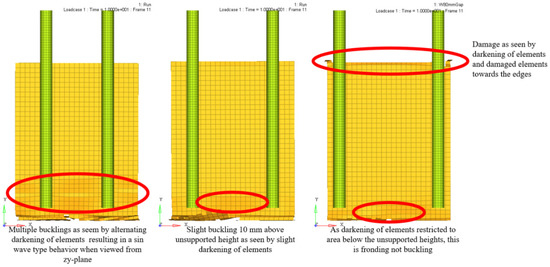
Figure 5.
Effect of change in distance between the anti-buckling columns at end of impact. From left to right: 50 mm, 65 mm, and 80 mm.
It has been reported in the literature that different unsupported heights lead to different impact behavior [11,14,24]; therefore, a provision to modify the unsupported height was added. Upon investigation, it was discovered, through simulations, that a 10 mm unsupported height led to a stable crush. A 5 mm unsupported height resulted in the fronds interacting with the supports as there was not enough distance for fronds to propagate away from the specimen, which led to a higher force. The 20 and 35 mm heights led to significant buckling as the unsupported height was too great, resulting in a lower force being registered as shown in Figure 6. Force registered for 30 mm unsupported height was generally lower than that for 20 mm unsupported height, showing a greater influence of buckling. The heights were modified by translating the supports in the y-direction.
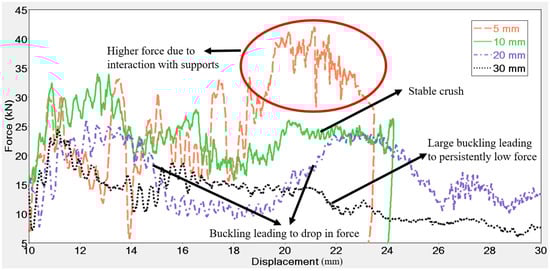
Figure 6.
Effect of different unsupported heights: 5, 10, 20 and 35 mm.
Finally, the thickness of the CFRP specimen was increased to 15.36 mm (24 ply thick CFRP laminate) to determine whether an 1850 J impact using a 145 kg impactor falling at 5 m/s would be able to initiate failure using the designed fixture. As shown in Figure 7, fronding was observed at 2 ms, which was followed by fragmentation. Owing to the greater thickness of the specimen, all the impact energy was absorbed within 15 mm of displacement. This suggested that laminates as thick as 16 mm with energy absorption capabilities lower than CFRP, for example GFRP, could also be tested using the designed fixture as the maximum allowable stroke distance was 50 mm. After a displacement of 50 mm, rubber inserts caused the impactor to bounce back and avoid possible damage to the entire fixture due to high unabsorbed energies.
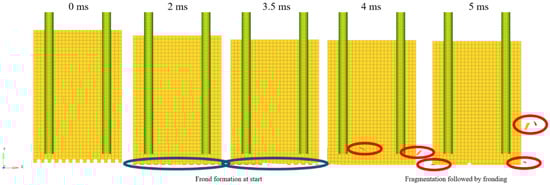
Figure 7.
Damage progression in a 24 ply thick carbon-fiber-reinforced polymer (CFRP) laminate.
After considering all these aspects, the fixture was designed and manufactured; the manufactured fixture is shown in Figure 8.
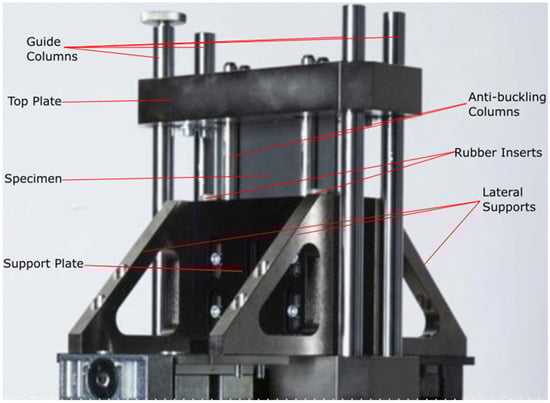
Figure 8.
Image of the anti-buckling fixture designed for crashworthiness evaluation of flat composite plates under axial impact load.
2.2. Experimental Refinement of the Design
The preliminary results proved the functionality of the fixture in accordance with the design and simulation results. As discussed in the introduction, two of the common drawbacks of the previously developed fixtures are tearing of the specimen and jamming of the fixture. However, it was observed that the circular anti-buckling columns with 10 mm diameters and 65 mm distance from each other were able to support the specimen without causing tearing. The 10 mm gap between the support and bottom plates provided the necessary space for the crushed parts to curve up freely and avoided jamming the fixture. Moreover, the high-speed camera from the side angle proved the success of the trigger in initiating the steady crushing of the composite element, and no buckling was recorded, which verified the functionality of the new anti-buckling fixture. Finally, no permanent plastic deformation was observed on the 30 mm thick steel top plate, which was aligned with the simulation results.
After gaining confidence in the applicability of the fixture, two kinds of materials were used for this initial study: glass-fiber-reinforced epoxy laminate made of 0°/90° fabrics according to the NEMA LI-1 standard [32] with a total thickness of 3 mm and GG630T-37 [33] carbon-fiber-reinforced epoxy laminate with a thickness of 2.5 mm made of high strength 2 × 2 carbon fabric twill. Table 4 reports the mechanical properties of the two composite materials, according to the supplier datasheets. Effects of unsupported height, impact mass, velocity, and energy were studied on these materials.
Table 4.
Mechanical characteristics of the specimens according to the supplier data sheets.
Specimens were 150 × 100 mm flat plates with sawtooth triggers of 5 mm depth (Figure 9). First, the effects of the unsupported height were studied to see the different responses of the specimens at 35, 20, 10, and 5 mm. Due to the relative scarcity of the CFRP specimens, only glass fiber ones were used in this stage. Then, the effect of the impact mass and impact velocity were studied on both glass and carbon fiber specimens.
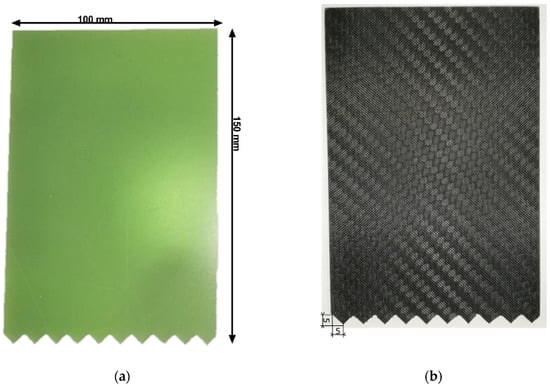
Figure 9.
Images of the two triggered specimens used for experimental evaluations: (a) NEMA FR4 glass fiber composite [32]; (b) GG630T-37 carbon fiber laminate [33].
In the literature, energy-absorbing capabilities are reported by various methods such as peak load and the mean crush force after that, crush force efficiency (which is the relation between these two forces), and SEA. Since in this fixture the metallic plate on top of the specimen is impacted by the metallic impactor of the drop tower, all tests show a huge initial peak and then a force drop to zero. This is because the contact between the impactor load cell and the upper plate is lost for some milliseconds due to the inertia. Therefore, peak forces and crush force efficiency are not used as energy absorption indicators in this paper and only SEA values are reported. Figure 10 illustrates these areas on the typical force–displacement curve obtained from experiments using this anti-buckling fixture and also shows the crushed specimen from two visual angles.
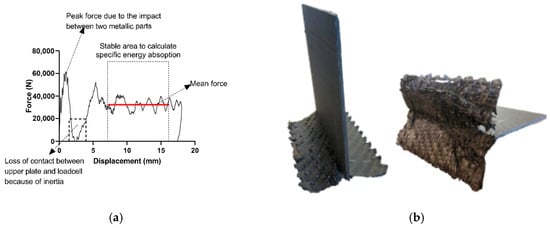
Figure 10.
Representative experimental results: (a) typical force–displacement graph obtained using the designed fixture, with different areas shown on the graph; (b) specimen at the end of the test process with total crushed length visible.
To calculate the SEA, the following formula was used:
where is the absorbed energy, is the force, is the material density, is the cross-sectional area, and is the length of the crushed part. The stable part of the force–displacement curve, which after several trials was identified to lie between 0.4 and 0.9 of the final displacement, was used to calculate SEA. In this way, both the initial and final perturbations of the graph, which are consequences other than material failure, were neglected and only the progressive crush area was considered. Absorbed energy, , is calculated by performing trapezoidal numerical integration of force–displacement data in this part of the curve, and is the total length of this section in force–displacement curve.
3. Results and Discussion
In this section, the results of the first experimental campaign are reported in order to analyze the influence of some relevant parameters and to confirm the operability of the constructed testing apparatus. In particular, the influences of the unsupported height, the impact mass, and the impact velocity are considered.
3.1. Influence of Unsupported Height
For experimental validation of the unsupported height effects on the crash response of the specimen, tests with four different free heights, namely 5, 10, 20, and 35 mm, were performed on glass fiber specimens. Figure 11 shows snapshots of specimens under impact in each of the four conditions. In the extreme case of 35 mm of unsupported height, huge plate bending appears and the specimen crush failure is far from the expected one. In the case of 20 mm of unsupported height, the resulting dominant failure modes are delamination and splaying, which are not as effective as fragmentation in energy absorption [2,3].
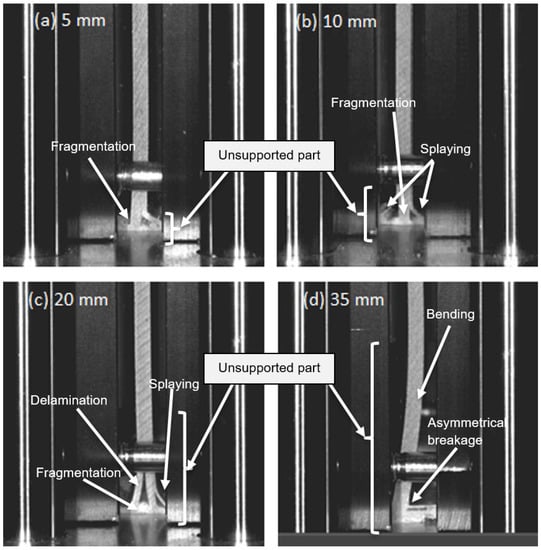
Figure 11.
Effects of unsupported height on the crash mode of specimens under impact with 550 J of energy and 70 kg of mass. (a) 5 mm where only mode is fragmentation, (b) 10 mm that allows splaying mode to occur as well, (c) 20 mm which delamination and splaying are the dominant failure modes, and (d) 35 mm where specimen is hugely bended and asymmetrical breakages takes place.
With 10 mm of free height, we see the mixed mode of crushing, i.e., splaying of the outer layers and fragmentation of the inner ones; this is the expected failure mode. Finally, in the case of 5 mm unsupported height, the specimen is overly constrained by the fixture such that splaying and delamination are not observed. Figure 12 includes two diagrams. The first diagram reports the force–displacement curves obtained during the tests with the four considered different values of the unsupported heights. While the first parts of the four curves are nearly superimposed, differences can be noticed. The curve obtained for the case of 10 mm shows a more stable behavior, indicating a more stable crush process. Similar force–displacement trends were observed in the numerical results (Figure 6), which certifies the reliability of both experimental and modeling approaches.
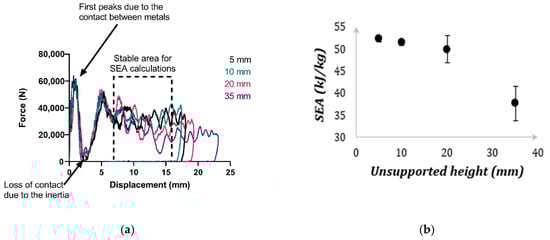
Figure 12.
Effect of unsupported height: (a) force–displacement curves for the tested specimens; (b) specific energy absorption vs. unsupported height.
The second diagram reports the values of SEA as a function of the considered variables. The 10 mm solution is characterized by a high value of SEA and a small spread. Meanwhile, the results for 20 mm and, much more, for 35 mm are characterized by lower values of SEA (meaning that the developed failure mode is not the right one) and higher values of spread (indicating higher uncertainty in the obtained values). Both diagrams prove the effects of unsupported height on the energy absorption of the specimens. Similar trends were also observed in the past by researchers who found that, in particular, even if an over-constrained specimen leads to higher energy absorption capabilities [11,14], it results in a failure mode that is not representative of the reality, i.e., of the failure mode exhibited by real parts during impact. Since 10 mm free height allows the occurrence of the main absorption mechanisms characterized by Farley and Hull [2,3] during the tests, keeping the cylindrical supporting bars at 10 mm distance from the base was deemed appropriate.
3.2. Influence of Impact Mass
To investigate the effects of the impact mass on specimens’ responses, two sets of experiments were designed. First, at the constant impact energy of 550 J, the impact mass was increased from 34 to 50 kg and then to 70 kg. This resulted in decreasing the falling height and consequently the impact velocity from 5.65 to 4.69 m/s and then down to 3.95 m/s. In the second set of the experiments, the falling height, and consequently the impact velocity, was kept constant, and the impact mass was increased from 34 to 70 kg, which meant an increment of the impact energy from 375 to 770 J. These tests were performed on both glass and carbon fiber specimens; Figure 13 and Figure 14 illustrate the obtained results.
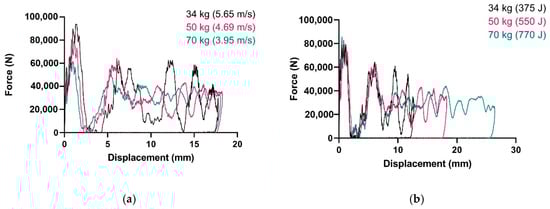
Figure 13.
Effect of impact mass on glass-fiber-reinforced epoxies: (a) force–displacement curves for tests at 550 J of impact energy; (b) force–displacement curves for tests at 4.69 m/s.
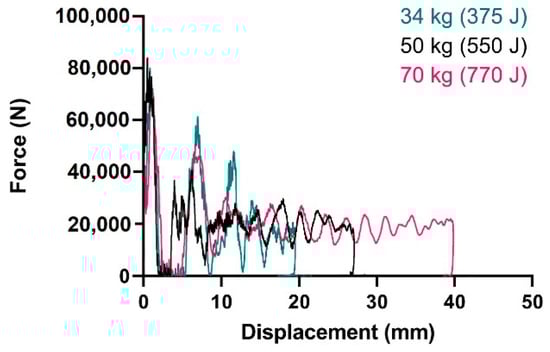
Figure 14.
Effect of impact mass on carbon-fiber-reinforced epoxies: force–displacement curves for tests at impact velocity of 4.69 m/s.
As can be seen in these figures and in Table 5, the value of the impact mass affects the curve trend, which becomes more stable with a higher value of the impacting mass, but does not affect the mean value of the force (i.e., the energy absorption capabilities).
Table 5.
Specific energy absorption calculated for tests with different impact masses.
3.3. Influence of Impact Velocity
The third studied parameter was the effects of impact velocity on the specimen responses. Here as well, two sets of experiments were designed. First, by maintaining the impact energy at 550 J, the impact velocity was increased from 3.95 to 4.69 m/s and then to 5.65 m/s by decreasing the impact mass from 70 to 50 kg and then to 34 kg. In the second case, the impactor mass was kept 70 kg and impact velocity was increased from 3.96 to 4.69 m/s and then to 5.34 m/s. Figure 15 illustrates the representative force–displacement curves obtained for glass-fiber-reinforced specimens.
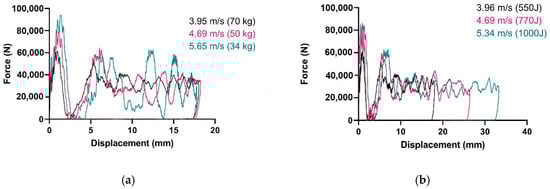
Figure 15.
Effect of impact velocity on glass-fiber-reinforced epoxies: (a) force–displacement curves for tests at 550 J of impact energy; (b) force–displacement curves for tests with impact mass of 70 kg.
While the curves of Figure 15a show a trend similar to the one already noted in Figure 13a, the curves of Figure 15b are nearly superimposed and have good trend stability. This means that, for the particular considered material, the impact energy does not affect the crushing mechanism, while the use of a 70 kg falling mass leads to a more stable progressive trend in the failure evolution. Figure 16 shows the companion results obtained from testing GG630T-37 carbon fiber flat laminates at different velocities. In one set of tests, the impact mass was 50 kg; in the other set, it was 70 kg. Here as well, the obtained force data are similar for different velocities, and only the crushed length increases due to the higher impact energy.
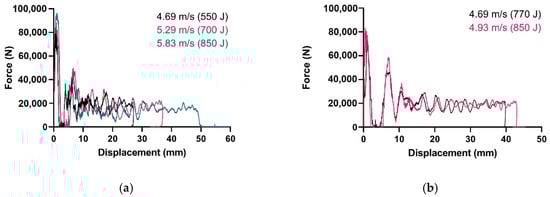
Figure 16.
Effect of impact velocity on carbon-fiber-reinforced epoxies: (a) force–displacement curves for tests with impact mass of 50 kg; (b) force–displacement curves for tests with impact mass of 70 kg.
Figure 15 and Figure 16 illustratively and Table 6 quantitatively demonstrate that, in the range of impact velocities and masses that were examined, impact velocity, similar to impact mass, does not affect the SEA capabilities of the composite material. This was reported in the literature by other researchers as well [34], which supports the reliability of the results obtained from the novel fixture.
Table 6.
Specific energy absorption calculated for tests at different impact velocities.
4. Conclusions
In the present study, a new anti-buckling fixture developed for in-plane impact tests has been presented. To prevent catastrophic crushing due to the global bucking, flat specimens must be supported by a specific fixture. The newly designed fixture has to solve all the shortcomings that characterize the previously published solutions; in particular, it must have adjustable support length for specimens with various thickness, allow the frond formation, avoid the tearing failure at the impacted edge, and allow the removal of the debris from the crushing side. Numerical simulation was used to design and develop a fixture specifically devoted to lateral impact testing of laminate, aimed at material characterization. The designed fixture can be fully integrated with Instron drop tower testing machines and can be used to conduct crashworthiness tests up to 1850 J on composite flat-plate specimens measuring up to 100 × 150 × 16 mm.
As a part of the numerical simulations, optimization was conducted on different design parameters. At first, the top plate was analyzed to set its thickness in order to avoid plastic deformation at high energy levels. A 30 mm thick steel plate only undergoes elastic deformation under the maximum impact energy. Further studies were conducted to determine the optimum diameter of and distance between anti-buckling columns. Column diameter of 10 mm and spacing of 65 mm allow progressive damage initiation from the bottom without significant local buckling. Moreover, the effect of different unsupported heights, as reported in previously published studies, was also discovered in numerical simulations and was confirmed through experiments conducted on GFRP plates. A 10 mm unsupported height avoids buckling of the specimen, whilst allowing fronds resulting from progressive crushing to propagate freely without interactions with fixture components, thereby providing results that are purely a function of material properties and specimen geometry.
Experimental tests with CFRP and GFRP plates were conducted on this new fixture to assess the influence of unsupported height, impact mass, and velocity on the obtained force–displacement results. It was observed that with the same impact energy, changing the impact mass or velocity does not affect the mean force or specific energy absorption of the specimen. Only in the case of lower masses were more oscillations noted in the force–displacement curves. Experimental results showed that the newly designed fixture has the following features:
- It is able to initiate progressive crushing, allowing multiple failure modes without any influence of its components on the results or jamming due to fronds or debris;
- It allows testing with various unsupported heights of up to 50 mm;
- It permits testing without the need for extensive calibration on standardized specimens of dimensions permitted according to CAI standard (ASTM D7137 and D7136);
- It is robust for energies up to 1850 J and fully integrable with the Instron drop tower testing apparatus that is widely used in academic and industrial institutions.
This fixture exhibits these features all whilst producing reliable and repeatable results. The fixture has the potential to standardize crashworthiness testing on composite materials, allowing faster integration of these materials into primary crash components. Subsequent studies will be conducted to test the possibility of using results obtained to fine-tune material parameters in numerical simulations to predict component level damage.
Author Contributions
Conceptualization, D.S.P., G.B., L.C., A.C. and G.G.; methodology, D.S.P., G.B., I.B., and R.G.; software, R.G. and L.C.; validation, I.B., R.G. and L.V.; formal analysis, I.B. and R.G.; investigation, I.B. and R.G.; resources, D.S.P., L.C., A.C., G.B. and G.G.; data curation, I.B., R.G. and L.V.; writing—original draft preparation, I.B. and R.G.; writing—review and editing, I.B., R.G., L.V., D.S.P., G.B., A.C., and G.G.; visualization, I.B. and R.G.; supervision, D.S.P., G.B., L.C., A.C. and G.G.; project administration, D.S.P., L.C. and A.C.; funding acquisition, L.C., D.S.P. and A.C. All authors have read and agreed to the published version of the manuscript.
Funding
This research was funded by the European Union’s Horizon 2020 research and innovation program under the Marie Skłodowska-Curie grant number 721256.
Conflicts of Interest
The authors declare no conflict of interest. The funders had no role in the design of the study; in the collection, analyses, or interpretation of data; in the writing of the manuscript; or in the decision to publish the results.
References
- Ramakrishna, S.; Hamada, H. Energy absorption characteristics of crash worthy structural composite materials. Key Eng. Mater. 1998, 143, 585–620. [Google Scholar] [CrossRef]
- Farley, G.L.; Jones, R.M. Energy-Absorption Capabhjity of Comiposite Tubes and Beams. Ph.D. Thesis, Virginia Polytechnic Inst. and State University, Blacksburg, VA, USA, 1989. [Google Scholar]
- Hull, D. A unified approach to progressive crushing of fibre-reinforced composite tubes. Compos. Sci. Technol. 1991, 40, 377–421. [Google Scholar] [CrossRef]
- Carruthers, J.J.; Kettle, A.P.; Robinson, A.M. Energy absorption capability and crashworthiness of composite material structures: A review. Appl. Mech. Rev. 1998, 51, 635–649. [Google Scholar] [CrossRef]
- Wang, P.; Zhang, Y.; Yang, F.; Tian, K.; Zhao, Q.; Fan, H. Energy absorption of thin-walled circular tubes with gradient thickness under oblique loads. Proc. Inst. Mech. Eng. Part C J. Mech. Eng. Sci. 2020, 234, 3207–3220. [Google Scholar] [CrossRef]
- Boria, S.; Obradovic, J.; Belingardi, G. Experimental and numerical investigations of the impact behaviour of composite frontal crash structures. Compos. Part B Eng. 2015, 79, 20–27. [Google Scholar] [CrossRef]
- Mamalis, A.G.; Manolakos, D.E.; Ioannidis, M.B.; Papapostolou, D.P. Crashworthy characteristics of axially statically compressed thin-walled square CFRP composite tubes: Experimental. Compos. Struct. 2004, 63, 347–360. [Google Scholar] [CrossRef]
- Xu, F.; Zhang, S.; Wu, K. Dynamic crashing behavior of thin-walled conical tubular structures with nonlinearly-graded diameters. Proc. Inst. Mech. Eng. Part C J. Mech. Eng. Sci. 2019, 233, 2456–2466. [Google Scholar] [CrossRef]
- Hanagud, S.; Craig, J.I.; Sriram, P.; Zhou, W. Energy Absorption Behavior of Graphite Epoxy Composite Sine Webs. J. Compos. Mater. 1989, 23, 448–459. [Google Scholar] [CrossRef]
- Dormegnie, D.; Coutellier, D.; Delsart, D.; Deletombe, E. Studies of scale effects for crash on laminated structures. Appl. Compos. Mater. 2003, 10, 49–61. [Google Scholar] [CrossRef]
- Bonnie Wade Capturing the Energy Absorbing Mechanisms of Composite Structures under Crash Loading. Ph.D. Thesis, University of Washington, Seattle, WA, USA, 2014.
- Palanivelu, S.; Van Paepegem, W.; Degrieck, J.; Vantomme, J.; Kakogiannis, D.; Van Ackeren, J.; Van Hemelrijck, D.; Wastiels, J. Crushing and energy absorption performance of different geometrical shapes of small-scale glass/polyester composite tubes under quasi-static loading conditions. Compos. Struct. 2011, 93, 992–1007. [Google Scholar] [CrossRef]
- Lavoie, J.A.; Morton, J. Design and Application of a Quasistatic Crush Test Fixture for Investigating Scale Effects in Energy Absorbing Composite Plates. M.S. Thesis, Virginia Polytechnic Institute and State University, Blacksburg, VA, USA, 1993. [Google Scholar]
- Feraboli, P. Development of a modified flat-plate test specimen and fixture for composite materials crush energy absorption. J. Compos. Mater. 2009, 43, 1967–1990. [Google Scholar] [CrossRef]
- Daniel, L.; Hogg, P.J.; Curtis, P.T. Relative effects of through-thickness properties and fibre orientation on energy absorption by continuous fibre composites. Compos. Part B Eng. 1999, 30, 257–266. [Google Scholar] [CrossRef]
- Daniel, L.; Hogg, P.J.; Curtis, P.T. Crush behaviour of carbon fibre angle-ply reinforcement and the effect of interlaminar shear strength on energy absorption capability. Compos. Part B Eng. 2000, 31, 435–440. [Google Scholar] [CrossRef]
- Jacob, G.C.; Michael Starbuck, J.; Simunovic, S.; Fellers, J.F. New Test Method for Determining Energy Absorption Mechanisms in Polymer Composite Plates. Polym. Compos. 2003, 24, 706–715. [Google Scholar] [CrossRef]
- Reuter, C.; Sauerland, K.H.; Tröster, T. Experimental and numerical crushing analysis of circular CFRP tubes under axial impact loading. Compos. Struct. 2017, 174, 33–44. [Google Scholar] [CrossRef]
- Thornton, P.H. Energy Absorption in Composite Structures. J. Compos. Mater. 1979, 13, 247–262. [Google Scholar] [CrossRef]
- Tong, Y.; Xu, Y. Improvement of crash energy absorption of 2D braided composite tubes through an innovative chamfer external triggers. Int. J. Impact Eng. 2018, 111, 11–20. [Google Scholar] [CrossRef]
- Eshkoor, R.A.; Oshkovr, S.A.; Sulong, A.B.; Zulkifli, R.; Ariffin, A.K.; Azhari, C.H. Effect of trigger configuration on the crashworthiness characteristics of natural silk epoxy composite tubes. Compos. Part B Eng. 2013, 55, 5–10. [Google Scholar] [CrossRef]
- Ren, Y.; Liu, Z.; Jiang, H.; Zheng, J. A Novel Multi-Stage Stacked Triggering Method to Induce Progressive Failure Behaviors of Composite Corrugated Plate. Appl. Compos. Mater. 2020, 55–74. [Google Scholar] [CrossRef]
- Guillon, D.; Rivallant, S.; Petiot, C.; Pechnik, N. Initiation and Propagation Mechanisms of Progressive Crushing in Carbon-Epoxy Laminated Plates. In Proceedings of the ECCM13—13th European Conference on Composite Materials, Stockholm, Sweden, 2–5 June 2008; pp. 1–10. [Google Scholar]
- Ueda, M.; Anzai, S.; Kubo, T. Progressive crushing of a unidirectional CFRP plate with V-shaped trigger. Adv. Compos. Mater. 2015, 24, 85–95. [Google Scholar] [CrossRef]
- The Instron Drop Tower 9400 Series. Available online: https://www.instron.us/products/testing-systems/impact-systems/9400-series-drop-tower (accessed on 30 October 2020).
- Garg, R.; Babaei, I.; Paolino, D.S.; Vigna, L.; Cascone, L.; Calzolari, A.; Galizia, G.; Belingardi, G. Predicting Composite Component Behavior Using Element Level Crashworthiness Tests, Finite Element Analysis and Automated Parametric Identification. Materials 2020, 13, 4501. [Google Scholar] [CrossRef]
- Totalmateria.com C40 Steel Mechanical Properties. Available online: https://search.totalmateria.com/MaterialDetails/MaterialDetail?vkKey=1320394&keyNum=502&type=12&hs=1 (accessed on 17 February 2019).
- Cherniaev, A.; Butcher, C.; Montesano, J. Predicting the axial crush response of CFRP tubes using three damage-based constitutive models. Thin-Walled Struct. 2018, 129, 349–364. [Google Scholar] [CrossRef]
- Schön, J. Coefficient of friction for aluminum in contact with a carbon fiber epoxy composite. Tribol. Int. 2004, 37, 395–404. [Google Scholar] [CrossRef]
- Dhieb, H.; Buijnsters, J.G.; Eddoumy, F.; Celis, J.P. Surface damage of unidirectional carbon fiber reinforced epoxy composites under reciprocating sliding in ambient air. Compos. Sci. Technol. 2011, 71, 1769–1776. [Google Scholar] [CrossRef]
- Win KHUN, N.; Zhang, H.; Hoon LIM, L.; Yoon YUE, C.; Yang, J. Tribological properties of short carbon fibers reinforced epoxy composites. Friction 2014, 2, 226–239. [Google Scholar] [CrossRef]
- NEMA LI 1-1998 (R2011): Industrial Laminated Thermosetting Products. Available online: https://www.nema.org/Standards/ComplimentaryDocuments/LI1.pdf (accessed on 7 July 2020).
- GG 630 T» Microtex Composites. Available online: https://microtexcomposites.com/en/p/gg-630-t/ (accessed on 20 July 2020).
- Duong, A.V.; Rivallant, S.; Barrau, J.J.; Petiot, C.; Malherbe, B.Î. Influence of speed on the crushing behavior of composite plates. In Proceedings of the CCM 7—7th Asian-Australasian Conference on Composite Materials, Taipei, Taiwan, 15–18 November 2010; Volume 1, pp. 678–681. [Google Scholar]


Publisher’s Note: MDPI stays neutral with regard to jurisdictional claims in published maps and institutional affiliations. |
© 2020 by the authors. Licensee MDPI, Basel, Switzerland. This article is an open access article distributed under the terms and conditions of the Creative Commons Attribution (CC BY) license (http://creativecommons.org/licenses/by/4.0/).