Article

Osmolality of Components and Their Application in the Design of Functional Recovery Drinks

by
Anna Sadowska
1,*,
Franciszek Świderski
1 and
Wacław Laskowski
2
1
Department of Functional and Organic Food, Institute of Human Nutrition Sciences, Warsaw University of Life Sciences, Nowoursynowska Str. 159c, 02-776 Warsaw, Poland
2
Department of Food Market and Consumer Research, Institute of Human Nutrition Sciences, Warsaw University of Life Sciences, Nowoursynowska Str. 159c, 02-776 Warsaw, Poland
*
Author to whom correspondence should be addressed.
Appl. Sci. 2020, 10(21), 7663; https://doi.org/10.3390/app10217663
Submission received: 30 September 2020 / Revised: 23 October 2020 / Accepted: 27 October 2020 / Published: 29 October 2020
(This article belongs to the Special Issue Functional Foods and Human Health)

Abstract

:
Measuring the osmolality of electrolytes, carbohydrates, and other components that contain them, can be very helpful in the design of functional recovery drinks. This study aimed to develop functional recovery drinks based on natural fruit components with the addition of electrolytes and carbohydrates to improve water and electrolyte balance and provide energy after intense physical exertion, as well as ensuring a high content of bioactive ingredients and being of a good sensory quality. The study material consisted of blackcurrant fruit powders obtained by freeze-drying and spray-drying, along with other components such as electrolytes and carbohydrates. The osmolality of the fruit components was measured in aqueous solutions with concentrations from 2.5 to 10%, as well as electrolytes at 0.1 to 4.0% and carbohydrates from 1 to 30%. The sensory quality of drinks was assessed using a scaling method. The content of polyphenols and antioxidant properties were measured spectrophotometrically and the vitamin C content by high-pressure liquid chromatography. Based on the obtained results, five versions of recovery drinks were prepared of defined compositions. These drinks contained fruit powders ranging from 3 to 7%, glucose at 1 to 5%, sucrose 5%, and added electrolytes ranged 0.1 to 0.2% for NaCl and KCl at 0.025%. Their osmolalities ranged from 401 to 564 mOsm/kg H2O, the total polyphenol content was 43 to 62 mg GAE/100 mL, and vitamin C 26 to 35 mg/100 mL. All drinks possessed satisfactory sensory quality. It was established that it is possible to obtain fruit recovery drinks containing defined amounts of electrolytes, carbohydrates, and osmolality values recommended for this type of drink.

1. Introduction

Osmolality can be an important indicator for determining how useful beverages are for hydrating the body [1]. Its measurement is particularly appropriate for cases of dehydration, sodium/potassium disorders, glucose fluctuations, exogenous poisoning, adrenal insufficiency, and neurological injury, as well as in physical exercise and other challenging circumstances [2]. Sports drinks are an important part of the functional beverages available on the market which are retailed as drinks that replenish electrolytes lost during exercise, supply carbohydrates, prevent dehydration, and sustain endurance capacity [3,4,5,6]. Intensive exercise may lead to sweat rates of 1 L/h, whilst exercising at high temperatures may increase sweat loss of >2 L/h. Progressive dehydration is likely in those sweating over long time periods that can produce metabolic or physiological effects such as reduced blood flow, impaired heat exchange, reduced oxygen supply to muscle cells, increased stress hormone levels, and enhanced glycogen breakdown rates in the liver and muscle [7,8,9,10]. When there is an insufficient fluid intake, sweating becomes also limited which at high ambient temperatures may cause the body to overheat. Any ongoing dehydration generally may constitute a threat to health and performance capacity will become reduced. Controlling the body’s hydration status is thus very important. The two predominant factors that lead to premature fatigue are depletion of the body’s carbohydrate reserves and losses of water and electrolytes via sweating. Being appropriately hydrated is, therefore, necessary to ensure that the body functions efficiently when engaged in sporting activities through consuming beverages of suitable osmolalities intended for sportspersons; the main purpose being to replenish any electrolytes lost during exercise, supplying carbohydrates, preventing dehydration, and sustaining endurance capacity [3,4,5,6,11]. Isotonic drinks have osmolalities ranging from 275 to 295 mOsm/kg water and are of similar osmotic pressure to body fluids. There are also various other “light” sugar-free drinks/mineral waters with osmolalities lower than 275 mOsm/kg water which are termed “hypotonic”. Unlike isotonic beverages, these are however unable to quickly improve water-electrolytes because of their lower electrolyte concentrations. Hypotonic drinks are in fact recommended for people performing moderate work or those engaging in not too intensive physical exercise nor of long duration without any excessive sweating. Current oral rehydration therapy guidelines suggest that hypotonic carbohydrate (CHO)–electrolyte solutions should be drunk whenever there is a need for rapidly replacing fluid [12,13,14]. If, however, the aim is to maintain fluids balance over prolonged periods, then drinking such hypotonic CHO–electrolyte solutions may be inappropriate because of differences in urine volume excreted. Electrolytes, especially sodium, play a major role in fluid homeostasis where the amounts of sodium and chloride lost through excretion are relatively large compared to losses in magnesium, calcium, and potassium. Rehydration with large amounts of plain water may cause hyponatremia (i.e., low blood sodium) [7,15,16,17], but not hypokalemia (i.e., low blood potassium) nor hypomagnesemia (i.e., low blood mag—magnesium). Gisolfi et al. 1992 [18] compared water absorption rates in a segment of the small intestine after perfusion with solutions of either isotonic sodium chloride or isotonic CHO-electrolyte (i.e., 8% sucrose and 16 mmol/L Na) and found that sodium chloride alone only marginally affected such rates, whereas CHO with sodium chloride increased the rates by around five-fold. Apart from sodium chloride, (and only in the presence of CHO), no other electrolytes affect water absorption [19]. Recent studies have shown that the CHO content is the most important factor affecting the rate of gastric emptying of rehydration drinks. CHO solutions at concentrations of >8 to 10% (w/v) significantly inhibit gastric emptying, thereby reducing fluid available for absorption, and should therefore not be used whenever there are sweat losses and the body’s resulting fluid requirements are high. Regular soft drinks and fruit juices containing large amounts of CHO therefore cannot be used as functional rehydration drinks; for example, most fruit juices and soft drinks contain >100 g CHO/I. This is also the case for designer energy drinks where osmolalities range from 500 to 800 mOsm/kg H2O, which reduces rapid fluid uptake by the body. Studies [7,19,20,21] on performance and fatigue recommend carbohydrate concentrations ranging from 60 to 80g/L in rehydration drinks as providing optimal support for performance. Whenever fluid losses are relatively small, it is possible to increase a drink’s CHO content to a maximum of 150 g/L if an optimal CHO supply of 30 to 60 g/h for performance support is the desired prime criterion. To this amount of CHO, sportspersons should then add appropriate amounts of water tailored to their individual needs and preferences. To keep the osmolality as low as possible, long-chain glucose polymers and/or maltodextrins are preferred because strongly hypertonic drinks will greatly increase secretion of fluid from the blood into the gut, thereby increasing the risk of gastrointestinal discomfort and diarrhea [7]. Sports drinks having a >8% CHO content may slow down gastric emptying and intestinal absorption during exercise compared to those with lower CHO concentrations. There appears to be no difference in rates of gastric emptying or fluid absorption between water and sports drinks when carbohydrate concentrations are between 4% and 8% [3]. Studies of CHO on sports performance and fatigue indicate that the minimum supply of CHO should be >20 g/h [7]. A study by Evans et al. (2009) [12] demonstrated that a hypertonic 10% glucose–electrolyte solution of about 667 mOsm/kg was more effective in maintaining a state of euhydration after exercise-induced dehydration of about 1.9% body mass than a 2% glucose solution with an osmolality of about 193 mOsm/kg and a 0% glucose solution with an osmolality of about 79 mOsm/kg. The literature reflects the possible risks of compounds, including sugars, caffeine, glycerol, and vitamin B2 found in sports drinks and energy drinks ingested by athletes and synergistic or antagonistic interactions of components of sports drinks [22]. Regarding dental health and sport dietary drinks, this study related the dental decay to the consumption of sports drinks with low pH [11]. Some of these beverages have cariogenic properties due to their sugar content. Furthermore, long-term exposure of the body to an excess of simple sugars is associated with the development of obesity, insulin resistance, and diabetes. In the case of caffeine, the literature underlines some adverse effects including nervousness, irritability, anxiety, and others. Concerning vitamin B2, one case report indicated suspected anaphylaxis after the intake of this ingredient as part of an energy drink. Several components of the drinks used by athletes (sports drinks, energy drinks, juices, and milk) can interact among themselves after the intake of different drinks causes negative effects such as side effects or decreases in activity. For example, drinks containing Ca such as milk significantly decrease Fe absorption, but positive interactions are also possible; for example, orange juice significantly increases Fe absorption. The most active ingredient present in energy drinks is caffeine, which is able to produce synergistic and reinforced stimulant effects in combination with guarana, ginseng, and taurine. Mixtures of different monosaccharides and disaccharides (glucose, fructose, and sucrose) interact, increasing carbohydrate absorption and oxidation during exercise more than themselves alone [11,22].
There is little literature data on the design of the recovery drinks composition and data regarding the dependence of regressive osmolality of electrolytes, CHOs, or fruit-based components on their concentrations in solution. Existing data are mainly concerned with measuring CHO osmolalities in physiological studies on body/animal hydration or those found in various beverages [2,3,22]. The literature indicates that a novel assortment of recovery drinks can be designed based on fruit powders with electrolyte additives for ensuring optimal rates of rehydration and delivering calories after exercising. It is thus assumed that investigating the relationships between regressive osmolalities with the concentrations of beverage components (such as electrolytes, CHOs, and fruit powders) would greatly aid in designing appropriate compositions of recovery drinks.

2. Materials and Methods

2.1. Materials

The test materials were the components of recovery drinks consisting of CHOs such as glucose, sucrose, and maltodextrin as well as sodium chloride, potassium chloride, citric acid, and blackcurrant powders obtained by freeze-drying and spray-powdering methods. Blackcurrant used for drying methods were of the same origin.
The recipe composition of beverages was developed by the method of successive approximations by making a series of tests based on the base composition containing water, glucose in the amount of 1 to 5%, NaCl 0.1%, and KCl 0.025%, which are the reference amounts given in the literature [7]. The powders were added in an amount ranging from 3% to 7% by making osmolality measurements. Based on the obtained osmolality results, the maximum levels of the addition of powders were established to obtain an osmolality of beverages not higher than 600 mOsm/kgH2O (Table 1).

2.2. Methods

The following measurements were then performed on each designed drink: osmolality, total extract content, pH, acidity, polyphenols and vitamin C content, antioxidant activity, and sensory quality.

2.2.1. Powder Preparation

The freeze-dried powders were obtained using Alpha Model 1-4 LSC liofilizator (Martin Christ GmbH, Osterode am Harz, Germany) (initially frozen at −30 °C and time 48 h, process pressure 10 Pa, temperature in the drying chamber −50 °C and shelf temperature 21 °C, and time 48 h).
After the convective or freeze-drying processes, the dried material was ground to a powder using a grinder with grinding knives (MKM 6003, Bosch, Stuttgart, Germany).
The spray-dried powders were obtained from blackcurrant juice with the addition of 60% maltodextrin carrier (dextrose equivalent of DE 12) at air temperatures of 160 °C for inlets and 90 °C for outlets, the0.7mm diameter dispersing nozzle was used (Buchi Mini Spray Dryer B-290, Flawil, Switzerland).

2.2.2. Osmolality

Osmolalities were determined by freezing point depression using an OS-3000 Osmometer (Trident med, Warsaw, Poland). The readings were expressed as mOsm/kg water. The osmolality was measured for the following solutions: 0.1 to 2.0% sodium chloride, 0.1 to 4.0% potassium chloride, 1 to 10% glucose, 1 to 15% sucrose, 1 to 30% high-sugar maltodextrin, 0.1 to 9% citric acid, 2.5 to 10% blackcurrant powders, and designed recovery drinks.

2.2.3. The Soluble Solids Content

The soluble solids content at Brix was measured with a telescope refractometer (EclipseProfessional, Bellingham + Stanley Ltd., Saitama, Kent, Great Britain).

2.2.4. The pH

The pH was measured using a Laboratory pH-meter (Elmetron CP-511, Elmetron, Zabrze, Polska).
The acidity of the designed recovery drinks was determined with the potentiometric method in accordance with PN-EN 12147:2000 [23]. The total acidity of the drinks was converted to citric acid.

2.2.5. The Antioxidant Activity

The antioxidant activity of the designed recovery drinks was determined by using the ABTS+•(2,2′-azino-bis-3-ethylben-zothiazoline-6-sulphonic acid) radical cation assay according to the modified method of Re et al. (1999) [24]. A certain quantity of the tested solutions, which was determined earlier by a designated dilution scheme, was drawn into a 10 mL glass test tube and 3.0 mL of radical cations ABTS+• in PBS solution was added. The absorbance was measured after exactly 6 min of incubation at room temperature at 734 nm with the use of a spectrophotometer (UV/Vis UV-6100A, Metash Instruments Co., Ltd., Shanghai, China). The results were represented as TEAC (Trolox Equivalent Antioxidant Capacity) mmol Trolox in 100 g of each drink.

2.2.6. The Total Content of Polyphenols

The total content of polyphenols in the designed recovery drinks was determined by using the Folin–Ciocalteu (F–C) reagent, according to the modified Singleton and Rossi (1965) method [25]. A certain quantity of the tested extract solution, which was determined earlier by a designated dilution scheme, was drawn into a 50 mL flask, then 2.5 mL of the F–C reagent and 5.0 mL of 20% sodium carbonate were added and finally made up to volume with distilled water. The samples were incubated for 30 min at room temperature with no light access. The absorbance was measured at 720 nm with the use of a spectrophotometer (UV/Vis UV-6100A, Metash Instruments Co., Ltd., Shanghai, China). The results were represented as mg GAE (Gallic Acid Equivalent) in 100 g of each drink.

2.2.7. Vitamin C

Vitamin C was measured as the sum of ascorbic acid and dehydroascorbic acid by HPLC with UV detection at a wavelength of 245 nm and a mobile phase flow rate of 0.8 mL/min. Total vitamin C content was determined following extraction for ascorbic acid and dehydroascorbic acid and then reduction using the dithiothreitol reagent. HPLC was performed with a UV2487 detector and separation by an RP Symmetry C18.5 μm. A 4.6 × 150 mm column at a temperature of 25 °C was carried out, where the injection volume varied between 10 and 30 μL. The results are expressed in mg of vitamin C/100 g of each drink.
All physicochemical determinations were performed in triplicate.

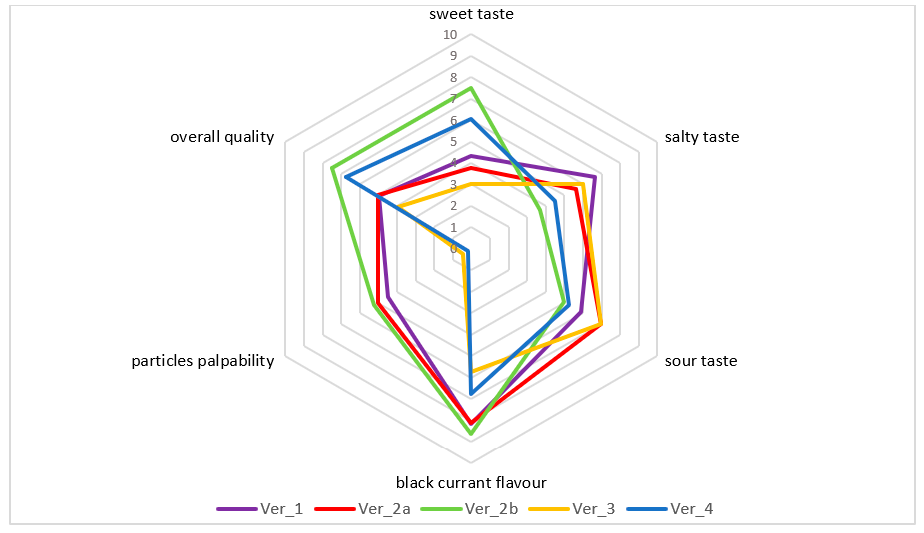
2.2.8. The Sensory Analysis

The sensory characteristic of the designed recovery drinks was determined using a scaling method in accordance with ISO PN-EN ISO 13299:2016-05 (2016) [26] by an eight-person sensory panel of qualified assessors who were experts according to PN-EN ISO 8586:2014-03 [27]. Members of the panel had good knowledge of all of the sensory methods (theoretical and practical). The evaluations were carried out in two sessions. Six quality parameters were selected to evaluate the drinks: blackcurrant flavor, sour taste, sweet taste, salty taste, particle palpability, and overall quality. The intensity of the above-mentioned parameters was assessed on an unstructured 10-point scale in contractual units (cu.). Ratings were performed at the Laboratory of Sensory Analysis which meets all the criteria specified in the PN-EN ISO 8589:2010/A1:2014-07 [28] standard.

2.2.9. The Statistical Analysis of the Data Obtained

Statistica 13.0 (Tibco Software Inc., Palo Alto, CA, USA) software was used for all statistical processing. A one-way analysis of variance (ANOVA) with the post hoc analysis of the Duncan test at the significance level p < 0.05 was used.

3. Results and Discussion

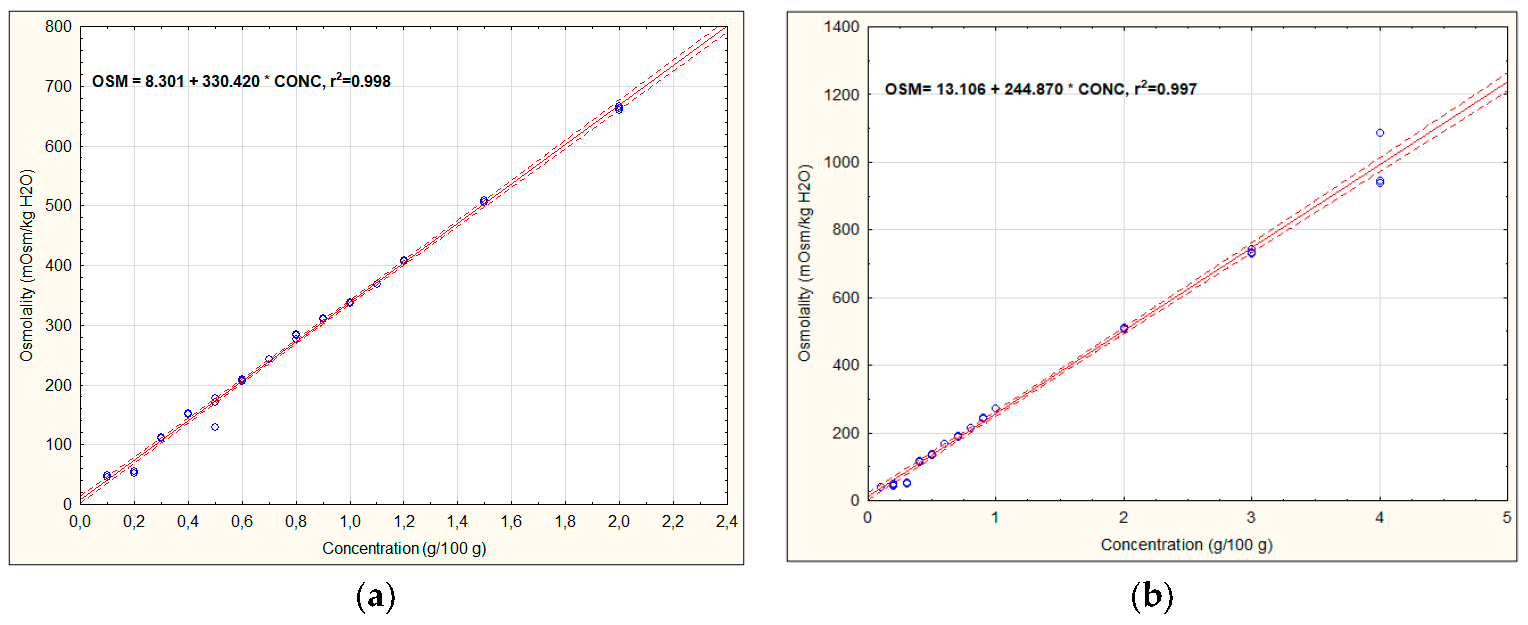
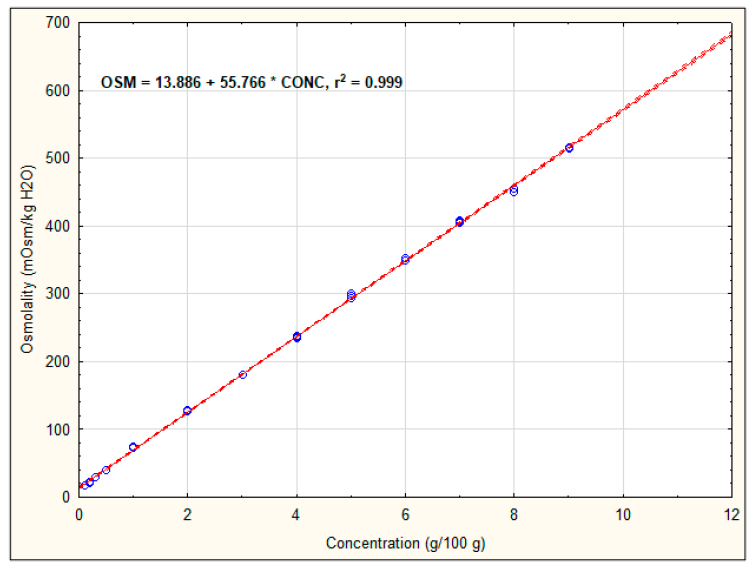
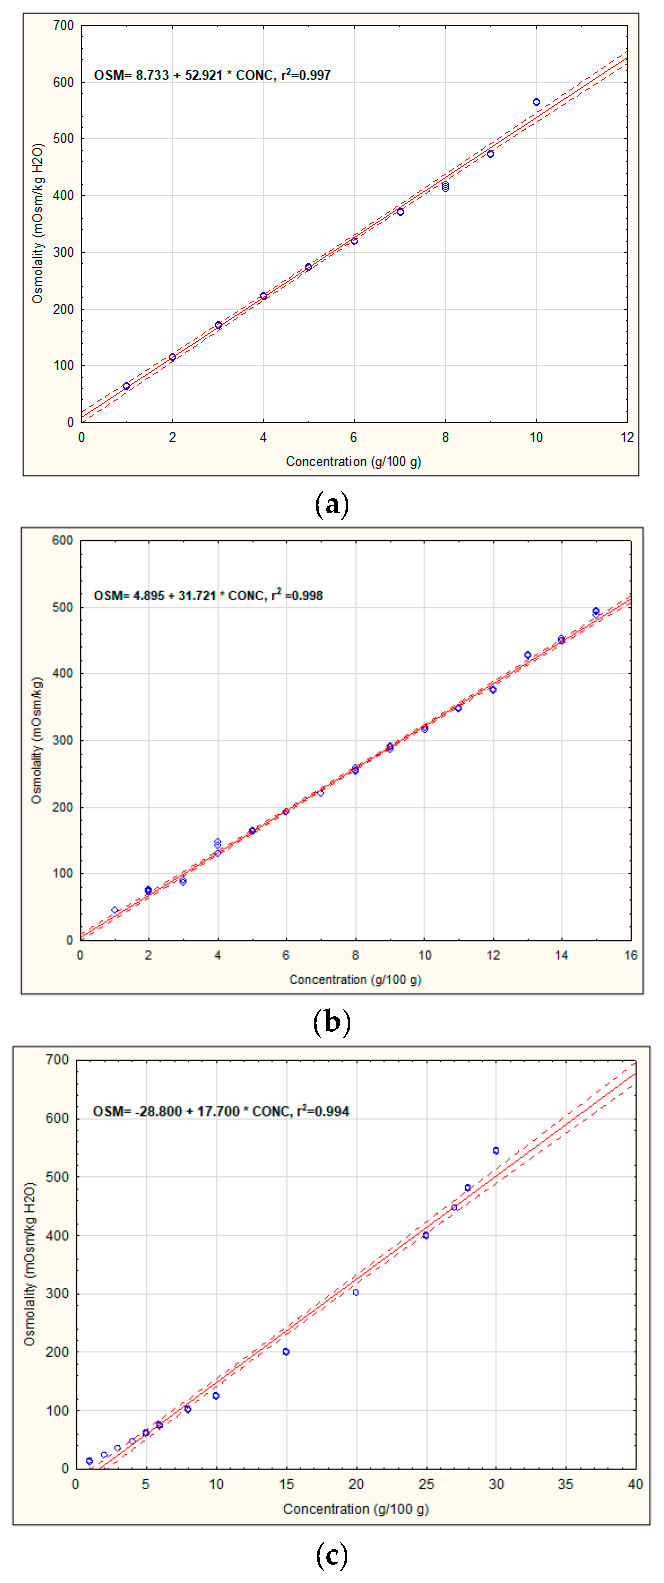
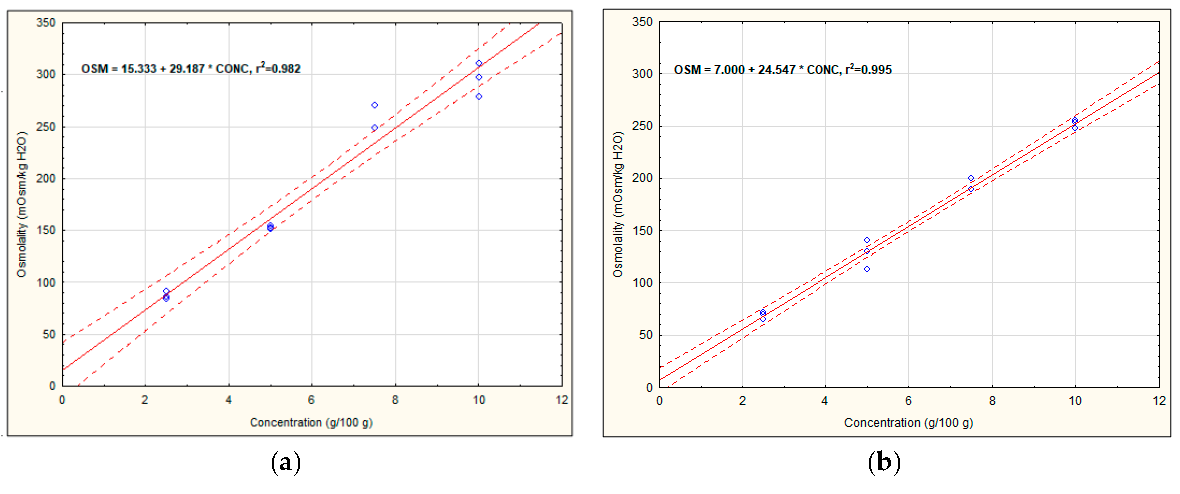
3.1. Osmolality of Recovery Drinks’ Components

The osmolalities of sodium chloride and potassium chloride solutions were measured at respective concentration ranges of 0.1 to 2.0% and 0.1 to 4.0%. Figure 1a,b show the effect of increasing concentration on the osmolalities of these salts, where linear increases in osmolalities were observed with the potassium chloride showing an insignificantly lower rate; the coefficients of variation (r2) were closely similar at respectively, 0.998 and 0.997, for NaCl and KCl. A similar linear relationship was obtained in the previous studies on the influence of the concentration of minerals in beverages on their osmolality [1]. The data presented in Figure 1 show that the tested salts are characterized by high osmolality. To obtain the osmolality of an aqueous solution corresponding to isotonic drinks, the concentration of NaCl should be about 0.8% and KCl 1.2%. The recommended maximum content in sports drinks of these electrolytes is much lower, amounting to sodium 1100 mg/L and potassium 225 mg/L. (Brouns). These values increase the osmolality of water drinks by approximately 60 mOsm/kg H2O. These fairly low salt additions in beverages compared to the so-called salty foods, where the NaCl content is usually above 1% (e.g., broths and soups), make both the taste and ensuring proper hydration of the body of a physically active person [7].
Osmolalities of citric acid solutions were measured at 0.1 to 9% concentrations shown in Figure 2, which increased in a linear fashion similar to the previous analytes. The amounts of citric acid used in sport drinks as an acidity regulator are usually in the range of 0.2 to 0.6% which has some slight effect on their osmolality.
In the group of sugars, the osmolality was determined for glucose, sucrose, and high-sugar maltodextrin in water solutions (Figure 3a–c). As in the case of electrolytes, a linear relationship was obtained between osmolality and CHO concentration in the tested range, from 1 to 10% for glucose, 1 to 15% for sucrose and 1 to 30% for maltodextrin. A similar linear relationship between the osmolality and the extract of the tested market beverages was obtained in Sadowska et al. (2017) [1] study. The tested CHOs were characterized by a high differentiated osmolality. The highest values of osmolality for the same concentrations were observed for glucose, followed by sucrose to the lowest for maltodextrin. The present study is consistent with the study of Santos et al. (2010) [29] which showed the highest osmolalities for glucose and sucrose compared with fructose in coconut water. CHO, thanks to a relatively low osmolality (as compared to electrolytes), can be used in large amounts, enabling the achievement of satisfactory sensory quality in beverages with an addition of electrolytes with a salty-bitter taste. To achieve osmolality of an isotonic drink, 5% glucose, 8.5% sucrose, and as much as 18% maltodextrin are needed. Brouns and Kovacs (1997) [7] states that the optimal CHO concentration to allow for both rapid fluid uptake and appropriate energy delivery is supposed to be in the range of 60 to 80 g/L (5 to 8%).
Figure 4a,b shows the osmolality for blackcurrant powders. Osmolalities were tested for blackcurrant powders obtained by using two drying methods at concentrations from 2.5 to 10%. The freeze-dried powders had greater osmolality than those obtained through the spray-drying method, which arose due to the presence of the maltodextrin carrier in the latter (60%) resulting in the decreased osmolalities. The tested powders are characterized by a much lower osmolality compared to CHO (Figure 2). Their osmolality is determined by the content of soluble solids, especially glucose and sucrose. To obtain the osmolality characteristic of an isotonic drink, it is necessary to add a freeze-dried powder in an amount of about 9% and a powder obtained by spray-drying approximately 11%. Such a high level of addition of powders with high acidity was not appropriate for sensory reasons [30].

3.2. Determining the Composition and Physico-Chemical Properties of Recovery Drinks

The composition of five fruit juice drinks intended for body regeneration after intensive physical exercise was established, based on the recognized relationships between osmolality and concentrations of electrolytes (Na+ and K+), citric acid, and blackcurrant powders obtained by the two methods (i.e., freeze-drying and spray-drying), as well as accounting for the literature data (Table 1). It was assumed that CHO-electrolytes designed compositions should ensure the body’s adequate hydration after intensive physical exercise, whilst delivering sufficient calories required for regenerating the body derived from CHOs contained within the powdered formulations, along with the added glucose and sucrose. Furthermore, the blackcurrant powders contain high levels of antioxidants such as polyphenols and vitamin C [30] that ameliorate the effects of oxidative stress brought upon by excessive physical exertion. They are an important source of nutrients for the body’s needs and can also act as supplements. The fruit powder content for powders obtained by the spray-dried method ranged from 6 to 7%, whilst this was 3 to 4% for the freeze-dried ones; this respectively corresponded to an equivalent 16 to 18% and 19 to 25% content when taking fresh fruit or blackcurrant juice into consideration. The spray-dried method gave a 60% lower juice content because 60% maltodextrin carrier is used for the preparation [30]. These aforementioned contents used in the designer drinks were established by pilot testing, taking an assumed total sugar content to provide an acceptable level of taste and appropriate osmolality. Greater amounts of powders added than those shown in Table 1 degraded the drink taste, which had to be counteracted by adding more CHOs. The CHO content of the designed drinks that included fruit powders and glucose or sucrose respectively ranged from 7.2 to 8.1% (after conversion taking into account the content of the soluble solids content and the total content of acids). These CHO values are comparable to those found in commercially available recovery beverages (ranging from 9.1 to 18.0 g/100 g of drink) [11]. Functional beverages designed for athletes in order to enhance rehydration rates and delay fatigue should contain 40 to 80 g/L of CHOs (optimally 60 to 80 g/L) [7]. CHO amounts greater than 80 g/L in drinks may, however, slow gastric emptying and reduce intestinal water absorption during exercise when compared to beverages with lower CHO concentrations [7,22]. Electrolytes, NaCl and KCl, added to the designed beverages gave respective concentrations of 0.1 to 0.2% (400 to 800 mg Na+/L) and 0.025% (130 mgK+/L), which were consistent with levels found in such drinks in other studies [3,7,22]. Brouns and Kovacs (1997) [7] state that sodium content should be higher than 400 mg/L (optimally >600 mg/L) and the recommended maximum content values for Na+ and K+ are, respectively, 1100 and 225 mg/L.
Measured osmolalities, ranging from 401 to 564 mOsm/kg H2O, are presented in Table 2, along with those calculated from regression equations based on results obtained from individual drink components such as fruit powders, electrolytes, and CHOs. The obtained osmolality values were significantly different (p < 0.05) for each drink designed. Drink version 3, which had low levels of added glucose (1%) and 7% spray-drying blackcurrant powder, gave the lowest osmolalities. The drink versions 2a and 2b had the same level of added ingredients and differed in the type of sweetener added (version 2a glucose; version 2b sucrose). These drinks differed in osmolality, drinks with added sucrose had significantly lower osmolality values. Maltodextrin has lower osmolalities than glucose and sucrose and can be used in amounts up to 10% in recovery drinks designing [7]. The osmolalities in Table 2 demonstrate that the tested beverages are hypertonic, providing carbohydrates and rehydrating the body, and can so be particularly recommended after doing intensive exercise. Osmolalities in three designed drinks were low and ranged from 401 to 466 mOsm/kg H2O, whilst in the case of others the osmolalities were 557 to 564 mOsm/kg H2O. These values fell within the lower regions of the 500 to 800 mOsm/kg H2O range considered adequate to rehydrate the body [7]. Ina study by Urdampillet et al. (2015) [22], characteristics of sports drinks were taken before, during, and after the training. Before: isotonic or slightly hypotonic (4 to 6% sugar and 0.5 to 0.7 g Na/L), during: (6 to 9% sugars, 0.5 to 0.7 g Na/L, and 0.7 to 1.2 g Na/L if longer than one hour or under heat stress), after: (9 to 10% sugars, 1 to 1.5 g Na/L). The osmolarity of sports drinks taken during exercise had a minimum of 200 to a maximum of 330 mOsm/L. According to this classification, the designed drinks should be classified as hypertonic sports drinks taken after the training. Calculated osmolalities of the test drinks obtained from the regression equations based on drinks components (Table 2) were higher by 14 to 33% than those measured; a likely reason is due to the interactions between individual drink components [22].
Table 3 shows the physico-chemical properties of the designed drinks. The soluble solids containing solutes and non-volatile (e.g., mainly CHOs and acids) content ranged from 7.5 Bx to 8.5 °Bx. Such soluble solids contents, pH and CHOs, were consistent with levels found in the literature for commercially available recovery beverages [1,11].
Table 4 presents the content of vitamin C, polyphenols, and antioxidant activity in the designed drinks based on blackcurrant powders. Vitamin C content was high, ranging from 25 to 36 mg/100 g, where consuming 250 to 300 g portions of these drinks would be sufficient to satisfy 100% of the body’s requirement for this vitamin [31]. These drinks contained nutritionally significant amounts of polyphenol and antioxidant activity. Sadowska et al. (2019) [30] found that blackcurrant powders have high contents of polyphenols, vitamin C, and antioxidant activity. The study values determined correspond to those measured in the powders after accounting for the addition of water in accordance with each drink recipe [30].
The sensory qualities of the designed drinks varied considerably (Figure 5, Table 5). The best tasting drinks (i.e., highest palatability) were ones containing the higher amounts of CHOs which may be related to their higher acidities and larger amounts of blackcurrant powder, particularly when prepared by lyophilization. Those drinks with added glucose or sucrose at the same 5% levels were however rated differently for taste. Sucrose-containing drinks were rated much more highly than those with glucose, which is consistent with sucrose having a more intensive sweetness to the human palate than glucose [32]. Particle palatability was not felt in beverages containing powders obtained by the spray-drying method. Overall quality of drinks was top for drink version 2b containing sucrose and freeze-dried powder and drink version 4 with spray-drying powder (including 60% maltodextrin) and 3% glucose. Earlier studies of the authors [30] showed that the sensory quality of fruit drinks obtained with the use of powdered fruit (without the addition of NaCl) is mainly influenced by the addition of sugar (preferably in the amount of 5%).

4. Conclusions

The study demonstrates the feasibility of preparing fruit recovery drinks containing electrolytes and carbohydrates, along with defined osmolalities, for these types of beverages. These designed drinks contained appropriate amounts of carbohydrates and electrolytes (Na+ and K+), as well as the desired osmolalities and carbohydrates content that accorded with both recommendations and the amounts found in commercially available recovery drinks. They also contain nutritionally valuable bioactive components such as vitamin C and polyphenols as derived from the blackcurrant powders (obtained by either freeze- or spray-drying). Furthermore, their sensory qualities are satisfactory even though the levels of electrolytes match those found in recovery drinks. A linear relationship was found between beverage component content with osmolality. These outcomes may be useful in designing those functional sports drinks both ones without fruit components and ones that are innovative fruit recovery drinks.

Author Contributions

Conceptualization, A.S.; methodology, A.S.; formal analysis, A.S. and W.L.; investigation, A.S.; writing—original draft preparation, A.S. and F.Ś.; writing—review and editing, A.S. All authors have read and agreed to the published version of the manuscript.

Funding

This research received no external funding.

Conflicts of Interest

The authors declare no conflict of interest.

References

  1. Sadowska, A.; Świderski, F.; Rakowska, R.; Waszkiewicz-Robak, B.; Żebrowska-Krasuska, M.; Dybkowska, E. Beverage osmolality as a marker for maintaining appropriate body hydration. Rocz. Panstw. Zakl. Hig. 2017, 68, 167–173. [Google Scholar] [PubMed]
  2. Faria, D.K.; Mendes, M.E.; Sumita, N.M. The measurement of serum osmolality and its application to clinical practice and laboratory: Literature review. J. Bras. Patol. Med. Lab. 2017, 53, 38–45. [Google Scholar] [CrossRef]
  3. Pound, C.M.; Blair, B. Energy and sports drinks in children and adolescents. Paed. Child Health-Can. 2017, 22, 406–410. [Google Scholar] [CrossRef] [PubMed] [Green Version]
  4. American Academy of Pediatrics; Committee on Nutrition and the Council on Sports Medicine and Fitness. Sports drinks and energy drinks for children and adolescents: Are they appropriate? Pediatrics 2011, 127, 1182–1189. [Google Scholar] [CrossRef] [Green Version]
  5. Campbell, B.; Wilborn, C.; La Bounty, P.; Taylor, L.; Nelson, M.T.; Greenwood, M.; Ziegenfuss, T.N.; Lopez, H.L.; Hoffman, J.R.; Stout, J.R.; et al. International Society of Sports Nutrition position stand: Energy drinks. J. Int. Soc. Sports Nutr. 2013, 10, 1. [Google Scholar] [CrossRef] [PubMed] [Green Version]
  6. Rotstein, J.; Barber, J.; Strowbridge, C.; Hayward, S.; Huang, R.; Godefroy, S.B. Energy drinks: An assessment of the potential health risks in the Canadian context. Int. Food Risk Anal. J. 2013, 3, 1–29. [Google Scholar] [CrossRef] [Green Version]
  7. Brouns, F.; Kovacs, E. Functional drinks for athletes rewiev. Trends Food Sci. Technol. 1997, 8, 414–421. [Google Scholar] [CrossRef]
  8. Febbraio, M.A.; Snow, R.J.; Stathis, C.G.; Hargreaves, M.; Carey, M.F. Effect of heat stress on muscle energy metabolism during exercise. J. Appl. Physiol. 1994, 77, 2827–2831. [Google Scholar] [CrossRef]
  9. Nielsen, B. Temperature Regulation; Effects of sweat loss during prolonged exercise. Acta Physiol. Stand. 1986, 128, 105–109. [Google Scholar]
  10. Sawka, M.N. Physiological consequences of hypohydration: Exercise performance and thermoregulation. Med. Sci. Sports Exerc. 1992, 24, 657–670. [Google Scholar] [CrossRef]
  11. Mettler, S.; Rusch, C.; Colombani, P.C. Osmolality and pH of sport and other drinks available in Switzerland. Schweiz. Z. Sportmed. Sporttraumatol. 2006, 54, 92–95. [Google Scholar]
  12. Evans, G.H.; Shirreffs, S.M.; Maughan, R.J. Postexercise rehydration in man: The effects of osmolality and carbohydrate content of ingested drinks. Nutrition 2009, 25, 905–913. [Google Scholar] [CrossRef] [PubMed]
  13. Leiper, J.B. Intestinal water absorption—implications for the formula-tion of rehydration solutions. Int. J. Sport Med. 1998, 19, 129–132. [Google Scholar] [CrossRef] [PubMed]
  14. Farthing, M.J. Oral rehydration: An evolving solution. J. Pediatr. Gastro-Enterol. Nutr. 2002, 34, 64–67. [Google Scholar] [CrossRef]
  15. Hiller, W.D.B. Dehydration and hyponatremia during triathlons. Med. Sci. Sports Exerc. 1989, 21, 222–237. [Google Scholar]
  16. Noakes, T.D.; Norman, R.J.; Buck, R.H.; Godlonton, J.; Stevenson, K.; Pittaway, D. The incidence of hyponatremia during prolonged ultraendurance Exercise. Med. Sci. Sports Exerc. 1990, 22, 165–170. [Google Scholar]
  17. Noakes, T.D. Hyponatremia during endurance running: A Physiological and Clinical Interpretation. Med. Sci. Sports Exerc. 1993, 24, 403–405. [Google Scholar] [CrossRef]
  18. Gisoffi, C.V.; Summers, R.W.; Schedl, H.P.; Bleiler, T.L. Intestinal water absorption from select carbohydrate solutions in humans. J. Appl. Physiol. 1992, 73, 2142–2150. [Google Scholar] [CrossRef]
  19. Hawley, J.A.; Dennis, S.C.; Noakes, T.D. Oxidation of carbohydrate ingested during prolonged endurance exercise. Sports Med. 1992, 14, 27–42. [Google Scholar] [CrossRef]
  20. Rehrer, N.; Wagenmakers, A.J.; Beckers, E.J.; Halliday, D.; Leiper, J.B.; Brouns, F.; Maughan, R.J.; Westerterp, K.; Saris, W.H. Gastric emptying, absorption, and carbohydrate oxidation during prolonged exercise. Appl. Physiol. 1992, 72, 468–475. [Google Scholar] [CrossRef]
  21. Wagenmakers, A.J.M.; Brouns, F.; Saris, W.H.; Halliday, D. Oxidation rates of orally ingested carbohydrates during prolonged exercise in men. Appl. Physiol. 1993, 75, 2774–2780. [Google Scholar] [CrossRef] [PubMed]
  22. Urdampilleta, A.; Gómez-Zorita, S.; Soriano, J.M.; Martínez-Sanz, J.M.; Medina, S.; Gil-Izquierdo, A. Hydration and chemical ingredients in sport drinks: Food safety in the European context. Nutr Hosp. 2015, 31, 1889–1899. [Google Scholar] [PubMed] [Green Version]
  23. PN-EN 12147:2000. Fruit and Vegetable Juices-Determination of Titrable Acidity; Polish Committee for Standardization: Warszawa, Poland, 2000. [Google Scholar]
  24. Re, R.; Pellegrini, N.; Proteggente, A.; Pannala, A.; Yang, M.; Rice-Evans, C. Antioxidant activity applying an improved ABTS radicalcation decolorization assay. Free Radic. Biol. Med. 1999, 26, 1231–1237. [Google Scholar] [CrossRef]
  25. Singleton, V.; Rossi, J. Colorimetry of total phenolics withphosphomolybdic-phosphotungstic acid reagents. Am. J. Enol. Viticult. 1965, 16, 144–158. [Google Scholar]
  26. ISO PN-EN ISO 13299:2016-05. Sensory Analysis-Methodology-General Guidelines for Determining the Sensory Profile; ISO: Geneva, Switzerland, 2016. [Google Scholar]
  27. PN-EN ISO 8586:2014-03. Sensory Analysis-General Guidelines for the Selection, Training and Monitoring of Selected Assessors and Sensory Evaluation Experts; ISO: Geneva, Switzerland, 2012. [Google Scholar]
  28. PN-EN ISO 8589:2010/A1:2014-07. Sensory Analysis-General Guidelines for Designing a Sensory Analysis Laboratory; ISO: Geneva, Switzerland, 2007. [Google Scholar]
  29. Santos, L.S.; Ferreira-Bonomo, R.C.; Lemos, A.R.; da Costa Ilheu Fontain, R.; Santos, W.O.; Veloso, C.M.; Souza, M.A. Influence of concentration and type of sugar additives on the osmolality and acceptance of coconut water. UNOPAR Cient Ciênc Biol. Saúde 2011, 13, 29–32. [Google Scholar]
  30. Sadowska, A.; Rakowska, R.; Świderski, F.; Kulik, K.; Hallmann, E. Properties and microstructure of blackcurrantpowders prepared using a new method offluidized-bed jet milling and drying versus otherdrying methods. CyTA J. Food. 2019, 17, 439–446. [Google Scholar] [CrossRef] [Green Version]
  31. Regulation No 1169/2011 of the European Parliament and of the Council (UE) of 25 October 2011 on the provision of food information to consumers. Off. J. Eur. Union 2011, 20, 168–213.
  32. Rao, L.J.M.; Ramalakshmi, K. (Eds.) Ingredients of soft drinks. In Recent Trends in Soft Beverages; Woodhead Publishing: India, New Delhi, 2011; pp. 189–209. [Google Scholar]
Figure 1. Sodium chloride (a) and potassium chloride (b) osmolalities in aqueous solution.
Applsci 10 07663 g001
Figure 2. Citric acid osmolalities in aqueous solution.
Applsci 10 07663 g002
Figure 3. Glucose (a), sucrose (b), and high-sugar maltodextrin (DE 23–32) (c) osmolalities in aqueous solution.
Applsci 10 07663 g003
Figure 4. Blackcurrant freeze-dried (a) and spray-dried (b) powder osmolalities in aqueous solution.
Applsci 10 07663 g004
Figure 5. The sensory qualities of the designed recovery beverages.
Applsci 10 07663 g005
Table 1. Recipe compositions of designed drinks.
Ingredient (g/100 mL)Version 1Version 2aVersion 2bVersion 3Version 4
Lyophilized powder of blackcurrant344--
Spray-dried powder of blackcurrant---76
Glucose55-13
Sucrose--5 --
NaCl0.20.10.10.10.1
KCl0.0250.0250.0250.0250.025
Water91.77590.87590.87591.87590.875
Table 2. Osmolalities of designed beverages.
BeverageOsmolalities Calculated by Regression EquationsMeasured Osmolality
Version 1OSM = (15.33 + 29.19 × 3) + (8.73 + 52.92 × 5) + (8.30 + 330.42 × 0.2) + (13.11 + 244.87 × 0.025) = 469.85557.67 ± 0.58 d
Version 2aOSM = (15.33 + 29.19 × 4) + (8.73 + 52.92 × 5) + (8.30 + 330.42 × 0.1) + (13.11 + 244.87 × 0.025) = 465.99564.00 ± 1.00 e
Version 2bOSM = (15.33 + 29.19 × 4) + (4.90 + 31.72 × 5) + (8.30 + 30.42 × 0.1) + (13.11 + 244.87 × 0.025) = 326.16425.57 ± 0.58 b
Version 3OSM = (7.00 + 24.55 × 7) + (8.73+ 52.92 × 1) + (8.30 + 330.42 × 0.1) + (13.11 + 244.87 × 0.025) = 301.35401.33 ± 0.58 a
Version 4OSM = (7.00 + 24.55 × 6) + (8.73 + 52.92 × 3) + (8.30 + 330.42 × 0.1) + (13.11 + 244.87 × 0.025) = 382.35436.33 ± 0.58 c
The osmolality values (OSM) were calculated based on the sum of the osmolality values obtained from the regression equations (Figure 1, Figure 2, Figure 3 and Figure 4) for the individual components used in designed drinks. The results are expressed as the mean of three replications ± SD; a–e—values marked by different letters differ significantly (p < 0.05).
Table 3. The soluble solids content, pH, and acidity in the designed beverages.
The Tested Physico-Chemical ParametersVersion 1Version 2a,bVersion 3Version 4
Soluble solids content (Bx)7.50 ± 0.00 a7.50 ± 0.25 a8.00 ± 0.46 a8.50 ± 0.20 b
Acidity0.34 ± 0.04 b0.53 ± 0.01 a0.55 ± 0.07 a0.36 ± 0.04 b
pH3.01 ± 0.02 b3.01 ± 0.01 b2.95 ± 0.03 a2.99 ± 0.02 ab
The results are expressed as the mean of three replications ± SD; a–d—values marked by different letters differ significantly (p < 0.05).
Table 4. Bioactive compound content and antioxidant properties in the designed beverages.
Bioactive Compound and Antioxidant PropertiesVersion 1Version 2a,bVersion 3Version 4
Vitamin C (mg/100 g)25.83 ± 0.3 a34.45 ± 0.7 b35.62 ± 1.0 b26.71 ± 0.4 a
Total polyphenols (mg GAE/100 g)43.11 ± 0.2 a57.47 ± 0.1 c62.50 ± 0.1 d46.86 ± 0.8 b
Antioxidant properties (mmol TEAC/100 g)1.27 ± 0.03 a1.69 ± 0.05 c2.13 ± 0.07 d 1.60 ± 0.01 b
The results are expressed as the mean of three replications ± SD; a–d—values marked by different letters differ significantly (p < 0.05).
Table 5. Statistical analysis of the results obtained during the sensory evaluation of the designed recovery drinks; a–c—values marked by different letters differ significantly (p < 0.05), *** determinant of belonging of a given drink to a specific homogeneous group.
Sweet TasteSalty TasteSour TasteBlackcurrant FlavorParticles PalpabilityOverall Quality
VerabcVerabcVerabcVerabVerabVerab
3*** 2b*** 2b*** 3*** 4*** 2a***
2a****** 4****** 4****** 4*** 3*** 1***
1****** 2a ******1 ******1 ***1 ***3******
4 *** 3 ******2a ******2b ***2b ***4******
2b ***1 ***3 ***2a ***2a ***2b ***
Publisher’s Note: MDPI stays neutral with regard to jurisdictional claims in published maps and institutional affiliations.

