Article

Experimental Investigation of Deposition Pattern on the Temperature and Distortion of Direct Energy Deposition-Based Additive Manufactured Part

1
Department of Naval Architecture and Ocean Engineering, Chonnam National University, Yeosu 59626, Korea
2
Department of Naval Architecture & Ocean Engineering, Chungnam National University, Daejeon 34134, Korea
*
Author to whom correspondence should be addressed.
Appl. Sci. 2020, 10(21), 7653; https://doi.org/10.3390/app10217653
Submission received: 8 September 2020 / Revised: 27 October 2020 / Accepted: 27 October 2020 / Published: 29 October 2020
(This article belongs to the Special Issue Additive Manufacturing and System: From Methods to Applications)

Abstract

:
The effect of deposition pattern on the temperature and global distortion of Direct Metal Tooling (DMT) based Additive Manufactured (AM) is investigated through the experimental results of laser deposited SUS316. DMT is one of the Directed Energy Deposition (DED) processes. In situ temperature measurements were used to monitor the temperature of the substrates and global distortion patterns were analyzed using CMM (coordinate Measuring Machine) after the deposition. Six different patterns combining long raster and short raster patterns were considered for the case studies. The results showed that the deposition pattern affects the temperature gradient and that the peak temperature of each layer can increase or decrease according to the sequence of the deposition pattern. Also, the pattern of the first layer had a dominant influence on the longitudinal bending deflection that occurs. Based on these results, appropriate tool path schedule can be utilized to control not only the distortion but also the peak temperature of the DMT-based AM parts.

1. Introduction

Direct Metal Tooling (DMT)based Additive Manufacturing (AM) is one of the Directed Energy Deposition (DED) processes where metal powder is fused by focused laser thermal energy to deposit material onto a substrate or pre-existing part [1,2]. The DMT-based AM technology is generally able to build parts at a faster rate than the Powder Bed Fusion (PBF) process with low, controllable heat input compared to arc-based AM process [3]. These advantages make DMT-based AM an effective process for repairing and surface coating of high value parts such aerospace components [4].
However, due to the inherent characteristics of metal AM, residual stresses and distortion always occur in AM parts and it has similarities with the welding process [5]. When the part is fabricated, the deposited material undergoes rapid heating and cooling cycles repeatedly as layers are added. This thermal cycle generates uneven temperature distribution in the AM parts and causes distortion and residual stress and negatively affects the dimensional accuracy of the AM parts, as well as the fatigue strength [6]. Several researchers have studied techniques in order to reduce distortion of the AM parts. Typical methods to reduce the distortion of the AM parts are to add mechanical treatments [7,8,9] or to add thermal treatments [10]. However, since these methods increase production costs, it is important to optimize the process variables beforehand. In particular, AM process parameters such as travel speed, deposition pattern, powder mass flow rate, beam diameter, laser power, etc., strongly affect the distortion and residual stress but also the mechanical characteristics of the AM parts [11]. The most flexible process parameter among these variables is the deposition pattern. Travel speed, powder mass flow rate, beam diameter and laser power directly affect the unit heat input and the deposit shape [12]. Considering that the principle of AM is slicing the Computer-Aided Design (CAD) part into designated height and width to schedule the tool path, those parameters should be predetermined in order to plan the tool path. However, it is possible to consider various deposition patterns such as short raster pattern, long raster pattern, spiral pattern, etc. for each layer since the deposition pattern does not affect the deposit shape. Therefore, it is necessary to analyze the temperature distribution and the distortion of the AM part according to the deposition pattern which is the most flexible method to reduce the distortion.
Several researchers have studied the influence of deposition pattern on the residual stress distribution and mechanical patterns of AM parts. From the literature survey, it can be seen that the anisotropy of the mechanical property is generated by the single direction deposition pattern [13,14,15]. For the Fused Deposition Modeling (FDM) based AM, several researchers have studied the influence of deposition pattern on the mechanical properties of the manufactured parts [16,17,18]. Therefore, it is understood that the deposition pattern should be designed uniformly in various directions rather than a single direction to prevent such anisotropy. However, experimental works that show these various deposition patterns affecting the distortion pattern and temperature distribution have not been well studied. Nazemi and Urbanic [19] conducted an experimental and numerical study on the distortion and residual stress distribution of surface cladding according to the different deposition strategies. However, this study provided only a single layer deposited AM structure. Nickel et al. [20] showed that the deposition pattern in the AM process has a significant effect on the part residual stresses and deflections. However, this study only showed the longitudinal deflection value according the deposition pattern. According to various welding distortion studies [21,22,23], there are several types of welding distortion and these distortions occur simultaneously. So to clearly understand how the deposition pattern affects the distortion, not only the longitudinal deflection value but also the global distortion tendency should be investigated.
Therefore, this study focuses on the influence of deposition pattern on the global distortion and the temperature distribution of the AM parts. In this study, DMT-based AM process with SUS304 powder was used on the SM45C substrate to build four layered deposited specimens. Six different patterns were designed that are combined with long raster and short raster patterns. In situ temperature measurements were used to monitor the temperature of the substrates and global distortion patterns were analyzed using CMM (Coordinate Measuring Machine) after the deposition. The resulting trends were analyzed, and the results will be helpful to understand and control the distortion and the maximum temperature of AM parts by optimizing the deposition pattern.

2. Methods

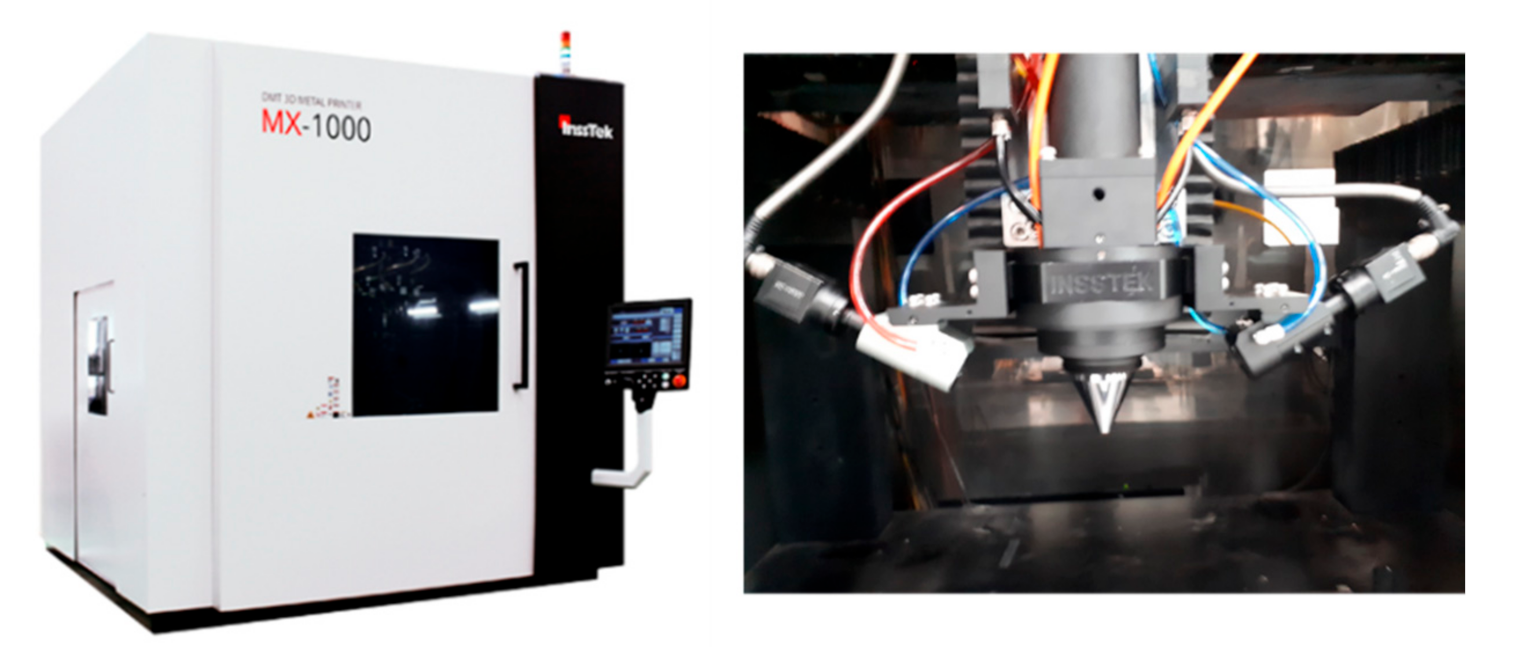
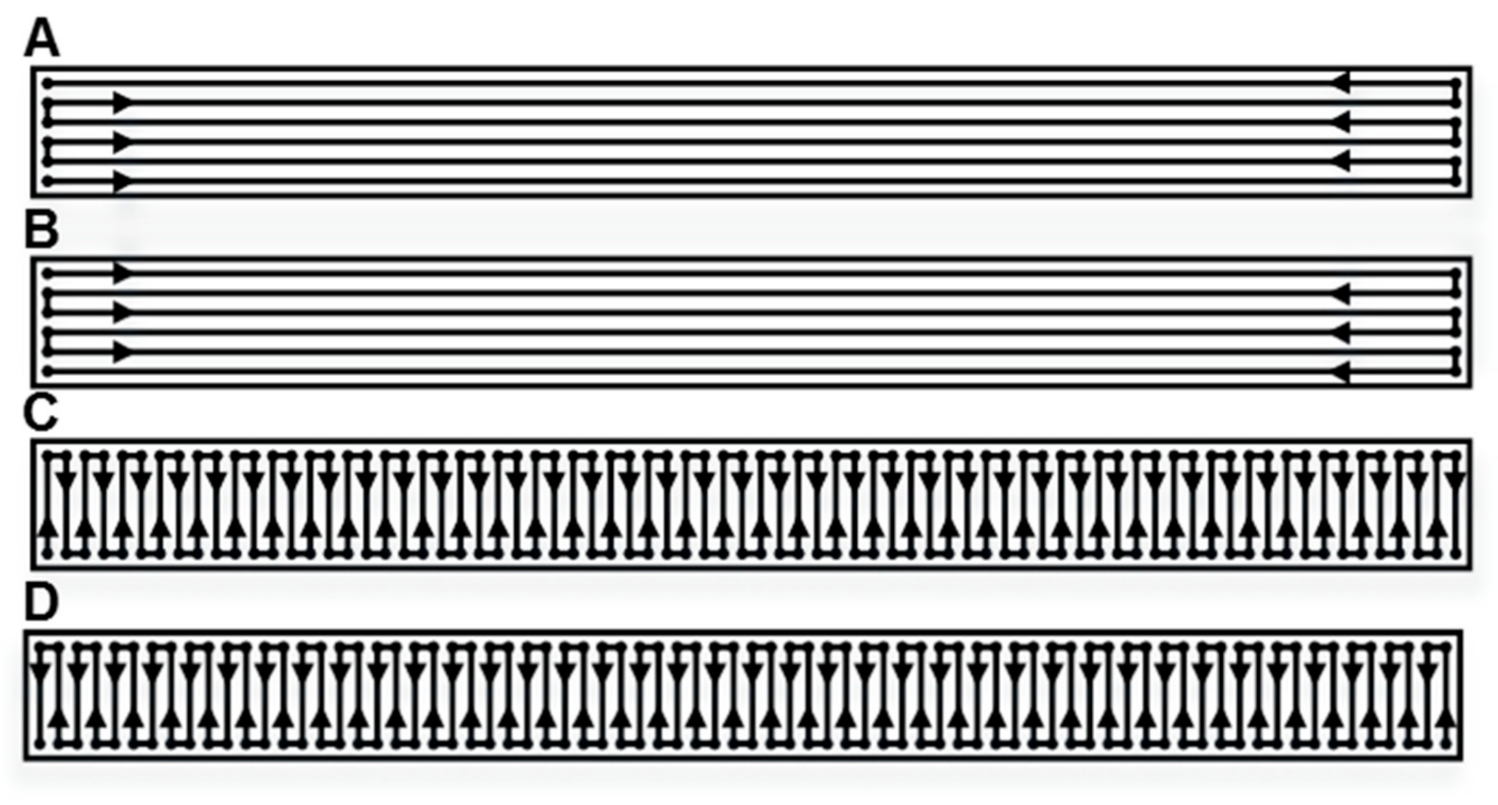
2.1. Process Parameters and Deposition Patterns

This study used an Insstek® MX-1000, a DMT metal 3D printer employing a 2 kW Ytterbium Fiber Laser (Figure 1). A molten pool is generated by the laser beam focused on the substrate, while the powder was deposited at the same time into the focal area of the laser through coaxial nozzles with flowing argon gas. The argon gas serves as a shield to protect the molten pool from oxidation. The nozzle head is positioned at a location 10 mm above the build and the beam diameter at the part surface is 1.2mm.
Powder materials and the substrate were chosen as SM45C steel and SUS304. If the substrate material and the deposited material are different, residual stress and distortion may occur due to different thermal expansion coefficients. However, since the substrate material is cut after manufacture and discarded, industry practice was taken into account that always considers inexpensive materials for the substrate. The test sample deposited on each substrate is 1.8 mm height, 4.0 mm wide, and 60.0 mm long, and the substrate is 3.0 mm thick, 50.0 mm wide, and 100.0 mm long. The substrates were fully clamped with a jig for the 20mm longitudinal direction (Figure 2).
The test samples are deposited with the target bead height of 0.45 mm and hatching space of 0.8 mm. The target bead height is experimentally determined with the process parameters described in Table 1.
Six patterns were designed using long raster patterns, short raster patterns, and combinations of both. To reduce the time difference between the completion of one layer deposition and the start of the next layer’s deposition for all cases, the long raster pattern consists of two tool paths A and B. The short raster pattern consists of two tool paths C and D (Figure 3). Pattern 1 applies only the long raster pattern to deposit four layers and pattern 2 only applies the short raster pattern. Pattern 3~6 are designed to apply the short raster pattern and long raster pattern twice in four-layer deposition, respectively. (Table 2). Although the tool paths were selected to minimize the time difference between the pattern, there is a slight difference in the total deposition time according to the pattern. In particular, Patterns 3 and 4 require switching from the previous layer’s ending point to the current layer’s starting point. This extra movement allows extra cooling time between these layers and increases the total deposition time by approximately 5~8%.

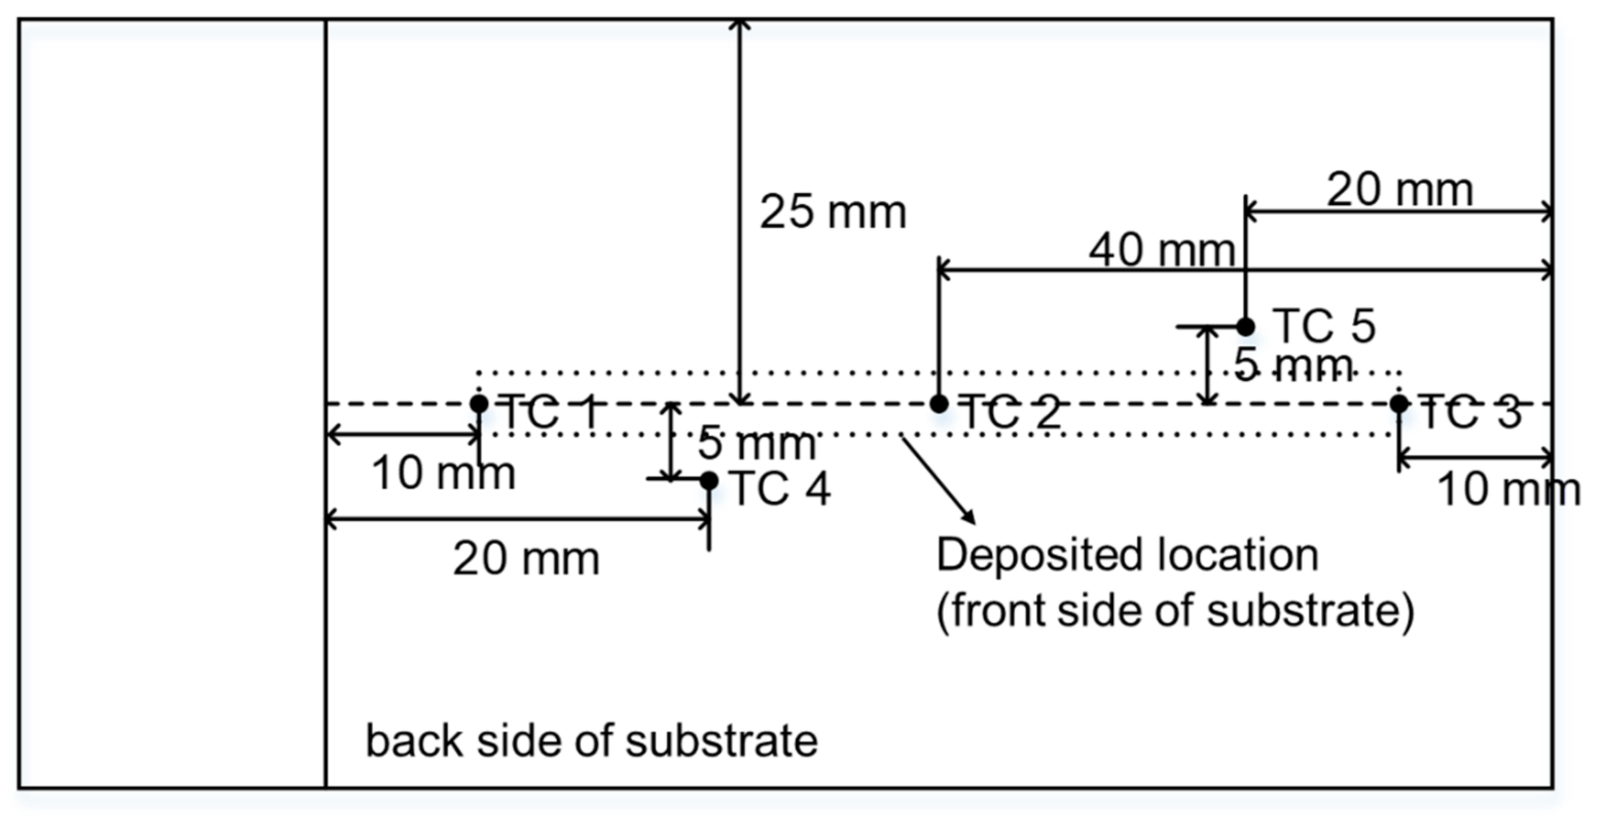
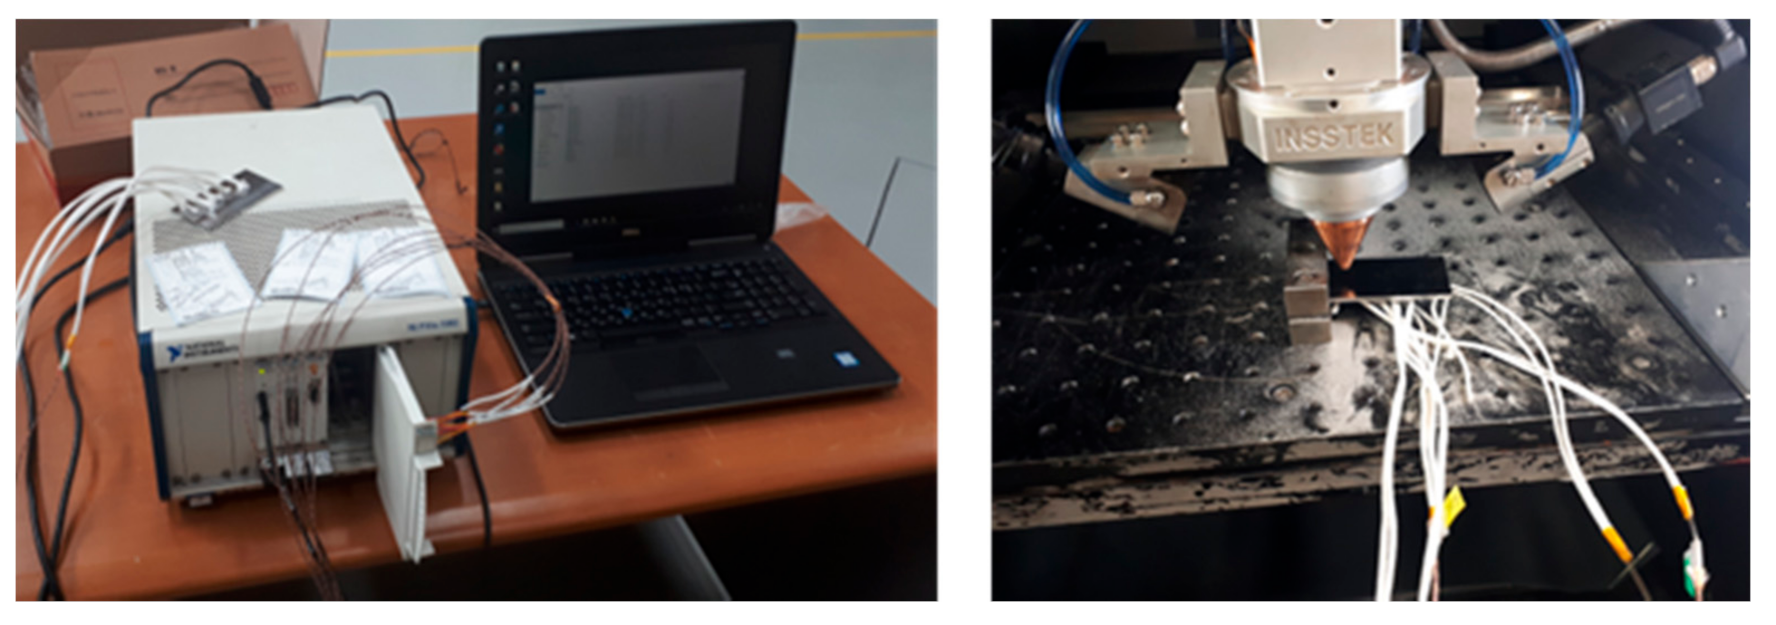
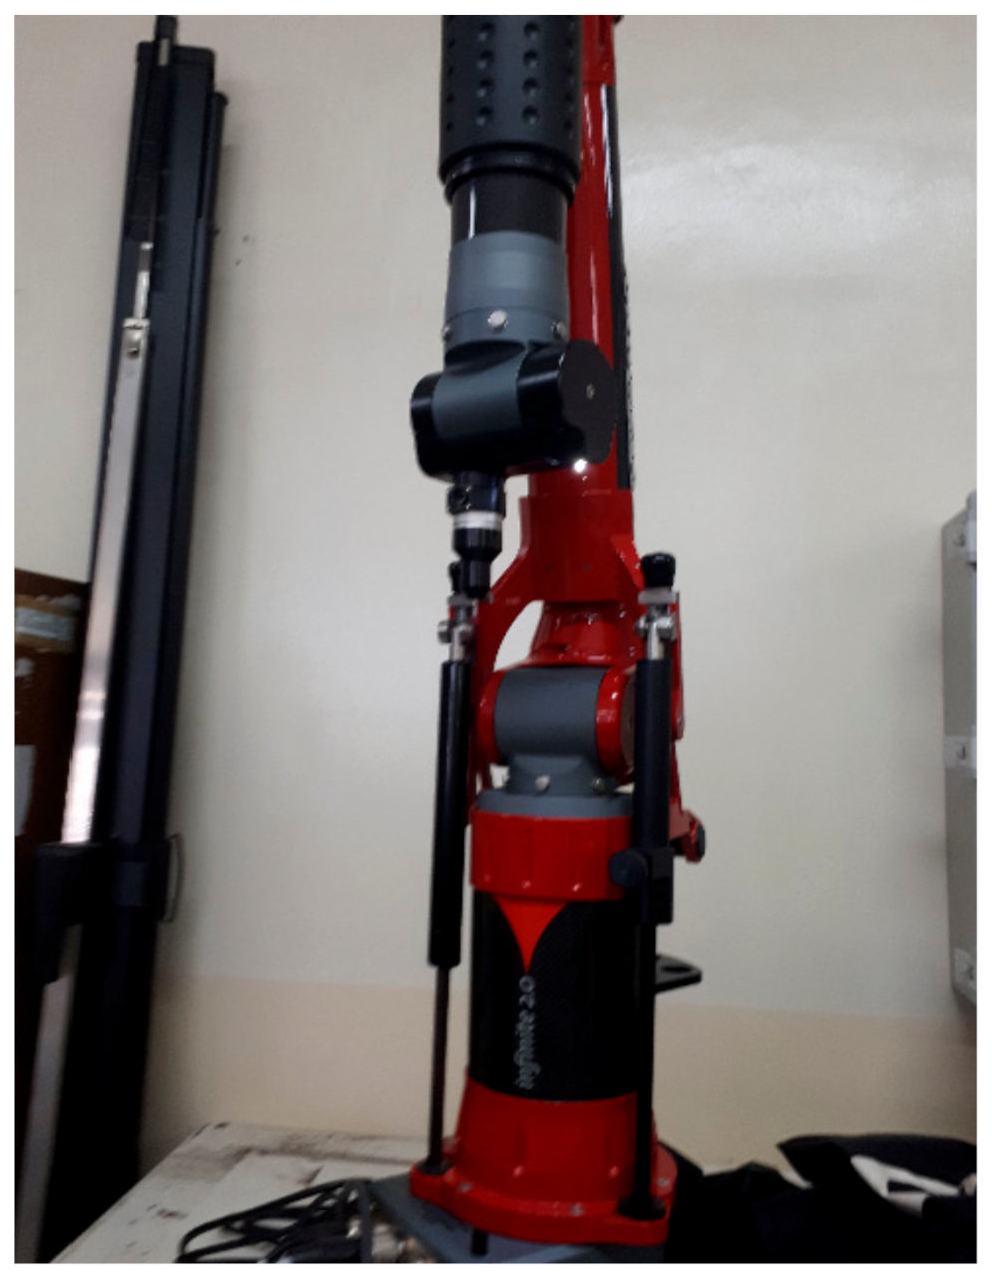
2.2. In Situ Temperature Measurement

For temperature measurement, five locations on the back side of the substrate were selected, as shown in Figure 4. A K-type thermocouple with 2.3 mm diameter which has ±0.75% accuracy was used for the experiments. The thermocouple signals are read by National Instruments 4353 modules and data were recorded in LabView at a sampling rate of 20 Hz. When performing each case, the cooling time was maintained for more than 1 hour. In each case, sufficient cooling time was given to prevent additional heating, so that the initial conditions of each experiment were kept the same as possible. Experimental setup for the in situ temperature measurement are shown in Figure 5.

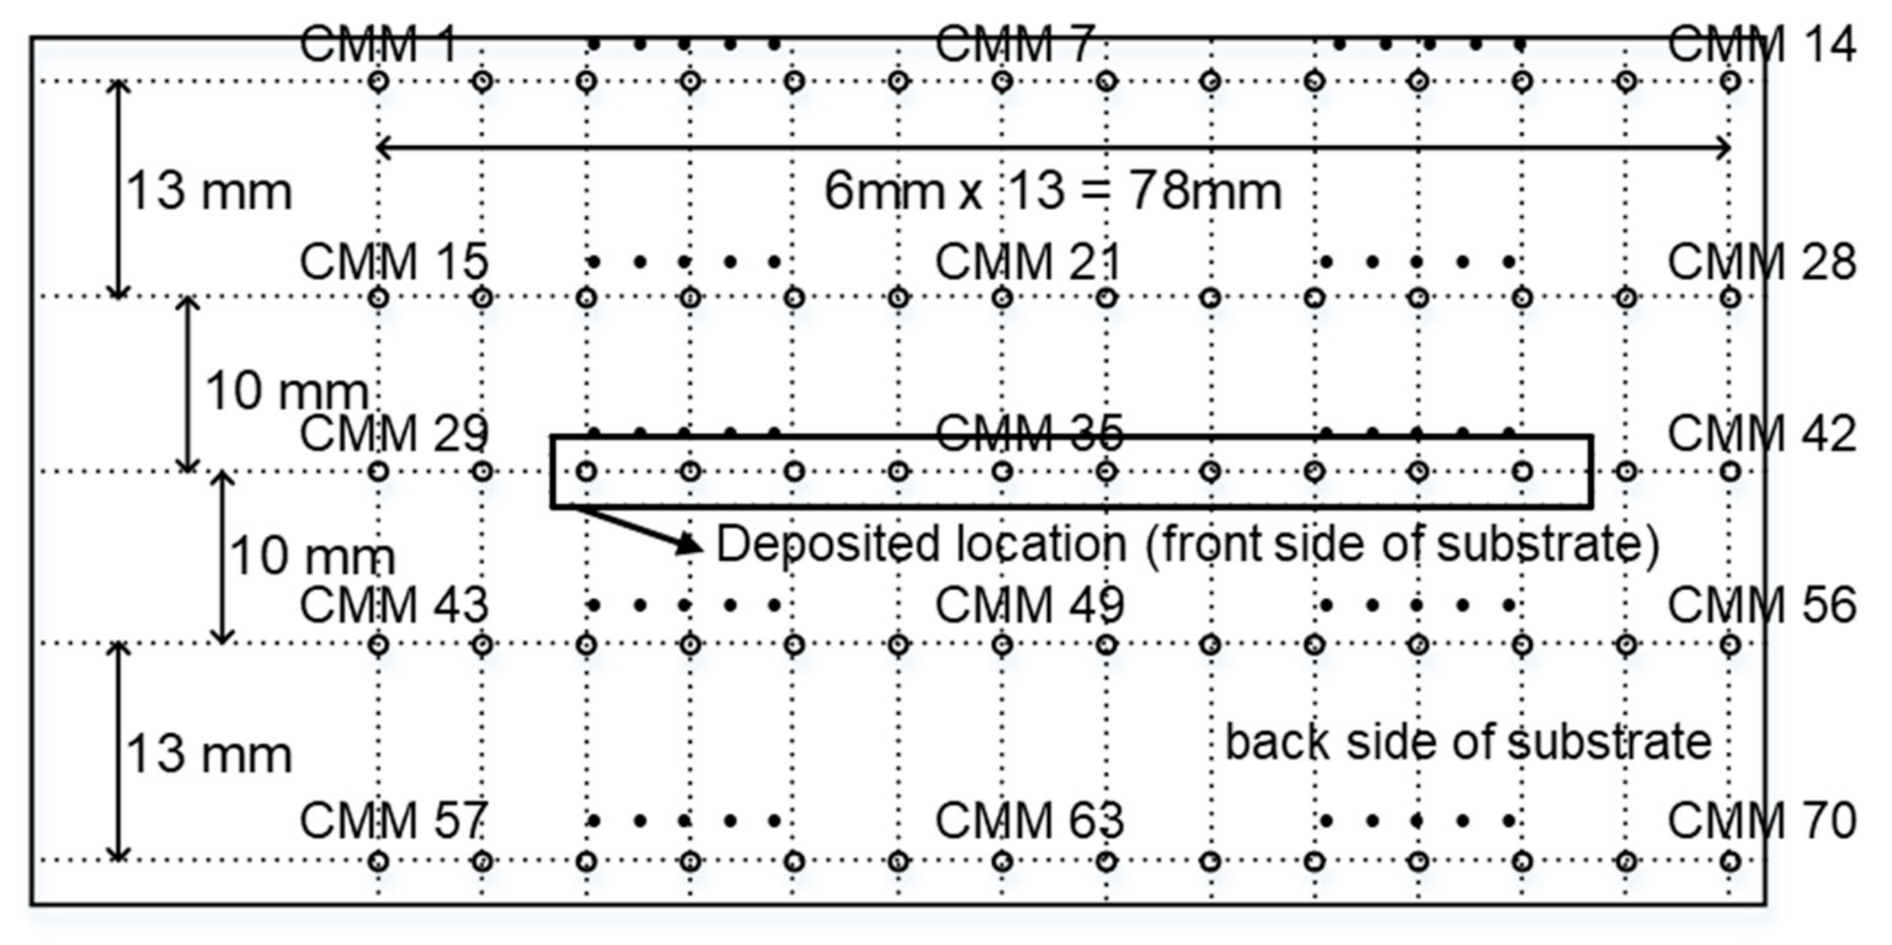
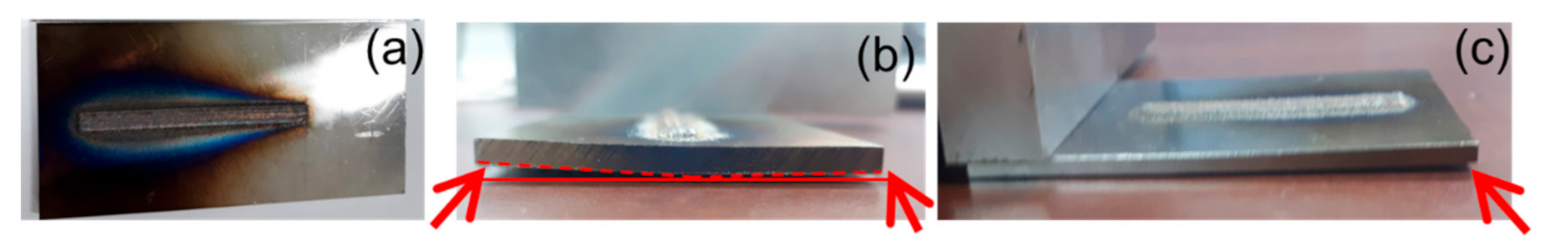
2.3. Postprocess Distortion Measurement

Postprocess substrate distortion measurement was conducted using Cimcore® Infinite® 2.0 Portable coordinate-measurement machine (CMM) which is capable of measuring to ±0.01524 mm (Figure 6). A total of 70 points were selected at the bottom side of the substrate, as shown in Figure 7 and measurements were taken twice before and after the deposition. The global distortion value was calculated by subtracting the preprocess from the postprocess measurements.

3. Results

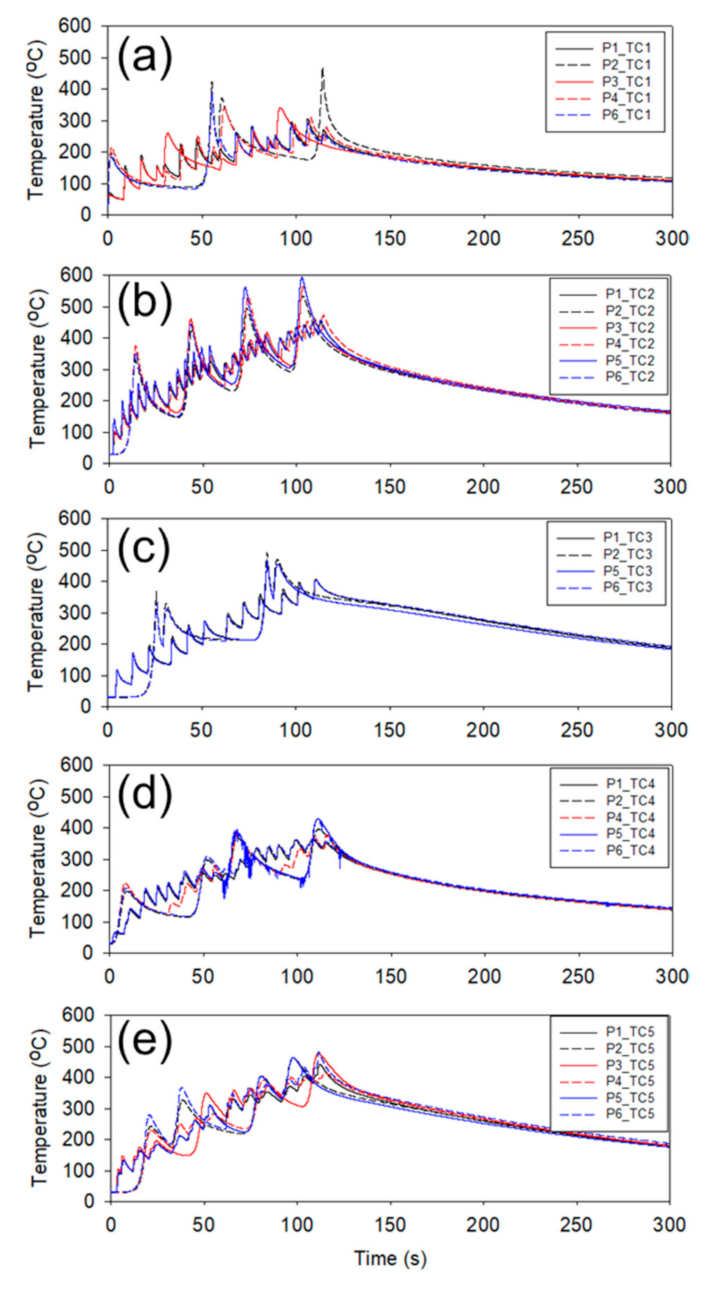
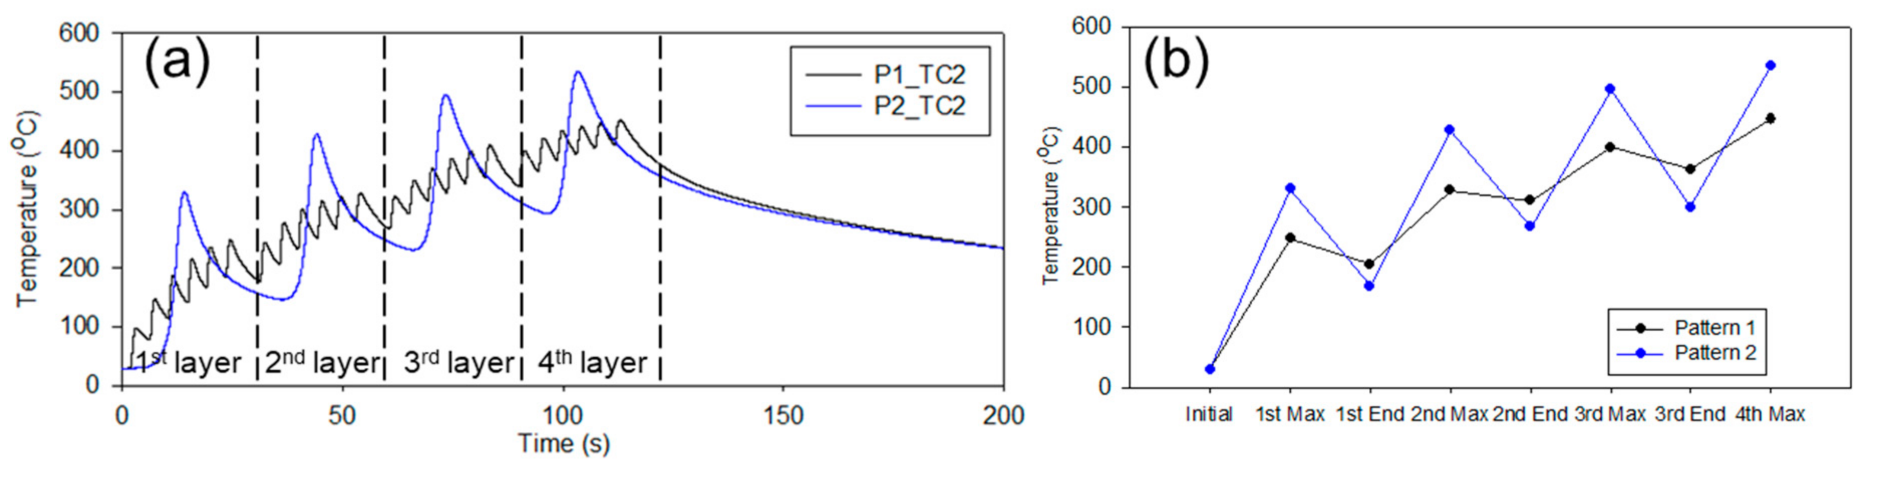
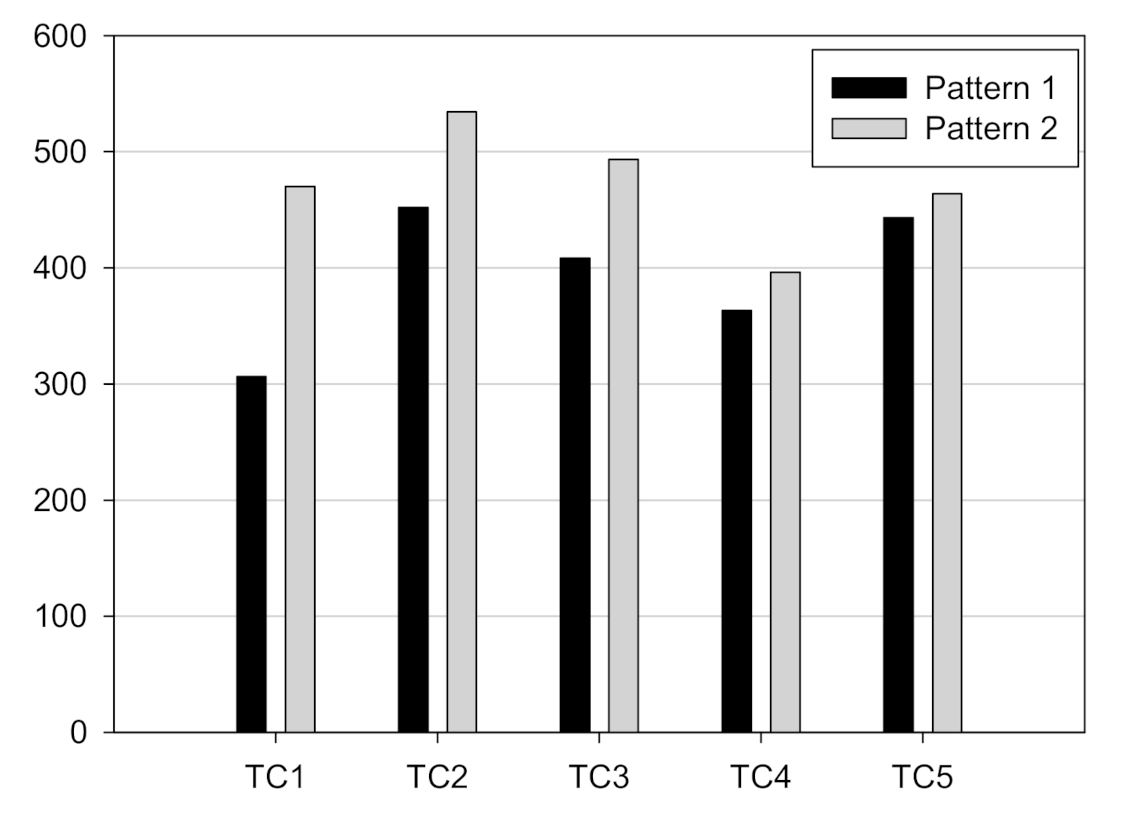
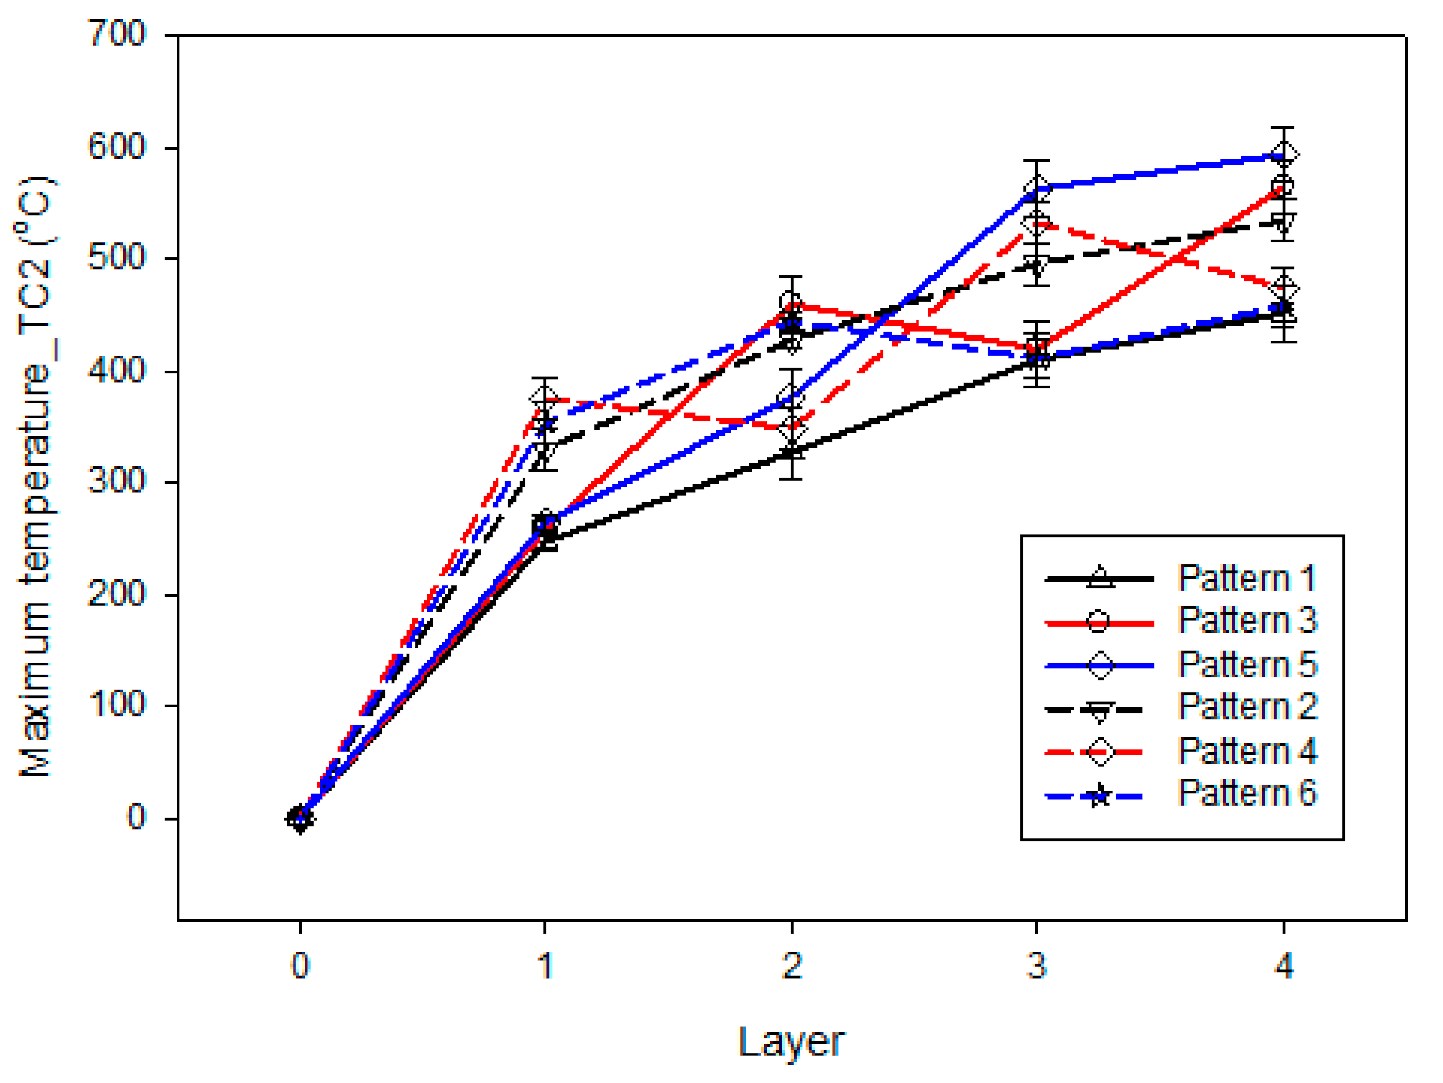
3.1. In situ Temperature Measurements

For the six pattern case studies, temperature measurements were performed at five locations, and a total of 30 locations were measured. Of the 30 measurements, four of the trials failed due to the poor contact of the thermocouple, but the temperature was successfully measured for the remaining 26 points, and the temperature distribution according to each pattern was analyzed (Table 3). The corresponding temperature histories for each pattern are provided in Figure 7.
In situ temperature measurements show that the temperature trends at each point are significantly different depending on the long raster pattern and the short raster pattern. These results are especially evident in TC2 (Figure 8b), which is the center location of the substrate back side. In the case of the short raster pattern, the maximum temperature gradually increases with rise and fall, whereas in the case of the long raster pattern, the maximum temperature gradient increases with a rapid temperature gradient and the temperature tends to decrease with a rapid temperature gradient in each layer.
Maximum temperature recorded in thermocouple 2 for each layer and temperature at the end of each layer for pattern 1 and pattern 2 are shown in Figure 9. From this result, even if the same heat input is applied to the same area for the same time, the temperature distribution and maximum temperature generated according to the tool path are different. In both patterns considering the tool path, the temperature rises when the distance between the temperature measurement point and the heat source decreases, and the temperature decreases when the distance increases. However, the temperature gradient in pattern 2 is found to be steeper than in pattern 1, and the highest temperature in thermocouple 2 is also higher in pattern 2. Furthermore, when comparing the highest recorded temperatures for each thermocouple in pattern 1 and pattern 2, it was shown that the higher temperature was also measured in pattern 2 at the same point in Figure 10. The unit heat input is the same since both pattern 1 and pattern 2 deposited the same amount of heat input over the same area for the same time. The major difference between the two patterns is that the deposition with a long raster pattern has a larger surface area exposed to the atmosphere during the deposition. Analyzing this tendency, it can be seen that the heat loss from the DMT-AM process has a great effect on the radiation and convection caused by the contact between the deposited material and the atmosphere.
Similarly, for patterns 1 to 6, the maximum temperature at each layer measured in the thermocouple 2 is compared in Figure 11. When deposited with a short raster pattern, the temperature rise gradient is larger than with the long raster pattern, but the temperature decrease gradient is also greater. Therefore, it is shown that for some of the combination of the short raster pattern and the long raster pattern (pattern 3 and pattern 5) has a higher maximum temperature than when the four layers are deposited with the short raster pattern. Also, the results show that the peak temperature of each layer can even decrease according to the sequence of the deposition pattern (pattern 4 and pattern 6). These experimental results are evidence that the appropriate design of the deposition pattern for each layer can be utilized to control the maximum temperature of the AM parts. Table 4 shows the overall maximum temperature recorded in thermocouple 2 for patterns 1 to 6.

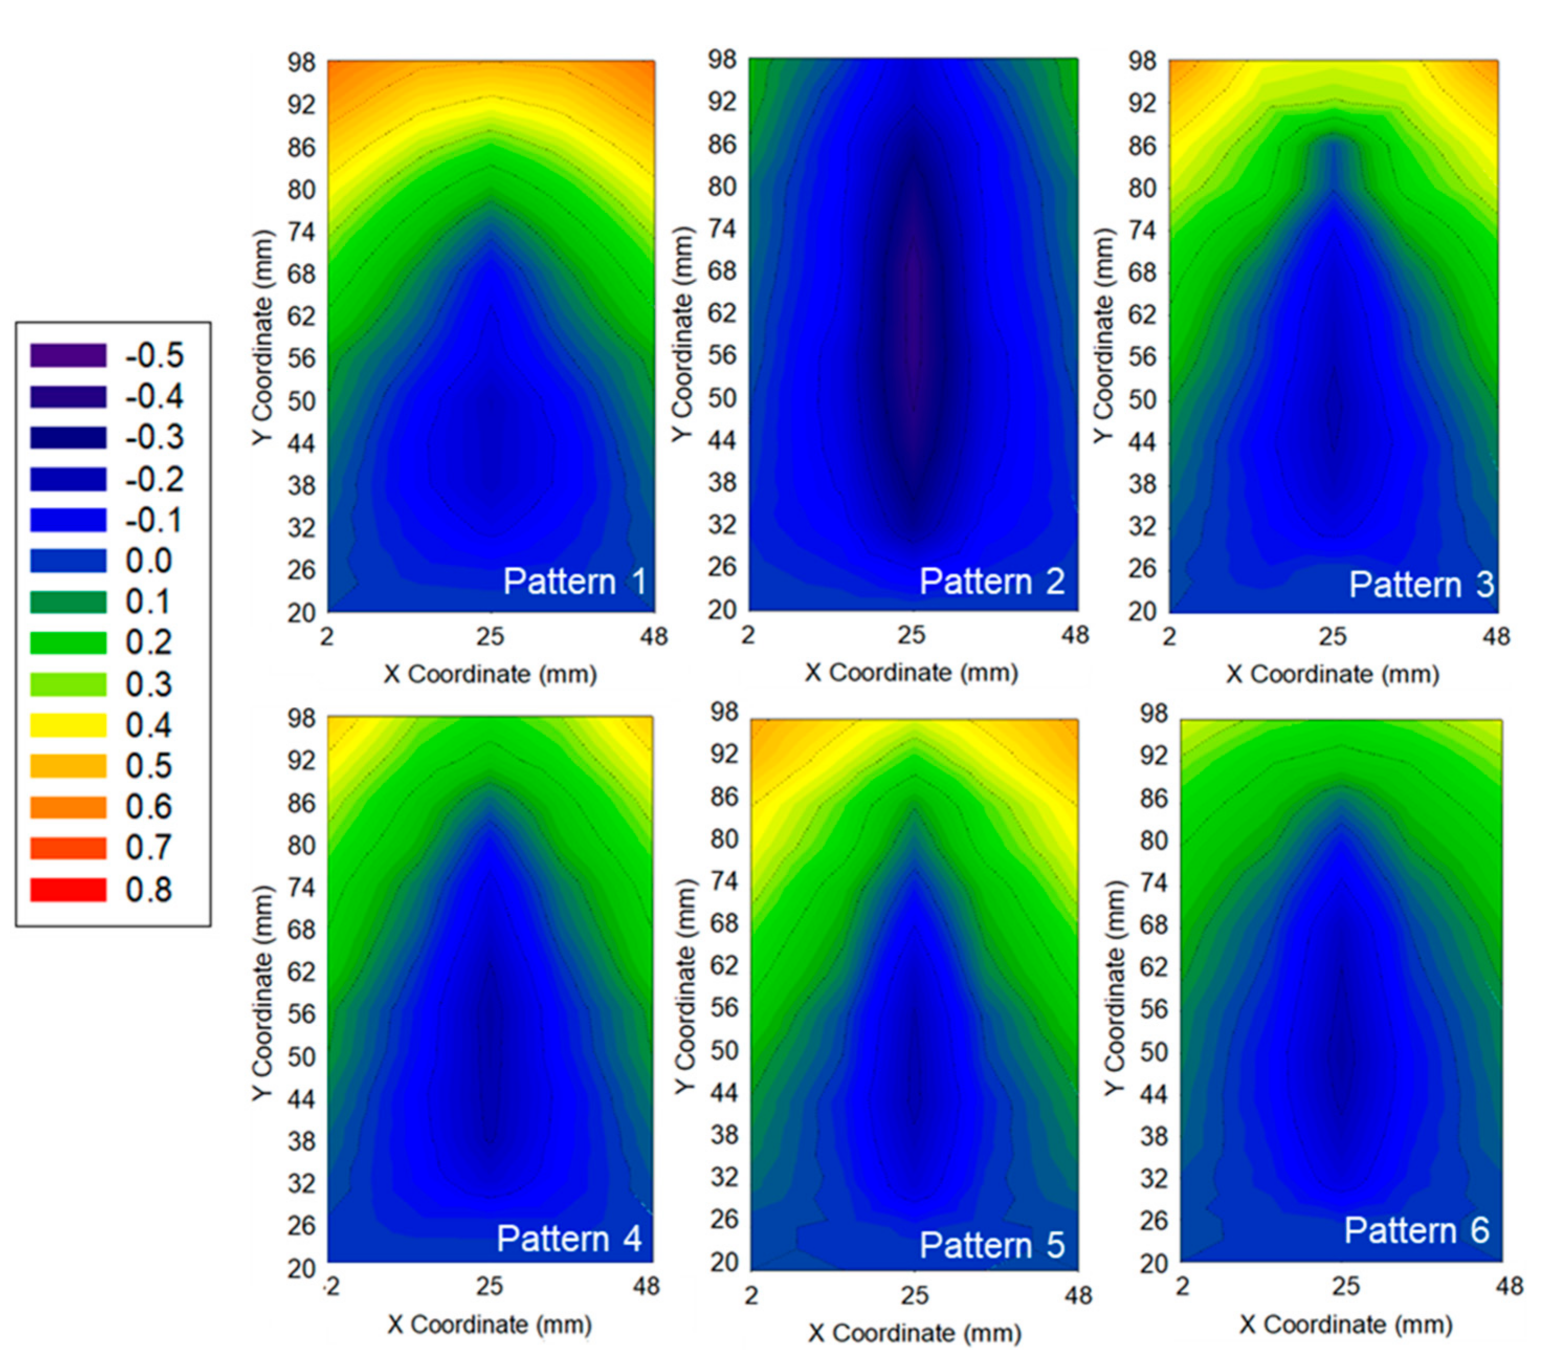
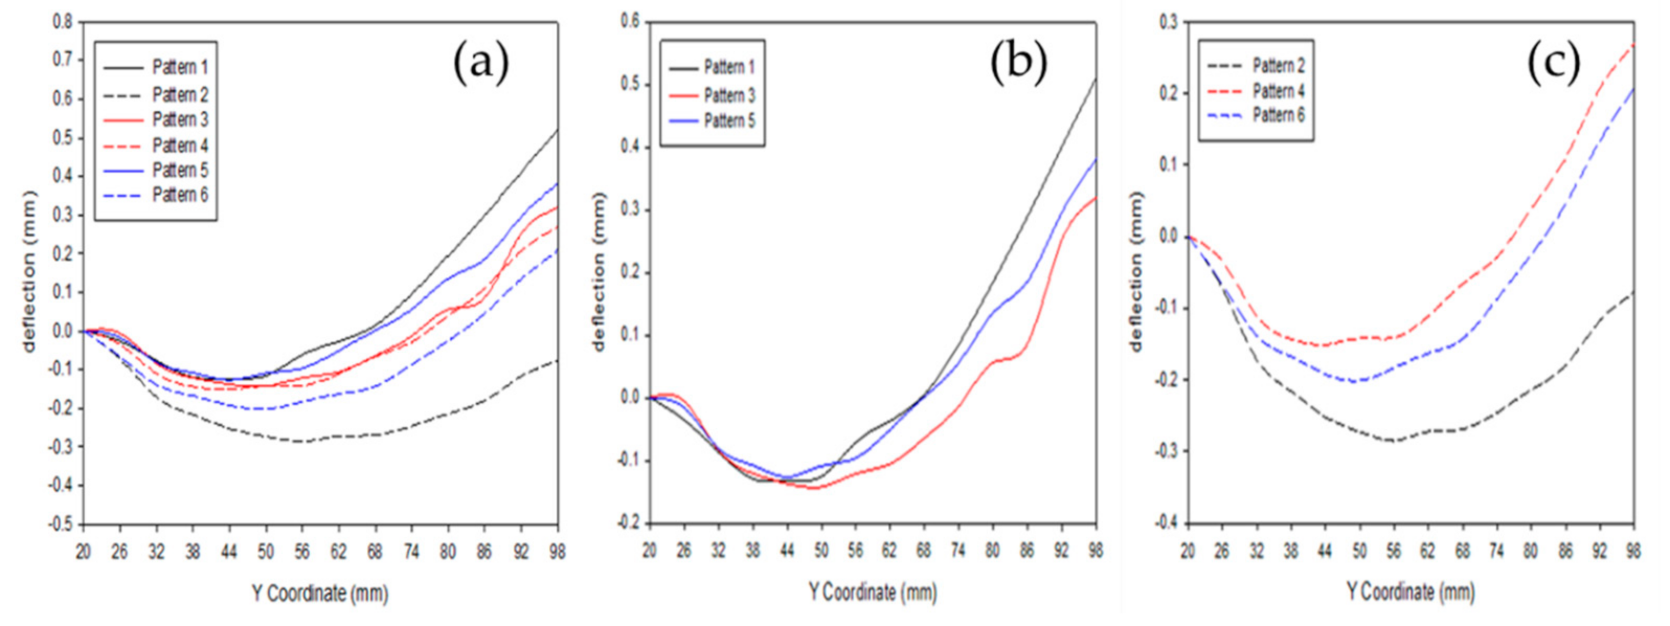
3.2. Postprocess Distortion Measurements

The global distortion that occurred in patterns 1~6 are measured by CMM and plotted as shown in Figure 12. The results show that there is a difference in quantitative values, but the tendency of out-of-plane deformation is similar for all of the patterns except for pattern 2. In particular, it can be seen that longitudinal bending is dominant in pattern 1 and angular distortion in transverse direction is predominant in pattern 2. The top view, front view and the side view of the pattern 1 specimen results are shown in Figure 13.
A comparison of the deflection values at the center of the substrate along the length direction is shown in Figure 14. In the case of patterns 3~6 applied by combining short raster pattern and long raster pattern, it is shown that the amount of deflection is within the result range of Pattern 1 and Pattern 2. The results of pattern 2, 4, and 6, in which the first layer was applied as a short raster pattern, were shown to have a small deflection when a short raster pattern was applied at a lower layer. Likewise, pattern 1, 3, and 5 in which the first layer was applied as a long raster pattern, showed the same tendency. From these results, it can be seen that the design of the first layer pattern has a dominant influence on the longitudinal bending deflection that occurs.

4. Discussion

This research studied the effect of deposition pattern on the temperature and global distortion of Direct Metal Tooling (DMT) based Additive Manufactured (AM) part through the experimental approach. The novelty of this study is that deposition patterns were designed combining the long raster pattern and the short raster pattern uniformly in various directions rather than single direction to prevent such anisotropy. The main conclusions are as follows:
(1)
The deposition pattern highly affects the temperature gradient of each layer. For the case study, short raster pattern had higher temperature gradient for both heating and cooling compared with the long raster pattern.
(2)
The peak temperature of each layer can increase or even decrease according to the sequence of the deposition pattern. This experimental result can be the evidence that appropriate design of the deposition pattern for each layer can be utilized to control the maximum temperature of the AM parts.
(3)
The resulting trends demonstrated that with the short raster pattern deposition, angular distortion is the main distortion and with the long raster pattern deposition, longitudinal bending is the main distortion of the substrate. The pattern of the first layer had a dominant influence on the longitudinal bending deflection that occurs.
(4)
Although the short raster pattern deposition showed higher temperature than the long raster pattern in the substrate, distortion in the longitudinal direction showed higher value with the long raster pattern than the short raster pattern. Based on these results, the expected dominant distortion type needs to be considered in advance of planning an appropriate tool path schedule.

5. Conclusions

In this study, the effect of deposition pattern on the temperature and global distortion of Direct Metal Tooling (DMT) based Additive Manufactured (AM) part was investigated through the experimental results of laser deposited SUS316. In situ temperature measurements were used to monitor the temperature of the substrates and global distortion patterns were analyzed using CMM (coordinate Measuring Machine) after the deposition. Six different patterns combining long raster and short raster patterns were considered for the case studies. The results showed that the deposition pattern affects the temperature gradient and the peak temperature of each layer can increase or decrease according to the sequence of the deposition pattern. Also, the pattern of first layer had a dominant influence on the longitudinal bending deflection that occurs.
The limitation of this work is that it was presented only based on an experimental point of view discussing only a single geometry. In order to find out the generalized relationship between the maximum temperature and the distortion value, various shapes should be investigated. In the future, through experiments on various shapes, we will investigate the relationship between the maximum temperature distribution and the overall distortion pattern. Finally, based on these studies, appropriate tool path schedule will be utilized to control not only the distortion but also the peak temperature of the DMT-based AM parts.

Author Contributions

Conceptualization, J.L. and H.C.; methodology, J.L.; investigation, J.L.; resources, H.C.; data curation, J.L.; writing—original draft preparation, J.L.; writing—review and editing, J.L. and H.C.; visualization, J.L.; supervision, H.C.; project administration, H.C.; funding acquisition, H.C. All authors have read and agreed to the published version of the manuscript.

Funding

This research was supported by the research fund of Chungnam National University.

Acknowledgments

In this study, the data were obtained as a result of tests performed in the “InssTek, Inc.”.

Conflicts of Interest

The authors declare no conflict of interest.

References

  1. Shin, T.; Kim, Y.-S.; Kim, J.; Lee, K.-Y.; Lee, S.-J.; Sun, D.; Lim, Y.-W.; Lim, D. Applicability evaluation of direct metal tooling-based additive manufacturing for reducing ceramic liner fracture in total hip arthroplasty. Surf. Coatings Technol. 2018, 347, 313–319. [Google Scholar] [CrossRef]
  2. Shin, T.; Park, S.-J.; Kang, K.S.; Kim, J.S.; Lim, Y. A laser-aided direct metal tooling technology for artificial joint surface coating. Int. J. Precis. Eng. Manuf. 2017, 18, 233–238. [Google Scholar] [CrossRef]
  3. Corbin, D.J.; Nassar, A.R.; Reutzel, E.W.; Beese, A.M.; Michaleris, P.; Michaleris, P. (Pan) Effect of Substrate Thickness and Preheating on the Distortion of Laser Deposited Ti–6Al–4V. J. Manuf. Sci. Eng. 2018, 140, 061009. [Google Scholar] [CrossRef] [Green Version]
  4. Chiumenti, M.; Lin, X.; Cervera, M.; Lei, W.; Zheng, Y.; Huang, W. Numerical simulation and experimental calibration of additive manufacturing by blown powder technology. Part I: Thermal analysis. Rapid Prototyp. J. 2017, 23, 448–463. [Google Scholar] [CrossRef] [Green Version]
  5. Denlinger, E.R.; Heigel, J.C.; Michaleris, P.; Palmer, T. Effect of inter-layer dwell time on distortion and residual stress in additive manufacturing of titanium and nickel alloys. J. Mater. Process. Technol. 2015, 215, 123–131. [Google Scholar] [CrossRef]
  6. Lee, J.; Seo, H.; Chung, H. Efficient welding distortion analysis method for large welded structures. J. Mater. Process. Technol. 2018, 256, 36–50. [Google Scholar] [CrossRef]
  7. Li, F.; Chen, S.; Shi, J.; Zhao, Y. In-process control of distortion in wire and arc additive manufacturing based on a flexible multi-point support fixture. Sci. Technol. Weld. Join. 2018, 24, 36–42. [Google Scholar] [CrossRef]
  8. Denlinger, E.R.; Michaleris, P. Mitigation of distortion in large additive manufacturing parts. Proc. Inst. Mech. Eng. Part B J. Eng. Manuf. 2015, 231, 983–993. [Google Scholar] [CrossRef]
  9. Chen, B.; Mazumder, J. Role of process parameters during additive manufacturing by direct metal deposition of Inconel 718. Rapid Prototyp. J. 2017, 23, 919–929. [Google Scholar] [CrossRef]
  10. Ahmed, A.; Majeed, A.; Atta, Z.; Jia, G. Dimensional Quality and Distortion Analysis of Thin-Walled Alloy Parts of AlSi10Mg Manufactured by Selective Laser Melting. J. Manuf. Mater. Process. 2019, 3, 51. [Google Scholar] [CrossRef] [Green Version]
  11. Dass, A.; Moridi, A. State of the Art in Directed Energy Deposition: From Additive Manufacturing to Materials Design. Coatings 2019, 9, 418. [Google Scholar] [CrossRef] [Green Version]
  12. DebRoy, T.; Wei, H.L.; Zuback, J.S.; Mukherjee, T.; Elmer, J.W.; Milewski, J.O.; Beese, A.M.; Wilson-Heid, A.; De, A.; Zhang, W. Additive manufacturing of metallic components – Process, structure and properties. Prog. Mater. Sci. 2018, 92, 112–224. [Google Scholar] [CrossRef]
  13. Arısoy, Y.M.; Criales, L.E.; Özel, T.; Lane, B.; Moylan, S.; Donmez, A. Influence of scan strategy and process parameters on microstructure and its optimization in additively manufactured nickel alloy 625 via laser powder bed fusion. Int. J. Adv. Manuf. Technol. 2016, 90, 1393–1417. [Google Scholar] [CrossRef]
  14. Hanzl, P.; Zetek, M.; Bakša, T.; Kroupa, T. The Influence of Processing Parameters on the Mechanical Properties of SLM Parts. Procedia Eng. 2015, 100, 1405–1413. [Google Scholar] [CrossRef] [Green Version]
  15. Thompson, S.M.; Bian, L.; Shamsaei, N.; Yadollahi, A. An overview of Direct Laser Deposition for additive manufacturing; Part I: Transport phenomena, modeling and diagnostics. Addit. Manuf. 2015, 8, 36–62. [Google Scholar] [CrossRef]
  16. Brenken, B.; Barocio, E.; Favaloro, A.J.; Kunc, V.; Tseng, H.-C. Fused filament fabrication of fiber-reinforced polymers: A review. Addit. Manuf. 2018, 21, 1–16. [Google Scholar] [CrossRef]
  17. Mohamed, O.A.; Masood, S.H.; Bhowmik, J.L. Optimization of fused deposition modeling process parameters: A review of current research and future prospects. Adv. Manuf. 2015, 3, 42–53. [Google Scholar] [CrossRef]
  18. Goh, G.D.; Yap, Y.L.; Tan, H.K.J.; Sing, S.L.; Yeong, W.Y. Process–Structure–Properties in Polymer Additive Manufacturing via Material Extrusion: A Review. Crit. Rev. Solid State Mater. Sci. 2019, 45, 113–133. [Google Scholar] [CrossRef]
  19. Nazemi, N.; Urbanic, R.J. A numerical investigation for alternative toolpath deposition solutions for surface cladding of stainless steel P420 powder on AISI 1018 steel substrate. Int. J. Adv. Manuf. Technol. 2018, 96, 4123–4143. [Google Scholar] [CrossRef]
  20. Nickel, A.; Barnett, D.; Prinz, F. Thermal stresses and deposition patterns in layered manufacturing. Mater. Sci. Eng. A 2001, 317, 59–64. [Google Scholar] [CrossRef]
  21. Deng, D.; Murakawa, H.; Liang, W. Numerical simulation of welding distortion in large structures. Comput. Methods Appl. Mech. Eng. 2007, 196, 4613–4627. [Google Scholar] [CrossRef]
  22. Wang, J.; Yuan, H.; Ma, N.; Murakawa, H. Recent research on welding distortion prediction in thin plate fabrication by means of elastic FE computation. Mar. Struct. 2016, 47, 42–59. [Google Scholar] [CrossRef]
  23. Park, J.; An, G. Prediction of the welding distortion of large steel structure with mechanical restraint using equivalent load methods. Int. J. Nav. Arch. Ocean Eng. 2017, 9, 315–325. [Google Scholar] [CrossRef]
Figure 1. Insstek® MX-1000, a Direct Metal Tooling (DMT) metal 3D printer.
Applsci 10 07653 g001
Figure 2. Schematics of the substrate and test sample dimensions.
Applsci 10 07653 g002
Figure 3. Tool path of the short, long raster pattern.
Applsci 10 07653 g003
Figure 4. Schematic of the thermocouple (TC) location.
Applsci 10 07653 g004
Figure 5. Experimental setup for the in situ temperature measurement.
Applsci 10 07653 g005
Figure 6. Cimcore® Infinite® 2.0 Portable coordinate-measurement machine (CMM).
Applsci 10 07653 g006
Figure 7. Schematic of 70 CMM points on the back side of the substrate.
Applsci 10 07653 g007
Figure 8. In situ temperature history of each thermocouple for all patterns: (a) Thermocouple 1 temperature history; (b) Thermocouple 2 temperature history; (c) Thermocouple 3 temperature history; (d) Thermocouple 4 temperature history; (e) Thermocouple 5 temperature history.
Applsci 10 07653 g008
Figure 9. Maximum temperature and temperature at the end of each layer: (a) In situ temperature history of thermocouple 2 recorded in pattern1 and pattern 2; (b) Maximum temperature and temperature at the end of each layer recorded in thermocouple 2 for pattern 1 and pattern 2.
Applsci 10 07653 g009
Figure 10. Overall maximum temperature comparison between Pattern 1 and Pattern 2.
Applsci 10 07653 g010
Figure 11. Maximum in situ temperature recorded in thermocouple 2 at each layer.
Applsci 10 07653 g011
Figure 12. Out of plane (in Z axis) global distortion of Pattern 1~Pattern 6.
Applsci 10 07653 g012
Figure 13. Pattern 1 specimen result: (a)Top view; (b)Front view; (c)Side view.
Applsci 10 07653 g013
Figure 14. Deflection values at the center of the substrate along the length direction of pattern 1~pattern 6: (a) Overall patterns 1~6; (b) pattern 1, pattern 3 and pattern5; (c) pattern 2, pattern 4 and pattern 6.
Applsci 10 07653 g014
Table 1. Process parameters.
ItemValue
Nominal Laser power (kW)0.6
Travel speed (m/min)0.85
Mass feed rate (g/min)8.0
Hatching space (mm)0.8
Layer thickness (mm)0.45
Beam diameter (mm)1.2
Substrate materialSM45C
Powder materialSUS316
Table 2. Tool path for the Pattern 1~6.
1st Layer2nd Layer3rd Layer4th Layer
Pattern 1ABAB
Pattern 2CDCD
Pattern 3ACAC
Pattern 4CACA
Pattern 5ABCD
Pattern 6CDAB
Table 3. Temperature measurement success/failure results at each location.
TC 1TC 2TC 3TC 4TC 5
Pattern 1
Pattern 2
Pattern 3××
Pattern 4×
Pattern 5×
Pattern 6
Table 4. Overall maximum temperature recorded in thermocouple 2.
Maximum Temperature (℃)Pattern
550~600Pattern 3, Pattern 5
500~550Pattern 2, Pattern 4
450~500Pattern 1, Pattern 6
Publisher’s Note: MDPI stays neutral with regard to jurisdictional claims in published maps and institutional affiliations.

