Markers of Energy Metabolism Affect Lactate Metabolism and Aerobic Performance in Competitive Female Cyclists


Abstract
Featured Application
Abstract
1. Introduction
2. Materials and Methods
2.1. Study Design
2.2. Procedures
2.3. Data Analysis
3. Results
4. Discussion
5. Conclusions
Author Contributions
Funding
Acknowledgments
Conflicts of Interest
References
- Mountjoy, M.; Sundgot-Borgen, J.; Burke, L.; Carter, S.; Constantini, N.; Lebrun, C.; Meyer, N.; Sherman, R.; Steffen, K.; Budgett, R.; et al. The IOC consensus statement: Beyond the Female Athlete Triad—Relative Energy Deficiency in Sport (RED-S). Br. J. Sports Med. 2014, 48, 491–497. [Google Scholar] [CrossRef] [PubMed]
- Mountjoy, M.; Sundgot-Borgen, J.; Burke, L.; Ackerman, K.E.; Blauwet, C.; Constantini, N.; Lebrun, C.; Lundy, B.; Melin, A.; Meyer, N.; et al. International Olympic Committee (IOC) Consensus Statement on Relative Energy Deficiency in Sport (RED-S): 2018 Update. Int. J. Sport Nutr. Exerc. Metab. 2018, 28, 316–331. [Google Scholar] [CrossRef] [PubMed]
- Vanheest, J.L.; Rodgers, C.D.; Mahoney, C.E.; De Souza, M.J. Ovarian suppression impairs sport performance in junior elite female swimmers. Med. Sci. Sports Exerc. 2014, 46, 156–166. [Google Scholar] [CrossRef] [PubMed]
- Tornberg, Å.B.; Melin, A.; Koivula, F.M.; Johansson, A.; Skouby, S.; Faber, J.; Sjödin, A. Reduced Neuromuscular Performance in Amenorrheic Elite Endurance Athletes. Med. Sci. Sports Exerc. 2017, 49, 2478–2485. [Google Scholar] [CrossRef] [PubMed]
- Woods, A.L.; Garvican-Lewis, L.A.; Lundy, B.; Rice, A.J.; Thompson, K.G. New approaches to determine fatigue in elite athletes during intensified training: Resting metabolic rate and pacing profile. PLoS ONE 2017, 12, e0173807. [Google Scholar] [CrossRef] [PubMed]
- Woods, A.L.; Rice, A.J.; Garvican-Lewis, L.A.; Wallett, A.M.; Lundy, B.; Rogers, M.A.; Welvaert, M.; Halson, S.; McKune, A.; Thompson, K.G. The effects of intensified training on resting metabolic rate (RMR), body composition and performance in trained cyclists. PLoS ONE 2018, 13, e0191644. [Google Scholar] [CrossRef]
- Melin, A.; Tornberg, Å.B.; Skouby, S.; Faber, J.; Ritz, C.; Sjödin, A.; Sundgot-Borgen, J. The LEAF questionnaire: A screening tool for the identification of female athletes at risk for the female athlete triad. Br. J. Sports Med. 2014, 48, 540–545. [Google Scholar] [CrossRef]
- Logue, D.M.; Madigan, S.M.; Melin, A.; Delahunt, E.; Heinen, M.; Mc Donnell, S.J.; Corish, C.A. Low energy availability in athletes 2020: An updated narrative review of prevalence, risk, within-day energy balance, knowledge, and impact on sports performance. Nutrients 2020, 12, 835. [Google Scholar] [CrossRef]
- Ackerman, K.E.; Holtzman, B.; Cooper, K.M.; Flynn, E.F.; Bruinvels, G.; Tenforde, A.S.; Popp, K.L.; Simpkin, A.J.; Parziale, A.L. Low energy availability surrogates correlate with health and performance consequences of Relative Energy Deficiency in Sport. Br. J. Sports Med. 2018, 53, 628–633. [Google Scholar] [CrossRef]
- Torstveit, M.K.; Fahrenholtz, I.; Stenqvist, T.B.; Sylta, Ø.; Melin, A. Within-day Energy Deficiency and Metabolic Perturbation in Male Endurance Athletes. Int. J. Sport Nutr. Exerc. Metab. 2018, 28, 419–427. [Google Scholar] [CrossRef]
- Fahrenholtz, I.L.; Sjödin, A.; Benardot, D.; Tornberg, Å.B.; Skouby, S.; Faber, J.; Sundgot-Borgen, J.K.; Melin, A.K. Within-day energy deficiency and reproductive function in female endurance athletes. Scand. J. Med. Sci. Sports 2018, 28, 1139–1146. [Google Scholar] [CrossRef] [PubMed]
- Deutz, R.C.; Benardot, D.; Martin, D.E.; Cody, M.M. Relationship between energy deficits and body composition in elite female gymnasts and runners. Med. Sci. Sports Exerc. 2000, 32, 659–668. [Google Scholar] [CrossRef] [PubMed]
- Mountjoy, M.L.; Burke, L.M.; Stellingwerff, T.; Sundgot-Borgen, J. Relative Energy Deficiency in Sport: The Tip of an Iceberg. Int. J. Sport Nutr. Exerc. Metab. 2018, 28, 313–315. [Google Scholar] [CrossRef] [PubMed]
- Iacovides, S.; Avidon, I.; Baker, F.C. What we know about primary dysmenorrhea today: A critical review. Hum. Reprod. Update 2015, 21, 762–778. [Google Scholar] [CrossRef] [PubMed]
- Brodie, D.; Moscrip, V.; Hutcheon, R. Body composition measurement: A review of hydrodensitometry, anthropometry, and impedance methods. Nutrition 1998, 14, 296–310. [Google Scholar] [CrossRef]
- Westerterp, K.R. Measurement of Energy Expenditure. In Translational Research Methods for Diabetes, Obesity and Cardiometabolic Drug Development; Springer: London, UK, 2015; pp. 169–187. [Google Scholar]
- Compher, C.; Frankenfield, D.; Keim, N.; Roth-Yousey, L. Evidence Analysis Working Group Best Practice Methods to Apply to Measurement of Resting Metabolic Rate in Adults: A Systematic Review. J. Am. Diet. Assoc. 2006, 106, 881–903. [Google Scholar] [CrossRef]
- Harris, J.A.; Benedict, F.G. A Biometric Study of Human Basal Metabolism. Proc. Natl. Acad. Sci. USA 1918, 4, 370–373. [Google Scholar] [CrossRef]
- Guebels, C.P.; Kam, L.C.; Maddalozzo, G.F.; Manore, M.M. Active women before/after an intervention designed to restore menstrual function: Resting metabolic rate and comparison of four methods to quantify energy expenditure and energy availability. Int. J. Sport Nutr. Exerc. Metab. 2014, 24, 37–46. [Google Scholar] [CrossRef]
- Torstveit, M.K.; Fahrenholtz, I.L.; Lichtenstein, M.B.; Stenqvist, T.B.; Melin, A.K. Exercise dependence, eating disorder symptoms and biomarkers of Relative Energy Deficiency in Sports (RED-S) among male endurance athletes. BMJ Open Sport Exerc. Med. 2019, 5, e000439. [Google Scholar] [CrossRef]
- De Weir, J.B.V. New methods for calculating metabolic rate with special reference to protein metabolism. J. Physiol. 1949, 109, 1–9. [Google Scholar] [CrossRef] [PubMed]
- Buckinx, F.; Landi, F.; Cesari, M.; Fielding, R.A.; Visser, M.; Engelke, K.; Maggi, S.; Dennison, E.; Al-Daghri, N.M.; Allepaerts, S.; et al. Pitfalls in the measurement of muscle mass: A need for a reference standard. J. Cachexia. Sarcopenia Muscle 2018, 9, 269–278. [Google Scholar] [CrossRef] [PubMed]
- Reed, G.W.; Hill, J.O. Measuring the thermic effect of food. Am. J. Clin. Nutr. 1996, 63, 164–169. [Google Scholar] [CrossRef] [PubMed]
- Jurov, I.; Kajtna, T.; Milić, R.; Rauter, S. Recovery and Dietary Factors as Predictors of Physiological Parameters in Cyclists. Med. Sport 2020, 73, 220–230. [Google Scholar]
- Rauter, S.; Vodicar, J.; Simenko, J. Body Asymmetries in Young Male Road Cyclists. Int. J. Morphol. 2017, 35, 907–912. [Google Scholar] [CrossRef][Green Version]
- Burke, L.M.; Close, G.L.; Lundy, B.; Mooses, M.; Morton, J.P.; Tenforde, A.S. Relative Energy Deficiency in Sport in Male Athletes: A Commentary on Its Presentation Among Selected Groups of Male Athletes. Int. J. Sport Nutr. Exerc. Metab. 2018, 28, 364–374. [Google Scholar] [CrossRef]
- Koehler, K.; Williams, N.I.; Mallinson, R.J.; Southmayd, E.A.; Allaway, H.C.M.; De Souza, M.J. Low resting metabolic rate in exercise-associated amenorrhea is not due to a reduced proportion of highly active metabolic tissue compartments. Am. J. Physiol. Endocrinol. Metab. 2016, 311, E480–E487. [Google Scholar] [CrossRef]
- Wells, K.R.; Jeacocke, N.A.; Appaneal, R.; Smith, H.D.; Vlahovich, N.; Burke, L.M.; Hughes, D. The Australian Institute of Sport (AIS) and National Eating Disorders Collaboration (NEDC) position statement on disordered eating in high performance sport. Br. J. Sports Med. 2020, 54, 1247–1258. [Google Scholar] [CrossRef]
- Burke, L.M.; Cox, G.R.; Culmmings, N.K.; Desbrow, B. Guidelines for daily carbohydrate intake: Do athletes achieve them? Sports Med. 2001, 31, 267–299. [Google Scholar] [CrossRef]
- Burke, L.M.; Ross, M.L.; Garvican-Lewis, L.A.; Welvaert, M.; Heikura, I.A.; Forbes, S.G.; Mirtschin, J.G.; Cato, L.E.; Strobel, N.; Sharma, A.P.; et al. Low carbohydrate, high fat diet impairs exercise economy and negates the performance benefit from intensified training in elite race walkers. J. Physiol. 2017, 595, 2785–2807. [Google Scholar] [CrossRef]
- Casarrubea, M.; Magnusson, M.S.; Roy, V.; Arabo, A.; Sorbera, F.; Santangelo, A.; Faulisi, F.; Crescimanno, G. Multivariate temporal pattern analysis applied to the study of rat behavior in the elevated plus maze: Methodological and conceptual highlights. J. Neurosci. Methods 2014, 234, 116–126. [Google Scholar] [CrossRef]
- Pic, M. Performance and Home Advantage in Handball. J. Hum. Kinet. 2018, 63, 61–71. [Google Scholar] [CrossRef] [PubMed]


| Minimum | Maximum | Mean | Std. Deviation | |
|---|---|---|---|---|
| Age | 14 | 30 | 17.50 | 5.21 |
| Height (cm) | 159.0 | 173.0 | 166.2 | 5.2 |
| Body mass (kg) | 43.0 | 64.3 | 54.2 | 7.6 |
| FFM (kg) | 41.1 | 50.7 | 45.3 | 3.1 |
| FAT (%) | 3.00% | 24.20% | 16.95% | 6.63% |
| SMM (%) | 42.00% | 53.00% | 45.63% | 3.44% |
| Minimum | Maximum | Mean | Std. Deviation | |
|---|---|---|---|---|
| EEE (kcal/day) | 460.00 | 1912.00 | 1357.81 | 474.62 |
| EE (kcal/day) | 914.46 | 2313.57 | 1740.84 | 455.52 |
| EI (kcal/day) | 1408.70 | 2243.79 | 1802.52 | 332.91 |
| EB (kcal/day) | −431.08 | 1168.72 | 61.68 | 496.70 |
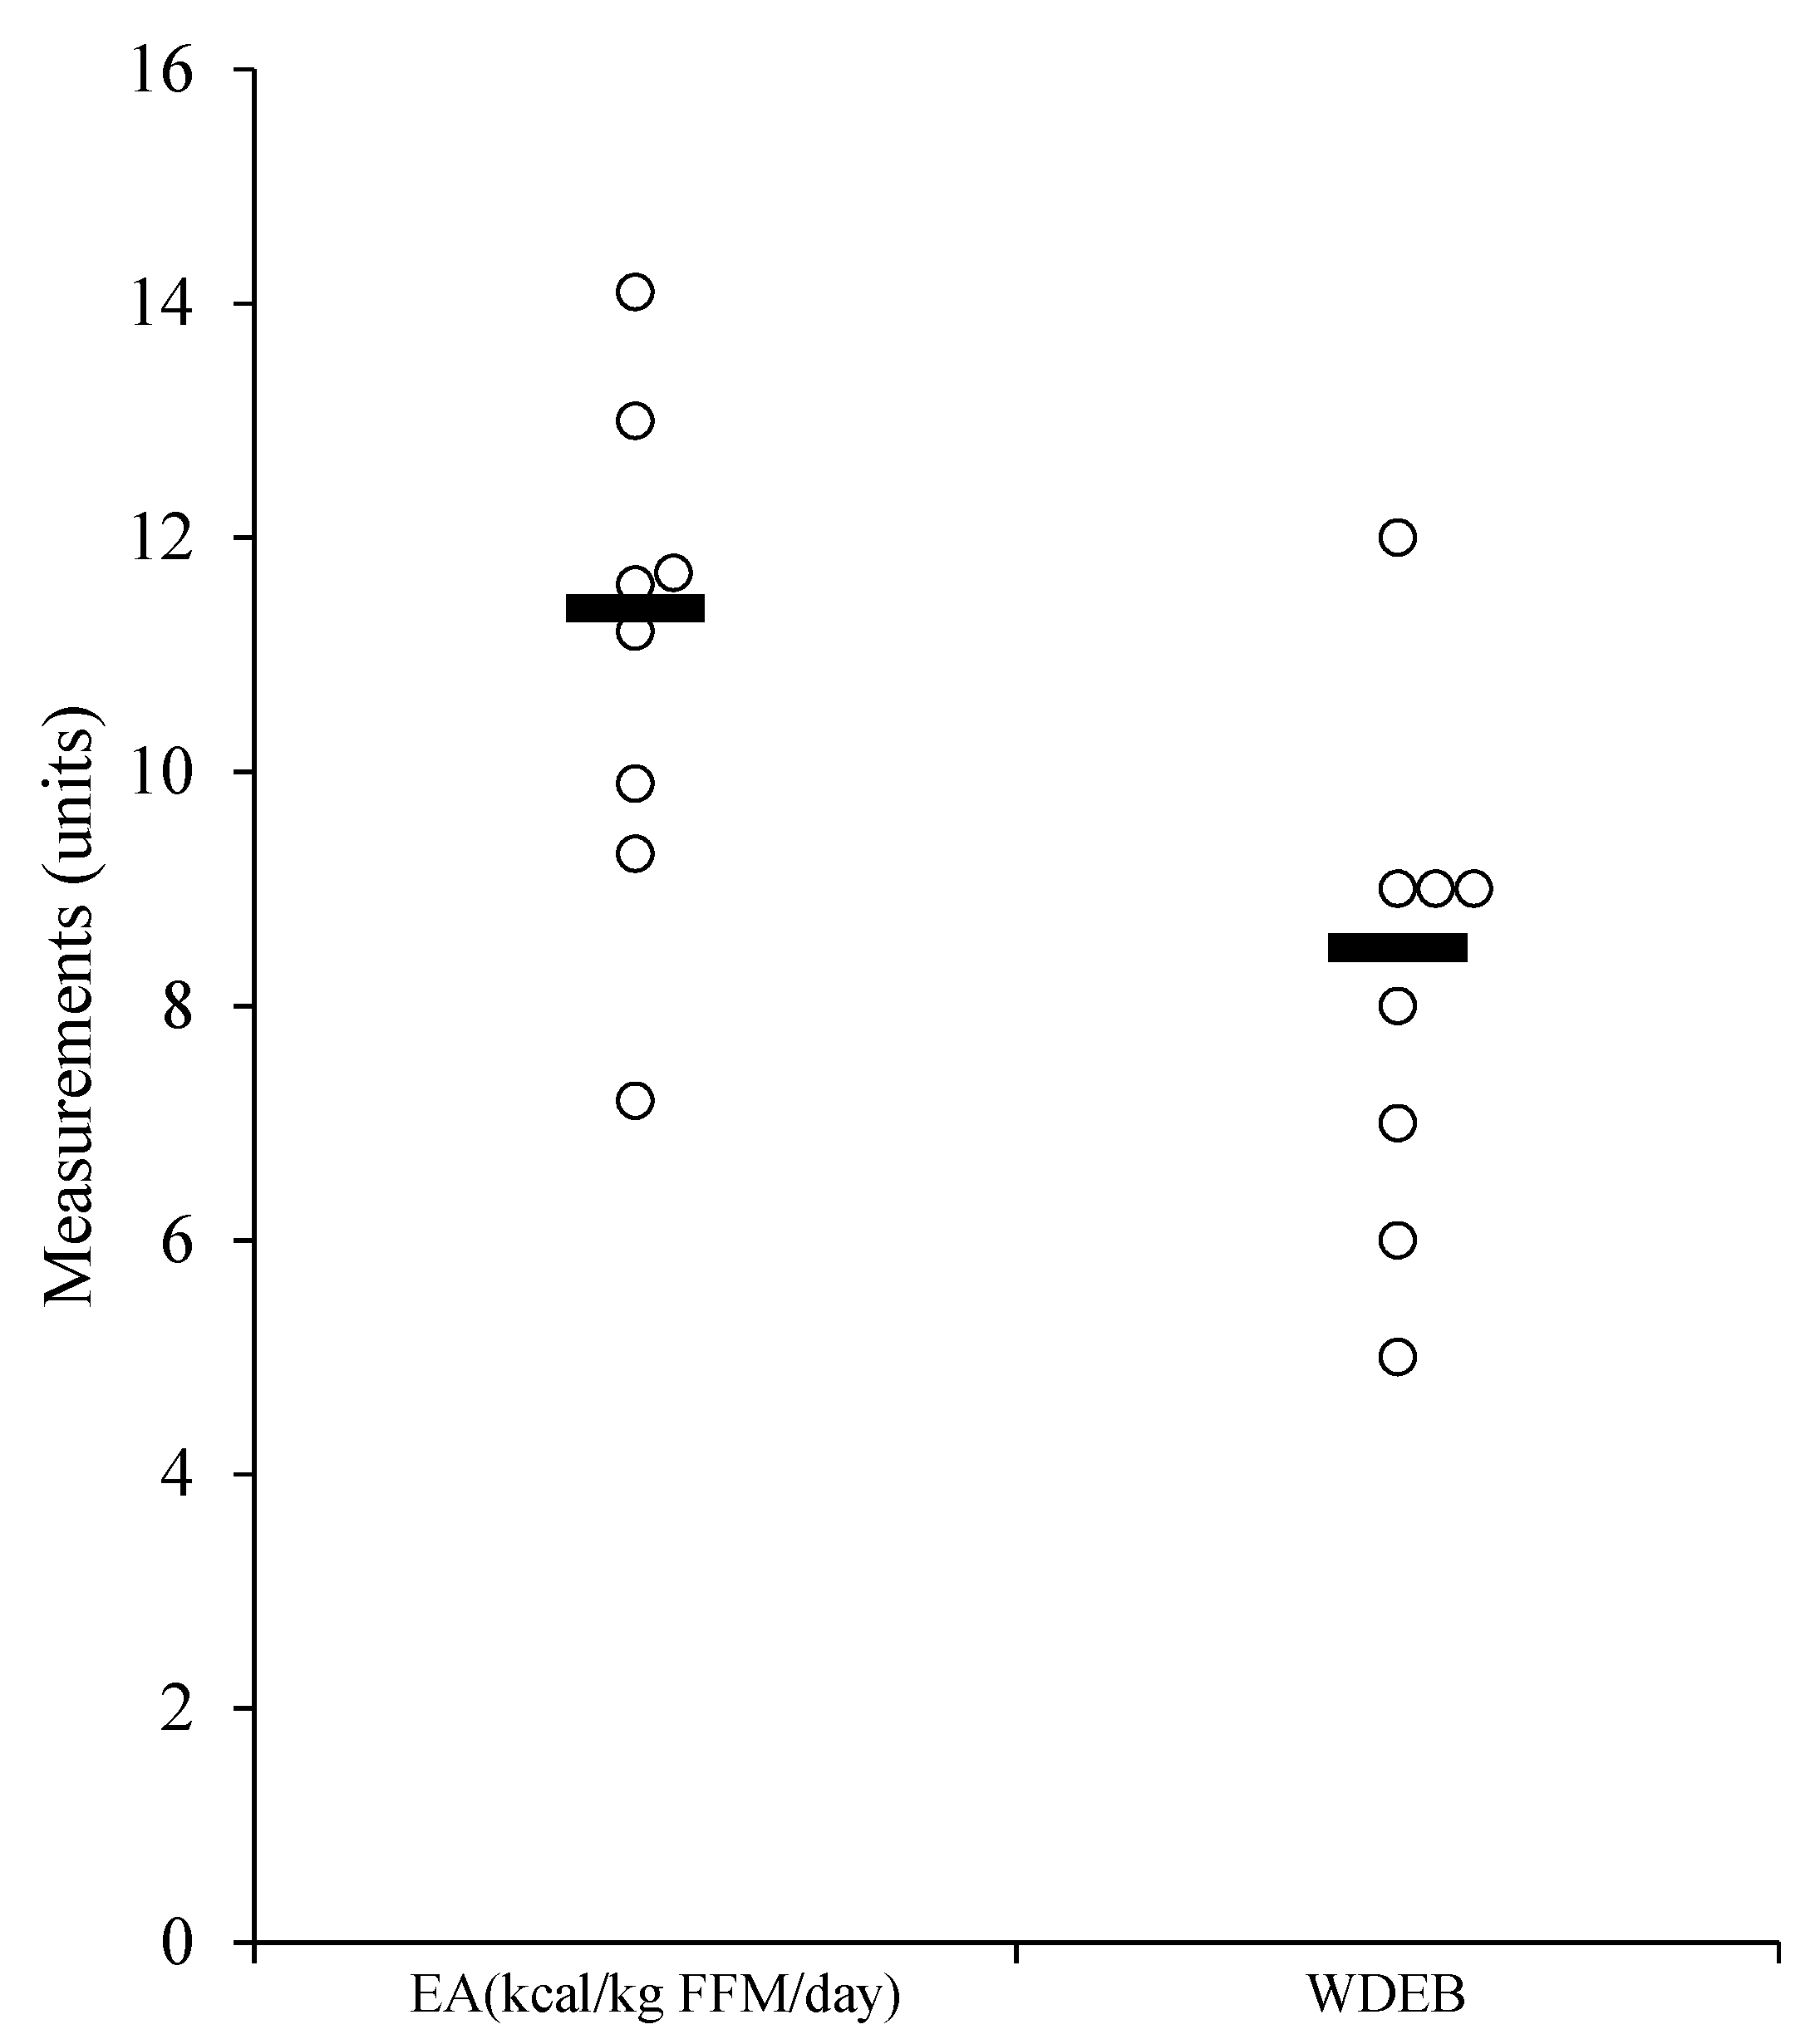
| EA (kcal/kg FFM/day) | 0.02 | 35.75 | 10.00 | 11.69 |
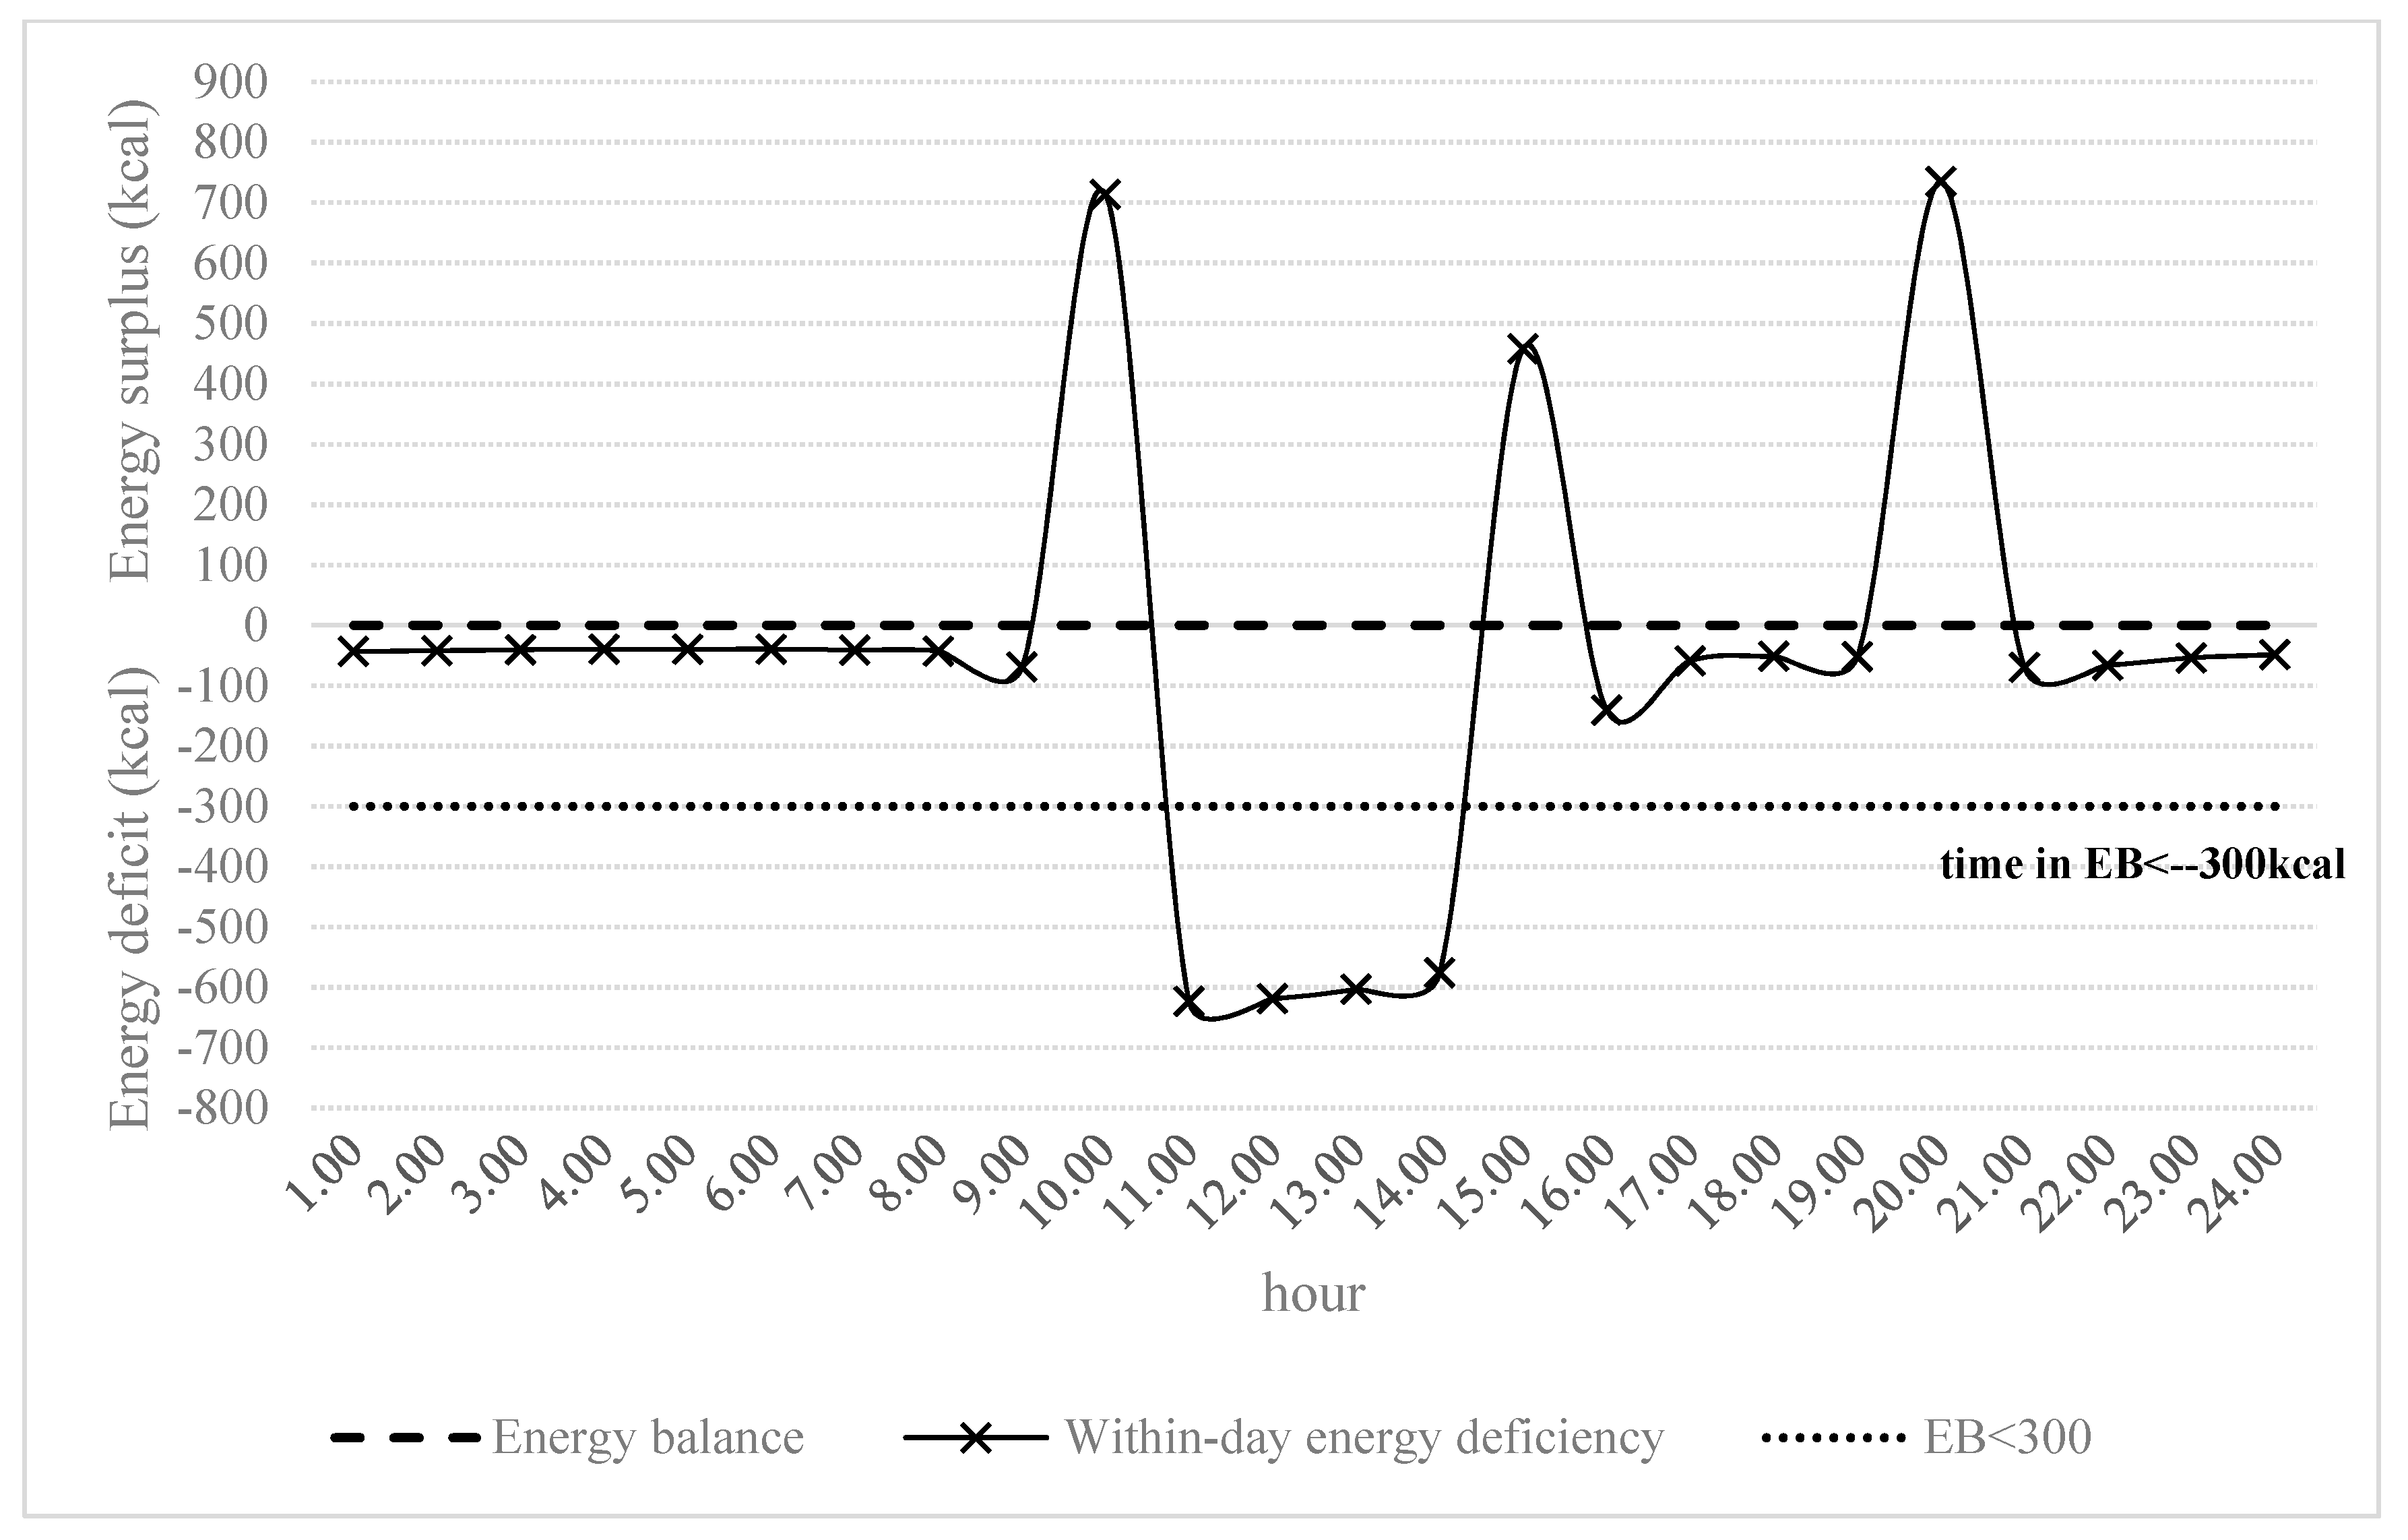
| WDEBneg (h) | 56.00 | 64.00 | 61.38 | 2.67 |
| WDEB−300 (h) | 5.00 | 12.00 | 8.13 | 2.17 |
| Minimum | Maximum | Mean | Std. Deviation | |
|---|---|---|---|---|
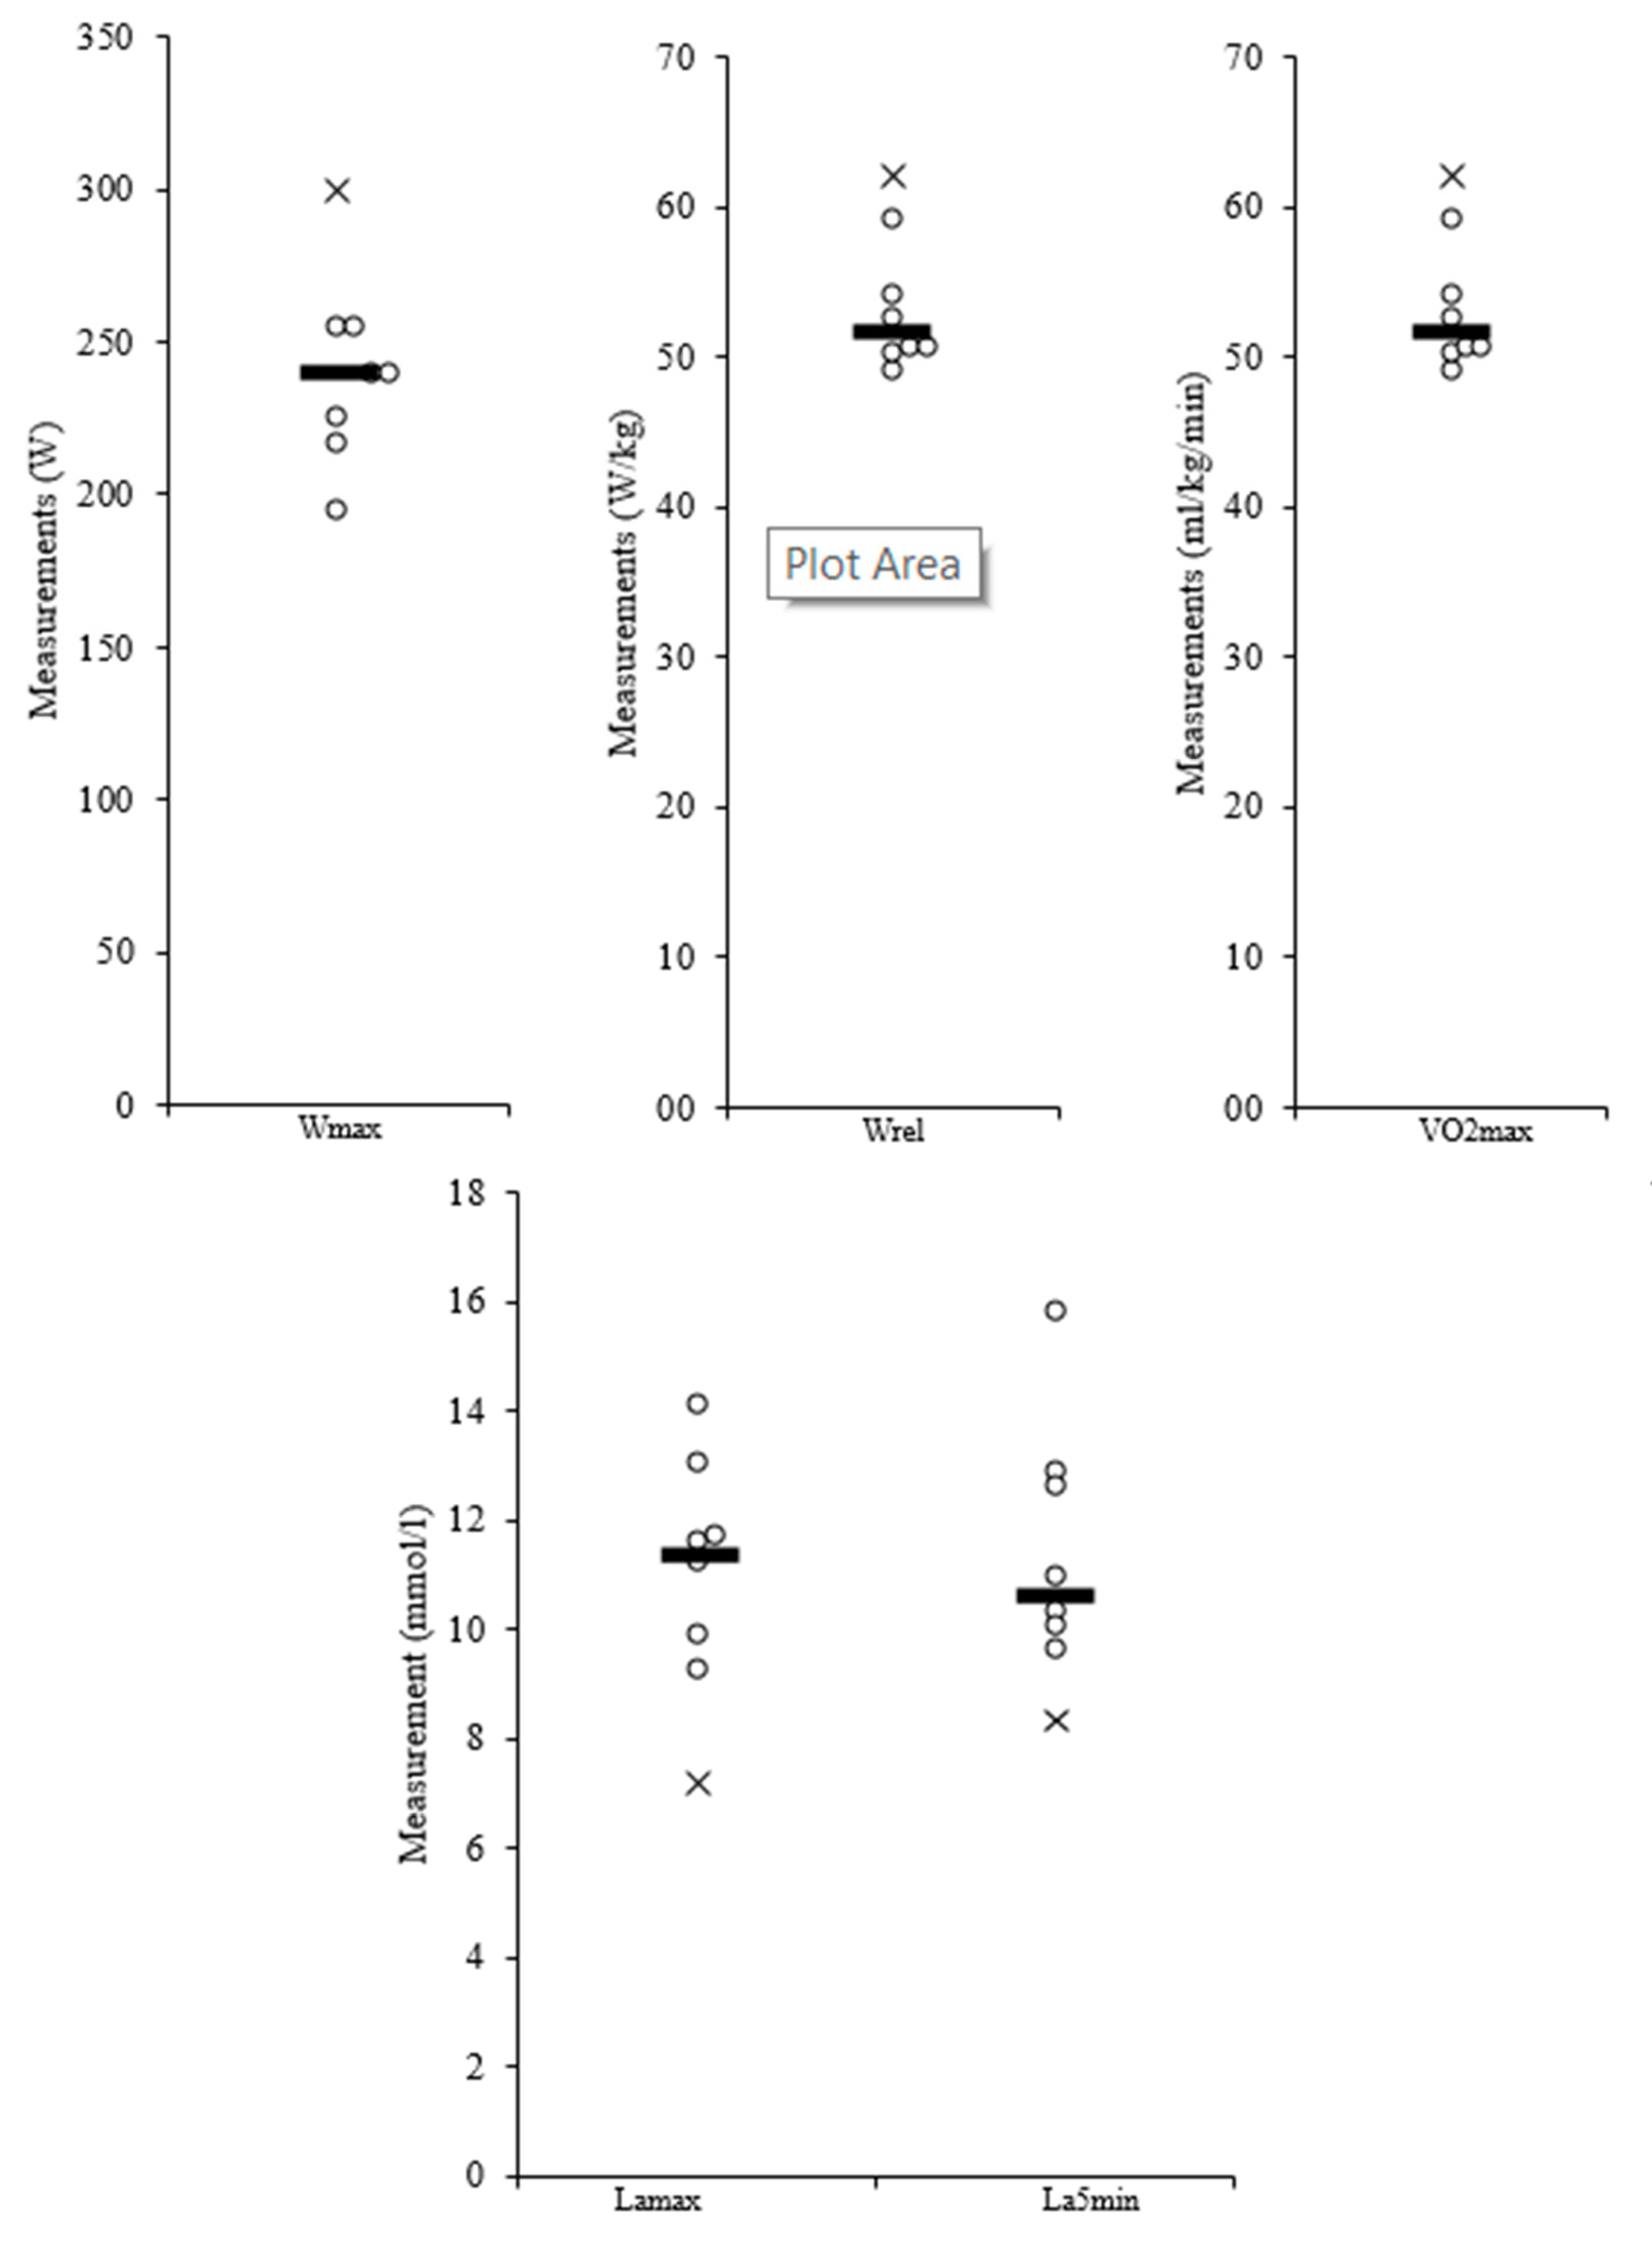
| Wmax (W) | 195.00 | 300.00 | 240.88 | 31.22 |
| Wrel (W/kg) | 3.73 | 5.68 | 4.44 | 0.70 |
| VO2max (mL/min/kg) | 49.20 | 62.10 | 53.61 | 4.66 |
| Lamax (mmol/L) | 7.19 | 14.10 | 11.00 | 2.18 |
| La5min (mmol/L) | 8.34 | 15.80 | 11.33 | 2.35 |
Publisher’s Note: MDPI stays neutral with regard to jurisdictional claims in published maps and institutional affiliations. |
© 2020 by the authors. Licensee MDPI, Basel, Switzerland. This article is an open access article distributed under the terms and conditions of the Creative Commons Attribution (CC BY) license (http://creativecommons.org/licenses/by/4.0/).
Share and Cite
Jurov, I.; Hadžić, V.; Rauter, S. Markers of Energy Metabolism Affect Lactate Metabolism and Aerobic Performance in Competitive Female Cyclists. Appl. Sci. 2020, 10, 7563. https://doi.org/10.3390/app10217563
Jurov I, Hadžić V, Rauter S. Markers of Energy Metabolism Affect Lactate Metabolism and Aerobic Performance in Competitive Female Cyclists. Applied Sciences. 2020; 10(21):7563. https://doi.org/10.3390/app10217563
Chicago/Turabian StyleJurov, Iva, Vedran Hadžić, and Samo Rauter. 2020. "Markers of Energy Metabolism Affect Lactate Metabolism and Aerobic Performance in Competitive Female Cyclists" Applied Sciences 10, no. 21: 7563. https://doi.org/10.3390/app10217563
APA StyleJurov, I., Hadžić, V., & Rauter, S. (2020). Markers of Energy Metabolism Affect Lactate Metabolism and Aerobic Performance in Competitive Female Cyclists. Applied Sciences, 10(21), 7563. https://doi.org/10.3390/app10217563