Article

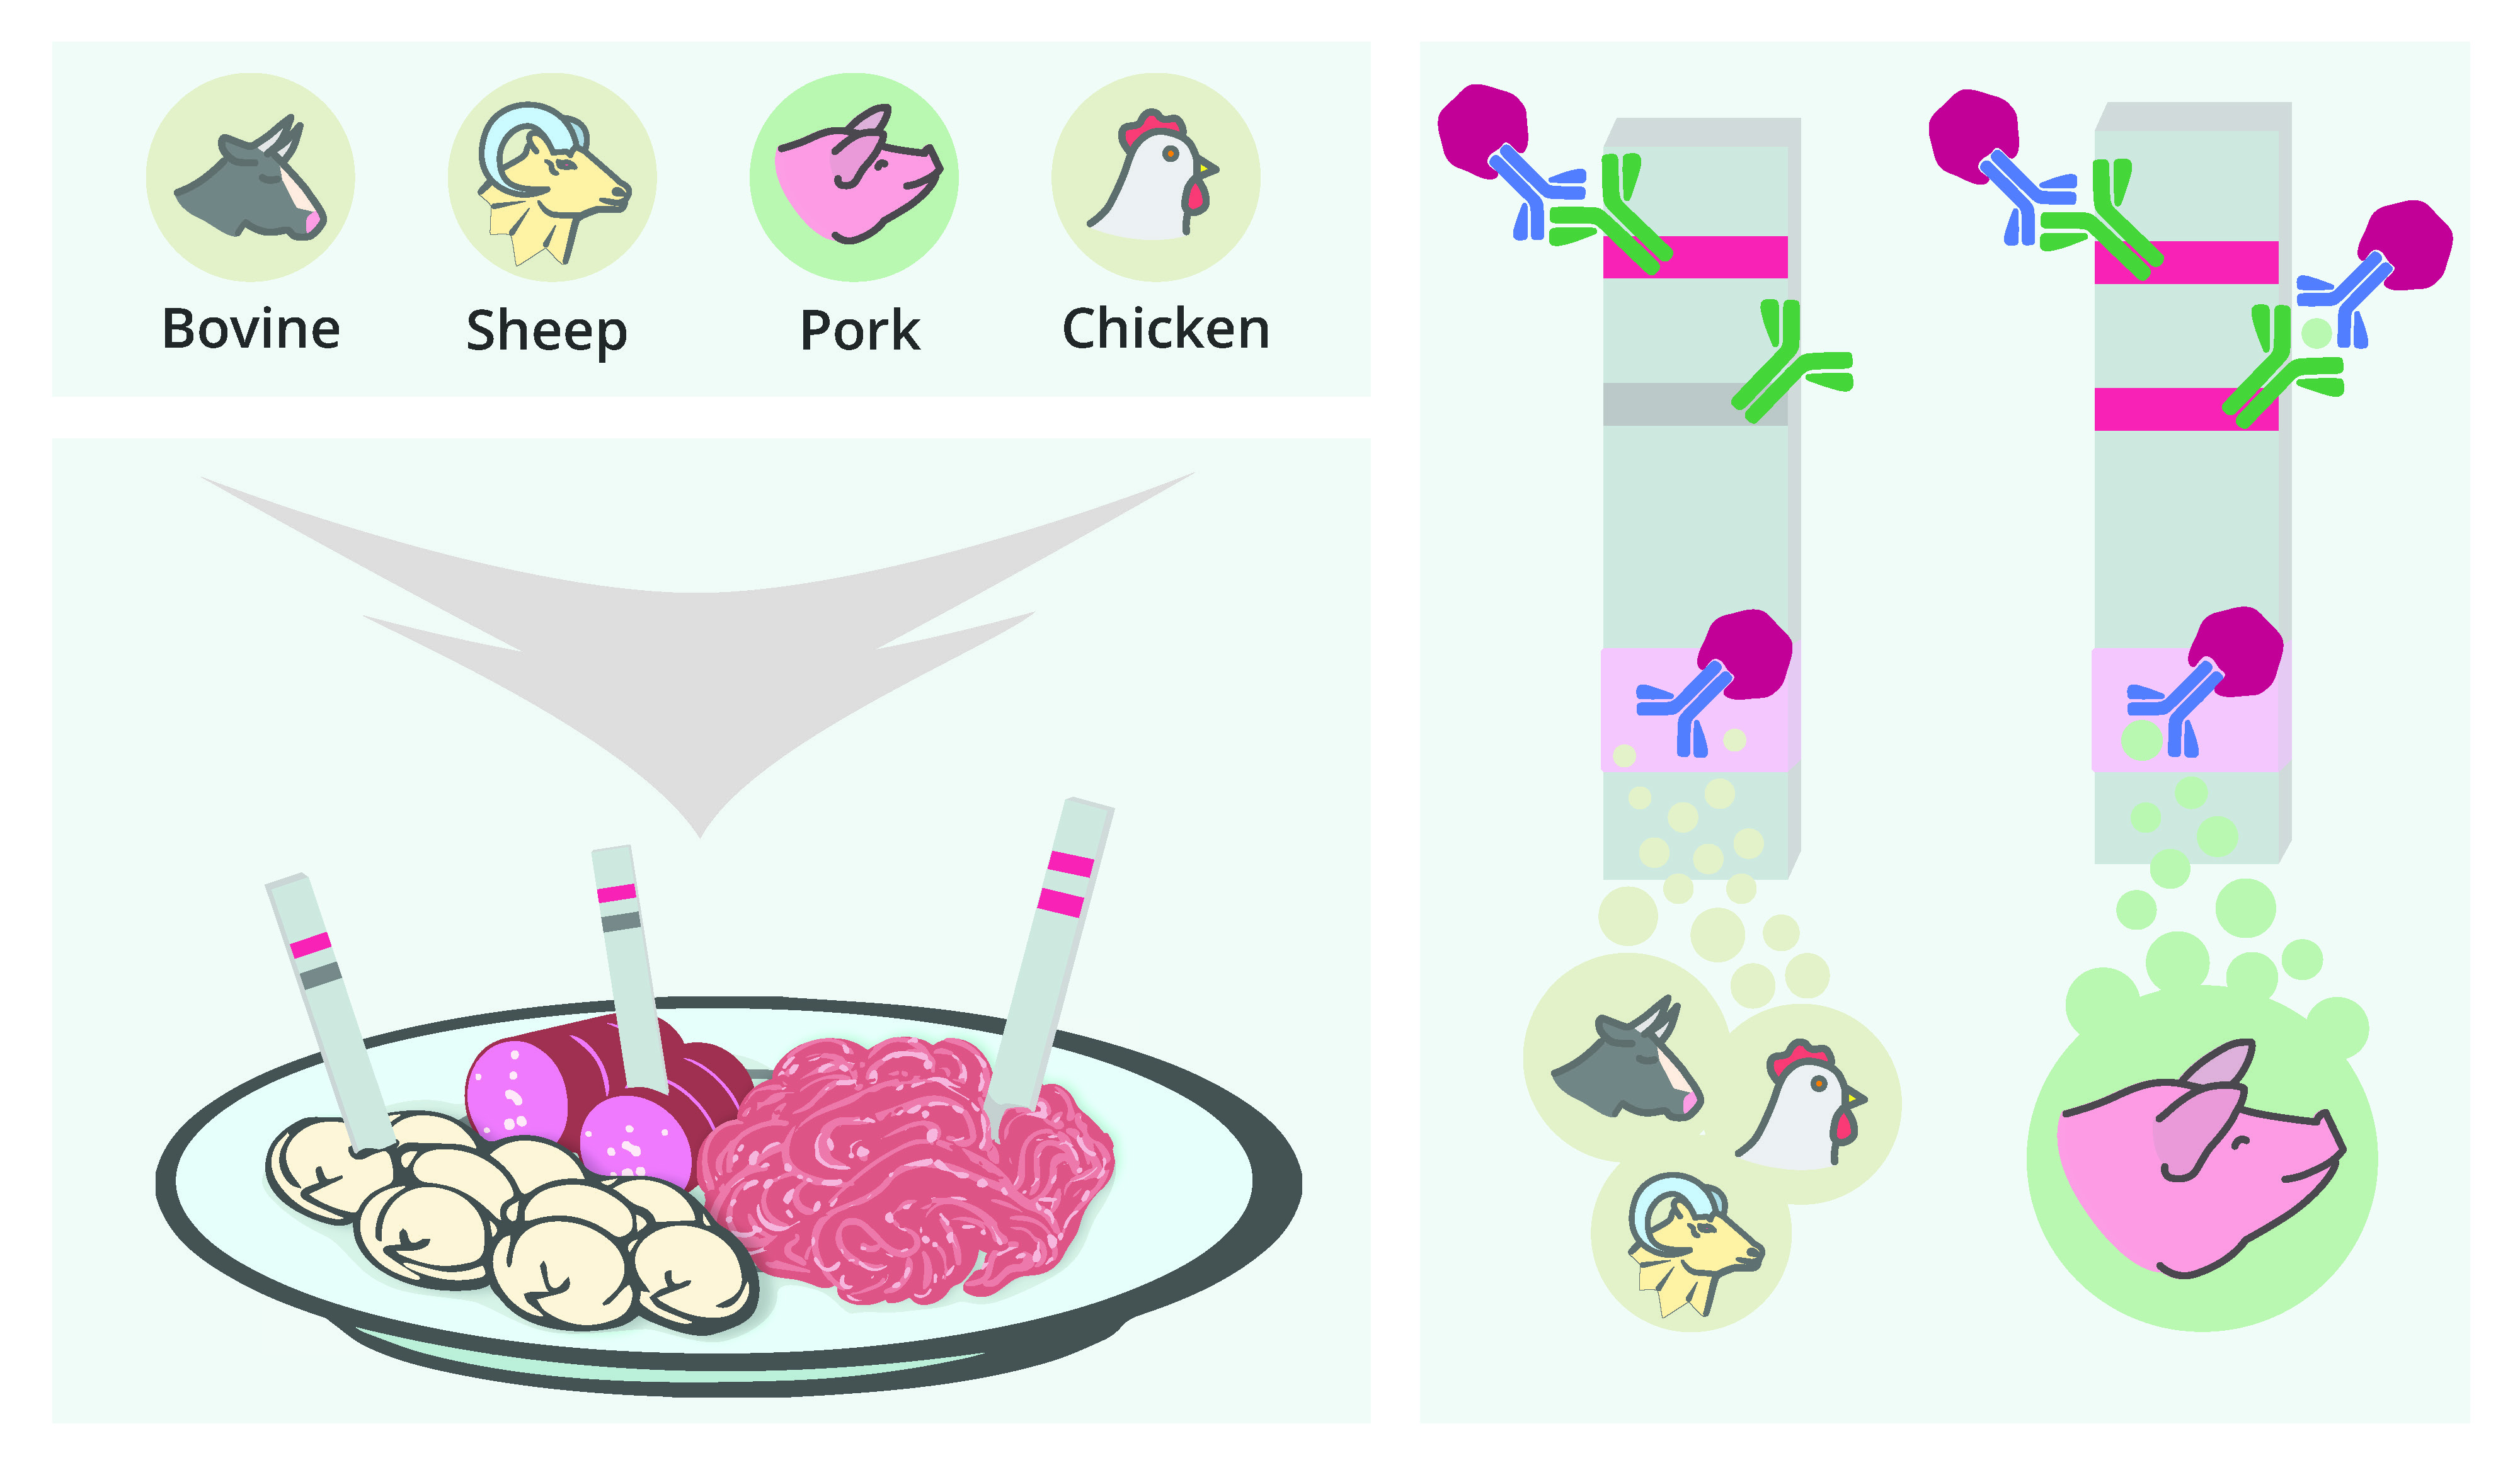
Immunochromatographic Detection of Myoglobin as a Specific Biomarker of Porcine Muscle Tissues in Meat Products

by
Elena A. Zvereva
,
Nadezhda A. Byzova
,
Olga D. Hendrickson
,
Demid S. Popravko
,
Ksenia A. Belichenko
,
Boris B. Dzantiev
and
Anatoly V. Zherdev
*
A.N. Bach Institute of Biochemistry, Research Center of Biotechnology of the Russian Academy of Sciences, Russian Academy of Sciences, Leninsky Prospect 33, 119071 Moscow, Russia
*
Author to whom correspondence should be addressed.
Appl. Sci. 2020, 10(21), 7437; https://doi.org/10.3390/app10217437
Submission received: 8 October 2020 / Revised: 13 October 2020 / Accepted: 21 October 2020 / Published: 23 October 2020
(This article belongs to the Special Issue Analysis of Chemical Biomarkers and Contaminants in Food)

Abstract

:
An immunochromatographic detection of myoglobin (MG) as a specific marker of porcine muscle tissue has been developed. The method is based on the sandwich lateral flow immunoassay (LFIA) with gold nanoparticles (AuNPs) as a label. The developed test system determines MG with a detection limit of 5 ng mL−1 within 15 min. A specific determination of porcine MG and no cross-reactivity with MG from other tested mammals and bird species was demonstrated. The test system is able to detect pork additives, as low as 0.01% (w/w), in minced beef. A technique of MG extraction from muscle tissue has been proposed which allows for rapid and efficient MG extraction from meat samples (within 20 min). The developed test system can serve as an effective means of controlling the authenticity and quality of meat products.

Graphical Abstract

1. Introduction

The problem of quality and authenticity of food products has become extremely urgent in recent years, due to the expansion of technological capabilities of production, as well as an increase in counterfeiting of food, in particular meat products [1]. The presence of undeclared ingredients in food products can cause adverse effects on human health (e.g., allergic reactions and the risk of zoonotic diseases) and have serious ethical consequences (non-compliance with halal and kosher requirements). Pork is one of the most common type of meat consumed directly or in food products [2]. However, a segment of the population cannot eat pork-containing food products in accordance with strict religious commandments [3].
To control the presence of pork in food, effective analytical methods which enable rapid and accurate testing are needed. Manufacturing innovations and the improvement of processing technologies can prevent the identification of certain meat types in finished products using microstructural (histological) methods of analysis. Electrophoresis, various types of spectroscopy, and chromatography are usually used as confirmatory analytical methods and are implemented according to multistage protocols in esspecially equipped laboratories by qualified personnel [4,5,6,7].
Polymerase chain reaction assay and the enzyme-linked immunosorbent assay (ELISA) are the most widely used approaches for pork identification [8,9]. The main advantage of molecular genetic analysis methods is their high specificity. The stability of the DNA molecule allows for the differentiation of various animal species’ meat in foodstuffs that have passed all stages of technological processing. However, heat treatment reduces the DNA yield, which can distort the data regarding the amount of meat identified in the finished product [10]. For the quantitative determination of pork in meat products, Soares et al. used a calibration curve obtained from preliminary analysis of chicken meat containing 0.1–25% (w/w) pork [9]. It should be noted that the combination of membrane immunochromatography with molecular genetic analysis enabled the determination of pork, as low as 0.01%, in a meat mixture, which greatly simplified the process of testing. However, even in this case, a complex and time-consuming technique of sample preparation was required before analysis [11,12].
Immunochemical methods, in particular the ELISA and lateral flow immunoassay (LFIA), can be used for rapid detection in a large number of samples with high sensitivity and specificity. LFIA is based on the use of a multimembrane composite with preliminary immobilized specific reagents. The analytical procedure consists of immersing the test strip into the extract obtained from the food product and assessing the result after 10–20 min [13,14]. An important stage of the LFIA developed for assessing the quality of raw and cooked meat products is the selection of a molecular marker, which can be of a protein or peptide nature. To identify pork, troponin I [15], porcine serum albumin [16], and porcine immunoglobulins [17,18] were used as markers.
Myoglobin (MG) can be considered to be a relevant marker for the immunodetection of pork. This cytoplasmic hemoprotein has been expressed in skeletal muscles and cardiac myocytes and has demonstrated significant variability of amino acid sequences for different species [19,20]. Kotoura et al. used MG as a marker for the ELISA of beef content in meat products [21]. Chan et al. developed an immunochromatographic test system based on two clones of anti-MG antibodies with different specificities to detect the fresh, not heat-treated, meat of cetaceans [22]. The application of MG as a marker for pork and horsemeat detection by high-performance liquid chromatography has been described by Giaretta et al. [23] and Di Giuseppe et al. [24]. The obtained results confirm the efficiency of MG as a species marker for identifying the muscle tissue of different animal species. However, to our knowledge, the detection of MG for halal control using rapid immunoassay has not been described.
In this study, for the first time, an immunochromatographic test system for the rapid determination of pork in meat products using MG as a detectable biomarker was developed.

2. Materials and Methods

2.1. Chemicals

MG and monoclonal antibodies against MG (clones 4E2cc, 1B4, and 7C3) were purchased from HyTest Ltd. (Turku, Finland). Monoclonal antibodies against MG (clones MyoA6, MyoB1, MyoB12, MyoD4, MyoE4, MyoF5, MyoF7, MyoH9, and MyoH11) were obtained from the Russian Research Center of Molecular Diagnostics and Therapy (Moscow, Russia). Rabbit anti-mouse polyclonal antibodies (RAMI) were purchased from Imtek (Moscow, Russia). Streptavidin conjugated with horseradish peroxidase (STR–HRP), Triton X-100, Tween 20, 3,3′,5,5′-tetramethylbenzidine (TMB), ethylenediaminetetraacetic acid (EDTA), sodium citrate, dimethyl sulfoxide (DMSO), and glycerol were purchased from Sigma Chemicals (St. Louis, MO, USA). d-biotin-N-hydroxysuccinimide ester, N-hydroxysuccinimide (NHS), and 1-hydrochloride-ethyl-3-(3-dimethylaminopropyl) carbodiimide (EDC) were obtained from ICN Biomedicals (Irvine, CA, USA). All other chemicals (salts and solvents of analytical grade) were from Khimmed (Moscow, Russia). The ELISA was performed in transparent Costar 9018 96-well polystyrene microplates (Corning Costar, Tewksbury, MA, USA).

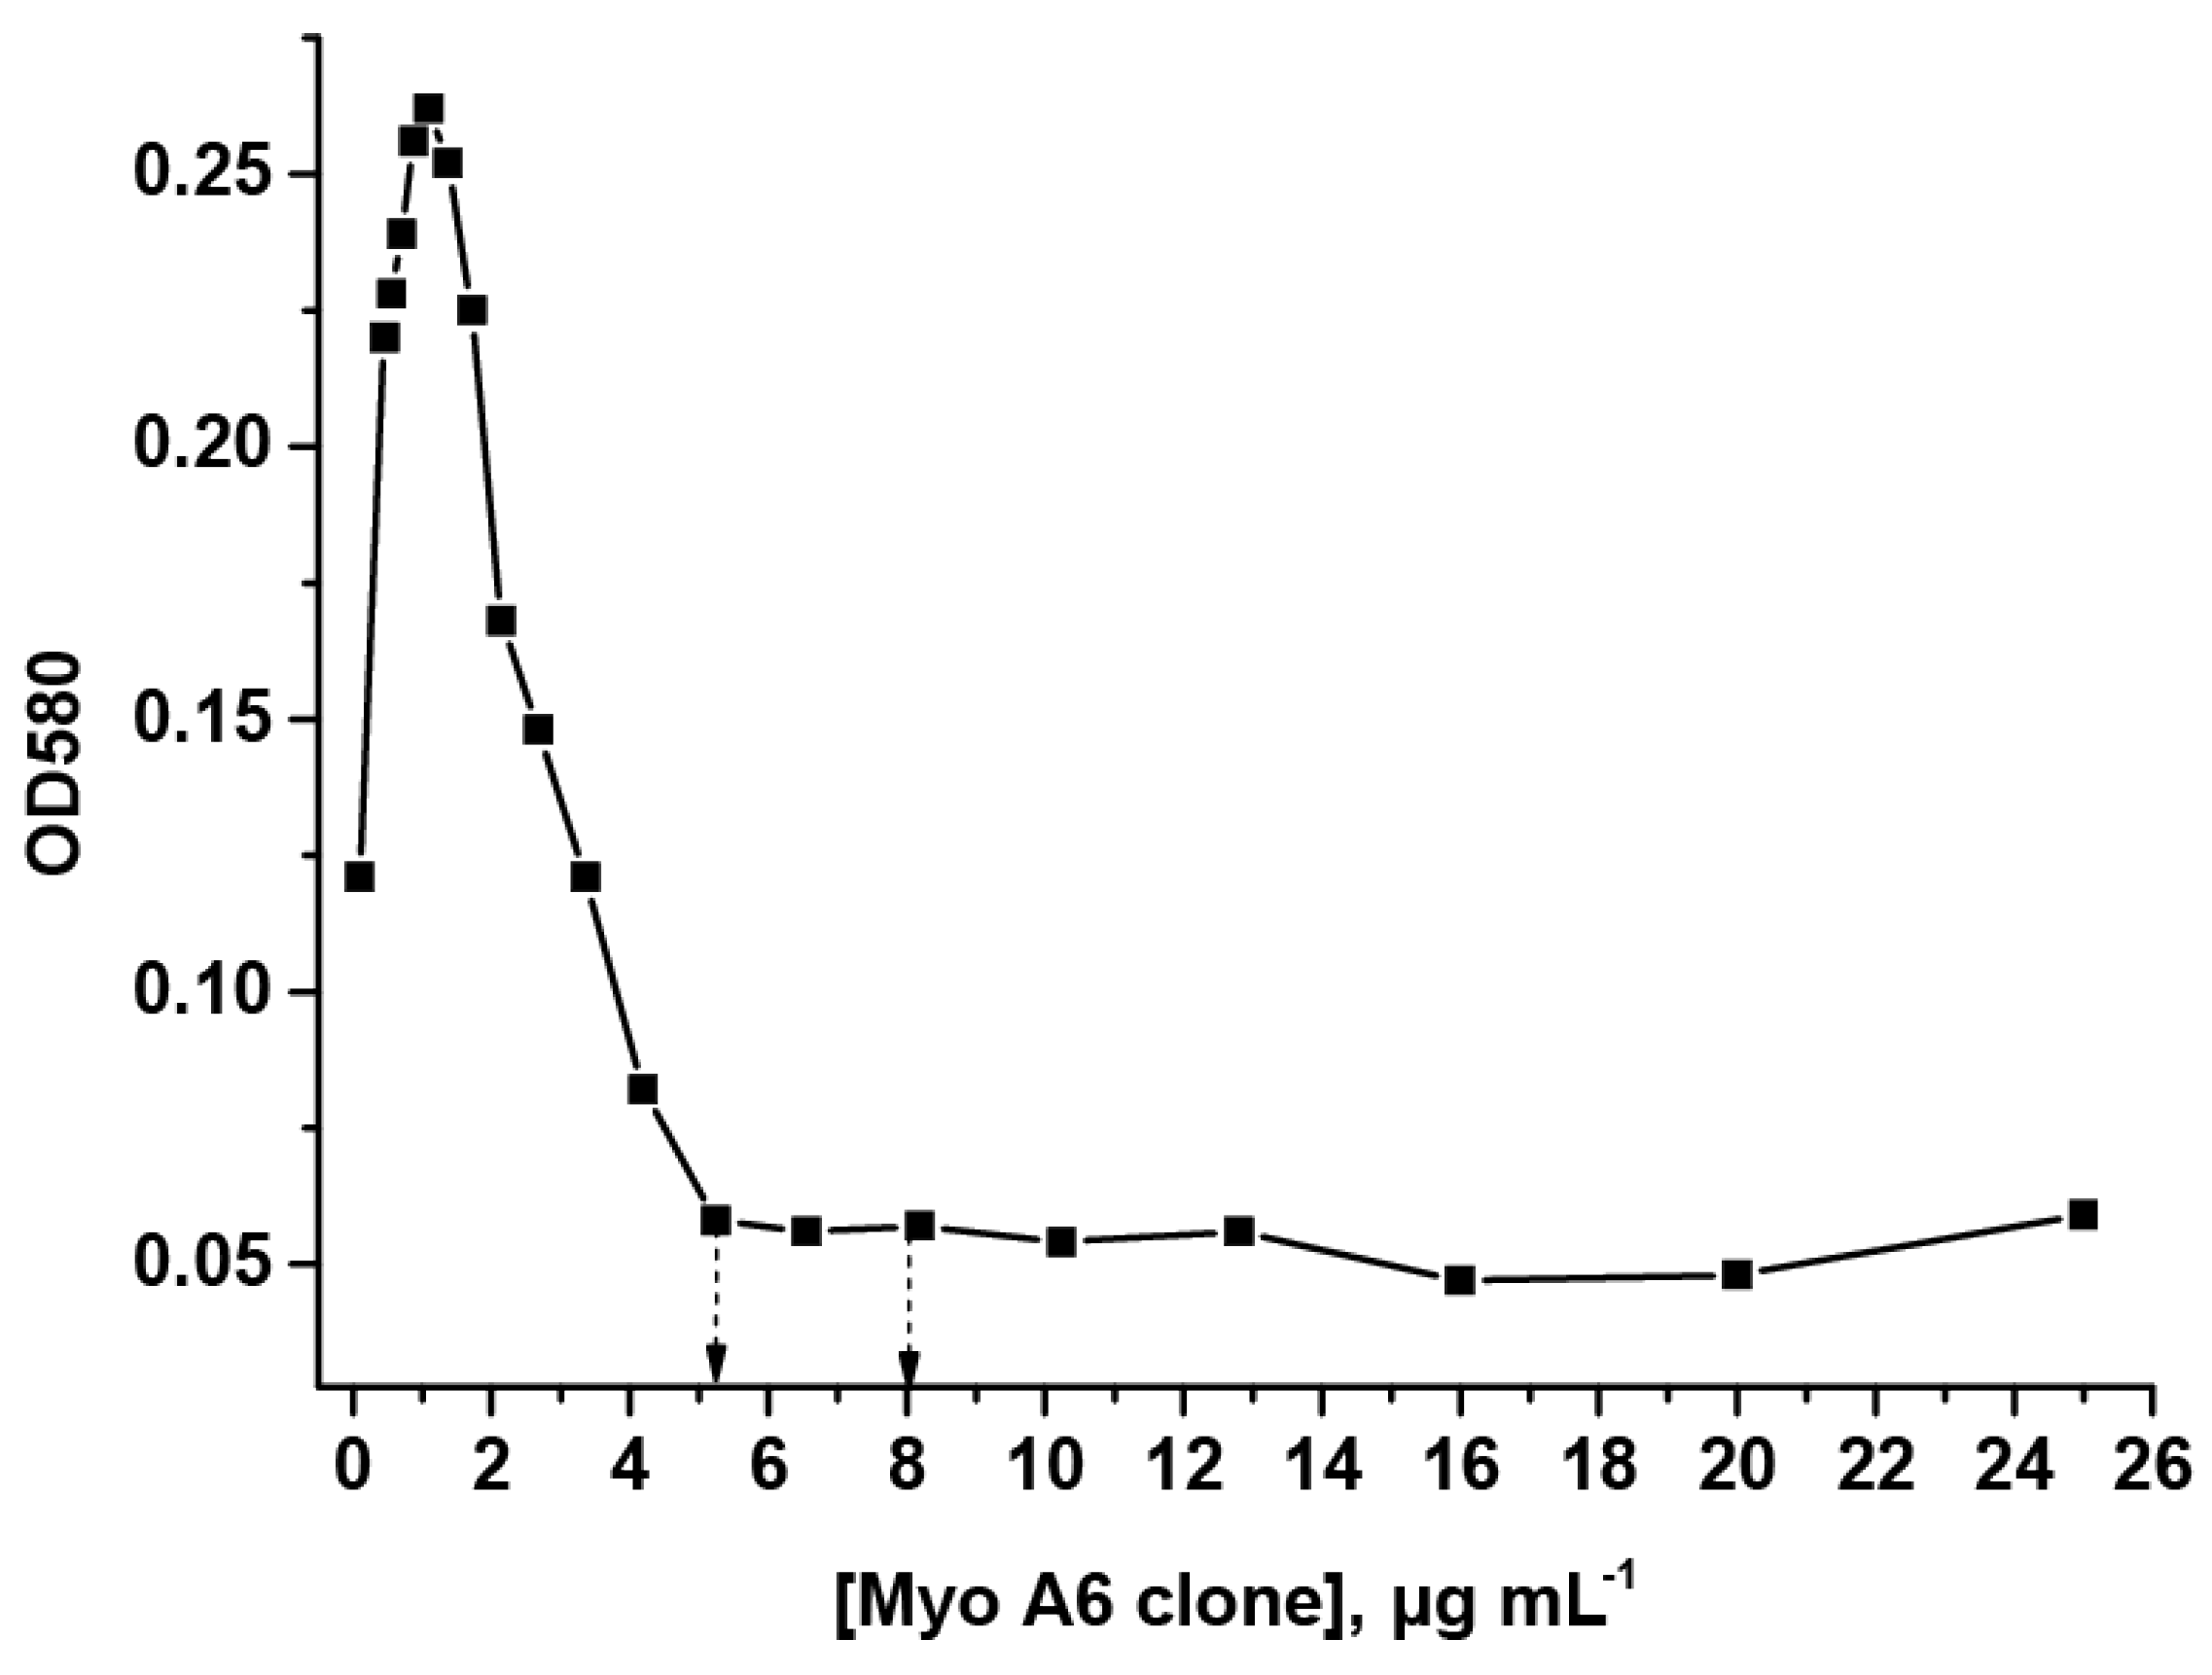
2.2. Determination of the Immune Interactions’ Constants

The equilibrium and kinetic constants of the interaction between MG and specific antibodies were measured using the Biacore X biosensor (Biacore AB, Uppsala, Sweden). The surface of the CM5 chip, modified with carboxymethylated dextran (Biacore AB, Uppsala, Sweden), was activated by passing a mixture of aqueous solutions of EDC and NHS at concentrations of 0.1 and 0.4 M, respectively. The immobilization of MG on the surface of the chip was carried out, according to the standard procedure [25]. For this purpose, an MG solution at a concentration of 70 μg mL−1 in 10 mM Na-citrate buffer, pH 5.0, was used. Then, the following reagents were sequentially passed through the cell: anti-MG antibodies at a concentration of 4–400 nM in a buffer containing 10 mM HEPES, 150 mM NaCl, 3 mM EDTA, and 0.005% Tween 20, pH 7.4 (HBS-EP); HBS-EP; and a regenerating reagent (100 mM glycine-HCl, pH 2.0). For each concentration of antibodies, the registration of immunochemical interactions was carried out in triplicate. For control measurements, the same protocol was used, with the exception of MG immobilization. An approximation of concentration dependences and a calculation of equilibrium and kinetic constants were performed using the BIA evaluation program “1:1 (Langmuir) binding” (Biacore AB, Uppsala, Sweden).

2.3. Biotinylation of Antibodies

Anti-MG monoclonal antibodies were dialyzed against a 50 mM phosphate buffer containing 0.1 M NaCl, pH 7.4 (PBS), by a centrifugation at 10,000× g for 15 min using centrifuge tubes with cellulose acetate filters (Corning Costar Spin-X, Merck Millipore, Burlington, MA, USA). The covalent binding of biotin to antibodies was carried out at a molar ratio of 10:1, in accordance with the technique described by Bayer and Wilchek [26]. For this, a solution of biotin-N-hydroxysuccinimide ether in DMSO (25 μL, 3.1 mg mL−1) was added to antibody solutions (0.5 mL, 6.8 mg mL−1). The reaction mixtures were incubated at room temperature for 2 h. Biotinylated antibodies were dialyzed against PBS, as described above.

2.4. Sandwich Enzyme Llinked Immunosorbent Assay (ELISA)

A solution (100 μL) of anti-MG monoclonal antibodies (2 μg mL−1) in PBS was immobilized in the microplate wells for 16 h, at 4 °C. Then, the microplate was washed four times with PBS with 0.05% Triton X-100 (PBST). After that, 100 μL of MG solutions (ranging in concentration from 5 μg mL−1 to 0.1 ng mL−1) in PBST was added to the wells and incubated for 1 h, at 37 °C. The plate was washed four times with PBST, and 100 µL of biotinylated antibodies (2 µg mL−1) was added to the wells and incubated for 1 h, at 37 °C. After washing, 100 µL of STR–HRP (diluted 1:5000 with PBST) was added to the wells and incubated for 1 h, at 37 °C. After the microplate was washed four times with PBST and one time with distilled water, the peroxidase activity was determined. For this purpose, 100 μL of 0.42 mM TMB solution in 0.1 M Na-citrate buffer, pH 4.0, with 1.8 mM H2O2, was added to the wells of the microplate and incubated for 15 min at room temperature. The reaction was stopped by the addition of 50 μL of 1 M H2SO4 per well. The optical density (OD) of the reaction product was measured at 450 nm with a Zenyth 3100 microplate photometer (Anthos Labtec Instruments, Wals, Austria).

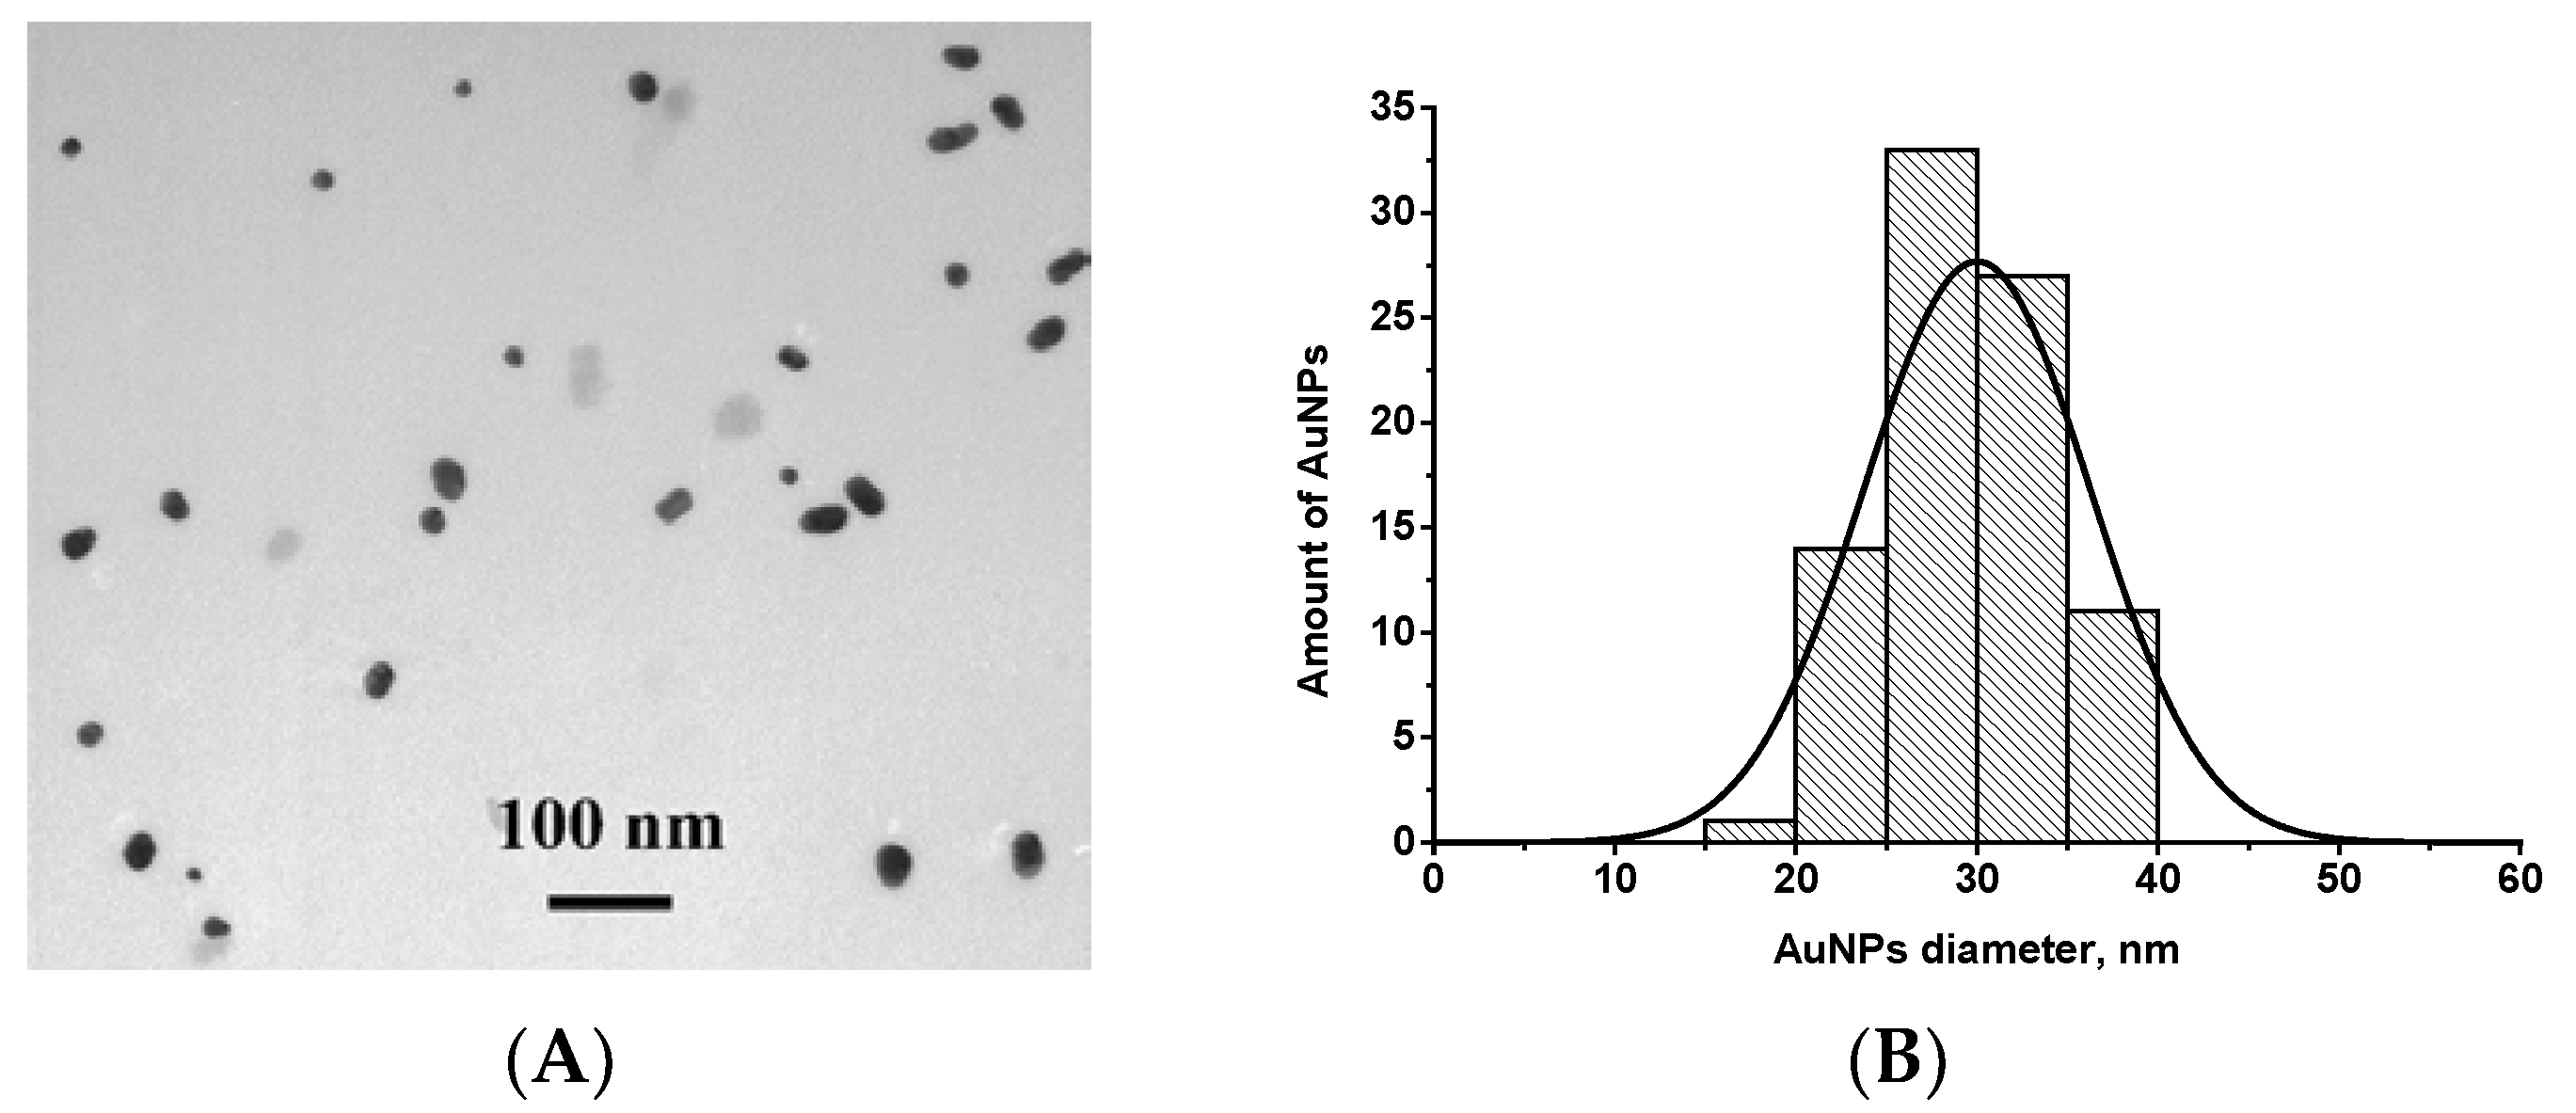
2.5. Synthesis and Characterization of Gold Nanoparticles (AuNPs)

Gold nanoparticles (AuNPs) were prepared, as described by Frens [27]. Briefly, 0.5 mL of a 1% solution of chloroauric acid was added to 48.75 mL of deionized water and brought to a boil. After that, 0.75 mL of 1% sodium citrate solution was added while stirring. The mixture was boiled for 25 min, and then cooled. The obtained AuNPs were stored at 4 °C.
Transmission electron microscopy (TEM) was applied to analyze the dimensional characteristics of nanoparticles. The prepared AuNPs were dropped onto Formvar film-coated grids (300 mesh) and analyzed on a JEM-100C microscope (JEOL, Tokyo, Japan). Microphotographs were obtained at a voltage of 80 kV and 66,000–100,000 zoom. The Image Tool 3.0 program (University of Texas Health Science Center, San Antonio, TX, USA) was used to analyze digital images.

2.6. Immobilization of Antibodies on AuNPs

The preparation of antibody AuNP conjugates was carried, out as described by [28]. Before conjugation, antibodies were dialyzed against 10 mM Tris-HCl buffer, pH 8.5, for 2 h, at 4 °C. The pH of the AuNP solution was adjusted to 8.5–9.0 with 0.2 M K2CO3, and then the antibodies were added with a concentration of 20 μg mL−1 for 4E2cc and 7C3 clones; 10 μg mL−1 for 1B4 clone; and 8 μg mL−1 for MyoA6, MyoD4, MyoE4, MyoF5, and MyoH9 clones.
The resultant mixtures were stirred for 45 min at room temperature, followed by the addition of BSA to a final concentration of 0.25%. Antibody AuNPs conjugates were separated from unreacted antibodies by centrifugation at 13,400× g for 15 min, at 4 °C. After the removal of the supernatant, the residues were resuspended in a 10 mM Tris buffer containing 1% BSA, 1% sucrose, and 0.05% sodium azide, pH 8.5 (TBSA), and stored at 4 °C.

2.7. Production of Immunochromatographic Tests

A CNPC-SS12 working membrane with a 15 µm pore size, a GFB-R4 sample membrane, an AP045 adsorption membrane, and a PT-R7 fiberglass membrane (Advanced Microdevices, Ambala Cantt, India) were used to compose test strips. The test zone of the working membrane was formed by anti-MG antibodies (2.0 mg mL−1 in PBS), and the control zone was formed by RAMI (0.5 mg mL−1 in PBS). Reagents were applied onto membranes with an Iso-Flow automatic dispenser (Imagene Technology, Hanover, NH, USA) at a rate of 0.1 µL per mm of the membrane. Antibody AuNPs conjugates were manually applied onto a fiberglass membrane in a dilution corresponding to OD520 = 8.0 in TBSA containing 0.05% Tween 20. The loading of antibody-AuNPs conjugates was 16 µL per 1 cm of the membrane. All membranes with the immobilized reagents were dried at room temperature for at least 20 h, and then fixed on a plastic pad.

2.8. Sample Preparation Before the Lateral Flow Immunoassay (LFIA)

Samples of raw meat, including beef, pork, lamb, and poultry (chicken and turkey), as well as assorted meat-based dumplings, were purchased at local supermarkets. Beef and pork-based cooked sausages with a confirmed composition were produced at the factory for manufacturing of meat products at the Gorbatov Federal Research Center for Food Systems of the Russian Academy of Sciences. All raw and cooked meat products were minced. A number of raw meat mixtures were obtained from minced raw meat, namely, beef containing 10, 1, 0.1, and 0.01% (w/w) pork. The extraction was carried out using the following techniques:
  • A total of 100 mg of raw or cooked minced meat is vigorously mixed with 2 mL of PBS, containing 0.1% Triton X-100, and 0.5 M KCl (an extraction buffer), for 10 min. The mixtures are centrifuged for 5 min at 5000× g at room temperature. The obtained supernatants are incubated for 3 min at 100 °C. Then, the samples are centrifuged for 5 min at 7000× g, and supernatants are used for the LFIA [29].
  • A total of 250 mg of raw or cooked minced meat is vigorously mixed with 5 mL of the extraction buffer for 30 min, and then sonicates in an ultrasound bath for 30 min. Mixtures are centrifuged for 10 min at 5000× g, and the obtained supernatants are used for the LFIA.
  • A total of 150 mg of raw or cooked minced meat is vigorously mixed with 5 mL of PBST for 15 min. The obtained mixtures are used for the LFIA.
  • A total of 150 mg of raw or cooked minced meat is vigorously mixed with 5 mL of PBST for 15 min. Mixtures are centrifuged for 5 min at 5000× g, and the obtained supernatants are used for the LFIA.

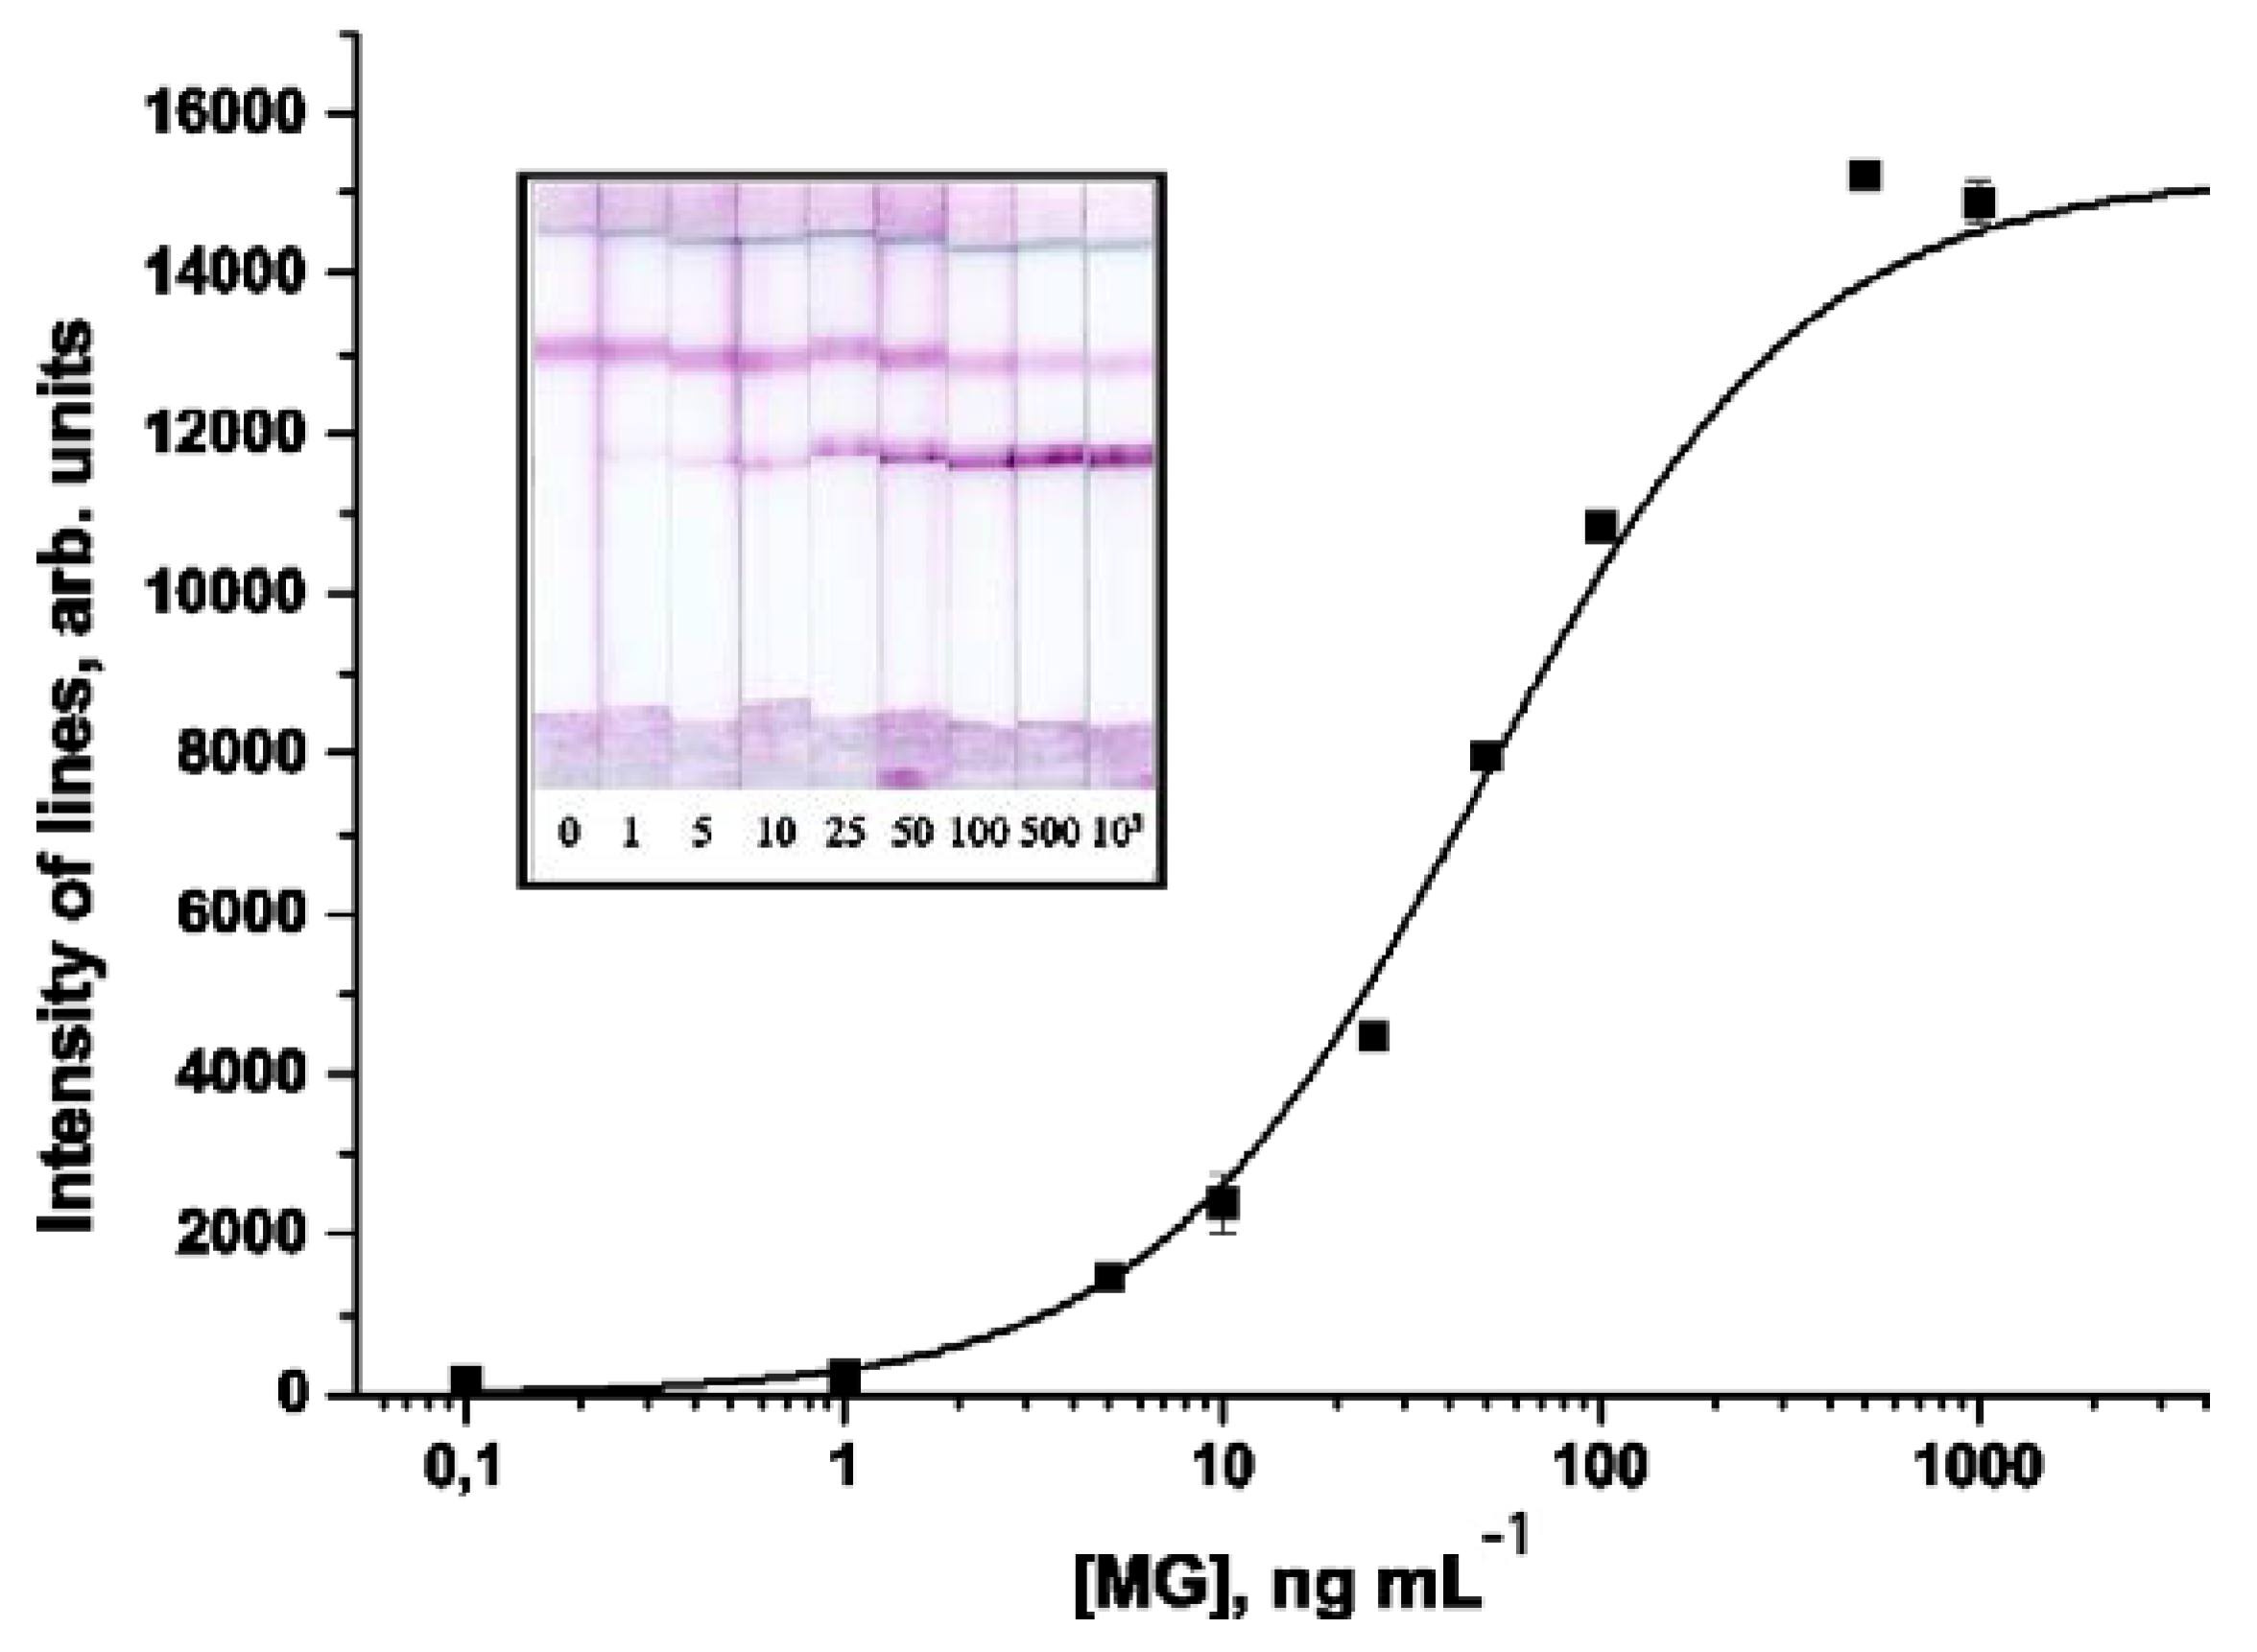
2.9. LFIA of Myoglobin (MG)

Solutions of MG in PBST (a total volume of 100 μL), in concentration ranges of 1000–1 ng mL−1, were added to microplate wells. Test strips were immersed in the solutions and incubated for 15 min at room temperature. For determination of MG in raw and cooked meat, the corresponding extracts were added to microplate wells. All the measurements were performed in triplicate for statistical processing. The resultant strips were scanned using a flatbed scanner (CanoScan LiDE 90, Canon, Tokyo, Japan) with a resolution of 600 dpi without applying modes for contrast or color correction. The TotalLab software package (TotalLab, Newcastle upon Tyne, UK, totallab.com) was used to process test strip images.
Linear approximations of the dependence of bands’ color intensity on MG concentrations were constructed. The cutoff value (detection limit) of the LFIA was interpreted as the minimum MG concentration causing a reliable coloration in the test zone.

3. Results and Discussion

3.1. Characterization of Monoclonal Antibodies by the ELISA

The quantitative characterization of the interaction of MG with specific antibodies was carried out using a flow-through biosensor system, Biacore X, based on the registration of a surface plasmon resonance. Kinetic curves of association and dissociation processes of binary antibody–MG complexes at different concentrations of antibodies were obtained. On the basis of the experimental data, the corresponding kinetic (ka, kd) and equilibrium (KA, KD) constants of association and dissociation of antibody–MG complexes were calculated (Table 1).
It was demonstrated that the 1B4, 4E2cc, MyoD4, and MyoF5 clones of antibodies possessed the highest affinity (KD values varied in the range 2.9–6.2 × 10⁻¹⁰ M). The 7C3, MyoA6, MyoE4, MyoF7, MyoH9, and MyoH11 clones were characterized by an average affinity level (KD values varied in the range 1.8–9.6 × 10⁻⁹ M). The MyoB1, MyoB12 clones had the lowest affinity properties (KD were 9.6 × 10⁻⁸ M and 1.8 × 10⁻⁷ M, respectively).
For both the ELISA and LFIA, a sandwich assay format was used, which was suitable for assessing the preservation of the protein native structure and commonly used for the detection of antigens having at least two epitopes on their surface [30]. To perform the ELISA, conjugates of monoclonal antibodies with biotin were synthesized, in accordance with the method described in Section 2.3. For all 12 antibody–biotin conjugates obtained, a reliable binding with MG immobilized in the wells of the microplate at a concentration of 2 μg mL−1 was confirmed, and therefore they were further used in the ELISA. Testing of the immune properties of antibodies and their conjugates with biotin in the ELISA allowed for assessment of the ability to form triple antibody—MG—biotinylated antibody complexes, which was important for further development of the LFIA. On the basis of the results of this testing, combinations that did not lead to a reliable binding in the ELISA or provided it only at extremely high (>100 ng mL−1) MG concentrations, were excluded. After this exclusion, only eight combinations were selected for further studies. The analytical parameters of the ELISA using these reagents are summarized in Table 2.
The probable reason for the absence or low intensity of the analytical signal for the remaining combinations is the coincidence or close location of epitopes on the surface of the MG molecule, which prevented the formation of a detectable antibody–antigen–antibody complex on the surface of the carrier. In addition, it should be noted that although antibodies selected for the formation of triple complexes were characterized by relatively high association constants (see Table 1), there was no strong correlation between their affinity and analytical characteristics of the ELISA. Because the experimental conditions (duration of steps and sequence of reagents’ addition) were different during measurements of binding constants, the ELISA and LFIA, the combination that provided the maximum sensitivity in the ELISA (7C3/4E2cc–biotin), was not considered to be a priori optimal for this analysis. Hence, a comparative study was carried out for all eight combinations of antibodies indicated in Table 2. According to the study of Lo et al., the MG content in pork is approximately 2 mg g−1 [31]. Therefore, the ELISA characteristics of the selected pairs of antibodies indicate their suitability for the development of the LFIA with the, practically, demanded sensitivity.

3.2. Obtaining and Characterization of Specific Reagents for the LFIA

AuNPs were prepared by the reduction of chloroauric acid with sodium citrate, as described by Frens [27]. Characterization of AuNPs using TEM showed that the average diameter of spherical non-aggregated particles was 29.9 ± 7.2 nm (in total, 55 nanoparticles were analyzed, the minimum and the maximum diameters were 19.2 and 40.3 nm, respectively) and confirmed their suitability for the LFIA [32]. An image of AuNPs is presented in Figure 1A.
Clones 4E2cc, 7C3, 1B4, MyoA6, MyoD4, MyoE4, MyoF5, and MyoH9 of monoclonal antibodies that were selected according to the results of the ELISA were conjugated to AuNPs. The selection of conjugation conditions was carried out on the basis of photometric data reflecting AuNPs’ aggregation after the addition of 10% sodium chloride. As an example, the flocculation curve for the MyoA6 clone of antibodies is demonstrated in Figure 2.
The obtained concentration dependences are characterized by an initial increase in OD, followed by a decline, and reached a plateau at a concentration of antibodies sufficient for a complete monolayer coating of a particle with antibodies (flocculation point). As recommended by Hermanson [33], the concentrations of antibodies were 10–20% higher than those corresponding to flocculation points, and therefore the surface of AuNPs were stabilized with the protein and the formation of aggregates was prevented. Therefore, for conjugation, 4E2cc and 7C3 clones of antibodies were used at a concentration of 20 μg mL−1; clone 1B4 of antibodies was used at a concentration of 10 μg mL−1; and MyoA6, MyoD4, MyoE4, MyoF5, and MyoH9 clones of antibodies were used at a concentration of 8 μg mL−1. The excess of unreacted antibodies was removed during the precipitation of the conjugates.

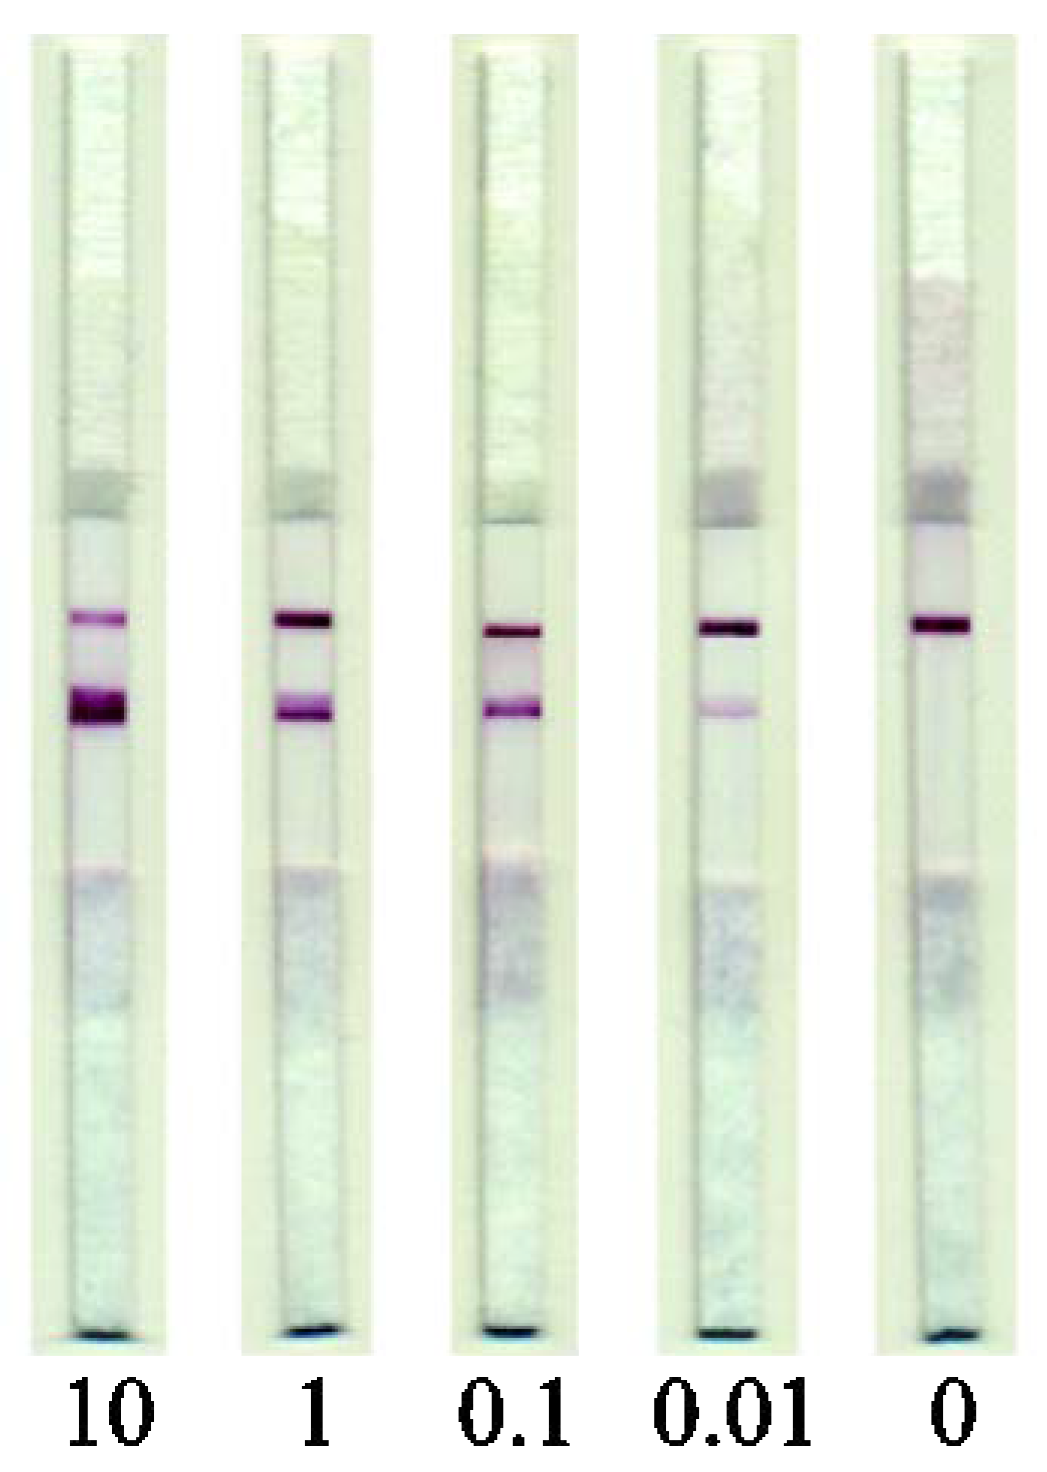
3.3. Development of the LFIA of MG

As working, sample, and adsorption membranes, a nitrocellulose CNPC-SS12 membrane with a 15 µm pore size, a GFB-R4 membrane, and AP045 membranes were used, which proved to be effective in the analysis of meat extracts described in our previous study [34]. To form the control zone of the test strip, RAMI at a concentration of 0.5 mg mL−1 was applied. To determine the optimal working combination of the immunoreagents, test strips of different compositions were prepared. Thus, antibodies of 4E2cc and 7C3 clones were immobilized in the analytical zones of the strips, while 4E2cc, 7C3, 1B4, MyoA6, MyoD4, MyoE4, MyoF5, and MyoH9 clones labeled by AuNPs were applied onto fiberglass membranes. The results presented in Table 2 indicate that the maximum color intensity is observed when using the 7C3/AuNPs—MyoA6 pair. It was shown that the maximum assay sensitivity and the highest analytical signal amplitude were reached at a concentration for 7C3 clone of 2.0 mg mL−1. A further increase in the amount of 7C3 antibodies immobilized in the analytical zone did not significantly affect the signal intensity. The AuNPs—MyoA6 conjugate was applied onto a fiberglass membrane at a concentration that corresponded to OD520 = 8.0 with 16 μL cm−1 loading, which ensured an intense coloration of the analytical band and the absence of nonspecific signal. The LFIA duration was 15 min because this time was shown to be sufficient to complete the movement of labeled antibodies along the test strip. Although the formation of colored bands was observed within 5–10 min after the immersion of the strip into the tested sample, this time was not enough to obtain highly reproducible quantitative results.
A calibration curve obtained under optimized conditions of the LFIA of MG using a 7C3/AuNPs—MyoA6 pair is shown in Figure 3. The developed test system is characterized by a MG detection limit of 5 ng mL−1. The working range of detectable concentrations is 14–210 ng mL−1. Relative standard deviation (RSD) of the measured signal intensity was not more than 12%.

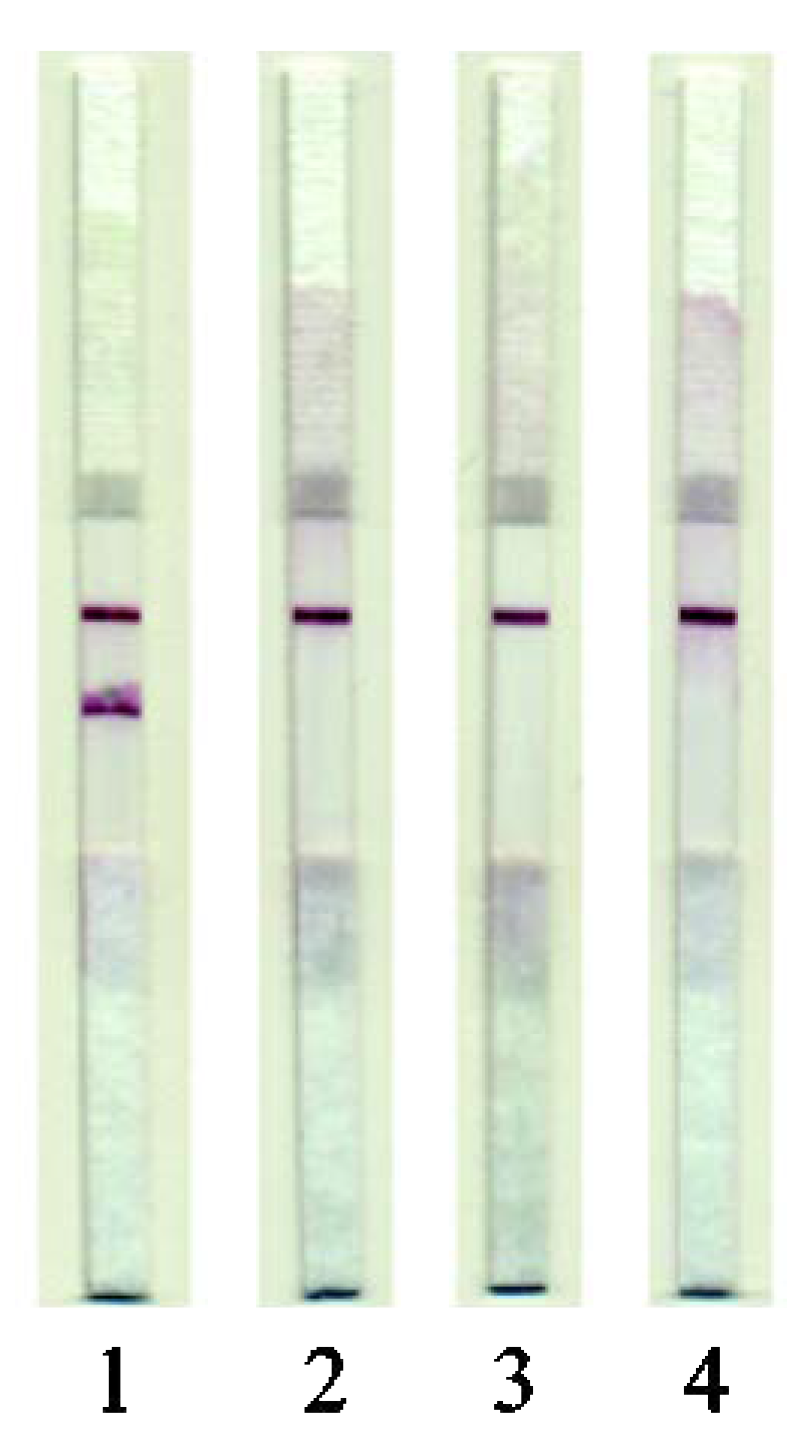
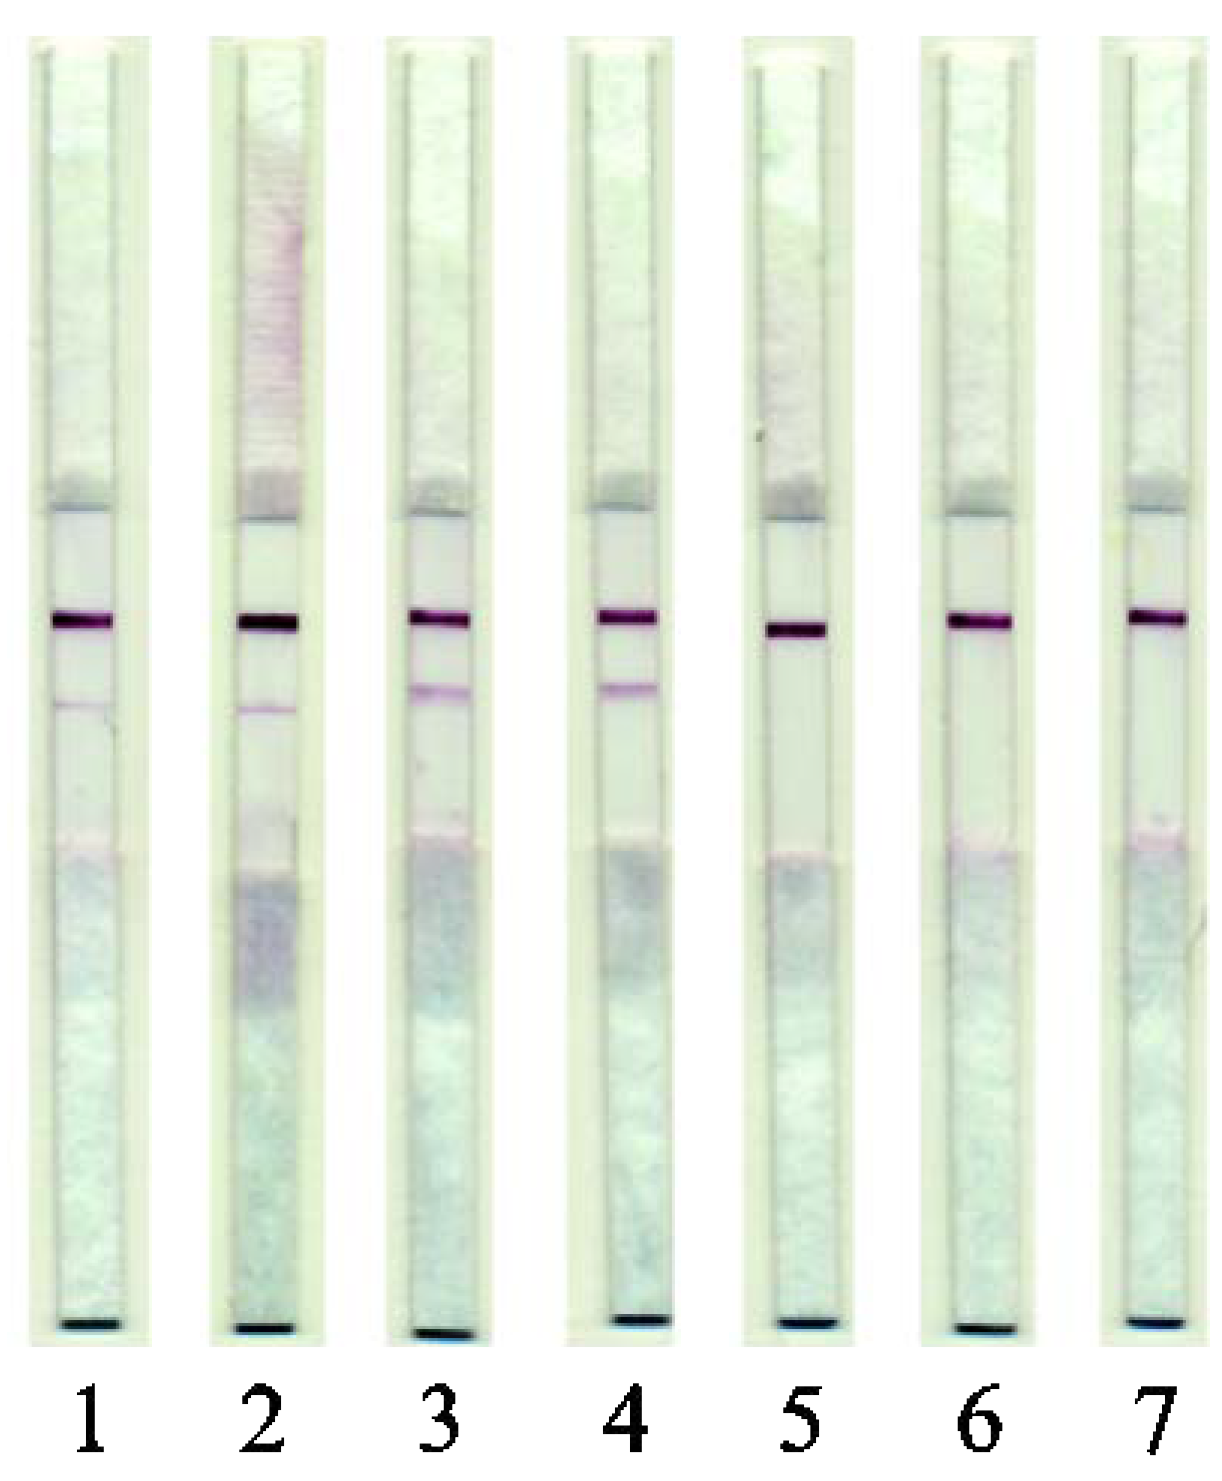
3.4. LFIA of Meat Samples

A series of test strips were prepared, and immunochromatographic detection of MG in standard solutions, as well as in extracts obtained from meat samples of various mammals and bird species, were carried out. It is known that matrix components in the tested sample can affect the assay results. The efficiency of MG extraction from tissues is also of great importance because MG is found mainly in the form of complexes with other muscle proteins, which can cause shielding of its epitopes and prevent reliable determination of its content. Because MG is a salt-soluble protein [25], several sample preparation techniques based on MG extraction with PBS were developed and compared. To increase the completeness of the extraction, various concentrations of Triton X-100 were added to the extraction medium. It was demonstrated that the maximum amount of MG was obtained by the extraction with PBST for 15 min, followed by centrifugation of the extract at 5000× g for 5 min (Method No. 4 in Table 3). This procedure of sample preparation is simple and rapid because no special expensive equipment is required for its implementation and the total extraction time does not exceed 20 min.
Studies on the specificity of the developed test system showed that it could specifically detect MG isolated only from pork samples (Figure 4). There was no cross-reactivity with extracts obtained from meat of other mammals (beef and lamb) or poultry (chicken and turkey).

3.5. LFIA of Raw Meat

The developed test system was used to estimate the content of pork meat ingredient in raw meat mixtures and cooked meat products. To reveal the assay sensitivity, the extracts from model meat mixtures consisting of minced beef containing 10, 1, 0.1, and 0.01% (w/w) of pork were analyzed. It was shown that the developed test system could reliably detect pork ingredient, as low as 0.01%, in beef (Figure 5). High reproducibility of the LFIA results was demonstrated; the RSD of the measured signal intensity was not more than 14%.
Thus, the developed test system is comparable in sensitivity to the previously reported immunoassay-based methods for porcine meat detection and surpasses them in sample preparation rapidity (Table 4).

3.6. LFIA of Cooked Meat

Several samples of sausages (cooked and cooked/smoked) and dumplings of different compositions were tested. Beef and pork-based cooked sausages with confirmed composition were produced at the factory for manufacturing of meat products of the V.M. Gorbatov Federal Research Center for Food Systems of the Russian Academy of Sciences. The results are presented in Figure 6.
Experiments on the analysis of sausage, which included pork fat, showed that the test system does not give a signal in the presence of such an additive. Accordingly, its capabilities are focused only on options for the ad hoc addition of pork muscle tissue to meat products.
The obtained data indicated that the developed test system for identifying pork in raw-meat-based dumplings (Samples 3 and 4) and also in cooked sausages, passed all stages of the technological cycle (Samples 1 and 2).

4. Conclusions

The characterization of anti-MG monoclonal antibodies and their conjugates with biotin and AuNPs were carried out by the ELISA and LFIA. An optimal pair of immunoreagents was selected, for detecting MG in the sandwich-format LFIA with a sensitivity of 5 ng/mL within 15 min. The test system specifically detects MG isolated from pork and demonstrates no cross-reactivity with MG of other species of mammals and birds. A simple and rapid technique for sample preparation is proposed that efficiently extracts MG from raw and cooked meat products. The developed LFIA can detect quantities of pork additives, as low as 0.01%, in beef. The assay results can be monitored visually or using a photometric detector (scanner). The proposed test system is able to detect pork MG in food products that have passed all stages of the technological cycle.
The advantage of the developed test system over the existing approaches for porcine meat detection is the reduction in the assay duration (sample preparation + the LFIA step). This feature, and low demands for the common equipment used, determines the competitive potential of the given developments. Due to the rapidity and methodological simplicity, the proposed assay can be considered to be an efficient screening tool for identifying undeclared additives of porcine meat in meat products.

Author Contributions

Conceptualization, E.A.Z., A.V.Z., and B.B.D.; Methodology, E.A.Z.; Software, D.S.P.; Validation, O.D.H.; Formal analysis, N.A.B. and O.D.H.; Investigation, E.A.Z., N.A.B., K.A.B., and O.D.H.; Resources, A.V.Z.; Writing—original draft preparation, E.A.Z.; Writing—review and editing, A.V.Z.; Visualization, D.S.P.; Project administration, B.B.D.; Funding acquisition, A.V.Z. All authors have read and agreed to the published version of the manuscript.

Funding

This work was supported by the Russian Science Foundation (project no. 19-16-00108).

Acknowledgments

The authors are grateful to Academician I.M. Chernukha and N.L. Vostrikova (V.M. Gorbatov Federal Research Center for Food Systems) for preparation and providing cooked meat products of known composition, to P.G. Sveshnikov (Russian Research Center of Molecular Diagnostics and Therapy) for providing monoclonal antibodies against MG, and to S.M. Pridvorova (Research Center of Biotechnology) for supplying and processing TEM microphotographs.

Conflicts of Interest

The authors declare no conflict of interest.

References

  1. Cavin, C.; Cottenet, G.; Cooper, K.M.; Zbinden, P. Meat vulnerabilities to economic food adulteration require new analytical solutions. CHIMIA Int. J. Chem. (Aarau) 2018, 72, 697–703. [Google Scholar] [CrossRef] [PubMed]
  2. Zia, Q.; Alawami, M.; Mokhtar, N.F.K.; Mohd, R.; Nhari, H.R.; Hanish, I. Current analytical methods for porcine identification in meat and meat products. Food Chem. 2020, 324, 126664. [Google Scholar] [CrossRef] [PubMed]
  3. Premanandh, J.; Bin Salem, S. Progress and challenges associated with Halal authentication of consumer packaged goods. J. Sci. Food Agric. 2017, 97, 4672–4678. [Google Scholar] [CrossRef] [PubMed]
  4. Ballin, N.Z. Authentication of meat and meat products. Meat Sci. 2010, 86, 577–587. [Google Scholar] [CrossRef] [PubMed]
  5. Chernukha, I.M.; Vostrikova, N.L.; Khvostov, D.V.; Zvereva, E.A.; Taranova, N.A.; Zherdev, A.V. Methods of identification of muscle tissue in meat products. prerequisites for creating a multi–level control system. Theory Pract. Meat Process. 2019, 4, 32–40. [Google Scholar] [CrossRef]
  6. Al-Jowder, O.; Casuscelli, F.; Defernez, M.; Kemsley, E.K.; Wilson, R.H.; Colquhoun, I.J. High resolution NMR studies of meat composition and authenticity. In Magnetic Resonance in Food Science: A View to the Future, 1st ed.; Webb, G.A., Belton, P.S., Gil, A.M., Delgadillo, I., Eds.; Royal Society of Chemistry: Cambridge, UK, 2001; pp. 232–238. [Google Scholar]
  7. Jakes, W.; Gerdova, A.; Defernez, M.; Watson, A.D.; McCallum, C.; Limer, E.; Colquhoun, I.J.; Williamson, D.C.; Kemsley, E.K. Authentication of beef versus horse meat using 60 MHz 1H NMR spectroscopy. Food Chem. 2015, 175, 1–9. [Google Scholar] [CrossRef] [Green Version]
  8. Mandli, J.; El Fatimi, I.; Seddaoui, N.; Amine, A. Enzyme immunoassay (ELISA/immunosensor) for a sensitive detection of pork adulteration in meat. Food Chem. 2018, 255, 380–389. [Google Scholar] [CrossRef]
  9. Soares, S.; Amaral, J.S.; Oliveira, M.B.P.P.; Mafra, I. A SYBR Green real-time PCR assay to detect and quantify pork meat in processed poultry meat products. Meat Sci. 2013, 94, 115–120. [Google Scholar] [CrossRef] [Green Version]
  10. Sentandreu, M.A.; Sentandreu, E. Authenticity of meat products: Tools against fraud. Food Res. Int. 2014, 60, 19–29. [Google Scholar] [CrossRef]
  11. Magiati, M.; Myridaki, V.M.; Christopoulos, T.K.; Kalogianni, D.P. Lateral flow test for meat authentication with visual detection. Food Chem. 2019, 274, 803–807. [Google Scholar] [CrossRef]
  12. Yin, R.; Sun, Y.; Wang, K.; Feng, N.; Zhang, H.; Xiao, M. Development of a PCR-based lateral flow strip assay for the simple, rapid, and accurate detection of pork in meat and meat products. Food Chem. 2020, 318, 126541. [Google Scholar] [CrossRef] [PubMed]
  13. Anfossi, L.; Di Nardo, F.; Cavalera, S.; Giovannoli, C.; Baggiani, C. Multiplex lateral flow immunoassay: An overview of strategies towards high-throughput point-of-need testing. Biosensors 2019, 9, 2. [Google Scholar] [CrossRef] [PubMed] [Green Version]
  14. Dzantiev, B.B.; Byzova, N.A.; Urusov, A.E.; Zherdev, A.V. Immunochromatographic methods in food analysis. TrAC Trends Anal. Chem. 2014, 55, 81–93. [Google Scholar] [CrossRef]
  15. Chen, F.C.; Hsieh, Y.-H.P. Porcine troponin I: A thermostable species marker protein. Meat Sci. 2002, 61, 55–60. [Google Scholar] [CrossRef]
  16. Masiri, J.; Benoit, L.; Barrios-Lopez, B.; Thienes, C.; Meshgi, M.; Agapov, A.; Dobritsa, A.; Nadala, C.; Samadpour, M. Development and validation of a rapid test system for detection of pork meat and collagen residues. Meat Sci. 2016, 121, 397–402. [Google Scholar] [CrossRef] [PubMed]
  17. Depamede, S.N. Development of a rapid immunodiagnostic test for pork components in raw beef and chicken meats: A preliminary study. Media Peternak. 2011, 34, 83–87. [Google Scholar] [CrossRef]
  18. Kuswandi, B.; Gani, A.A.; Ahmad, M. Immuno strip test for detection of pork adulteration in cooked meatballs. Food Biosci. 2017, 19, 1–6. [Google Scholar] [CrossRef]
  19. Joseph, P.; Suman, S.P.; Li, S.; Claus, J.R.; Fontaine, M.; Steinke, L. Primary structure of turkey myoglobin. Food Chem. 2011, 129, 175–178. [Google Scholar] [CrossRef]
  20. Ragucci, S.; Russo, R.; Landi, N.; Valletta, M.; Chambery, A.; Esposito, S.; Raundrup, K.; Di Maro, A. Muskox myoglobin: Purification, characterization and kinetics studies compared with cattle and water buffalo myoglobins. J. Sci. Food Agric. 2019, 99, 6278–6286. [Google Scholar] [CrossRef]
  21. Kotoura, S.; Murakami-Yamaguchi, Y.; Kizu, K.; Nakamura, M.; Fuchu, H.; Miake, K.; Sugiyama, M.; Narita, H. Establishment of a sandwich ELISA for the determination of beef content in processed foods by using monoclonal antibodies to myoglobin. Food Agric. Immunol. 2012, 23, 289–301. [Google Scholar] [CrossRef]
  22. Chan, K.W.; Lo, C.; Chu, C.S.; Chin, L.T.; Wang, Y.T.; Yang, W.C. Development of a colloidal gold-based immunochromatographic test strip for detection of cetacean myoglobin. J. Vis. Exp. 2016, 113, e53433. [Google Scholar] [CrossRef]
  23. Giaretta, N.; Di Giuseppe, A.M.A.; Lippert, M.; Parente, A.; Di Maro, A. Myoglobin as marker in meat adulteration: A UPLC method for determining the presence of pork meat in raw beef burger. Food Chem. 2013, 141, 1814–1820. [Google Scholar] [CrossRef] [PubMed]
  24. Di Giuseppe, A.M.A.; Giarretta, N.; Lippert, M.; Severino, V.; Di Maro, A. An improved UPLC method for the detection of undeclared horse meat addition by using myoglobin as molecular marker. Food Chem. 2015, 169, 241–245. [Google Scholar] [CrossRef]
  25. Biacore, A.B. Biacore X Handbook; Biacore AB: Uppsala, Sweden, 2001; p. 108. [Google Scholar]
  26. Bayer, E.A.; Wilchek, M. Protein biotinylation. Methods Enzymol. 1990, 184, 138–160. [Google Scholar] [CrossRef]
  27. Frens, G. Controlled nucleation for the regulation of the particle size in monodisperse gold suspensions. Nat. Phys. Sci. 1973, 241, 20–22. [Google Scholar] [CrossRef]
  28. Zvereva, E.A.; Hendrickson, O.D.; Zherdev, A.V.; Dzantiev, B.B. Immunochromatographic tests for the detection of microcystin-LR toxin in water and fish samples. Anal. Methods 2020, 12, 392–400. [Google Scholar] [CrossRef]
  29. Zvereva, E.A.; Kovalev, L.I.; Ivanov, A.V.; Kovaleva, M.A.; Zherdev, A.V.; Shishkin, S.S.; Lisitsyn, A.B.; Chernukha, I.M.; Dzantiev, B.B. Enzyme immunoassay and proteomic characterization of troponin I as a marker of mammalian muscle compounds in raw meat and some meat products. Meat Sci. 2015, 105, 46–52. [Google Scholar] [CrossRef]
  30. Wild, D.G. Immunoassay Handbook: Theory and Applications of Ligand Binding, ELISA and Related Techniques, 4th ed.; Elsevier Science: Amsterdam, The Netherlands, 2013; 1036p. [Google Scholar]
  31. Lo, C.; Chin, L.T.; Chu, C.S.; Wang, Y.T.; Chan, K.W.; Yang, W.C. Rapid immune colloidal gold strip for cetacean meat restraining illegal trade and consumption: Implications for conservation and public health. PLoS ONE 2013, 8, e60704. [Google Scholar] [CrossRef] [Green Version]
  32. Safenkova, I.; Zherdev, A.; Dzantiev, B. Factors influencing the detection limit of the lateral-flow sandwich immunoassay: A case study with potato virus X. Anal. Bioanal. Chem. 2012, 403, 1595–1605. [Google Scholar] [CrossRef]
  33. Hermanson, G.T. Bioconjugate Techniques; Academic Press, Elsevier: Amsterdam, The Netherlands, 2008; 1200p. [Google Scholar]
  34. Zvereva, E.A.; Zherdev, A.V.; Xu, C.; Dzantiev, B.B. Highly sensitive immunochromatographic assay for qualitative and quantitative control of beta-agonist salbutamol and its structural analogs in foods. Food Control 2018, 86, 50–58. [Google Scholar] [CrossRef]
Figure 1. (A) Image of gold nanoparticles (AuNPs) obtained by transmission electron microscopy (TEM); (B) Histogram of particle size distribution.
Applsci 10 07437 g001
Figure 2. Flocculation curve for the MyoA6 clone of monoclonal antibodies. The flocculation point and a concentration of antibodies selected for the conjugation are indicated by arrows (5.2 and 8 µg mL−1, respectively).
Applsci 10 07437 g002
Figure 3. Calibration curve for MG in the sandwich-format LFIA.
Applsci 10 07437 g003
Figure 4. Testing of the LFIA specificity. Images of test strips after the LFIA was performed. (1) On pork extracts; (2), On beef extracts; (3) On lamb extracts; (4) On chicken extracts.
Applsci 10 07437 g004
Figure 5. Images of test strips after the LFIA performed on meat extracts. The numbers indicate the pork meat content (%, w/w).
Applsci 10 07437 g005
Figure 6. Images of test strips after the LFIA. (1) Beef/pork cooked sausages (2) Beef/pork cooked and smoked sausages; (3) Beef/pork dumplings; (4) Venison/pork dumplings; (5) Beef dumplings; (6) Lamb dumplings; (7) Chicken dumplings.
Applsci 10 07437 g006
Table 1. Analytical parameters of association and dissociation of antibody–myoglobin (MG) complexes.
Cloneka,
M−1 × c−1
kd,
c−1
KA,
M−1
KD,
M
χ2
1B4(2.0 ± 0.5) × 105(7.1 ± 1.6) × 10−5(3.6 ± 1.0) × 109(4.7 ± 1.6) × 10−100.104
4E2cc(2.4 ± 0.6) × 105(5.1 ± 1.7) × 10−5(7.6 ± 3.2) × 109(2.9 ± 1.1) × 10−100.842
7C3(6.5 ± 3.4)·× 105(3.2 ± 0.8) × 10−4(2.8 ± 1.0) × 109(1.8 ± 1.3) × 10−90.158
MyoA6(6.3 ± 1.4) × 104(2.8 ± 0.1) × 10−4(2.2 ± 0.5) × 108(5.9 ± 1.6) × 10−90.196
MyoB1(5.0 ± 1.2) × 104(3.6 ± 0.5) × 10−3(1.4 ± 0.3) × 107(9.6 ± 3.4) × 10−80.227
MyoB12(3.7 ± 0.8) × 104(3.6 ± 0.5) × 10−3(7.1 ± 1.6) × 106(1.8 ± 0.3) × 10−70.122
MyoD4(1.2 ± 0.3) × 105(7.0 ± 2.0) × 10−5(1.9 ± 0.3) × 109(6.2 ± 1.3) × 10−100.287
MyoE4(1.5 ± 0.2) × 105(5.1 ± 0.8) × 10−4(3.4 ± 0.7) × 108(3.9 ± 1.0) × 10−90.124
MyoF5(1.9 ± 0.4) × 105(6.2 ± 2.1) × 10−5(6.1 ± 3.7) × 109(4.1 ± 1.8) × 10−100.085
MyoF7(1.4 ± 0.2) × 105(1.2 ± 0.3) × 10−3(1.8 ± 0.7) × 108(9.6 ± 3.3) × 10−90.138
MyoH9(8.7 ± 3.1) × 104(4.6 ± 1.5) × 10−4(3.2 ± 1.4) × 108(7.3 ± 4.1) × 10−90.265
MyoH11(3.0 ± 0.9) × 105(8.3 ± 0.6) × 10−4(3.9 ± 1.5) × 108(4.8 ± 1.2) × 10−90.091
ka, kinetic association constant; kd, kinetic dissociation constant; KA, equilibrium association constant; KD, equilibrium dissociation constant.
Table 2. Analytical parameters of the enzyme-linked immunosorbent assay (ELISA) and lateral flow immunoassay (LFIA) of MG.
Immobilized/Biotinylated (AuNPs-Labeled) AntibodyDetection Limit in the ELISA of MG, ng mL−1Detection Limit in the LFIA of MG, ng mL−1Color Intensity of the Analytical Zone, %
7C3/MyoA69.25.0100
7C3/MyoD49.124.175
7C3/MyoE412.835.635
7C3/MyoF510.815.678
7C3/MyoH913.710.279
7C3/1B414.619.453
7C3/4E2cc2.021.931/19
4E2cc/7C323.04.539/25
Table 3. MG content revealed by the LFIA after different sample preparation procedures.
Method No.Sample Preparation ProcedureMG, mg g−1 of Pork
1Extraction with PBS, containing 0.1% Triton X-100 and 0.5 M KCl, followed by an incubation at 100 °C and centrifugation for 5 min at 7000× g0.03 ± 0.01
2Extraction with PBS, containing 0.1% Triton X-100 and 0.5 M KCl, followed by a sonication and centrifugation for 10 min at 5000× g0.25 ± 0.02
3Extraction with PBST0.13 ± 0.03
4Extraction with PBST followed by a centrifugation for 5 min at 5000× g0.40 ± 0.03
Table 4. Comparison of methods for porcine meat detection.
MethodAnalyteDetection Limit, %Extraction Time, minTime of Analysis, minReference
ELISAIgG0.01/0.1>40>700/45[8]
ImmunosensorIgG0.01>4020[8]
PCRDNA523580[9]
Real-time PCRDNA0.123528[9]
UPLCProteins profile54030[23]
LFIADNA0.02>6015[11]
LFIADNA0.01>905[12]
LFIAPSA*0.012515[16]
LFIAIgG0.16515[18]
LFIAMG0.012015Present work
PSA*, pig serum albumin.
Publisher’s Note: MDPI stays neutral with regard to jurisdictional claims in published maps and institutional affiliations.

