Article

A Field Study of the Impact of Indoor Lighting on Visual Perception and Cognitive Performance in Classroom

1
School of Printing and Packaging, Wuhan University, Wuhan 430079, China
2
Hubei Provincial Engineering Research Center for Digitization and Virtual Reproduction of Color Information in Cultural Relics, Wuhan 430079, China
3
School of Design, University of Leeds, Leeds LS2 9JT, UK
4
Central South Architectural Design Institute, Wuhan 430000, China
5
College of Engineering, Qufu Normal University, Rizhao 276000, China
*
Author to whom correspondence should be addressed.
Appl. Sci. 2020, 10(21), 7436; https://doi.org/10.3390/app10217436
Submission received: 12 September 2020 / Revised: 15 October 2020 / Accepted: 20 October 2020 / Published: 22 October 2020
(This article belongs to the Special Issue Light Emitting Diode)

Abstract

:
In this field study, a series of psychophysical tests were conducted to investigate the impact of indoor lighting on students’ visual perception and cognitive performance. A typical classroom of Wuhan University (China) was fitted with tubular light-emitting diode (LED) sources and LED panel sources in two experiments, respectively. Under the two lighting environments, seventy-nine college students were invited to complete a group of visual tests, which included colour preference evaluations of fruit and vegetables and skin tone, perceptual judgement on the atmosphere of the lighting environment, a reading comfort assessment concerning different paper colours, a Karolinska Sleepiness Scale (KSS) test quantifying alertness, and the Anfimov test of attention (also concerning paper colours). These tests were conducted twice, before and after a two-hour self-study under each lighting environment, with the aim of investigating the impact of visual fatigue on visual perception and cognitive performance. It was found that the influence of indoor lighting was significant on skin preference and atmosphere perception, while no measured effects of lighting were observed on participant’s alertness and attention. Meanwhile, the impact of visual fatigue was also found to be insignificant in this case. Interestingly, paper colour, rather than indoor lighting, was found to have a significant impact on the visual comfort of text reading. In addition, degree of proficiency significantly influenced the proofreading speed and accuracy of the subjects the in Anfimov test, which we believe should be taken into consideration when implementing similar tests in follow-up studies. The preliminary findings of this field study should provide a deeper understanding of how changes in classroom lighting contribute to visual perception and cognitive performance of occupants.

1. Introduction

In the past century and a half, many research projects have investigated the effect of lighting on the perception of the environment, contributing to a comprehensive understanding of the mechanism of visual perception. Studies aimed at finding a correlation between the spectral power distribution (SPD) of light and human visual perception, including colour fidelity [1,2], colour naturalness [3,4], colour discrimination [5,6], colour preference [7,8,9], lighting comfort [10,11], and the whiteness of lighting [12,13], have obtained positive results. More than fifty colour quality metrics involving objective and subjective aspects of perception have been proposed, including the Colour Rendering Index (CRI: Ra) developed by Commission Internationale de l’Eclairage (CIE) [1], Colour Quality Scale (CQS: Qa, Qf, Qp, Qg) [2] developed by National Institute of Standards and Technology (NIST), IES-TM-30 metrics (Rf and Rg) [14] developed by American National Standards Institute (ANSI)& Illuminating Engineering Society of North America, Memory Colour Rendering Index (MCRI) [15], Colour Discrimination Index (CDI) [16], and Gamut Volume Index (GVI) [17]. These metrics are essential and effective tools to inform good professional practice, for example in applied lighting design and product development in museums and art galleries [11,18], surgical applications [19,20], industrial inspection [20], and the retail environment [5,21].
In 2001, a third type of photoreceptor, the intrinsic photosensitive retinal ganglion cell (ipRGC), was discovered [22,23]. These novel cells are located in the retina of mammals and they have been shown to have special nerve connections to the suprachiasmatic nucleus (SCN), which is the biological clock in the brain. The SCN, in turn, has a nerve connection with the pineal gland, responsible for the regulation of some types of hormones. The discovery of additional nerve connections from the ipRGC in the eye to the brain has prominently contributed to the understanding of many non-visual biological effects of lighting, for example, circadian rhythms [24,25], cortisol production [26], melatonin production [27], concentration [28,29], and alertness [27,30].
Over recent decades, researchers, lighting designers, and architects have realized that lighting design should be required to consider both visual and non-visual aspects of lighting [31,32,33,34]. Based on such a scientific consensus, researchers have recently focused on the concept of human-centric lighting (HCL) [35,36,37,38,39], which aims to maximize the benefits of proper lighting and covers a broad set of technologies. Specifically, HCL provides evidence-based lighting solutions optimized for vision, performance, alertness, and general human health, in the way of balancing the visual, emotional, and biological benefits of lighting. In a recent work by Vinh et al. [35], taking selected spectral aspects of HCL into consideration, a preliminary usefulness metric was proposed to characterize the energy efficiency of light sources. This HCL metric comprised widespread used measures of colour quality (e.g., CRI Ra), descriptors of brightness (e.g., CIE Lmes [40]), as well as an indicator of the circadian effect (the so-called DIN melanopic factor [41]). Additionally, in the latest study by Duong et al. [38] that concentrated on the up-lighting method and freeform optics, a design of freeform lenses for HCL was developed. It was proved to be beneficial in obtaining the maximum luminous uniformity over an indoor space, which might result in less chance of myopia and improvement in health and mental wellness.
It is necessary, however, to recognize the limitations of what we know at the current stage [37]. For the visual effects of lighting, we know much about how light affects our visual capabilities and perceptions but, due to the variations in psychophysical studies, a consensus has not been reached in those topics. For the non-visual effects, we suspect that many parts of the human body are influenced by light, yet these are relatively unexplored. Thus, as has been announced by many researchers [34,35,37,42], a full range of lighting research, in both visual and non-visual domains, is still needed.
In this contribution, therefore, a field study has been carried out with the aim of exploring the impact of classroom lighting on the visual perception and cognitive performance of the occupants. Two types of luminaires, tubular LED and LED panel sources, were consecutively installed in a classroom in two experiments, both of which employed the same experimental protocol. Seventy-nine college students were recruited to conduct a series of visual evaluations and cognitive tasks under the two experimental lighting conditions. The tasks were conducted twice for every lighting environment, before and after a 2-h period of self-study, which intended to investigate the impact of visual fatigue. According to recent studies, inappropriate selection of paper colour may lead to visual fatigue [43], asthenopia [44], and even some ocular diseases (e.g., keratitis and conjunctivitis [45,46]). Thus, investigating the impact of paper colour (white, yellowish-white, and green) on reading comfort and attention under different light sources was another purpose of this work. In addition, inspired by the error score variations found in the Farnsworth–Munsell 100 Hue Test (a typical measure of colour discrimination capability) caused by test repetition [47,48], we also investigated whether there were practice effects (i.e., impact of degree of proficiency) in the adopted psychophysical approaches.

2. Method

2.1. Experimental Design

The experiments were approved by the ethics committee of the School of Printing and Packaging, Wuhan University. The project identification code is 250000210 (approved on 20 October 2019). Informed consent was obtained from all participants for being included in the study.
In this study, two experiments were consecutively conducted in one classroom at Wuhan University in Wuhan, China (30.53° N, 114.36° E). Both experiments were designed within the same experimental protocol, but with different luminaires (Experiment 1: tubular LED sources; Experiment 2: LED panel sources). Seventy-nine students (person-time) from Wuhan University were invited to participate in the research. All the experiments were conducted after 6:30 p.m. to avoid unintended variables caused by the presence of daylight.
Each experiment involved Sessions 1, 2, and 3, as shown in Figure 1. In Session 1, participants were asked to complete six tasks related to visual perception and cognitive performance. The first was the colour preference evaluation of a plate of multicoloured fruit and vegetables, followed by the visual evaluation of skin tone preference. These approaches are widely adopted in the measurement of colour quality of light sources [3,7,9]. The third task was to assess the atmosphere of the indoor lighting environment in terms of four attributes: Uncomfortable/Comfortable, Cool/Warm, Negative/Active, and Tense/Relaxed. Next, the participants were asked to complete the proofreading task of the Anfimov test [49,50,51,52]. The visual comfort assessment of text reading associated with three differently coloured pieces of paper (white, yellowish-white, and green) was conducted next. The last task was the Karolinska Sleepiness Scale (KSS) test [53]. The details of the six tasks will be described in Section 2.4.
In Session 2, the participants were instructed to conduct a 2-h period of self-study in the classroom, during which only paperwork with white paper was allowed, i.e., no light-emitting devices (e.g., computers, tablets, phones) were allowed. Such an arrangement was to make sure that the only light in the classroom came from the experimental luminaires. It should be noted that this study was carried out in December 2019, when the final exams of the university were approaching. Thus, the participants were able to concentrate on revision for their final exams, e.g., reviewing textbooks and doing exercises.
Session 3, which adopted the same experimental procedure as Session 1, was performed after the 2-h self-study period. Thus, each participant completed the six visual tests twice under the same lighting environment, before and after the self-study period, respectively. As noted above, this protocol aimed to investigate the impact of visual fatigue on the results of the tests. In addition, one group of experienced participants who had engaged in Experiment 1 and a second group of participants without such experience were both involved in Experiment 2. This arrangement aimed to verify any possible practice effects on the results of the psychophysical tests. Strictly speaking, the impact of visual fatigue revealed by any comparison between the results of Session 1 and Session 3 was confounded by the impact of another form of practice effect, that is, the instant experience obtained in Session 1. In this study, we assumed the instant practice effect between Session 1 and Session 3 to be negligible according to the insignificant difference between experienced participants and inexperienced participants in Experiment 2 (see Section 3). Therefore, only the possible impact of visual fatigue caused by the 2-h self-study between Session 1 and Session 3 is discussed in the following sections. In total, it took approximately three and a half hours to conduct each experiment.

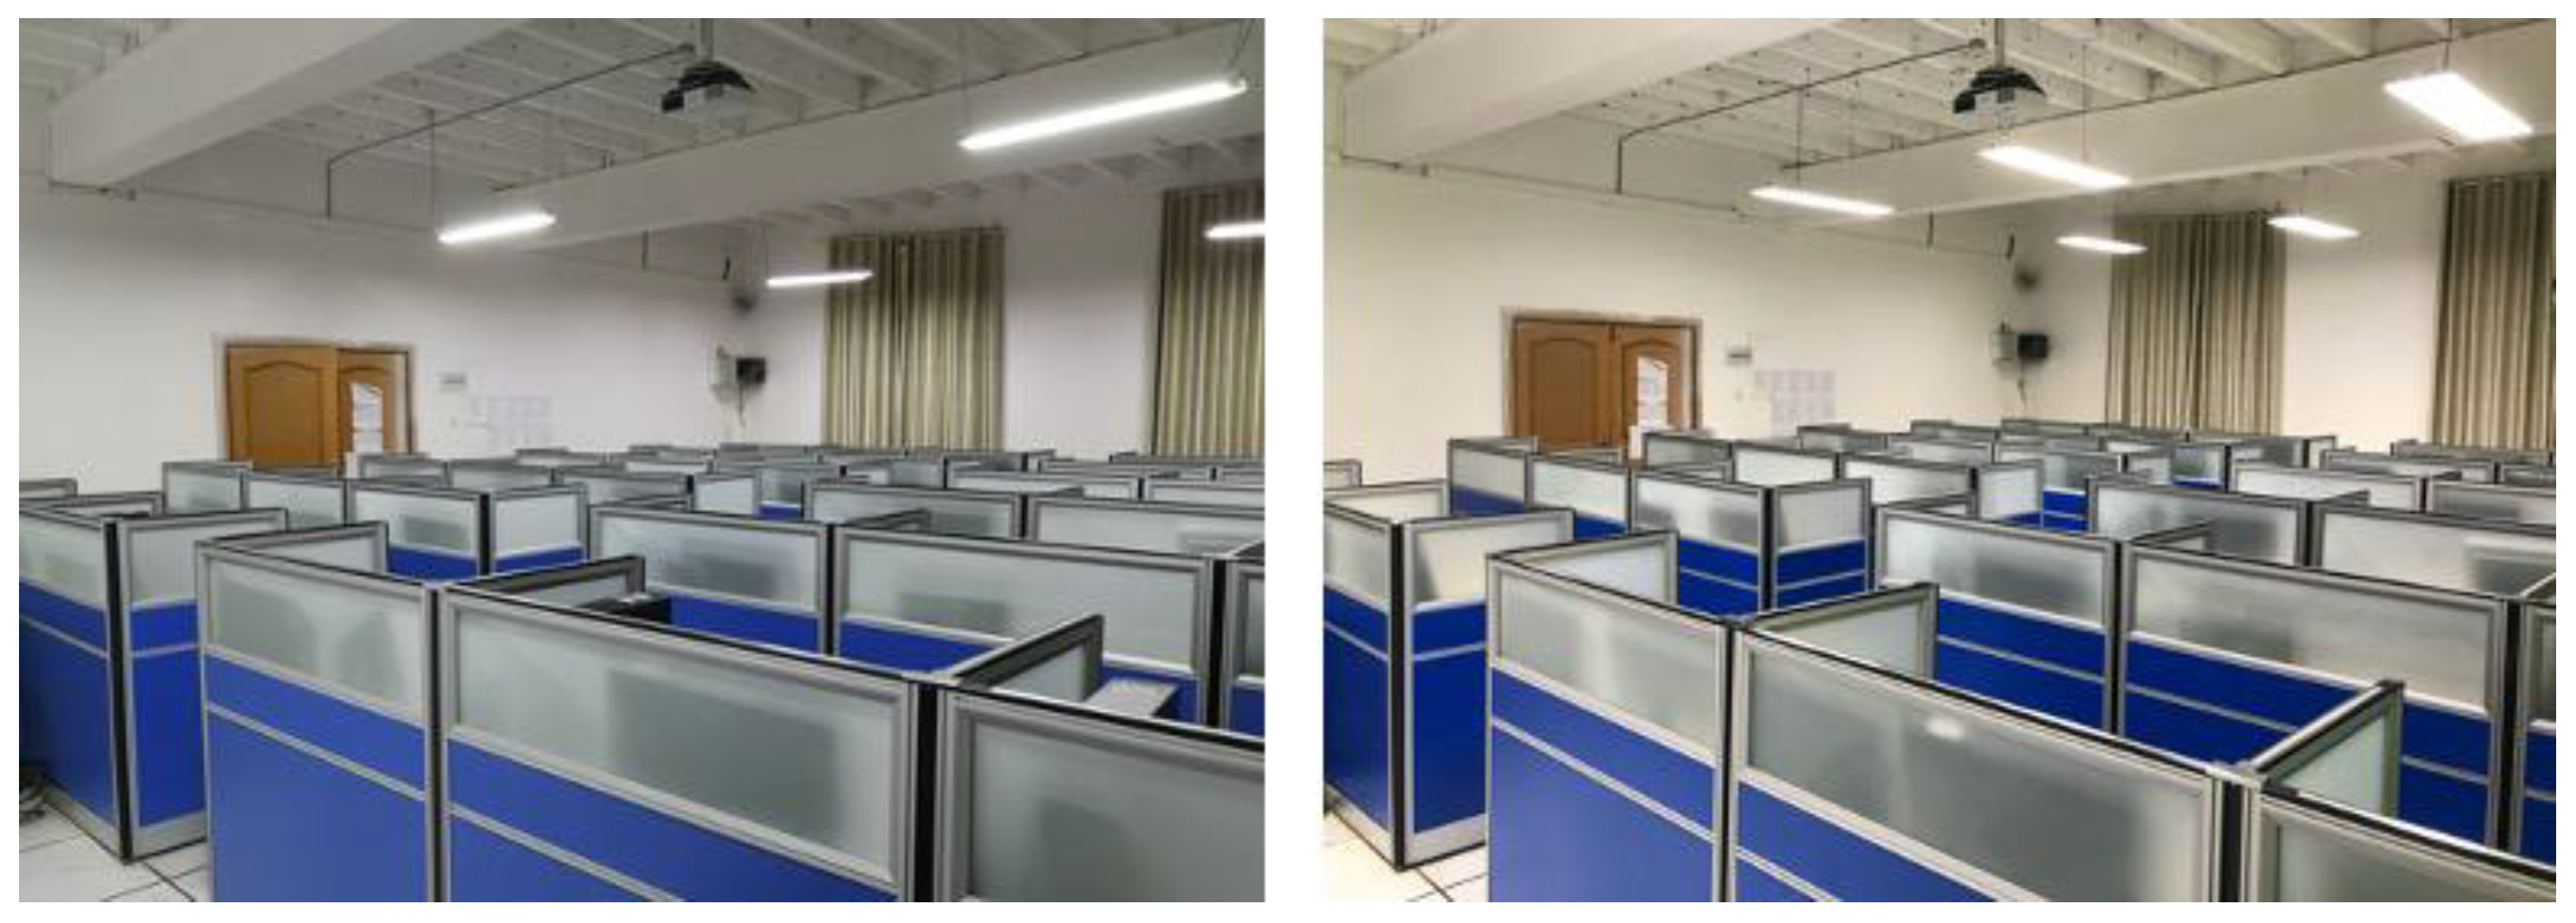
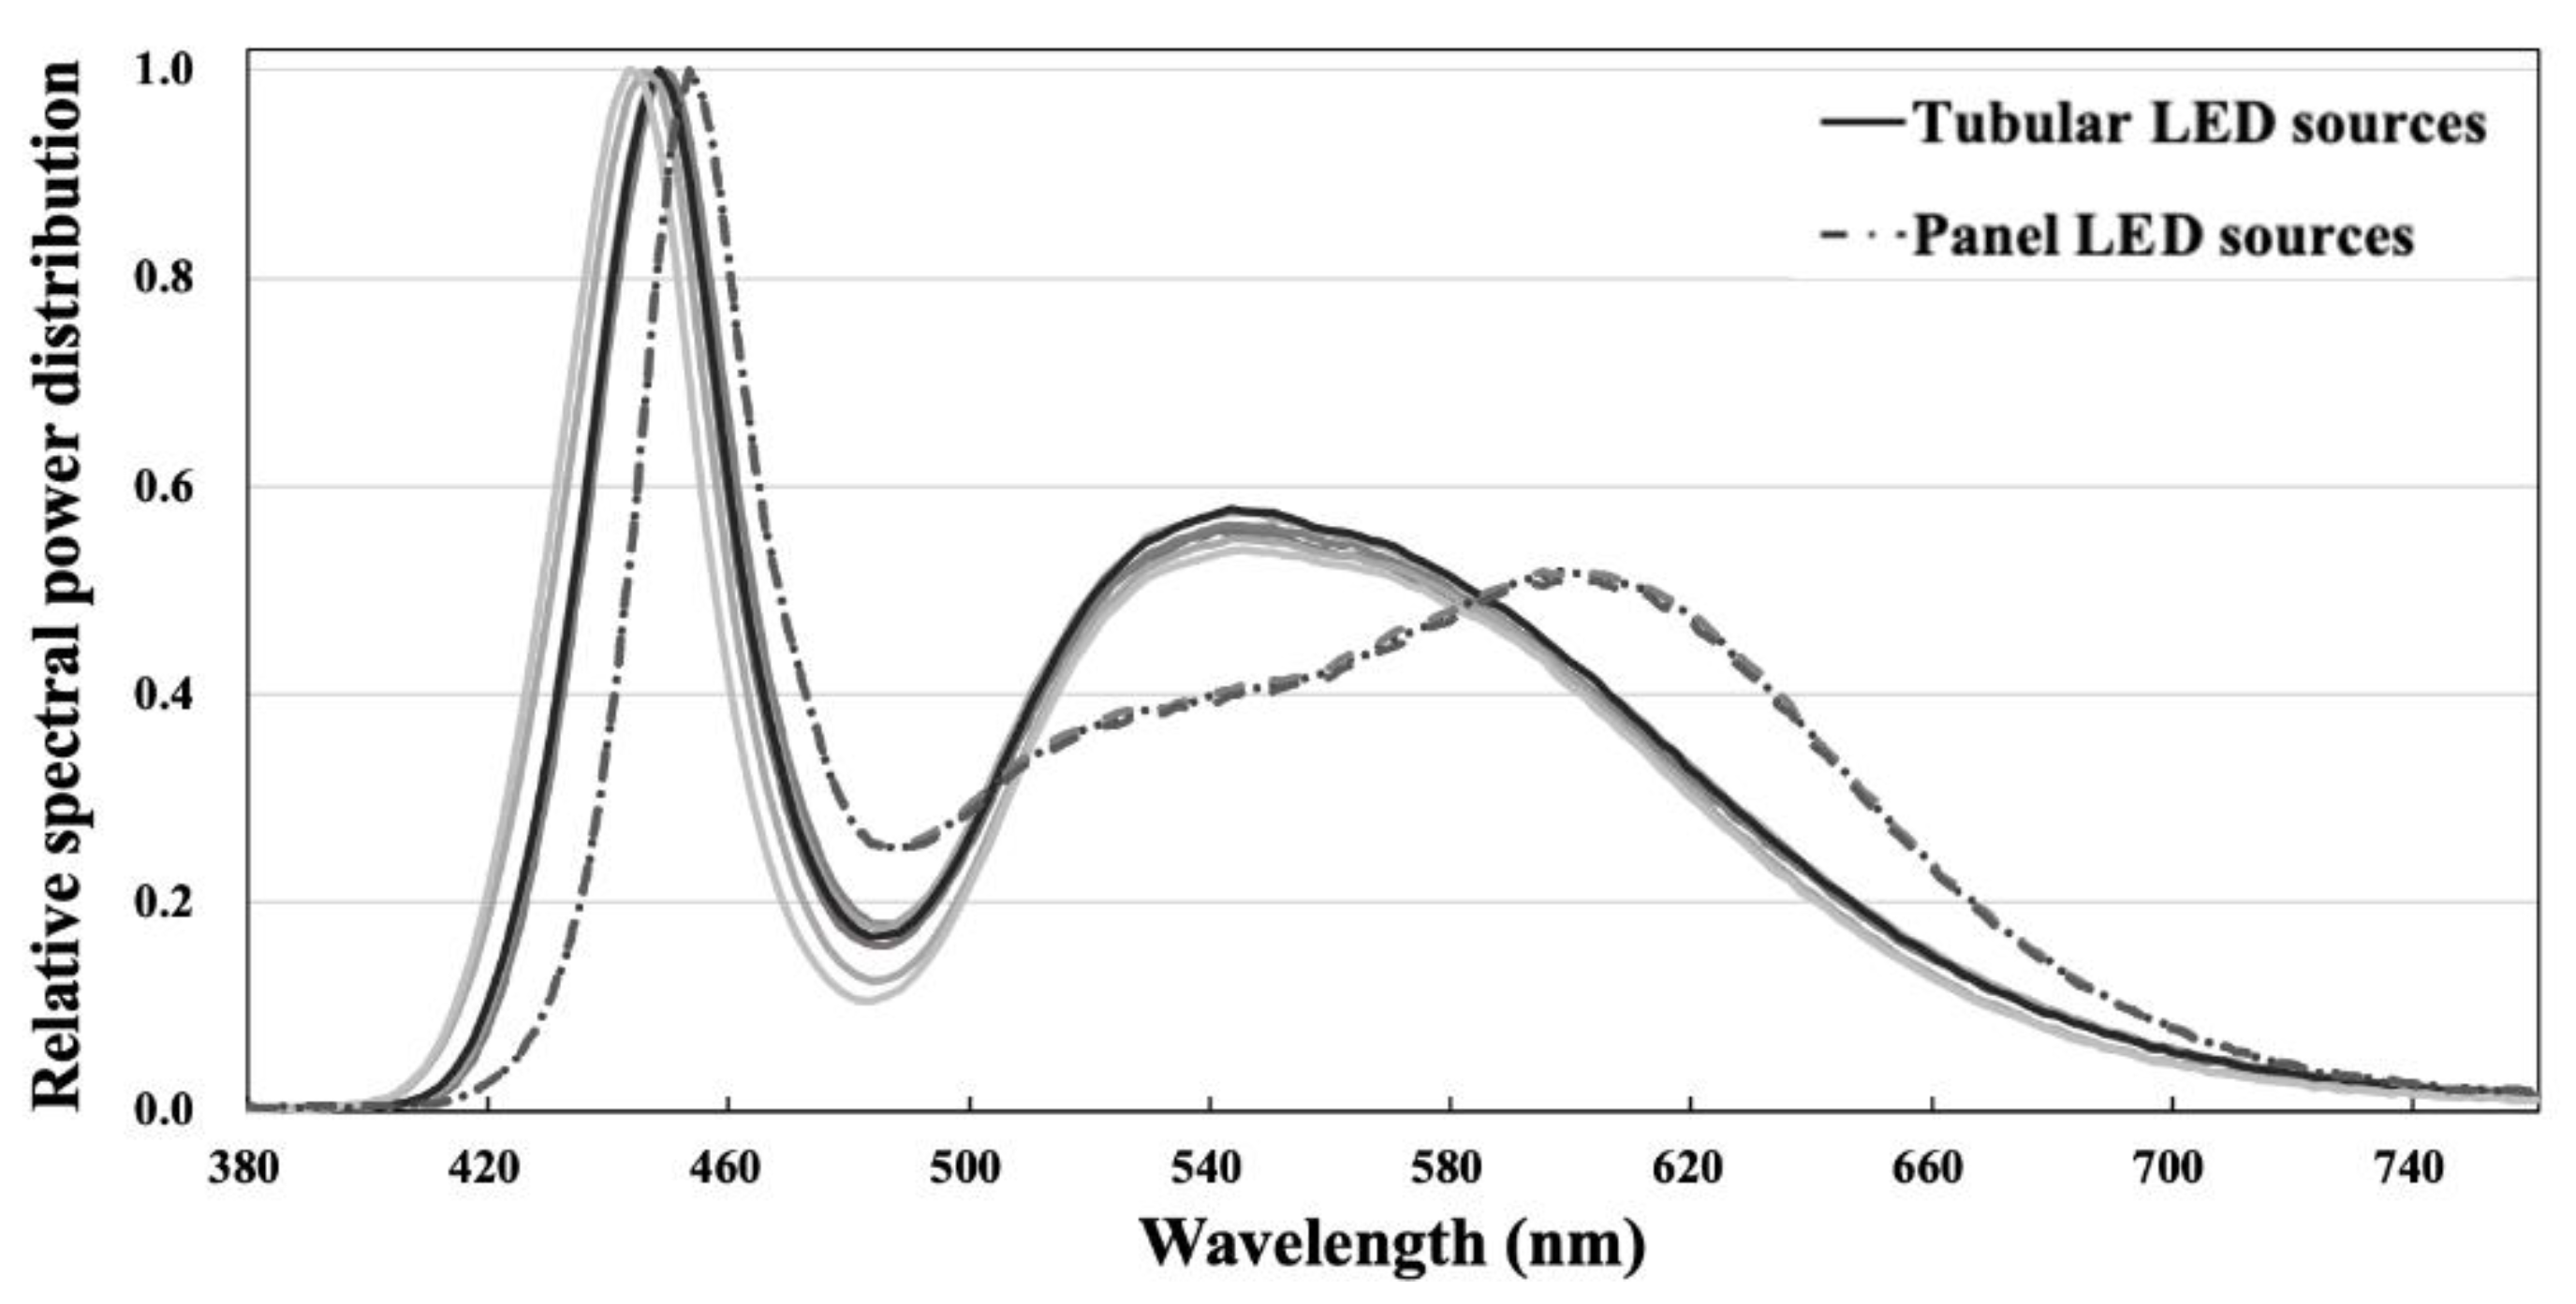
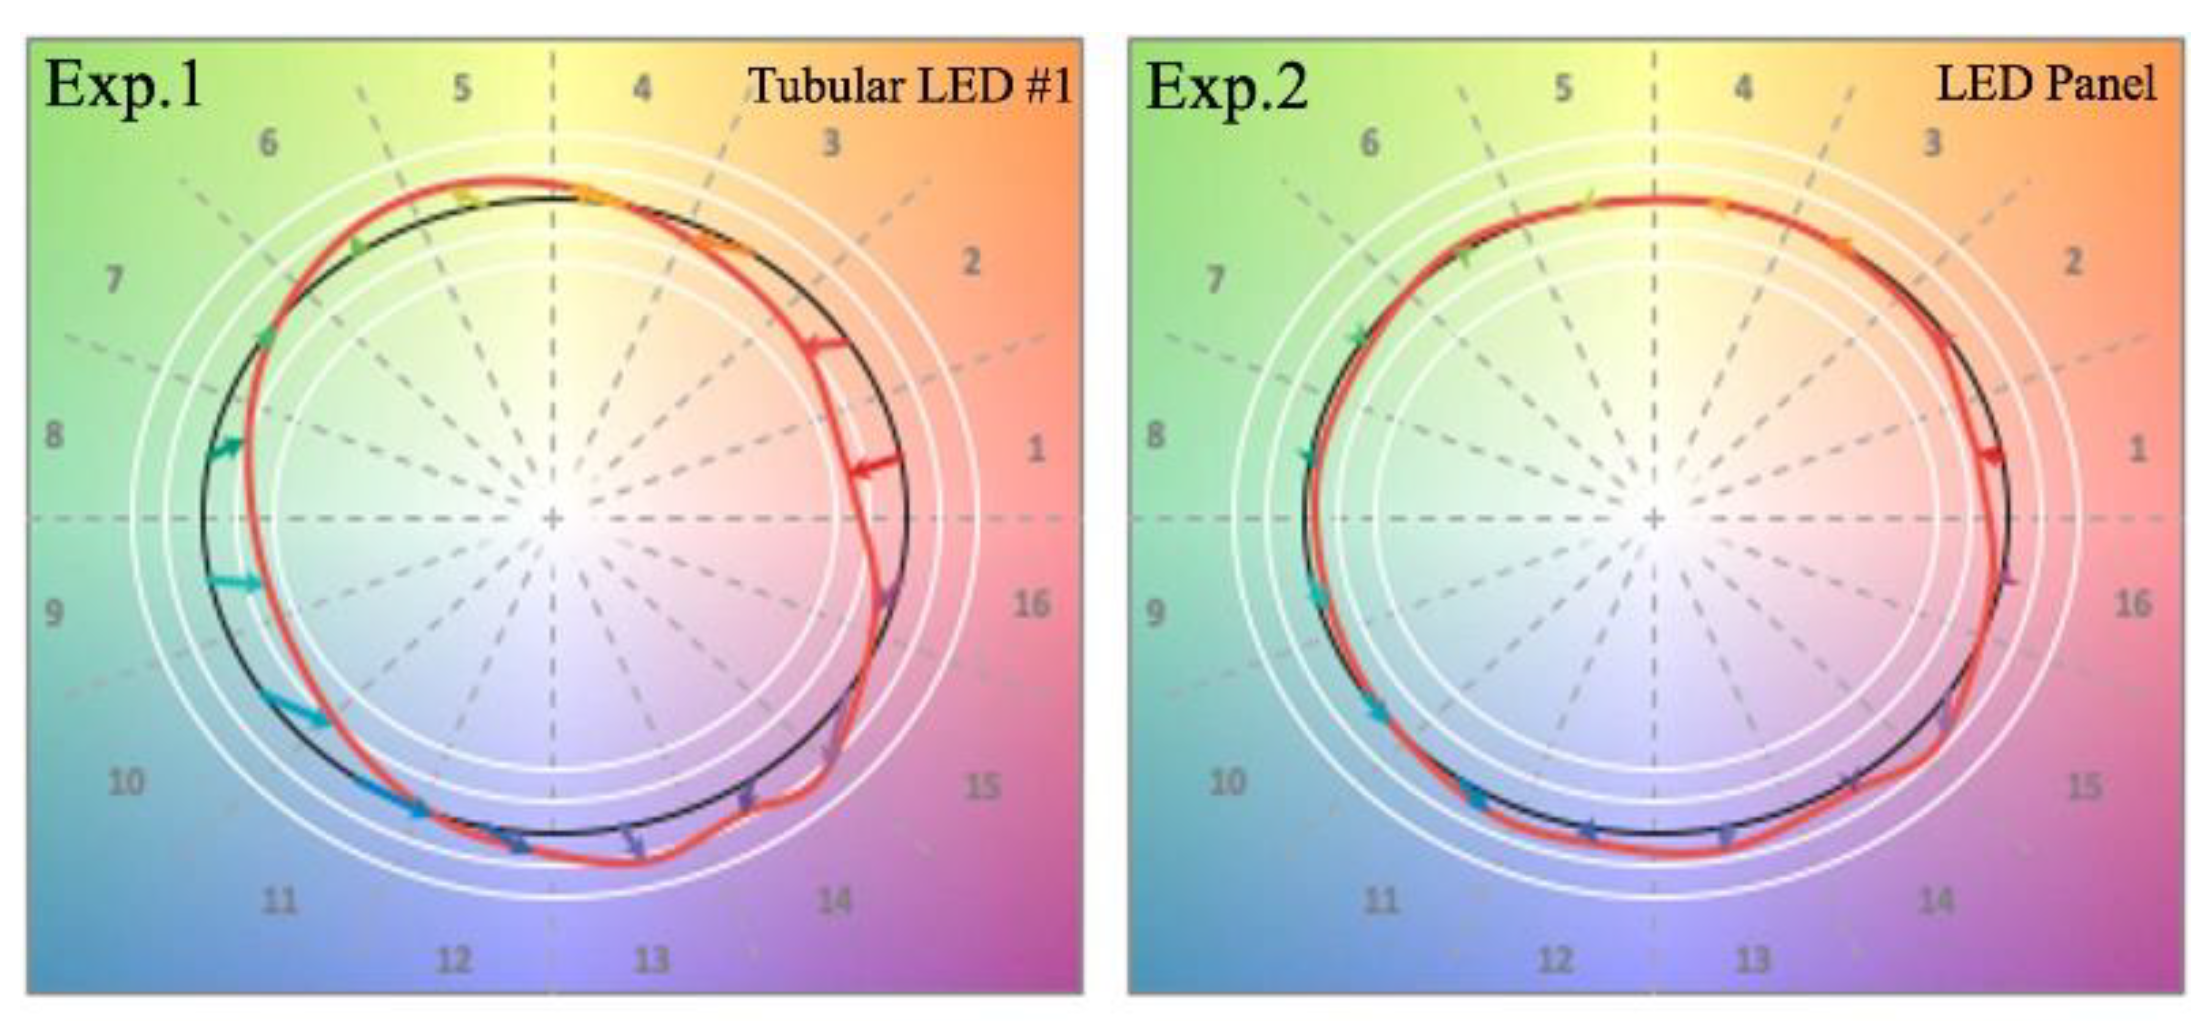
2.2. Experimental Setup

All the experiments took place in a classroom (Figure 2) at Wuhan University, which was equipped with tubular LED and LED panel sources for Experiment 1 (Exp.1) and Experiment 2 (Exp.2), respectively. Specifically, six classic LED tubes were installed at a height of 3 m for Exp.1, and nine commercially available LED panels were installed at the same height for Exp.2. An X-Rite i1 Pro2 spectrophotometer (measurement geometry: 45°/0°; spectral range: 380–730 nm; wavelength step: 10 nm; measuring aperture: 3.5 mm) was used to measure the SPDs. Before each experiment, all the luminaires were switched on for at least 30 min to ensure they had stabilized. After that, an X-Rite i1 Pro2, which had been calibrated by measuring a calibration white tile, was placed on the measurement plane (2 m directly below the light sources) with a standard white tile in the geometry of 45°/0° to obtain SPDs. The SPDs of the six tubular LED sources showed some small variation, probably because they were not new. The nine LED panel sources were previously unused and had consistent SPDs, as shown in Figure 3.
The classroom is located on the ground floor of a four-story building and has an area of 101.2 m2 (11.5 × 8.8 m). It can accommodate 36 students with partitions between each of the desks, ensuring that there was no interference amongst participants during the tests. The illuminance at the centre of each desk was measured with a Testo 540 illuminance meter (measurement range: 0–99,999 lux, measurement accuracy: ±3%), as shown in Table 1. The measuring devices adopted in this study were recalibrated 15 days before the experiments. All the photometric and colorimetric parameters are based on measurements taken prior to the start of formal experiments. Figure 4 visualizes colour gamut properties of the experimental sources.

2.3. Subjects

A total of seventy-nine volunteers (person-time) were invited to participate in this study. All the subjects were Chinese students at Wuhan University, and had passed the Ishihara Colour Vision Test. Generally, they were mainly from eastern (n = 30) and southern (n = 23) China, with a few (n = 3) from western China. In Exp.1, there were 36 subjects—18 males and 18 females—aged between 17 and 19 years (mean = 18.2 years, SD = 0.60). None were aware of the purpose of the research.
In Exp.2, a group of 23 subjects (Group A, 11 males and 12 females, aged between 17 and 19 years, mean = 17.9 years, SD = 0.62) who had taken part in Exp.1 were recruited again. In addition, a second group of 20 naïve subjects (Group B, 5 males and 15 females, aged between 16 and 26 years; mean = 22.0 years, SD = 2.48) were invited to participate. Since there were only 36 desks in the classroom, the two groups of subjects participated in Exp.2 on two separate nights. To be specific, Exp.2 with subjects from Group A was conducted one week after Exp.1, while the subjects in Group B participated in Exp.2 two days later. As noted above, this arrangement was aimed at investigating the possible impact of any practice effect (or degree of proficiency) upon the results of the psychophysical tests.

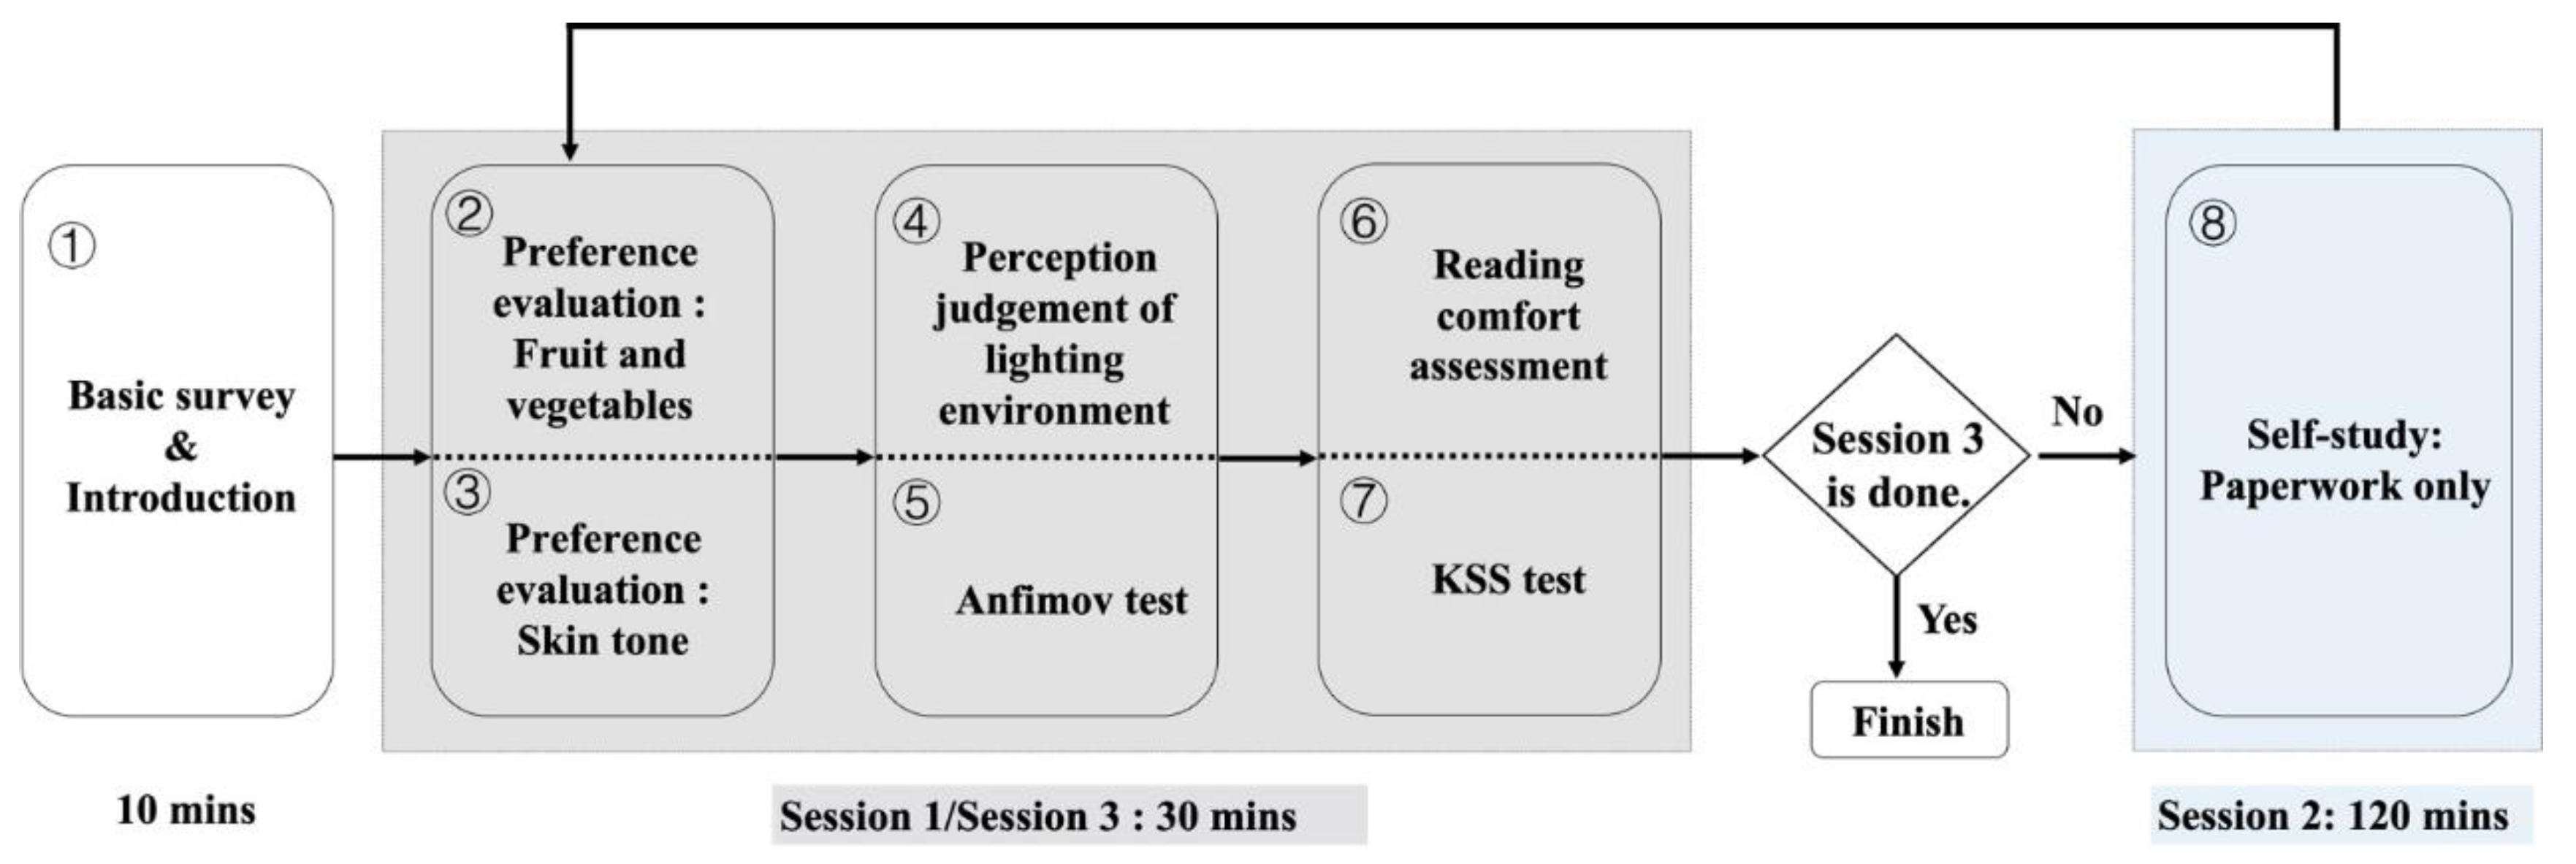
2.4. Experimental Procedure

The procedure for Exp.1 and Exp.2 is shown in Figure 1 above. Before the formal experiments, all the luminaires were switched on for at least 30 min to ensure they had stabilized. Upon arrival, the subjects randomly chose a seat and signed an informed consent form. A general information questionnaire was issued to collect demographic and lighting knowledge information. During that time, the experimenter read the instructions and answered any questions raised by the subjects.
The subjects then consecutively performed the six tasks in Session 1. The first task was to observe a plate of multicoloured fruit and vegetables (including an apple, an orange, a lemon, an onion, a green date, a cucumber, and some cherry tomatoes; Figure 5), and make a subjective preference rating. Note that the fruit and vegetables adopted in Exp.1 and Exp.2 were not the same due to the timescale of the experiments affecting the long-term preservation of the items. In Exp.2, therefore, the fruit and vegetables were selected to be as similar to those use in Exp.1 as possible. A 7-point categorical judgement method was employed to quantify the subjective preference of the illuminated objects. Specifically, the seven scores (−3, −2, −1, 0, 1, 2, 3) corresponded to strongly dislike, moderately dislike, slightly dislike, neutral, slightly like, moderately like, and strongly like, respectively. This method was also adopted for the preference evaluation of the skin tone of the back of the hand of each subject, as shown in Figure 5.
In the third task, subjects were asked to assess the atmosphere of the lighting environment according to four perceptual attributes: Uncomfortable/Comfortable, Cool/Warm, Negative/Active, and Tense/Relaxed. Figure 6 shows the questionnaire used to record these measurements, in which a score of +3 corresponded to the highest degree of comfort, warmth, activeness, and relaxation, respectively.
The subjective evaluation of the lighting was followed by the Anfimov test, which was designed to measure attention and mental workability [49,50,51,52]. As can be seen in Figure 7, the test comprises 1200 uppercase letters printed as a justified paragraph (without hyphenation) on a 210 × 297 mm (A4) sheet of paper. The paragraph consists of 8 letters (A, B, C, E, H, K, N, X) such that each letter randomly appears 150 times (organized into 30 lines with 40 letters in each line). The text was presented in 14 pt Times New Roman font and contained 20 pairs of the two given letters EK (in sequence) whose positions were randomized and counterbalanced. Note that all the Anfimov tests conducted in this study had different text paragraphs with different arrangements of letters. During the test, the subjects were instructed to read the letters one by one (beginning at the upper left) and to underline the letter K in the preset pair EK, all within 2 min. In addition, they needed to mark the last letter they read when the time was up. Each subject had to complete three Anfimov tests in Session 1, each using a different coloured piece of paper—white, yellowish-white, and green, respectively. The order of the three Anfimov tests was randomized and a break of 1 min was allowed between each test.
After the Anfimov test, the reading comfort assessment was performed, during which the subjects had to read the questionnaires used in the Anfimov test (Figure 7) and conduct the assessment of reading comfort. These questionnaires contained sentences in Chinese and English (including the uppercases letters in the Anfimov test), as well as Arabic numerals. The 7-point judgement method was again adopted with a score of +3 relating to the most comfortable reading experience.
At the end of Session 1, the subjective level of sleepiness was measured by the KSS test, a classical approach which corresponds well with the electroencephalography (EEG) test [53]. The KSS test contains nine points, varying from extremely alert (number 1) to very sleepy (number 9). This nine-point scale indicates which level best reflects the subject’s psychophysical state experienced in the previous 10 min [54]. Table 2 gives an overview of the corresponding scales, the original descriptions, and the translated Chinese descriptions, as used in this study. Approximately 30 min were required to complete Session 1.
As described in Section 2.1, a 2-h period of self-study (Session 2) was performed after completion of Session 1, during which all the subjects focused on reviewing textbooks and doing exercises for their college final examinations. In the final session, Session 3, the six tests used in Session 1 were repeated to investigate the impact of the visual fatigue caused in Session 2.

3. Results and Discussion

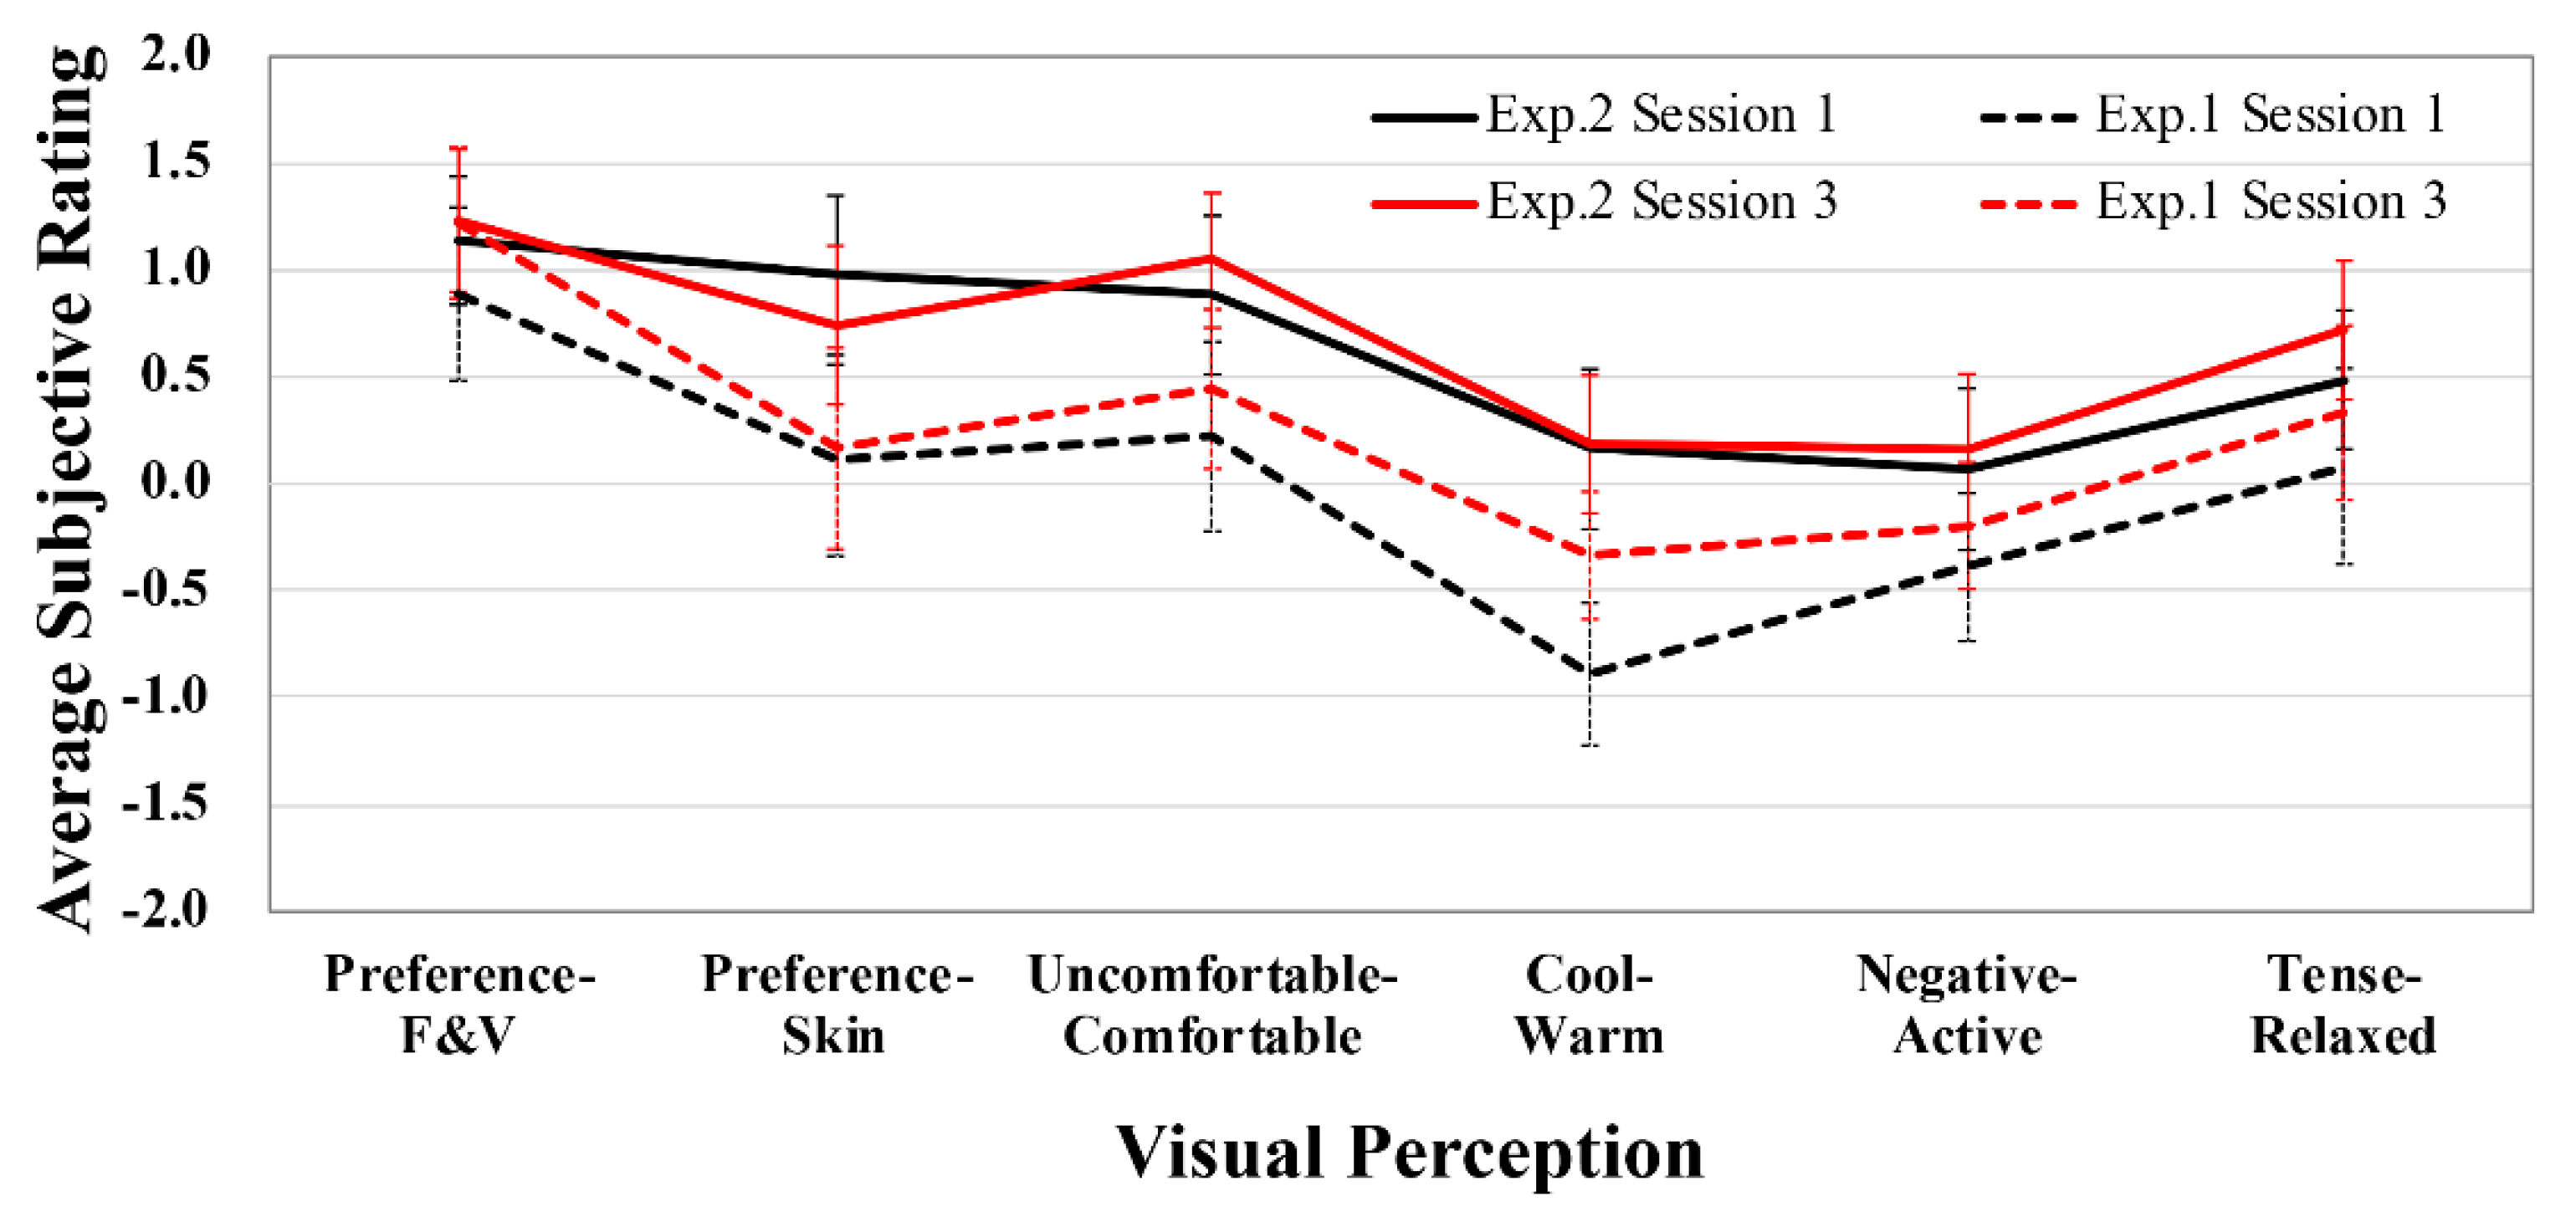
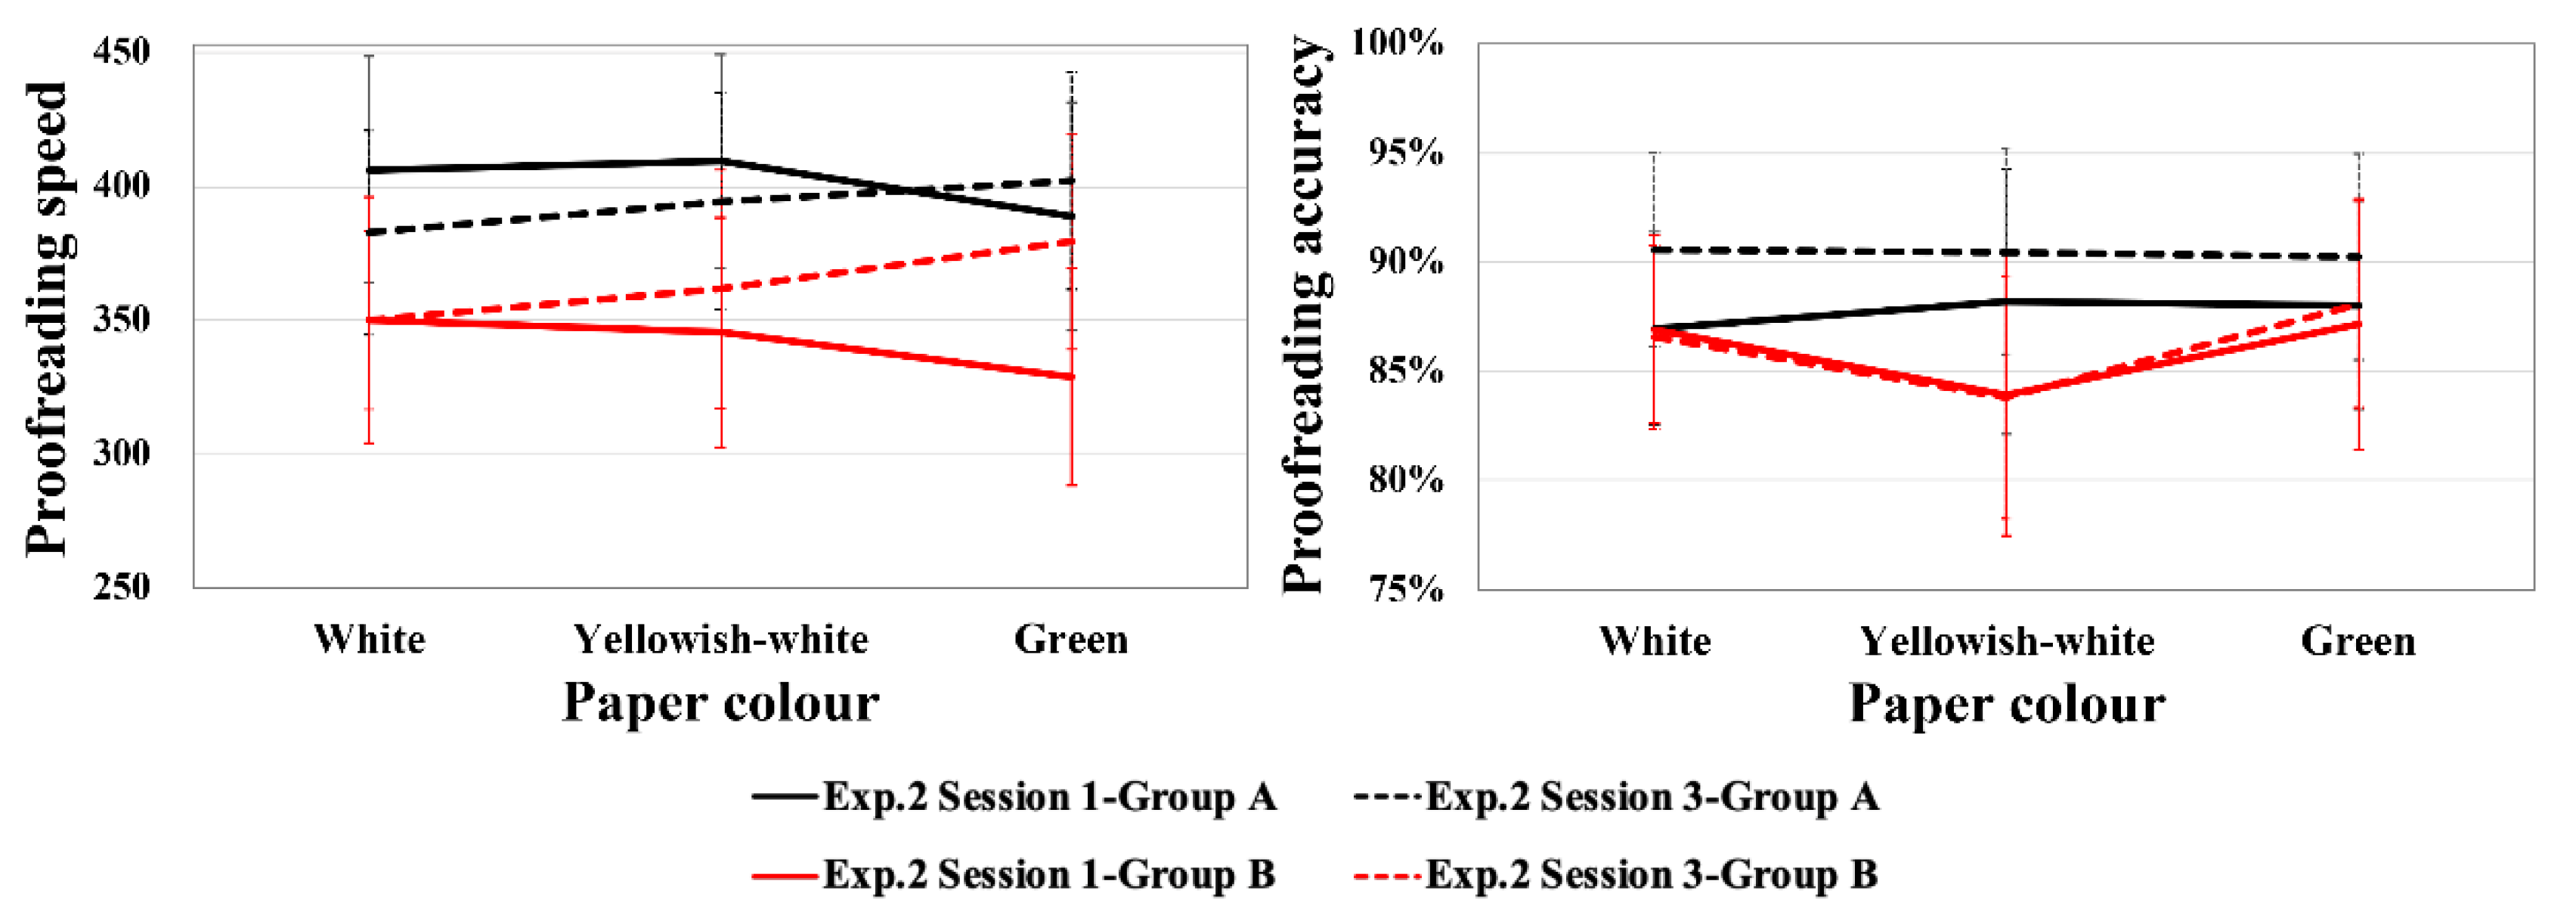
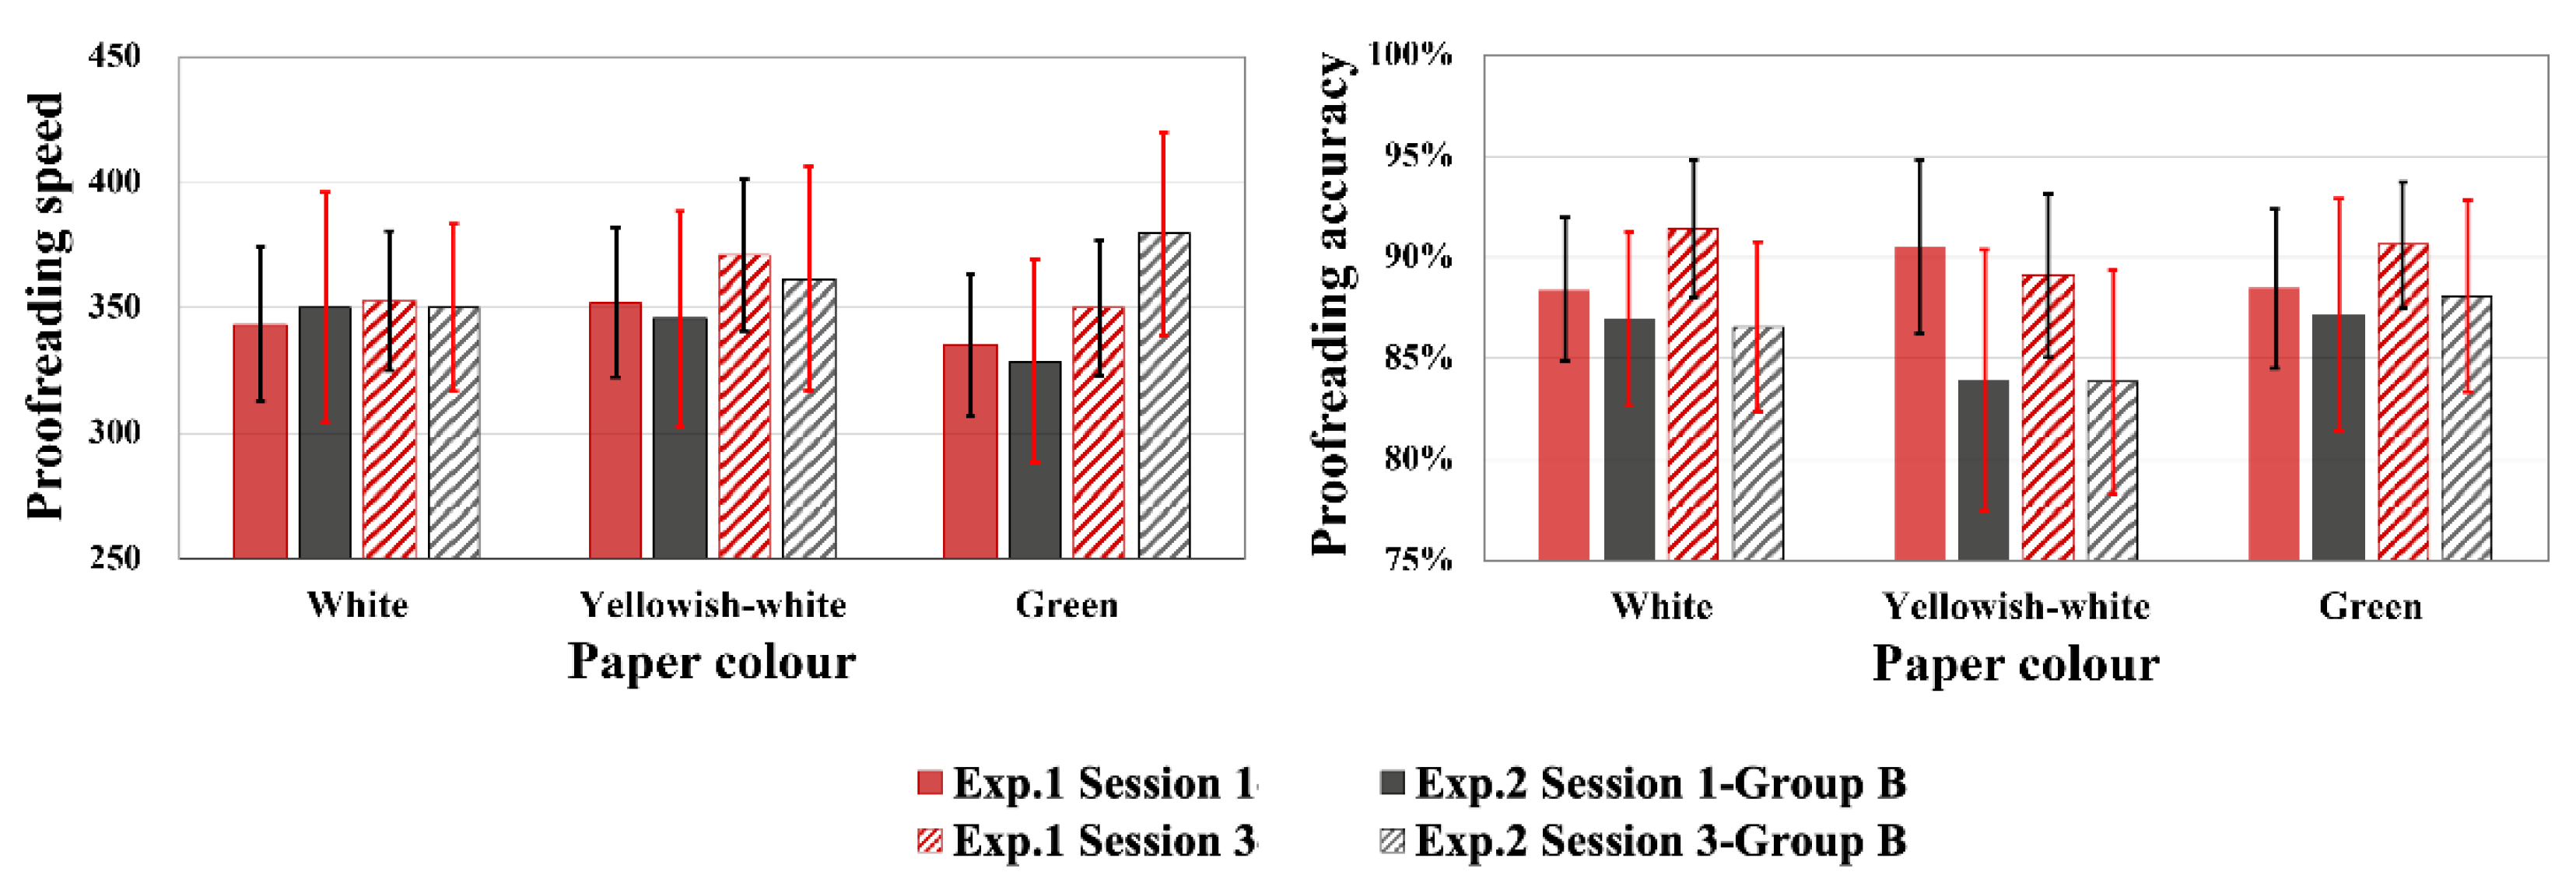
3.1. Results of Colour Preference and Lighting Environment Perception

The overall results of the colour preference (fruit and vegetable; skin tone) and atmosphere perception (Uncomfortable/Comfortable, Cool/Warm, Negative/Active, and Tense/Relaxed) experiments are shown in Figure 8. The rating trends for the four scenarios (i.e., two sessions in two experiments) are consistent and the scores for the scenarios in Exp.2 are significantly higher than the scores in Exp.1. According to a Mann–Whitney U test, there is no significant difference between the results for the experienced (Group A) and the inexperienced subjects (Group B) in Exp.2, in terms of the six aspects (p values > 0.05, with a range from 0.12 to 0.89), which implies that any practice effect for these visual attributes is very small. Thus, in this section, the results of Group A and Group B in Exp.2 were combined for analysis.
The statistical significance (α = 0.05) of the observed effects of the lighting environment, test trial (i.e., first trial in Session 1 and the second trial in Session 3), gender, as well as the interaction effects, was analysed by multivariate analysis of variance (MANOVA) tests using SPSS software. The results are listed in Table 3 and show that the lighting environment has a significant effect (α = 0.05) on all aspects except the preference rating of the fruit and vegetables, whereas no significant effects of test trial and gender were found. Specifically, the insignificant impact of test trial in Table 3 indicates that the visual fatigue caused by the two-hour self-study period in Session 2 did not remarkably influence the visual judgments. It is noteworthy that the p values for gender in terms of fruit and vegetables preference, skin preference, Uncomfortable/Comfortable, and Negative/Active are close to the threshold of significant level (α = 0.05), which suggests the need for further investigation on gender difference in future work.
None of the other two-way or three-way interactions among the three fixed factors, lighting environment, test trial, and gender, were significant (p values were between 0.14 and 0.97 with a mean of 0.73). After the Bonferroni correction (α = 0.05/6 = 0.0083) to account for the multiple significance tests, lighting environment remained significant for skin preference, Uncomfortable/Comfortable, and Cool/Warm. The partial eta-squared values (η2) revealed the effect size of each factor (Table 3). For most of the visual attributes, lighting environment had a major effect on the subjects’ evaluations, since the η2 values were larger than those for the test trial and gender (with an exception for preference of fruit and vegetables).
As shown in Figure 8, the preference ratings of fruit and vegetables are different to those of skin tone. Such a result is consistent with the findings of Tang et al. [55], which aimed to evaluate the differences in appreciation for fruit and vegetables, packaging materials, and skin tone of the hand. These results might be attributed to the difference of colour saturation enhancement between multicoloured objects (fruit and vegetables) and single colour object (skin tone). In addition, the fact that each subject rated their own skin tone but the same group of fruit and vegetables, within one experiment, may be significant.
As stated earlier, the lighting environment of Exp.2 is perceived to be more comfortable, active, relaxed, and warmer. Note that in Exp.2, the light sources were of higher illuminance (Exp.1: ~150 lux; Exp.2: ~300 lux) and lower CCT (Exp.1: ~6600 K; Exp.2: ~5100 K). In related work by Hsieh et al. [56], similar results were obtained where visual perceptions for indoor lighting with a CCT of 5000 K and relatively high illuminance levels were considered to be more comfortable, energetic, relaxed, and warmer than those with a CCT of 6500 K and relatively low illuminance levels. Obviously, current knowledge could not cover the large variations of practical lighting conditions. Thus, we believe further research focusing on the interactive effect of illuminance and CCT should be encouraged, which would enhance the understanding of human visual perceptions regarding different lighting cases.

3.2. Results of Anfimov Test

In earlier studies, the Anfimov test has been commonly used to measure cognitive performance under different classroom lighting conditions [57,58,59]. To our knowledge, however, the impact of a practice effect or the degree of proficiency on the test results has not been investigated. Therefore, to investigate this issue, different groups of subjects with and without test experience in Exp.1 were invited to participate in Exp.2 (i.e., Group A and Group B). Note that results of the repeated tests within a defined experiment (i.e., data from Session 1 and Session 3) could not be used to validate the practice effect, since such repetition was confounded by visual fatigue caused by the two-hour self-study period in Session 2.
The number of letters read per minute was used as a measure of proofreading speed and the proofreading accuracy (PA) was calculated as follows [52]:
PA = (γ ÷ σ) × 100%,
where γ and σ represent the number of times the letter K was correctly underlined by the subjects in the given pair of letters, EK, and the total number of times the letter K should have been underlined in the assessed text (i.e., the text that had been read by the subject), respectively.
Figure 9 illustrates the comparison of the Anfimov test results derived from experienced subjects (Group A) and inexperienced subjects (Group B) in Exp.2. In each experiment, two trials (i.e., tests in Session 1 and Session 3) were conducted. As can be seen, the subjects in Group A, with higher proficiency in the Anfimov test, always performed better in proofreading speed and accuracy than the subjects of Group B. This indicates that the Anfimov test is heavily influenced by the practice effect and this must be taken into consideration when implementing the test in further studies. In addition, the difference between test results of Session 1 and Session 3 for the two experiments was not so clear. A possible explanation is that although subjects might perform better in the second round of tests (i.e., Session 3), the visual fatigue caused by the two-hour study in Session 2 offset that improvement.
The mean values of the subjects’ proofreading speed and accuracy from Exp.1 and Exp.2 are shown in Figure 10. To remove the influence of the practice effect (proficiency), only the results of Group B in Exp.2 and the data of Exp.1 are shown. There is little difference between the results of Exp.1 and Exp.2 in most of the six comparisons (3 paper colours × 2 sessions). The difference between Exp.1 and Exp.2 in terms of the proofreading accuracy using black text on yellowish-white paper (Figure 10, right) is relatively larger. However, as verified by the Mann–Whitney U test, there is actually no significant difference between Exp.1 (~6600 K–150 lux) and Exp.2 (~5100 K–300 lux) for all the six comparisons (p values > 0.05). That is, there is no significant effect of lighting environment on the Anfimov test results. Weng et al. [57] found similar results, i.e., there was no significant difference between the results derived from the lighting conditions defined by 5000 K–300 lux and 6500 K–150 lux. In addition, the Mann–Whitney U test indicates that the test trial, paper colour, and gender have no statistically significant influence on the results of the Anfimov test (p values > 0.05).

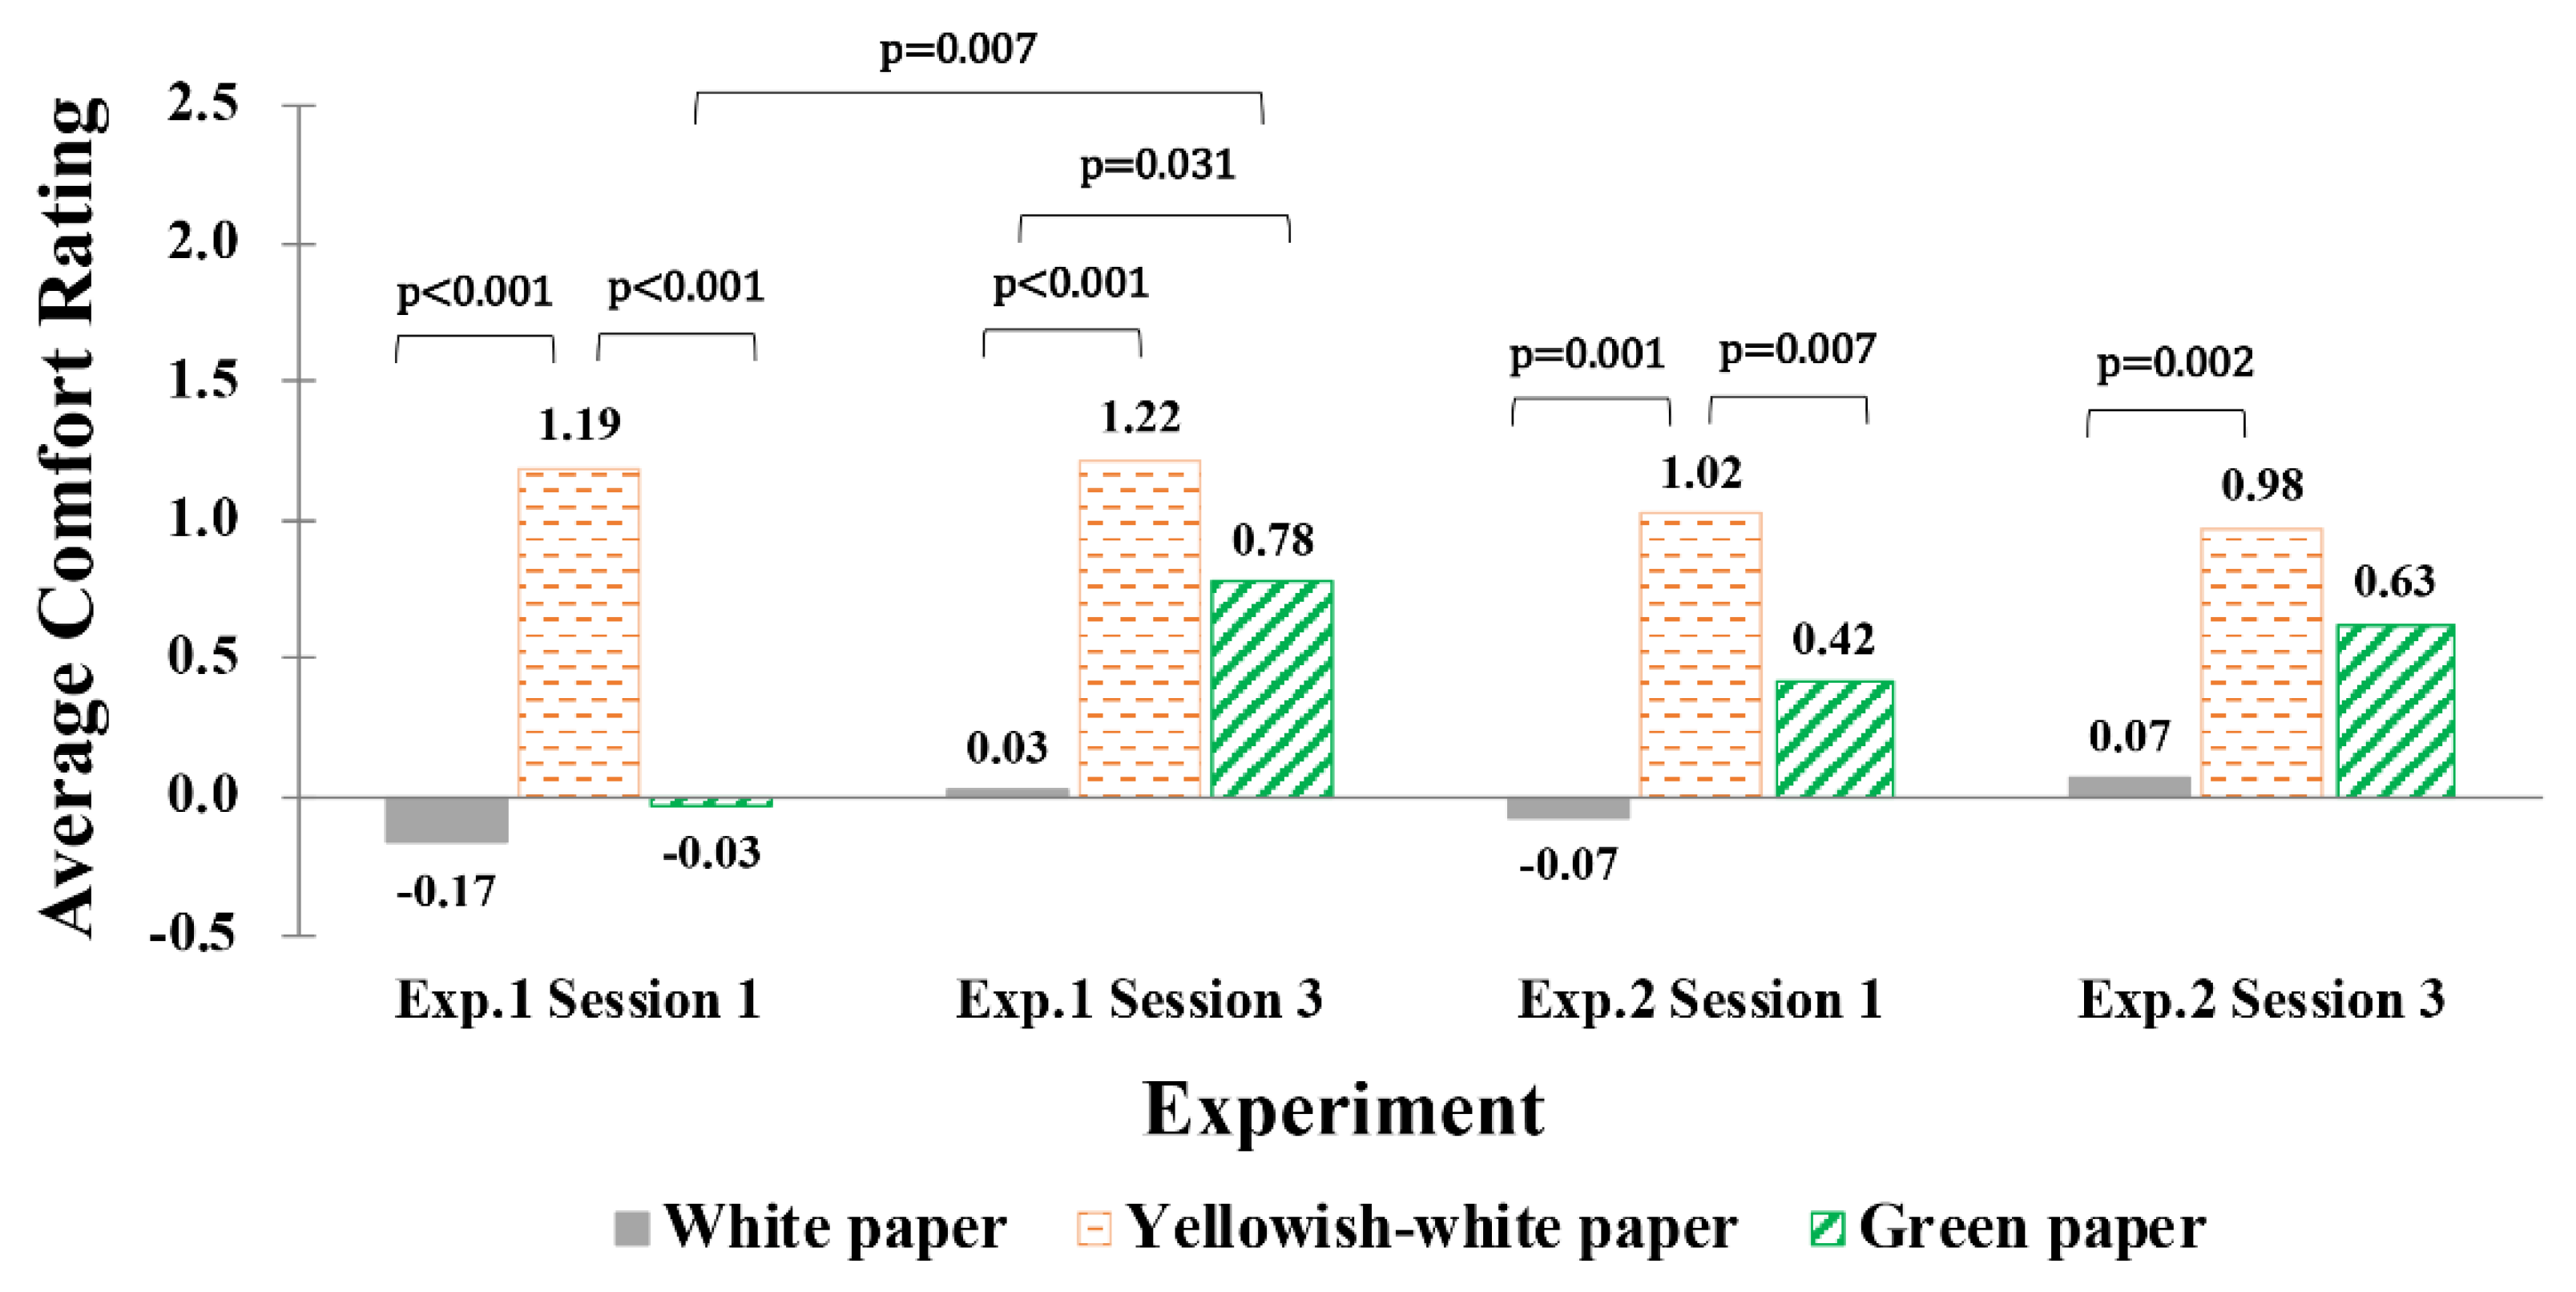
3.3. Results of Reading Comfort Assessment

According to the results of the Mann–Whitney U test, no significant difference was found between the reading comfort ratings of experienced subjects (Group A) and inexperienced subjects (Group B) in Exp.2. Thus, no practice effect was found and the data in Exp.2 were combined.
The effects of paper colour, lighting environment, test trial, as well as gender, on reading comfort were investigated using a MANOVA test (Table 4). The hypothesis was that paper colour, lighting environment, and their interaction effect might have a significant impact on the rating of reading comfort. As shown in Table 4, however, only paper colour exhibited a significant influence (p < 0.001, with the largest η2 value) and the impact of lighting was insignificant.
The results of the MANOVA test also show that no other effects of gender and test trial (including interaction effects) were significant. Thus, it can be concluded that visual fatigue does not have a significant impact on reading comfort assessments. It should also be noted that the p value for gender was only slightly higher than 0.05 (0.052), which is consist with the results in Section 3.1 above. This finding further suggests that the effect of gender should not be underestimated and deserves further investigation.
The post hoc test for the significant main effects (paper colour) revealed that the comfort ratings amongst different paper colours were significantly different at the 95% confidence level: p < 0.001 for white paper vs. yellowish-white paper; p = 0.005 for white paper vs. green paper; p < 0.001 for yellowish-white paper vs. green paper.
Figure 11 illustrates the average scores of the comfort rating and the results of a Wilcoxon Signed Rank Test, which was used to further verify the impact of paper colour on perceived reading comfort in Exp.1 and Exp.2. The results showed that the yellowish-white paper was related to the most comfortable reading experience (p values < 0.05), while the white paper was rated as least comfortable.
Another finding of interest is that the average comfort rating score for green paper increases significantly after the 2-h self-study session (p = 0.007) in Exp.1, which was not found in Exp.2 (in Exp.2, the increment does exist but is not significant). This result could be related to the interaction between the lighting environment and the visual perception of green paper, which should be further clarified by future work.

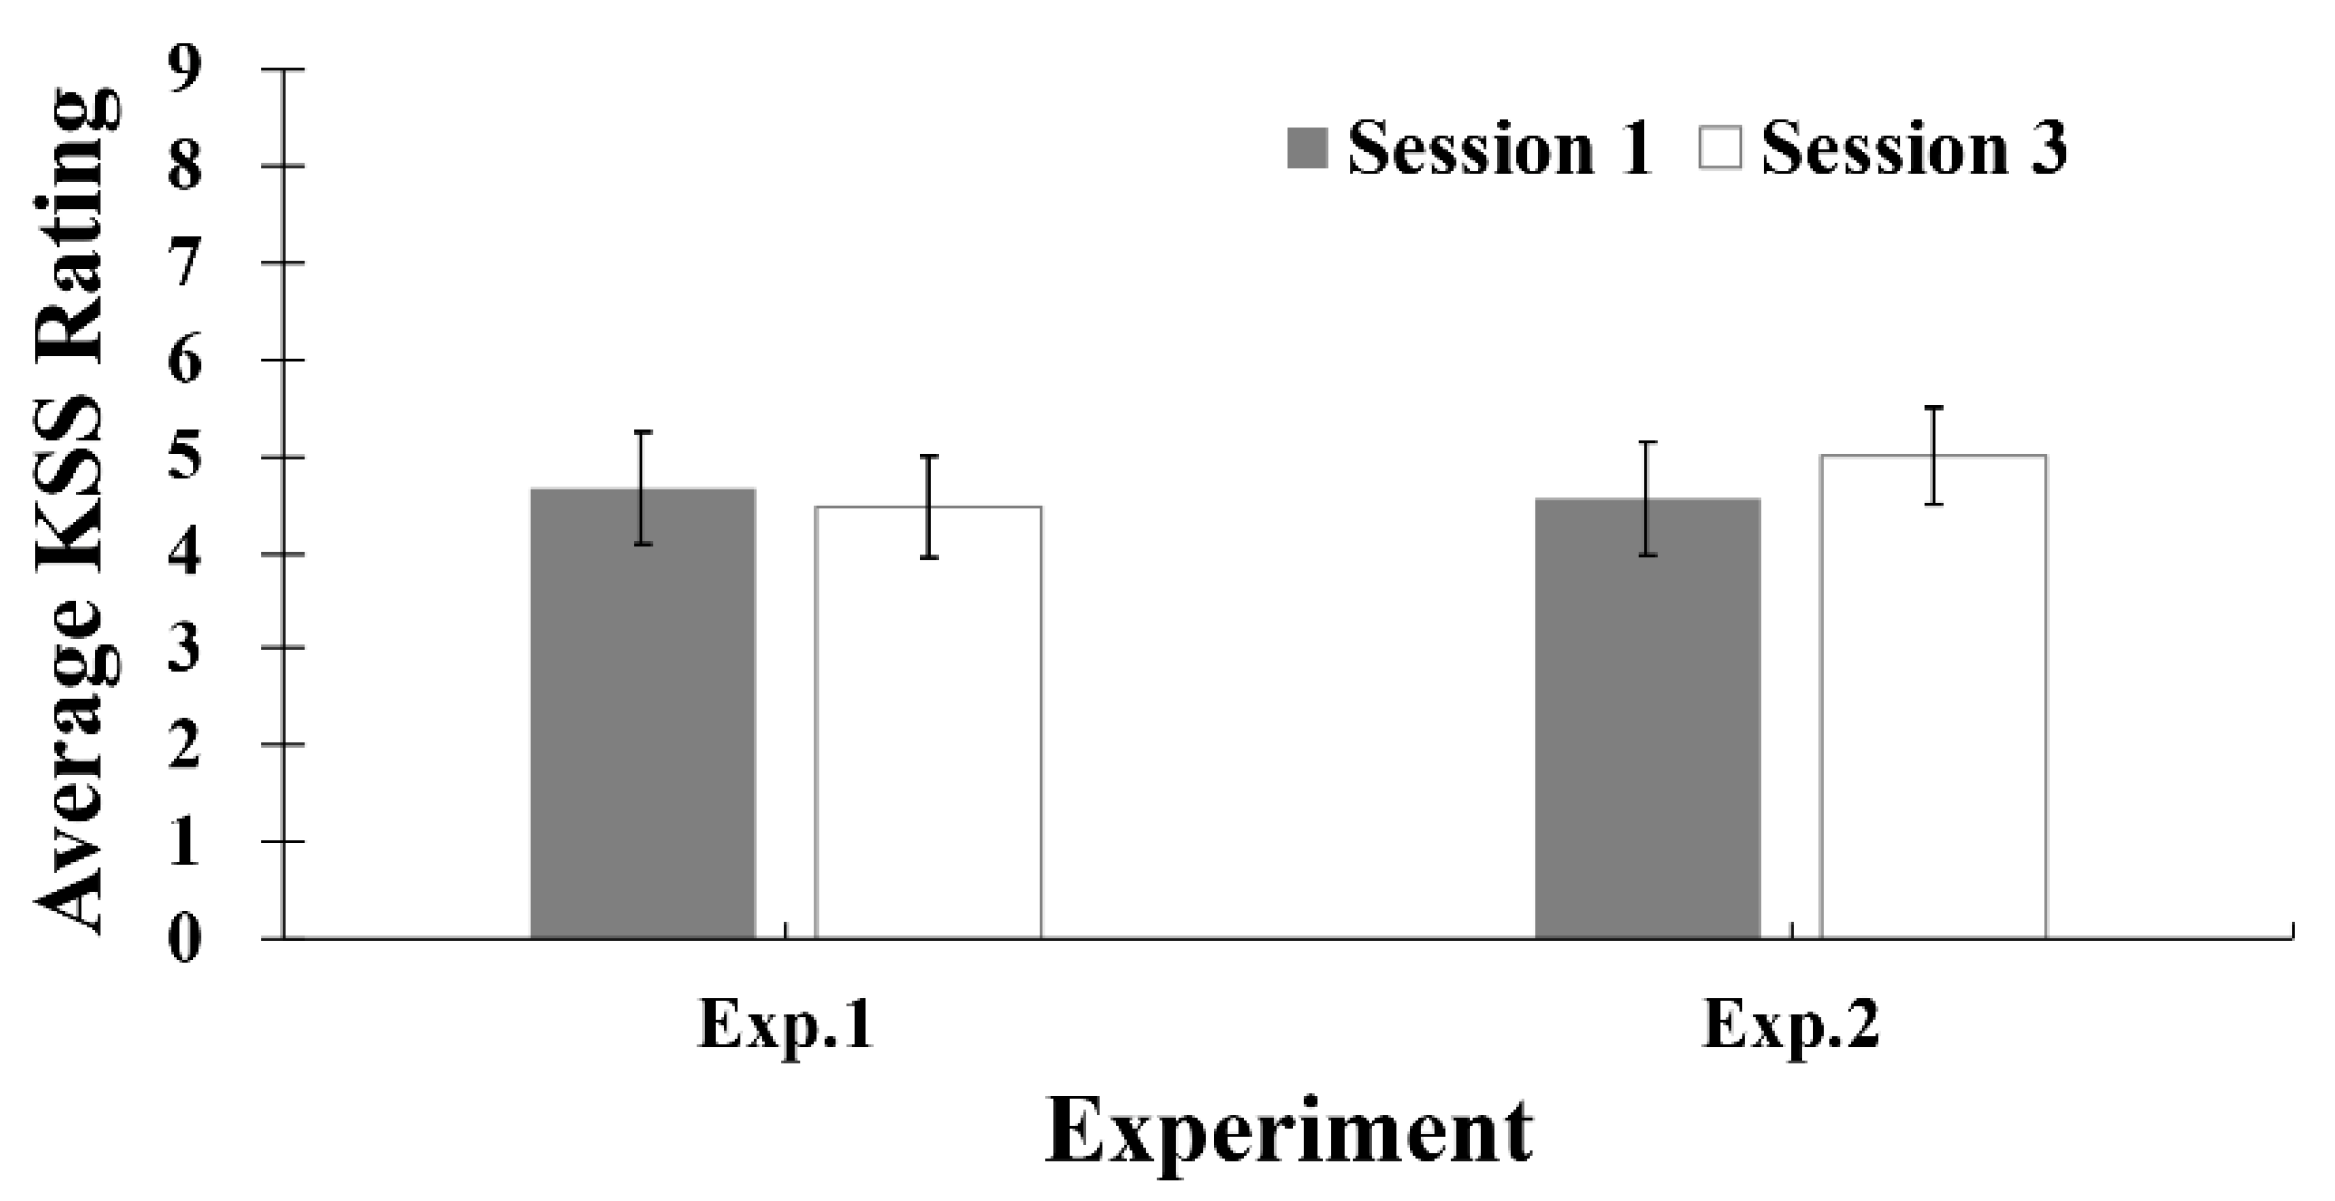
3.4. Results of KSS Test

Figure 12 gives an overview of the subjects’ alertness monitored by means of the KSS test. Similarly, there was no statistical differences between the KSS ratings of experienced subjects (Group A, Exp.2) and inexperienced subjects (Group B, Exp.2), as tested by a Mann–Whitney U test (Session 1: p = 0.26; Session 3: p = 0.89). Thus, for the KSS test, all the data in Exp.2 were combined.
As shown in Figure 12, the average alertness was always located between “some signs of sleepiness” (number 6) and “rather alert” (number 4). Surprisingly, the average KSS ratings of Session 1 and Session 3 were almost identical, which indicates that the visual fatigue caused by the two-hour self-study period in Session 2 did not remarkably impact the psychophysical state (sleepiness) of the subjects. This was unexpected and might be due to the intense concentration shown by the subjects during Session 2. As noted earlier, the subjects were busy preparing for their final exams when this experiment was carried out. Therefore, during Session 2, all the subjects worked very hard and thus, kept alert. In further work, it would be of interest to conduct a comparative experiment where the students are not under any pressure (e.g., when they have a relaxing time reading). Despite this, we believe this study has simulated a common and meaningful case for classroom lighting.
As shown in Table 5, there was no significant impact of lighting environment and gender (including interaction effects) on the subjects’ alertness (p > 0.05). Similar results were also obtained by Linhart and Scartezzini [60] who compared two lighting environments (average illuminance 232 vs. 352 lux, CCT not reported) and found that there was no measurable influence of lighting on the participants’ alertness as quantified by the KSS test. Viola et al. declared, however, that self-reported alertness in the KSS test was improved under blue-enriched white light with a higher CCT [61]. There are two possible explanations for such inconsistency. First, the difference in CCT values between Exp.1 and Exp.2 in our study was not large enough to affect alertness. Specifically, the average CCT values in Exp.1 and Exp.2 were 6600 and 5100 K (∆CCT = 1500 K), respectively, while in Viola et al. [61], the test CCTs were 4000 and 17,000 K (∆CCT = 13,000 K). Second, the interaction effect of CCT and illuminance may also lead to the insignificant differences in KSS results. As shown in Table 1, the CCT values of Exp.1 were higher but the illuminance level of Exp.2 was higher (approximately 300 vs. 150 lux).
In summary, a significant impact of classroom lighting on visual perception (i.e., skin preference, multi-dimensional lighting atmosphere evaluation) was found, while no measured effects of lighting were observed on the participant’s reading comfort, attention, and alertness. The impact of visual fatigue generated by a two-hour, high-intensity, self-study period was insignificant. The influence of proficiency in the Anfimov test was shown, suggesting that a full consideration of a practice effect should be considered when using this or similar tests (e.g., Landolt rings [60] or the D2 test [62]). To solve this, use of a between-subject design in the experimental protocol would be useful. In addition, there was imperfect experimental control due to the inherent limitation of any field study [42]. Thus, as suggested by recent researchers [42,63], multiple statistical tools were used to demonstrate convincing conclusions.

4. Conclusions

This paper describes a field study in which the impact of classroom lighting on students’ visual perception and cognitive performance was investigated. Seventy-nine college students were tested on aspects of colour preference, atmosphere perception, reading comfort, self-reported alertness, and attention. A significant influence of the lighting environment on skin preference and atmosphere perception (i.e., Uncomfortable/Comfortable, Cool/Warm, Negative/Active, and Tense/Relaxed) was found, while no measured effects of indoor lighting were observed on reading comfort, alertness, and attention. In addition, the influence of visual fatigue generated by a two-hour self-study period was found to be insignificant. Paper colour was demonstrated to be important for reading comfort and the practice effect on the proofreading speed and accuracy of the Anfimov test was also demonstrated. These findings should help to further understand the impact of classroom lighting on the visual perception and cognitive performance of college students.

Author Contributions

Conceptualization, Q.L., Z.L. (Zhijiang Li), M.R.P. and G.Z.; Data curation, Z.L. (Zhijiang Li), Z.L. (Zhen Liu) and Z.H. (Zhen Hou); Formal analysis, M.R.P., Z.L. (Zhen Liu) and H.G.; Investigation, Q.L. and Z.H. (Zheng Huang); Methodology, Q.L., Z.H. (Zheng Huang), Z.L. (Zhijiang Li) and G.Z.; Software, Z.L. (Zhijiang Li); Validation, Z.H. (Zheng Huang) and H.G.; Writing—original draft, Q.L. and Z.L. (Zhijiang Li); Writing—review & editing, M.R.P. All authors have read and agreed to the published version of the manuscript.

Funding

This work was supported by the National Key Research and Development Program of China, Grant number 2018YFB10046 and National Natural Science Foundation of China, grant number 61505149.

Conflicts of Interest

The authors declare no conflict of interest.

References

  1. Jerome, C.; Nickerson, D. Color rendering of light sources: CIE method of specification and its application. Illum. Eng. 1965, 60, 262–271. [Google Scholar]
  2. Davis, W.; Ohno, Y. Color quality scale. Opt. Eng. 2010, 49, 033602. [Google Scholar] [CrossRef] [Green Version]
  3. JostBoissard, S.; Fontoynont, M.; BlancGonnet, J. Perceived lighting quality of LED sources for the presentation of fruit and vegetables. J. Mod. Opt. 2009, 56, 1420–1432. [Google Scholar] [CrossRef]
  4. Jost-Boissard, S.; Avouac, P.; Fontoynont, M. Assessing the colour quality of LED sources: Naturalness, attractiveness, colourfulness and colour difference. Lighting Res. Technol. 2014, 47, 769–794. [Google Scholar] [CrossRef]
  5. Huang, Z.; Liu, Q.; Liu, Y.; Pointer, M.R.; Luo, M.R.; Wang, Q.; Wu, B. Best lighting for jeans, part 1: Optimising colour preference and colour discrimination with multiple correlated colour temperatures. Lighting Res. Technol. 2018, 51, 1208–1223. [Google Scholar] [CrossRef]
  6. Liu, Y.; Liu, Q.; Huang, Z.; Pointer, M.R.; Rao, L.; Hou, Z. Optimising colour preference and colour discrimination for jeans under 5500 K light sources with different Duv values. Optik 2020, 208, 163916. [Google Scholar] [CrossRef]
  7. Huang, Z.; Liu, Q.; Westland, S.; Pointer, M.R.; Luo, M.R.; Xiao, K. Light dominates colour preference when correlated colour temperature differs. Lighting Res. Technol. 2017, 50, 995–1012. [Google Scholar] [CrossRef]
  8. Bodrogi, P.; Lin, Y.; Xiao, X.; Stojanovic, D.; Khanh, T.Q. Intercultural observer preference for perceived illumination chromaticity for different coloured object scenes. Lighting Res. Technol. 2015, 49, 305–315. [Google Scholar] [CrossRef]
  9. Islam, M.S.; Dangol, R.; Hyvärinen, M.; Bhusal, P.; Puolakka, M.; Halonen, L. User preferences for LED lighting in terms of light spectrum. Lighting Res. Technol. 2013, 45, 641–665. [Google Scholar] [CrossRef]
  10. Wang, Q.; Xu, H.; Zhang, F.; Wang, Z. Influence of color temperature on comfort and preference for LED indoor lighting. Optik 2017, 129, 21–29. [Google Scholar] [CrossRef]
  11. Huang, Z.; Liu, Q.; Pointer, M.R.; Chen, W.; Liu, Y.; Wang, Y. Color quality evaluation of Chinese bronzeware in typical museum lighting. J. Opt. Soc. Am. A 2020, 37, A170–A180. [Google Scholar] [CrossRef] [PubMed]
  12. Huang, Z.; Liu, Q.; Pointer, M.R.; Luo, M.R.; Wu, B.; Liu, A. White lighting and colour preference, Part 1: Correlation analysis and metrics validation. Lighting Res. Technol. 2019, 52, 5–22. [Google Scholar] [CrossRef]
  13. Huang, Z.; Liu, Q.; Luo, M.R.; Pointer, M.R.; Wu, B.; Liu, A. The whiteness of lighting and colour preference, Part 2: A meta-analysis of psychophysical data. Lighting Res. Technol. 2019, 52, 23–35. [Google Scholar] [CrossRef]
  14. David, A.; Fini, P.T.; Houser, K.W.; Ohno, Y.; Royer, M.P.; Smet, K.A.G.; Wei, M.; Whitehead, L. Development of the IES method for evaluating the color rendition of light sources. Opt. Express 2015, 23, 15888–15906. [Google Scholar] [CrossRef] [PubMed]
  15. Smet, K.A.G.; Ryckaert, W.R.; Pointer, M.R.; Deconinck, G.; Hanselaer, P. A memory colour quality metric for white light sources. Energy Build. 2012, 49, 216–225. [Google Scholar] [CrossRef]
  16. Thornton, W.A. Color-Discrimination Index. J. Opt. Soc. Am. 1972, 62, 191–194. [Google Scholar] [CrossRef]
  17. Liu, Q.; Huang, Z.; Xiao, K.; Pointer, M.R.; Westland, S.; Luo, M.R. Gamut Volume Index: A color preference metric based on meta-analysis and optimized colour samples. Opt. Express 2017, 25, 16378–16391. [Google Scholar] [CrossRef]
  18. Chen, H.S.; Chou, C.J.; Luo, H.W.; Luo, M.R. Museum lighting environment: Designing a perception zone map and emotional response models. Lighting Res. Technol. 2015, 48, 589–607. [Google Scholar] [CrossRef]
  19. Wei, M.; Houser, K.W.; CIE. Colour Discrimination of Seniors with and Without Cataract Surgery under Illumination from Two Fluorescent Lamp Types; CIE Central Bureau: Vienna, Austria, 2012; pp. 359–368. [Google Scholar]
  20. Xu, L.; Luo, M.R.; Pointer, M. The development of a colour discrimination index. Lighting Res. Technol. 2017, 50, 681–700. [Google Scholar] [CrossRef]
  21. Feng, X.; Xu, W.; Han, Q.; Zhang, S. LED light with enhanced color saturation and improved white light perception. Opt. Express 2016, 24, 573–585. [Google Scholar] [CrossRef]
  22. Brainard, G.C.; Hanifin, J.P.; Greeson, J.M.; Byrne, B.; Glickman, G.; Gerner, E.; Rollag, M.D. Action Spectrum for Melatonin Regulation in Humans: Evidence for a Novel Circadian Photoreceptor. J. Neurosci. 2001, 21, 6405. [Google Scholar] [CrossRef] [PubMed] [Green Version]
  23. Thapan, K.; Arendt, J.; Skene, D.J. An action spectrum for melatonin suppression: Evidence for a novel non-rod, non-cone photoreceptor system in humans. J. Physiol. 2001, 535, 261–267. [Google Scholar] [CrossRef] [PubMed]
  24. Figueiro, M.G.; Nagare, R.; Price, L.L.A. Non-visual effects of light: How to use light to promote circadian entrainment and elicit alertness. Lighting Res. Technol. 2017, 50, 38–62. [Google Scholar] [CrossRef] [PubMed]
  25. Rea, M.S.; Bullough, J.D.; Figueiro, M.G. Phototransduction for human melatonin suppression. J. Pineal Res. 2002, 32, 209–213. [Google Scholar] [CrossRef] [PubMed]
  26. Gentile, N.; Goven, T.; Laike, T.; Sjoberg, K. A field study of fluorescent and LED classroom lighting. Lighting Res. Technol. 2016, 50, 631–650. [Google Scholar] [CrossRef]
  27. Cajochen, C.; Münch, M.; Kobialka, S.; Kräuchi, K.; Steiner, R.; Oelhafen, P.; Orgül, S.; Wirz-Justice, A. High Sensitivity of Human Melatonin, Alertness, Thermoregulation, and Heart Rate to Short Wavelength Light. J. Clin. Endocrinol. Metab. 2005, 90, 1311–1316. [Google Scholar] [CrossRef] [PubMed] [Green Version]
  28. Sleegers, P.J.C.; Moolenaar, N.M.; Galetzka, M.; Pruyn, A.; Sarroukh, B.E.; van der Zande, B. Lighting affects students’ concentration positively: Findings from three Dutch studies. Lighting Res. Technol. 2012, 45, 159–175. [Google Scholar] [CrossRef] [Green Version]
  29. Hayano, J.; Ueda, N.; Kisohara, M.; Yoshida, Y.; Tanaka, H.; Yuda, E. Non-REM Sleep Marker for Wearable Monitoring: Power Concentration of Respiratory Heart Rate Fluctuation. Appl. Sci. Basel 2020, 10, 3336. [Google Scholar] [CrossRef]
  30. Figueiro, M.; Bullough, J.; Bierman, A.; Fay, C.; Rea, M. On light as an alerting stimulus at night. Acta Neurobiol. Exp. 2007, 67, 171–178. [Google Scholar]
  31. Bellia, L.; Bisegna, F.; Spada, G. Lighting in indoor environments: Visual and non-visual effects of light sources with different spectral power distributions. Build. Environ. 2011, 46, 1984–1992. [Google Scholar] [CrossRef]
  32. van Bommel, W.J.M. Non-visual biological effect of lighting and the practical meaning for lighting for work. Appl. Erg. 2006, 37, 461–466. [Google Scholar] [CrossRef] [PubMed]
  33. Rea, M.S.; Bierman, A. A new rationale for setting light source luminous efficacy requirements. Lighting Res. Technol. 2016, 50, 340–359. [Google Scholar] [CrossRef]
  34. Boyce, P.R. Review: The Impact of Light in Buildings on Human Health. Indoor Built Environ. 2010, 19, 8–20. [Google Scholar] [CrossRef]
  35. Vinh, Q.T.; Bodrogi, P.; Khanh, T.Q. Preliminary measure for the characterization of the usefulness of light sources. Opt. Express 2018, 26, 14538–14551. [Google Scholar] [CrossRef] [PubMed]
  36. Bodrogi, P.; Vinh, Q.T.; Khanh, T.Q. Opinion: The usefulness of light sources in human centric lighting. Lighting Res. Technol. 2017, 49, 292. [Google Scholar] [CrossRef] [Green Version]
  37. Boyce, P. Editorial: Exploring human-centric lighting. Lighting Res. Technol. 2016, 48, 101. [Google Scholar] [CrossRef]
  38. Giang, D.T.; La, T.L.; Tien, T.Q.; Duong, P.H.; Tong, Q.C. A Simple Designed Lens for Human Centric Lighting Using LEDs. Appl. Sci. Basel 2020, 10, 343. [Google Scholar] [CrossRef] [Green Version]
  39. Kim, A.A.; Wang, S.; McCunn, L.J. Building value proposition for interactive lighting systems in the workplace: Combining energy and occupant perspectives. J. Build. Eng. 2019, 24, 100752. [Google Scholar] [CrossRef]
  40. Halonenn, L.; Puolakka, M.; Ayama, M.; Bodrogi, P.; Bullough, J.; Burini, E.C.; Crawford, D.L.; ChangSoon, K.; DaPos, O.; Goodman, T.; et al. CIE 191: 2010 Recommended System for Mesopic Photometry Based on Visual Performance; COLOR Research and Application: Vienna, Austria, 2010; 73p, ISBN 978 3 901906 88 6. [Google Scholar]
  41. DIN. Optical Radiation Physics and Illuminating Engineering—Part 100: Non-Visual Effects of Ocular Light on Human Beings—Quantities, Symbols and Action Spectra; DE-DIN: Berlin, Germany, 1 June 2009; Volume DIN V 5031-100, p. 16. [Google Scholar]
  42. Veitch, J.A.; Fotios, S.A.; Houser, K.W. Judging the Scientific Quality of Applied Lighting Research. LEUKOS 2019, 15, 97–114. [Google Scholar] [CrossRef] [Green Version]
  43. Li, Z.J.; Li, N. Research on Paper Whiteness based on Visual Comfort. In Progress in Environmental Protection and Processing of Resource, Pts 1-4; Tang, X., Zhong, W., Zhuang, D., Li, C., Liu, Y., Eds.; Trans Tech Publications: Hurden, Switzerland, 2013; Volume 295–298, pp. 543–546. [Google Scholar]
  44. Li, Z.J.; Meng, Q.J. Research on the Whiteness of Eye-Protection Wrapping Paper. In Research on Food Packaging Technology; Yun, O., Min, X., Li, Y.T., Xunting, L., Eds.; Trans Tech Publications: Hurden, Switzerland, 2014; Volume 469, pp. 91–94. [Google Scholar]
  45. Zhang, L.H.; Jia, D.; Jia, Y.D. Clinical research of visual fatigue and binocular vision. Int. J. Ophthalmol. 2008, 11, 2269–2270. [Google Scholar]
  46. SU Leiyan, Z.Z. Recent advances in the pathogenesis and therapy of asthenopia. China J. Chin. Ophthalmol. 2010, 3, 183–185. [Google Scholar]
  47. Königs, S.; Mayr, S.; Buchner, A. A common type of commercially available LED light source allows for colour discrimination performance at a level comparable to halogen lighting. Ergonomics 2019, 62, 1462–1473. [Google Scholar] [CrossRef]
  48. Fine, B.J.; Kobrick, J.L. Field Dependence, Practice, and Low Illumination as Related to the Farnsworth-Munsell 100-Hue Test. Percept. Mot. Ski. 1980, 51, 1167–1177. [Google Scholar] [CrossRef] [PubMed]
  49. Varnavsky, A. Evaluation the psychological state of a learner in the e-learning system. Сoвременные инфoрмациoнные технoлoгии и ИТ-oбразoвание 2016, 12. Available online: http://ceur-ws.org/Vol-1761/paper11.pdf (accessed on 21 October 2020).
  50. Palamarchuk, A.I. Investigation of Conditional Differential Inhibition in the Cerebral Cortex in Middle-Aged Male Patients with Essential Hypertension Stage II during Operative Activity. New Armen. Med. J. 2018, 12, 54–61. [Google Scholar]
  51. Prontenko, K.; Griban, G.; Liudovyk, T.; Kozibroda, L.; Tkachenko, P.; Kostyuk, Y.; Zhukovskyi, Y. Influence of Kettlebell Lifting Classes on the Level of Professionally Important Psychological Qualities and the Emotional State of Cadets from Higher Military Educational Institutions. J. Phys. Educ. Sport 2018, 18. Available online: https://www.questia.com/read/1P4-2112137808/influence-of-kettlebell-lifting-classes-on-the-level (accessed on 21 October 2020).
  52. Podrigalo, L.; Iermakov, S.; Rovnaya, O.; Zukow, W.; Nosko, M. Peculiar Features between the Studied Indicators of the Dynamic and Interconnections of Mental Workability of Students. J. Phys. Educ. Sport 2016, 16, 1211–1218. [Google Scholar]
  53. Åkerstedt, T.; Gillberg, M. Subjective and Objective Sleepiness in the Active Individual. Int. J. Neurosci. 1990, 52, 29–37. [Google Scholar] [CrossRef] [PubMed]
  54. Shahid, A.; Shen, J.; Shapiro, C.M. Measurements of sleepiness and fatigue. J. Psychosom. Res. 2010, 69, 81–89. [Google Scholar] [CrossRef] [PubMed]
  55. Tang, X.; Teunissen, C. The appreciation of LED-based white light sources by Dutch and Chinese people in three application areas. Lighting Res. Technol. 2018, 51, 353–372. [Google Scholar] [CrossRef]
  56. Chao, W.-C.; Hong, L.-Y.; Hsieh, M.-C.; Wang, E.M.-Y.; Yang, C.-C.; Su, L.-C. Effect of correlated colour temperature and illuminance levels on user’s visual perception under LED lighting in Taiwan. Ergonomics 2020, 63, 175–190. [Google Scholar] [CrossRef]
  57. Weng, Z.; Bao, W.; Lin, Y.; Wei, M. The Effect of Classroom Lighting Methods on Visual Performance and Perception. China Illum. Eng. J. 2019, 30, 1–6. [Google Scholar] [CrossRef]
  58. Xiong, Q.; Lu, X.; Ma, M.; Wie, Y.; Lv, Y.; Zheng, S.; Deng, Y.; Kuang, P.; Qian, C.; Wang, L. Medical students study fatigue and its key influencing factors in a university in Guangzhou City. Chin. J. Sch. Health 2012, 33, 709–711. [Google Scholar] [CrossRef]
  59. Gang, H.H.C. Influence on Visual Performance under Light Sources with Different Color Temperatures in Classroom Lighting. Light Lighting 2011, 35, 14–18. [Google Scholar]
  60. Linhart, F.; Scartezzini, J.-L. Evening office lighting—Visual comfort vs. energy efficiency vs. performance? Build. Environ. 2011, 46, 981–989. [Google Scholar] [CrossRef]
  61. Viola, A.U.; James, L.M.; Schlangen, L.J.; Dijk, D.-J. Blue-enriched white light in the workplace improves self-reported alertness, performance and sleep quality. Scand. J. Work Environ. Health 2008, 297–306. [Google Scholar] [CrossRef] [PubMed] [Green Version]
  62. Hviid, C.A.; Pedersen, C.; Dabelsteen, K.H. A field study of the individual and combined effect of ventilation rate and lighting conditions on pupils’ performance. Build. Environ. 2020, 171, 106608. [Google Scholar] [CrossRef]
  63. Feltrin, F.; Leccese, F.; Hanselaer, P.; Smet, K.A.G. Impact of Illumination Correlated Color Temperature, Background Lightness, and Painting Color Content on Color Appearance and Appreciation of Paintings. Leukos 2020, 16, 25–44. [Google Scholar] [CrossRef]
Figure 1. Experimental procedure.
Applsci 10 07436 g001
Figure 2. The classroom used in the experiment with tubular LED (left) and LED panel (right) sources.
Applsci 10 07436 g002
Figure 3. Relative spectral power distributions of the experimental light sources.
Applsci 10 07436 g003
Figure 4. Colour gamut graphics of the experimental light sources based on IES TM-30-18 specification. Despite the slight spectral power distribution (SPD) variations among tubular LEDs in Exp.1, the gamut shapes of those light sources were quite consistent. Thus, only one light for each experiment is shown.
Applsci 10 07436 g004
Figure 5. Colour preference judgements of fruit and vegetables (left) and skin tone (right).
Applsci 10 07436 g005
Figure 6. Questionnaire used for recording the subjective rating of the atmosphere of the lighting environment.
Applsci 10 07436 g006
Figure 7. (Left): paragraph of Anfimov test; (right): questionnaires used for Anfimov test and reading comfort assessment.
Applsci 10 07436 g007
Figure 8. Results of colour preference rating and lighting environment evaluation with the error bars representing 95% confidence intervals (F&V—Fruit and Vegetables).
Applsci 10 07436 g008
Figure 9. The means of proofreading speed and accuracy of experienced (Group A) and inexperienced subjects (Group B) in Exp.2. The error bars depict the 95% confidence intervals.
Applsci 10 07436 g009
Figure 10. The means of the subjects’ proofreading speed and accuracy in Exp.1 and in Exp.2 after removing the practice effect. The error bars depict the 95% confidence intervals.
Applsci 10 07436 g010
Figure 11. Bar chart of the average comfort rating scores with results of Wilcoxon Signed Rank Test (only the p values lower than 0.05 were marked).
Applsci 10 07436 g011
Figure 12. Average results of KSS test with error bars of 95% confidence intervals.
Applsci 10 07436 g012
Table 1. The photometric and colorimetric properties of the experimental light sources.
Measurement Experiment MaxMinAverageStandard Deviation
Illuminance (lux)Exp.125511015539
Exp.245721129975
CCT (K)Exp.168256493668889
Exp.252254956513968
CRI RaExp.17571741.00
Exp.29292920.00
IES RfExp.17771752.24
Exp.28787870.00
IES RgExp.19694950.82
Exp.21011011010.00
Table 2. Overview of the Karolinska Sleepiness Scale (KSS).
ScalesDescriptions in EnglishDescriptions in Chinese
1Extremely alert极度清醒
2Very alert非常清醒
3Alert清醒
4Rather alert一般清醒
5Neither alert nor sleepy没有困意
6Some signs of sleepiness有一些困意倾向
7Sleepy, no effort to stay awake有困意,但不需要很大努力保持清醒
8Sleepy, some effort to stay awake有困意,但需要一定的努力保持清醒
9Very sleepy, great effort to keep awake, fighting sleep有困意,且需要极大的努力保持清醒
Table 3. Results of MANOVAs for each of the fixed factors on colour preference and atmosphere perception.
Visual AttributesFixed FactorsFp-ValuePartial Eta Squared, η2
Fruit and vegetables preferenceLighting environment0.4800.4890.003
Test trial1.5420.2170.010
Gender3.5310.0620.023
Skin preferenceLighting environment13.165<0.0010.081
Test trial0.1730.6780.001
Gender3.3790.0680.022
Uncomfortable/ComfortableLighting environment11.3250.0010.070
Test trial0.7940.3740.005
Gender3.1350.0790.020
Cool/WarmLighting environment19.036<0.0010.113
Test trial2.5250.1140.017
Gender0.0030.9540.000
Negative/ActiveLighting environment5.8790.0170.038
Test trial0.6330.4270.004
Gender3.3240.0700.022
Tense/RelaxedLighting environment4.0270.0470.026
Test trial1.4830.2250.010
Gender0.5010.4800.003
Table 4. Results of MANOVAs for the subjective ratings for reading comfort.
Fixed FactorsMean SquareFp-ValuePartial Eta Squared, η2
Paper colour44.54525.389<0.0010.101
Lighting environment0.1610.0920.7620.000
Test trial4.5942.6190.1060.006
Gender6.6353.7820.0520.008
Paper colour × Lighting environment2.1011.1970.3030.005
Paper colour × Test trial2.7121.5460.2140.007
Paper colour × Gender2.7921.5900.2050.007
Lighting environment × Test trial2.2941.3050.2540.003
Lighting environment × Gender 0.0920.0520.8190.000
Test trial × Gender0.2760.1570.6920.000
Table 5. Results of the MANOVAs for KSS test.
Fixed FactorsMean SquareFp-ValuePartial Eta Squared, η2
Lighting environment1.8850.5850.4450.004
Test trial0.3630.1130.7370.001
Gender0.2050.0640.8010.000
Lighting environment × Test trial3.2441.0070.3170.007
Lighting environment × Gender1.1830.3670.5450.002
Test trial × Gender1.1070.3440.5590.002
Lighting environment × Test trial × Gender0.0380.0120.9130.000
Publisher’s Note: MDPI stays neutral with regard to jurisdictional claims in published maps and institutional affiliations.

