1. Introduction
Investments in solar photovoltaic (PV) technologies have experienced stable growth supported by the many policies and incentives to increase the installation of renewable energy sources (RES) [
1]. For example, an additional 70 GW was reported in 2016 alone [
2]. After that, the global investment declined due to the accentuate decrease in the PV system costs and increase of electricity prices, which has allowed many countries to reach grid parity, which refers to the point at which the cost of generating PV electricity equals the cost of buying it from the grid [
2,
3].
Consequently, in such countries, directly consuming the solar PV generation (i.e., self-consumption, SC) became more attractive than feeding the PV production into the grid and, in return, receiving a subsidy (i.e., feed-in tariff) [
2]. Furthermore, many countries have developed policies favoring SC over feed-in tariffs. For example, in Germany, the PV owner has a premium paid per kWh of SC from PV. China, the largest solar PV technology manufacturer, also favors SC with a bonus on top of the saved retail price [
4]. In Portugal, SC has only been allowed since 2014, with a feed-in tariff for the surplus PV production. Before that, only feed-in tariffs were allowed.
However, in the domestic sector, the periods of PV generation and electricity demand rarely coincide, implying that only a limited share of solar PV energy can be used directly for SC. Some works have reported shares of direct SC around 30% [
5]. In this context, battery energy storage systems (BESS) offer the opportunity to increase SC levels by storing excess solar PV production to be used later (i.e., indirect SC). For example, in [
5], the authors claimed that it was possible to increase the relative SC between 13% and 24% using a BESS with a capacity of 0.5–1 kWh per installed kW of solar PV.
Nevertheless, as with standalone solar PV, the financial viability of PV coupled BESS (PV-BESS) for SC is affected by the different regulation schemes [
6]. Hence, it is crucial to study the impact of local legislation on the profitability of PV-BESS investors.
Against this background, in this paper, we present an economic assessment of solar-powered residential BESS on Madeira Island (Portugal), where, since 2014, only self-consumption is allowed, and any excess PV production must be curtailed [
7,
8]. This last restriction happens in part due to the isolated nature of the island electric grid (i.e., not interconnected to continental Europe), which can be significantly affected by the intermittent and uncertain nature of renewable production [
9].
In the specific case of Madeira Island, the residential consumers’ electricity bill consists of two components, a fixed component that depends on the contracted power (kVA) and a dynamic part governed by the actual energy consumption (kWh) [
8]. In this scenario, PV-BESS can directly reduce the energy bill by minimizing the dynamic component, achieved by increasing the self-consumption, and by enabling energy arbitrage (i.e., charge the BESS from the grid when the buying prices are lower and discharge when prices are higher).
In previous work that considered the Madeira Island case [
10], it was shown through year-long simulations that, in the current scenario of no feed-in tariff, BESS will improve the value of solar PV installations by considerably increasing the rates of SC (between 10% and 30% depending on the BESS capacity). However, in line with much of the existing literature (see
Section 2), it was found that the resulting reductions in the energy bill are not sufficient to pay the initial investment during the lifetime of the BESS.
While this works sheds some light on the present situation on Madeira Island, it suffered from several short-comings now addressed in this paper. First, it only considered a flat-rate power tariff, which also excluded the possibility of assessing energy arbitrage potential. The BESS sizing did not consider the installation characteristics (i.e., size of PV and load demand). Furthermore, it did not consider the BESS degradation in future savings. Finally, only two prosumers were considered.
For BESS on Madeira Island, the present work extends the work in [
10] in several ways. First, two different energy tariffs are considered, a flat and a Time-of-Use (ToU) rate. Second, two battery control strategies are evaluated, greedy and greedy with pre-charge. Third, the BESS size and the amount of pre-charge are selected based on a proposed set of equations that considers the size of the solar PV and the electricity demand. Fourth, storage degradation is taken into consideration when calculating future energy savings. Finally, four additional prosumers are studied.
Ultimately, this work contributes to the ongoing European Union (EU) efforts to understand the effects of different regulations schemes on the economic viability of energy storage devices in domestic self-consumption systems [
6]. Furthermore, by focusing on an isolated geographical island, we are further contributing to the de-fossilization of non-interconnected island energy systems, which have also been receiving significant attention from the EU (Clean Energy for EU Islands,
https://euislands.eu/; Smart Islands Initiative,
http://www.smartislandsinitiative.eu/) due to considerably higher energy production costs compared to the mainland [
11].
The remaining of this paper is organized as follows.
Section 2 surveys related works.
Section 3 provides context and background information for a better understanding of this work.
Section 4 thoroughly describes the materials and methods used in this work.
Section 5 presents and discuses the obtained results. Finally,
Section 6 presents the conclusions and future work directions.
2. Related Works
Research in the economic viability of self-consumption of RES in residential settings has been slowly gaining traction, mainly due to nation-wide changes in the regulatory schemes for distributed generation (DG) that made self-consumption one of the few available modalities for residential micro-production installations. For example, in [
5], the authors conducted a review of research on PV for self-consumption and the available options to improve its rates, which included energy storage and load management, also called demand-side management (DSM). Despite the small number of papers at that time, the results show that it was possible to increase the relative self-consumption by 13–24% with a battery storage capacity of 0.5–1 kWh per installed kW of PV power, and by 2–15% with DSM.
After 2015, several papers on the topic have been published for different countries, many of which consider combining solar PV with BESS. Most studies have been motivated by the promises of grid parity of solar PV [
3] and the decreasing prices of storage that, according to the most optimistic studies, would set the price of Lithium-ion storage at 175 €/kWh by 2020 [
12].
Interestingly, most of these works were developed for European countries, mostly due to the many financial incentives and different policies practiced developed towards increasing the penetration of RES in the electric energy mix.
Table 1 presents a shortlist of these works and the respective countries.
While the authors have followed many different methodologies, e.g., simulated versus real-world data, the central message of all the reviewed works is that the inclusion of a BESS will significantly increase the levels of SC and Self-Sufficiency (SS), where SS refers to the degree to which the local generation is sufficient to fill the total energy needs [
5]. However, several aspects should be taken into account.
First, despite the increase in SC and SS, most of the works argue that BESS for SC will not be profitable unless the kWh prices of BESS drop considerably [
2,
4,
10,
16,
18,
22,
23], and this drop is accompanied by an increase in the cost of the kWh from the grid [
20]. Other works stated that storage could be profitable; for example, in [
14], it is argued that works showing high profitability have considerably under-estimated the evolution of the price of the kWh of storage [
22].
Another essential takeaway is that the much desired 100% SS cannot be achieved without prohibitively over-sizing both the solar PV and BESS installations. In fact, many authors show that reaching 80% SS already requires considerable over-sizing of the battery capacity [
2,
19,
22]. For example, in Sweden, it was demonstrated that sizes above 4 kWh confer virtually no improvement in the levels of SS [
19].
Furthermore, it was shown that larger batteries would be under-utilized most of the time, leading to excessively high investment costs and, thus, much longer payback times [
2,
19,
20,
22]. A critical aspect to consider when sizing the BESS for increased SC and SS is the battery’s charge/discharge rate, which is associated with the battery itself (C-rate) and the inverter size. For example, Quoilin et al. [
22] showed that there is a positive effect of the SS for maximum charge/discharge rates between 1 and 4 kW. However, after 4–5 kW, no further improvements are observed.
In addition, concerning the economic viability of BESS, other authors argue that this is very susceptible to the regulatory frameworks in place [
2,
15]. For example, Bertsch et al. [
2] compared the levels of SC and SS in Germany and Ireland, finding that, in the former, the investments in PV-BESS with smaller storage would be profitable at a storage cost around 500 €/kWh. However, this would not be the case in Ireland, where the cost of storage would need to decrease further, or the electricity prices increase considerably to make PV-BESS an attractive investment.
Besides the regulation frameworks, geography also plays an essential role in the levels of SC and SS. For example, in [
22], the authors compared 10 European countries and found that even within the same nations, the SS rates will vary considerably (e.g., between 10% and 50% in Italy). However, the central tendency (median) varied between 30% and 35% across the studied countries, with southern countries (Portugal, Italy and Greece) showing slightly higher SS rates. This result contrasts another work showing that at northern latitudes, there is a lower utilization of the PV, hence causing an immediate decrease in the SS rates [
19].
Finally, and despite not being considered by the majority of the authors, the simulation setups will also considerably affect the results. Among these, the more important aspects are the nature of the load profiles and the simulations’ time resolution. Concerning the former, the authors of [
15,
19] showed that whenever possible real profiles should be preferred over averaged or artificially generated data. For example, in [
15], it is demonstrated that using aggregated load profiles leads to higher shares of SC than the use of an individual profile. As for the latter, higher resolution profiles (e.g., 1/60 Hz) tend to lower SS since this makes simulations account for the high peaks in consumption that cannot be compensated by the PV or the BESS [
22].
3. Context and Background Information
This section presents the context and background information necessary to understand the remaining contents of this paper. First, an overview of the Madeira Island electric grid is provided, followed by a summary of the regulation schemes currently in place. Finally, details of the billing schemes for domestic consumers/prosumers are also provided.
3.1. Overview of the Madeira Island Electric Grid
Madeira is the main island of the Madeira archipelago in the North Atlantic Ocean. Madeira is located about 1000 km southwest of mainland Portugal. It has a population of almost 270,000, from which around 110,000 live in the capital city of Funchal. Madeira is a total energy island, meaning that it is not electrically connected to the mainland. Therefore, all the energy consumed on the island is generated on-site and managed by a single distribution system operator (DSO) responsible for the entire grid infrastructure and large-scale energy generation, transmission and distribution [
8].
With a little more than 134,000 registered consumers, the 2018 total net demand from the Public Electricity Supply System of Madeira Island was 831.08 GWh. From these, 759.55 GWh were delivered to the end-consumer, amounting to 70.45 GWh of emission losses (8.6 %) [
24]. The non-domestic sector (e.g., services and commerce) was responsible for near 46% of that consumption, whereas the domestic sector was responsible for about 33% [
24].
The electric grid on Madeira Island is fed by five energy sources, namely: hydro, wind, photovoltaic, solid waste incineration and thermal energy from burning fossil fuels such as diesel and natural gas. In 2018, thermal accommodated almost 70% of the net demand, whereas RES covered the remaining 30%: wind (12.1%), hydro (11.6%), waste/biomass (4.2%) and solar PV (3.5%).
3.2. Domestic Peak Power Contracts and Power Tariffs
In Portugal, the electricity supply contracts and tariffs are defined by the national energy services regulator—ERSE (
https://www.erse.pt/en/home/). For low-voltage (LV) consumers, the electricity bill consists of two components: a fixed component that depends on the peak contracted power (kVA) and a dynamic part governed by actual energy consumption (kWh).
The customers select the peak power contract (PPC) based on their estimated electricity needs. The available PPCs range from 3.45 to 20.70 kVA, each of which has an associated daily fee [
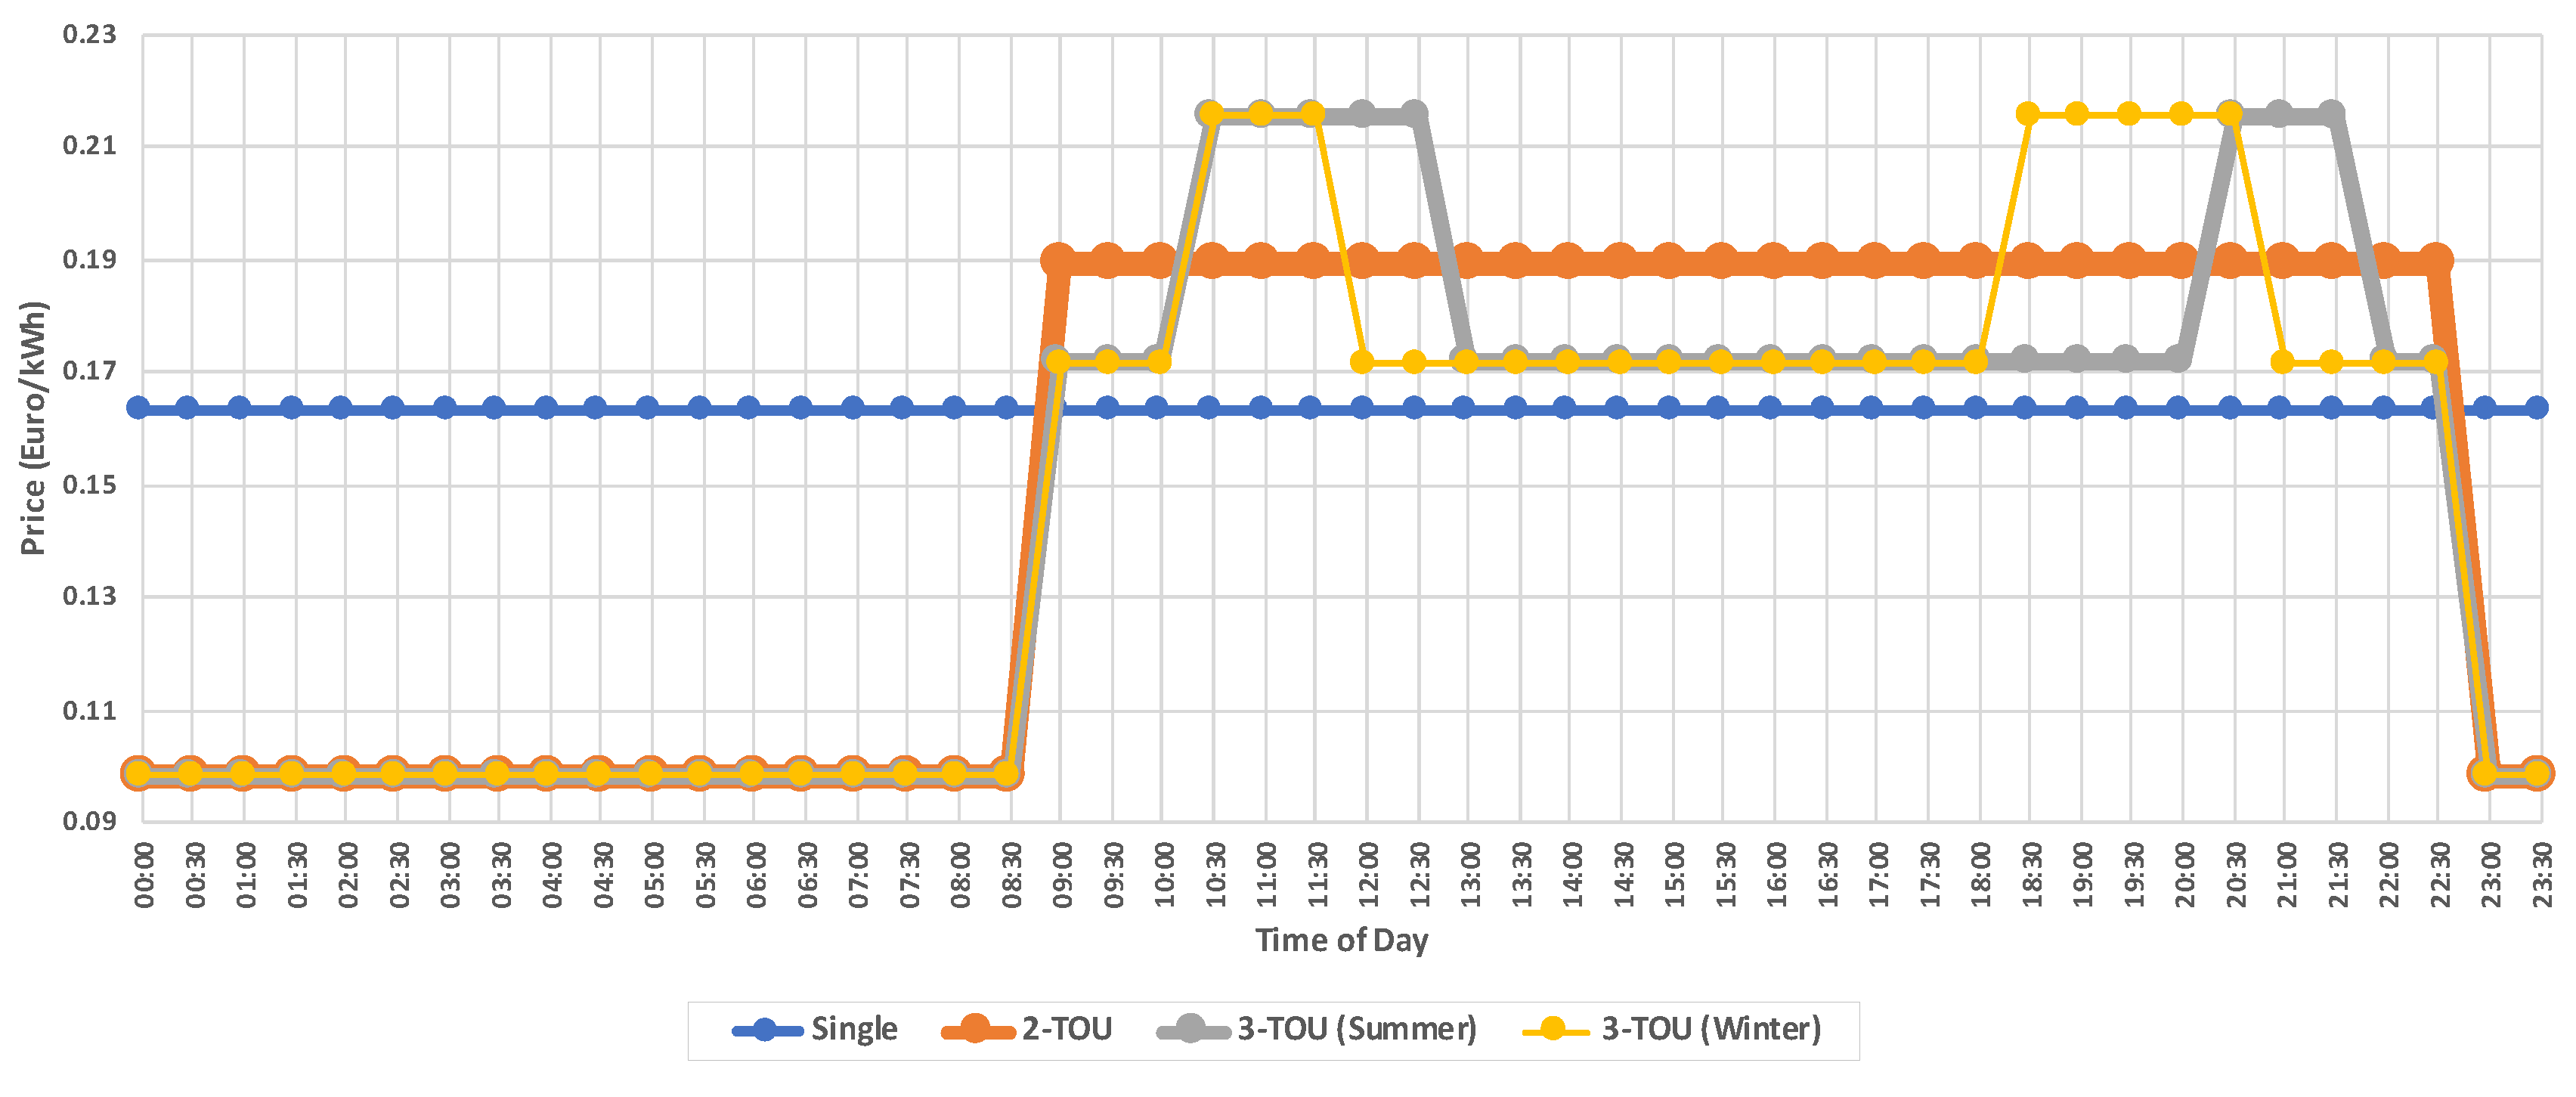
8]. Changes to the PPC require a formal request to the DSO, and, if accepted, a certified electrician performs the change in the customers’ energy meter. Concerning the dynamic component, there are three tariffs available: a single-rate (SR) a Two Time-of-Use (2-TOU) and a Three TOU (3-TOU). The active energy rates, in Euros per kWh, according to each tariff and billing period are presented in
Table 2. The daily variations of the active energy prices are illustrated in
Figure 1.
In this work, we consider only the dynamic component, namely the single-rate and 2-TOU tariffs, since these are adopted by over 90% of the LV customers on Madeira Island.
3.3. Regulation for Self-Consumption and Small-Production
In Portugal, the current legislation for self-consumption of energy is defined by the Decree-law 162/2019 of 25 October 2019.
Presently, one or more self-consumption units are defined as UPACs (the term we refer to in this paper). UPACs are divided into individual (the final consumer who produces renewable energy for own consumption) and collective (renewable energy communities where at least two UPACs are organized for collective production and consumption). There is another modality in Portugal besides UPACs, which is called UPP (a unit of small production). UPPs are regulated by the Decree-Law 76/2019 of 3 June 2019. All the electric power produced by a UPP is injected in the Public Service Electric Grid (RESP), at a pre-established feed-in tariff.
Compared to UPPs, UPACs are units of production that can either be off-grid or grid-connected, and the energy produced is mainly for self-consumption and only the surplus can be sold to the grid.
Regarding Madeira Island, despite the National decree-law, since 2014, only new UPACs are allowed, and only in full self-consumption mode, i.e., any excess generation must be curtailed.
However, since 30 June 2020, the regional directorate of economy and transports (DRETT) have adopted new procedures associated with the SC of RES in the Madeira Autonomous Region (RAM), by the Order 12/2020/DRETT (Order 12/2020/DRETT (Portuguese only),
https://joram.madeira.gov.pt/joram/2serie/Ano%20de%202020/IISerie-124-2020-06-30.pdf). This order adapts the National Decree-Law 162/2019 of 25 October 2019 to RAM and describes the procedures associated with SC of RES.
The key aspects of the new local regulation are:
If previously allowed by DRETT and the DSO, a UPAC can now sell the production surplus. The feed-in tariff is calculated on a monthly basis, and is given by: . is the energy supplied to the grid in month m (in kWh), is the average daily price of the closing prices of the Iberian Energy Operator Market (OMIE) during the month m (in Euros per kWh) and is a calibration factor.
If the surplus production of a particular UPAC leads to the violation of the grid’s operational limits or the quality indicators in place, the DSO can reduce the power or temporarily disconnect the production facility without, in any case, a right for monetary compensation.
4. Materials and Methods
In this section, we present the materials and methods used in this research. We start by presenting the details of the simulation platform, including the inverter and battery models. We then provide a summary of the year-long consumption and production data from the six prosumers considered in this work. The following subsection presents the storage options used in this research and their associated prices. Finally, we present the two control strategies that were implemented, as well as the methodology followed in selecting the storage devices that are more adequate for each prosumer.
4.1. Simulation Platform
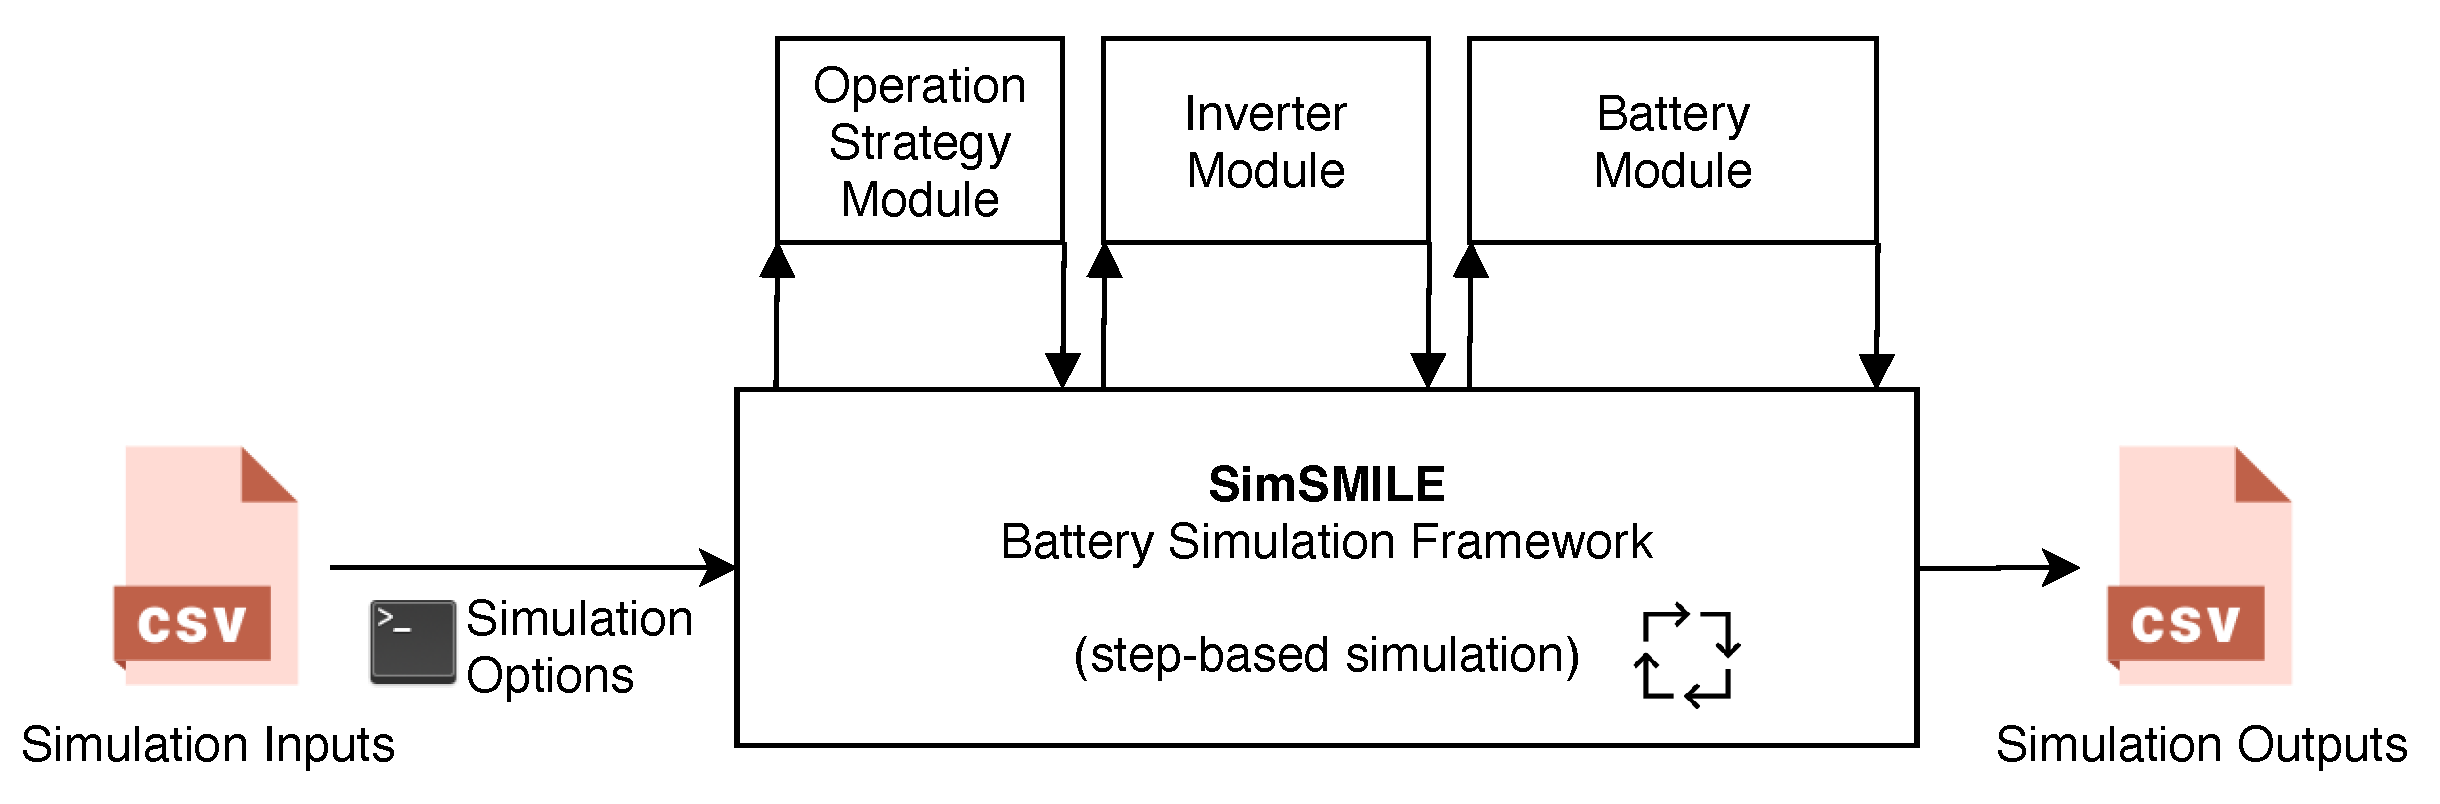
For the simulations, we used SimSMILE, a Battery Simulation Framework written in Python, inspired by SimSES (Simulation of stationary energy storage systems) [
25], an open-source modeling framework for simulating stationary energy storage systems developed at the Technical University of Munich. A block diagram illustrating the main components of SimSMILE is presented in
Figure 2. A brief overview of the simulation process is given next, and details about each element are provided in the specific subsections.
The simulation starts by averaging the input time-series of net load consumption and production data to the simulation step frequency given in the simulation options. Once averaged, missing data are replaced with values from the average daily profile computed from the entire time-series.
Then, a step-based simulation starts, where at each time-step, the Operation Strategy Module decides the thresholds to be set in the BESS. Based on the desired limits, the Inverter Module computes the power flows to/from the battery, taking into consideration also the power losses. Finally, the Battery Module updates the State of Charge (SOC) and State of Health (SOH) accordingly.
Once the simulation ends (after a pre-defined number of steps), the calculated energy flows are averaged to the desired sampling frequency. If not otherwise stated, the rate is the same as the simulation step size.
4.1.1. Simulator Inputs
The simulation takes as input parameters the time-series of the net load consumption and production data. Besides the time-series data, the following parameters are also available:
The frequency of the simulation steps, in Hz
The control strategy to use
The billing parameters
Feed-in tariff, in Euros per kWh
Inverter rated power, in kW
Inverter efficiency, in % (fixed or dynamic)
Battery nominal capacity, in kWh
Battery rated power, in kW
Initial State of Charge (SOC), in %
SOC limits (SOCmin, SOCmax), in %
Initial State of Health (SOH), in %
4.1.2. Control Strategy Module
The different battery control strategies are developed in this module. This module has access to all the simulation inputs by design, and its only output is the desired storage set-point. The set-point signal indicates the flow of power (<0 discharge; >0 charge). The current implementation only supports active power and two storage control strategies, more precisely the greedy control and an arbitrage heuristic. These are described in
Section 4.4.
4.1.3. Inverter Module
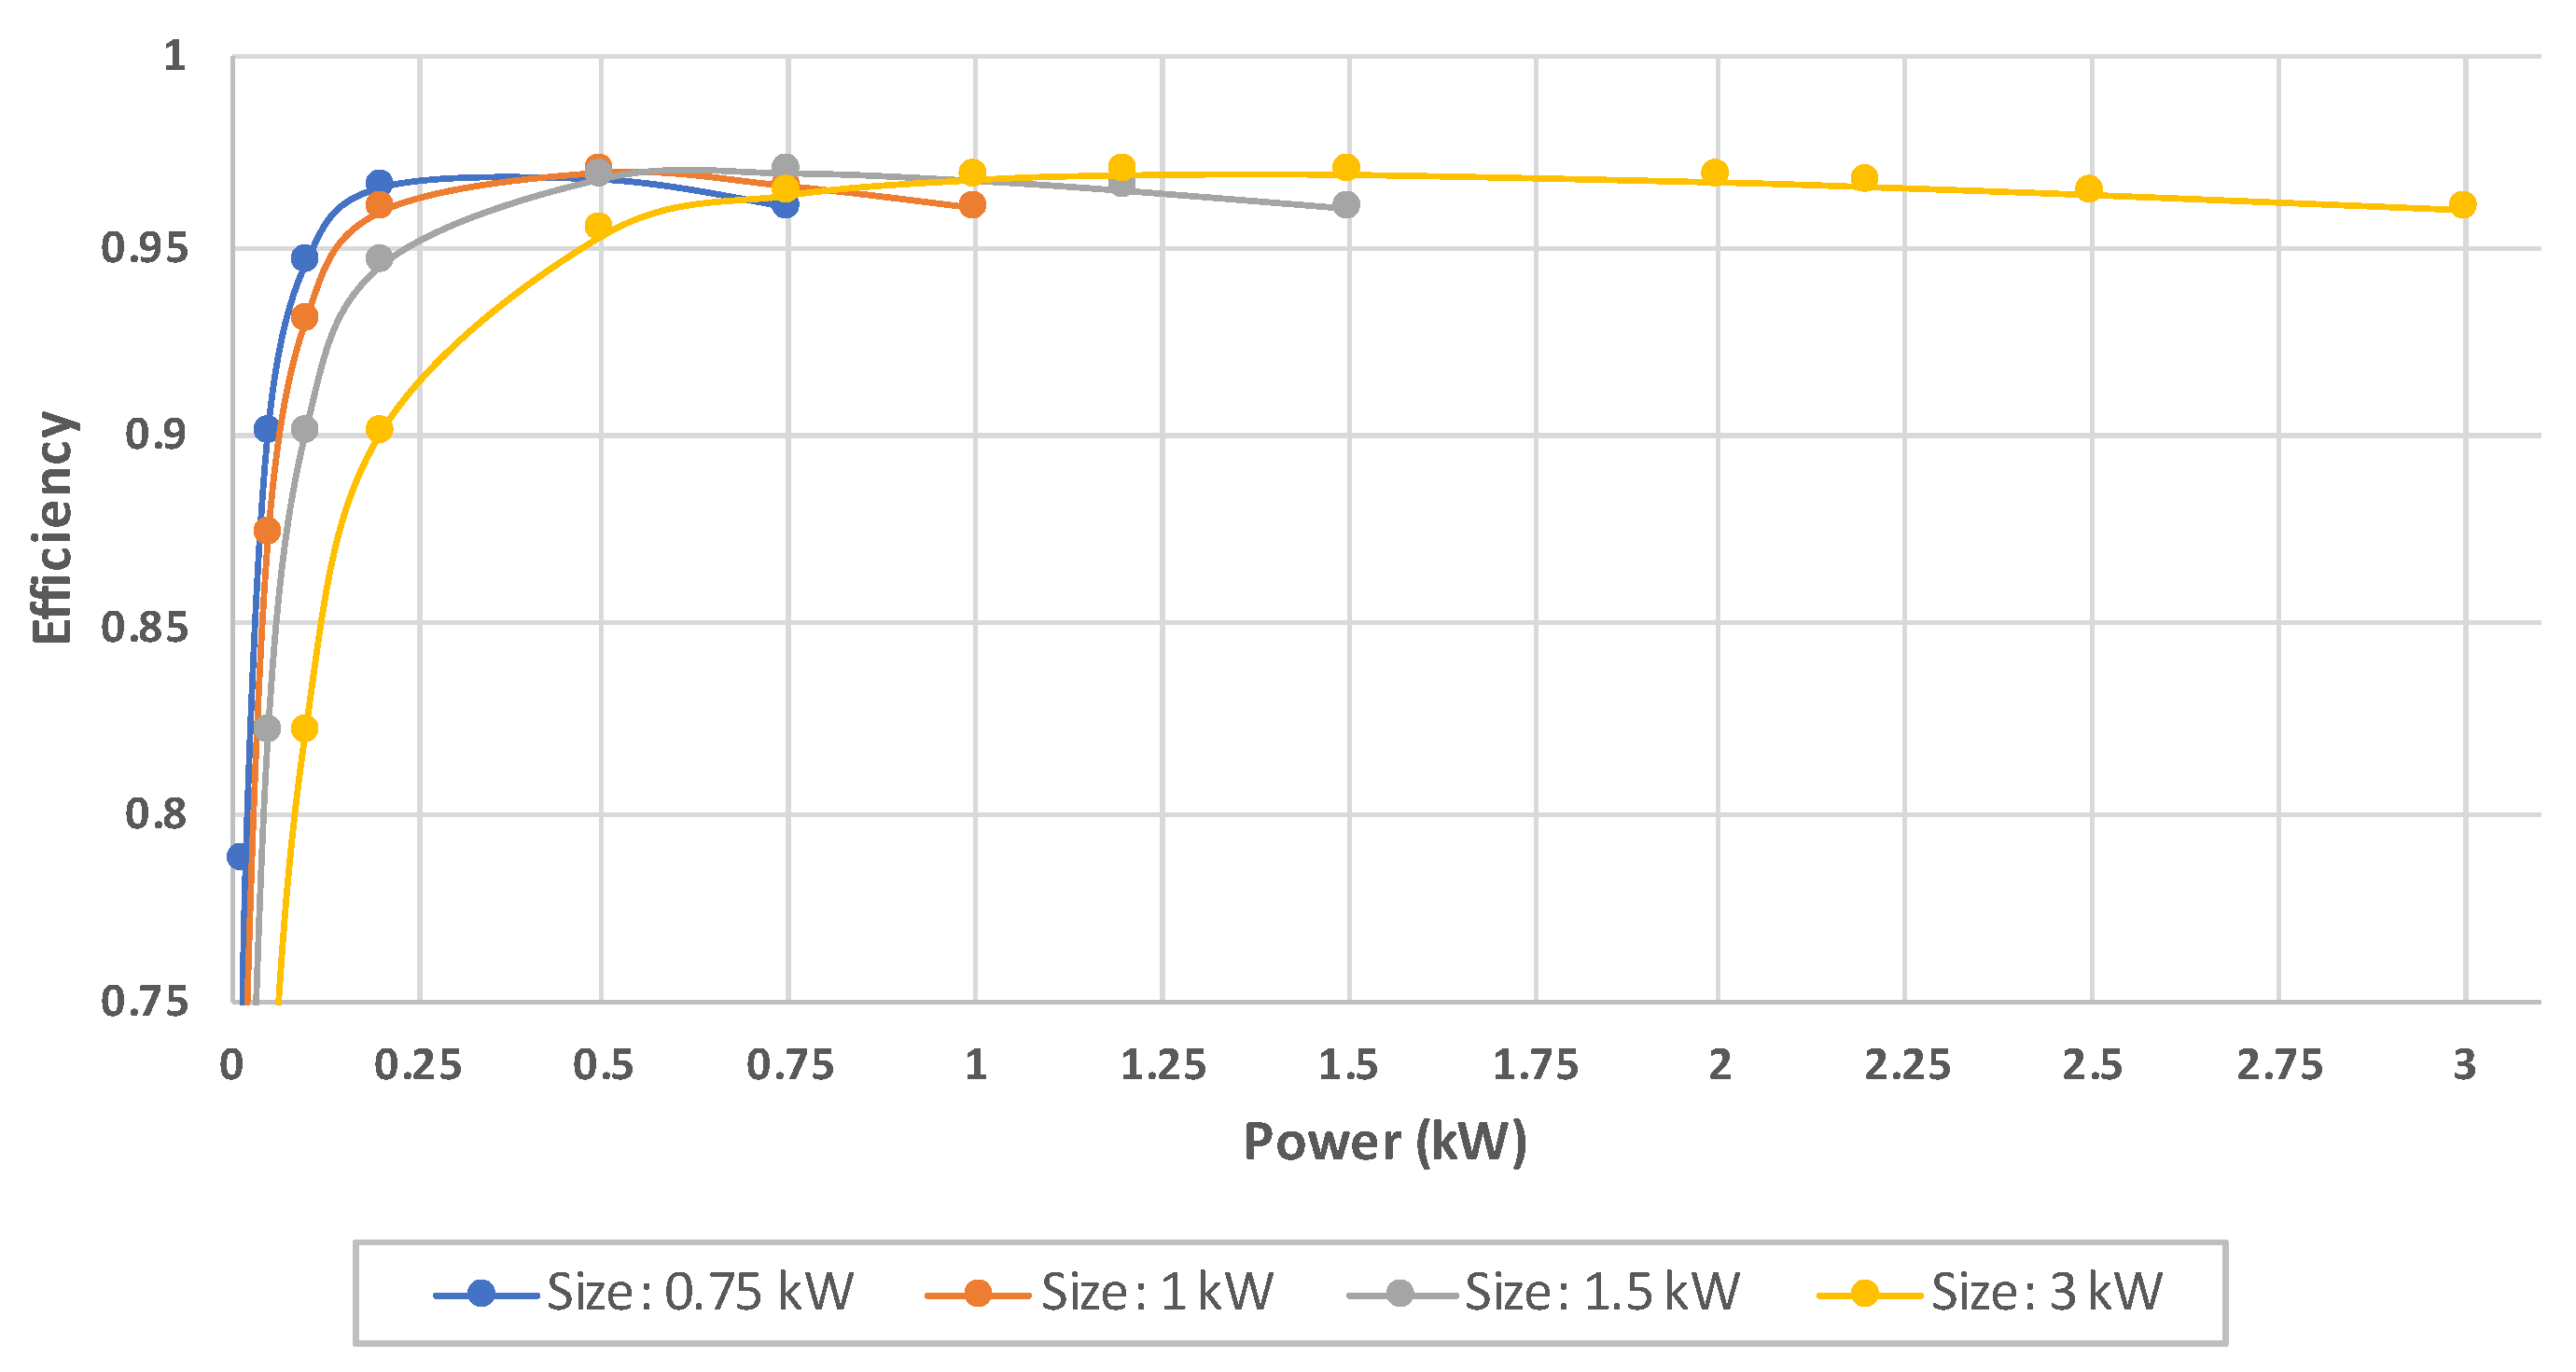
The inverter module has two tunable parameters, the rated power and efficiency. While the former is fixed for the simulation’s entire duration, the latter can be either fixed or based on the rated power.
To this end, the efficiency model proposed in [
26] was implemented. More precisely, the efficiency (
) of power transfer is given by Equation (
1), where
P is the power being transferred and
is the inverter rated power.
Figure 3 shows the efficiency in function of the inverter size and the amount of power to be transferred.
4.1.4. Battery Module
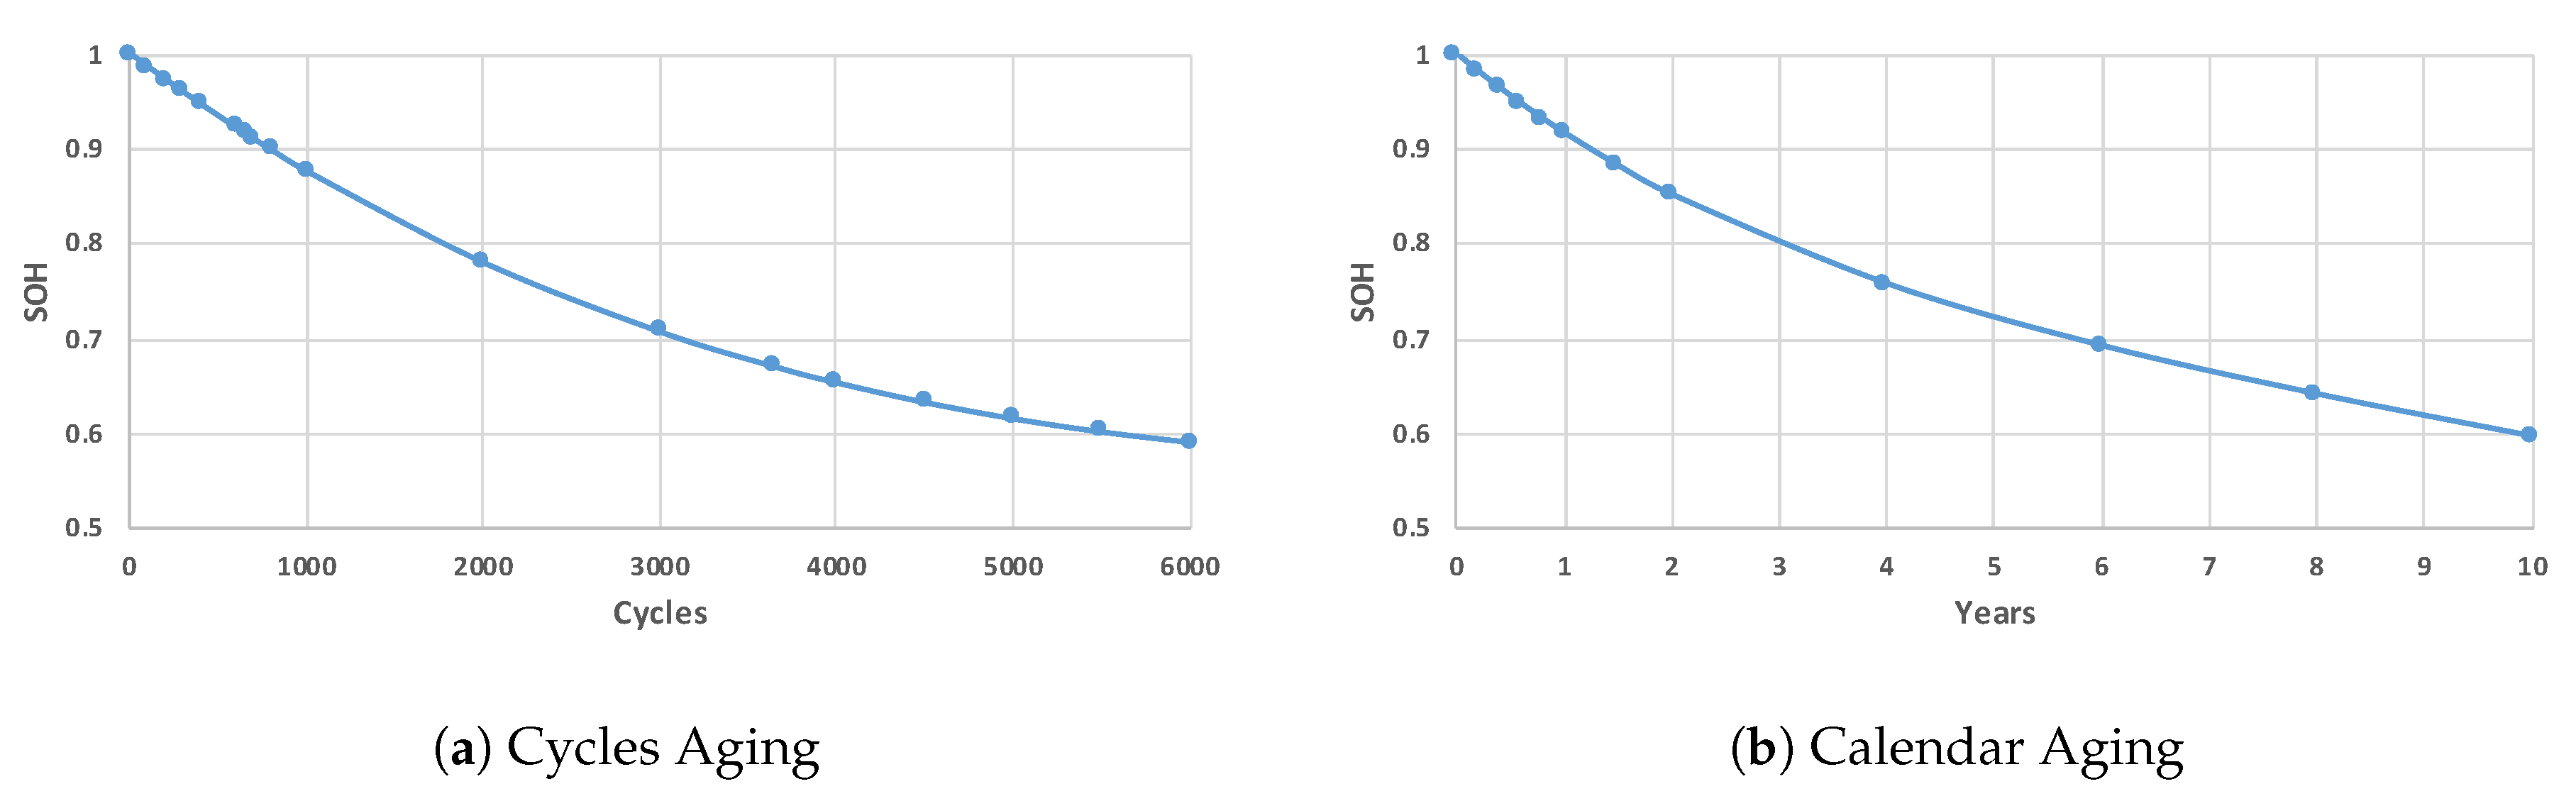
The battery module has five tunable parameters, four of which remain unchanged for the simulation’s entire duration. The only setting that changes as the simulation proceeds is the battery capacity, due to the SOH degradation.
This work employs the same degradation model used in SimSES. More precisely, exponential functions were fitted on data from the warranty sheet of the Tesla Powerwall, leading to two different again models: (1) cycles aging; and (2) calendar aging. Cycle and calendar aging are illustrated in
Figure 4. As can be observed, after one year, the SOH will degrade by 8.4% (to 91.6%). In contrast, to achieve the same degradation due to cycle aging, the battery needs to perform approximately 650 cycles, which is almost 1.8 cycles per day, during one year. Therefore, to achieve a gradual reduction of the SOH, the degradation is calculated at each step of the simulation by taking the maximum value between cycle and calendar aging. Finally, it is essential to remark that this degradation model assumes that the battery reaches the end-of-life at 60% SOH, which is achieved after 6000 cycles at 90% depth of discharge (DoD) (cyclic aging) or after ten years (calendar aging).
4.1.5. Simulator Outputs
The SimSMILE simulator produces the following outputs. Their granularity is the same as the simulation step-size.
: The amount of power being produced by the solar PV system over time t.
: The total consumption of the loads (L) over time t.
: The amount of power being requested or injected in the grid over time t. If power is requested, will have a positive sign. Otherwise, will have a negative sign.
: The amount of power being stored or withdrawn from the Battery over time t. If power is withdraw, will have a negative sign. Otherwise, will be positive.
: The power from PV going to the Grid at time t.
: The power from PV going to the BESS at time t.
: The power from PV going to the Loads at time t.
: The power from the Grid going to the Loads at time t.
: The power from the Grid going to the Battery at time t.
: The number of battery cycles at time t.
: The battery State of Health at time t.
: The battery State of Charge at time t.
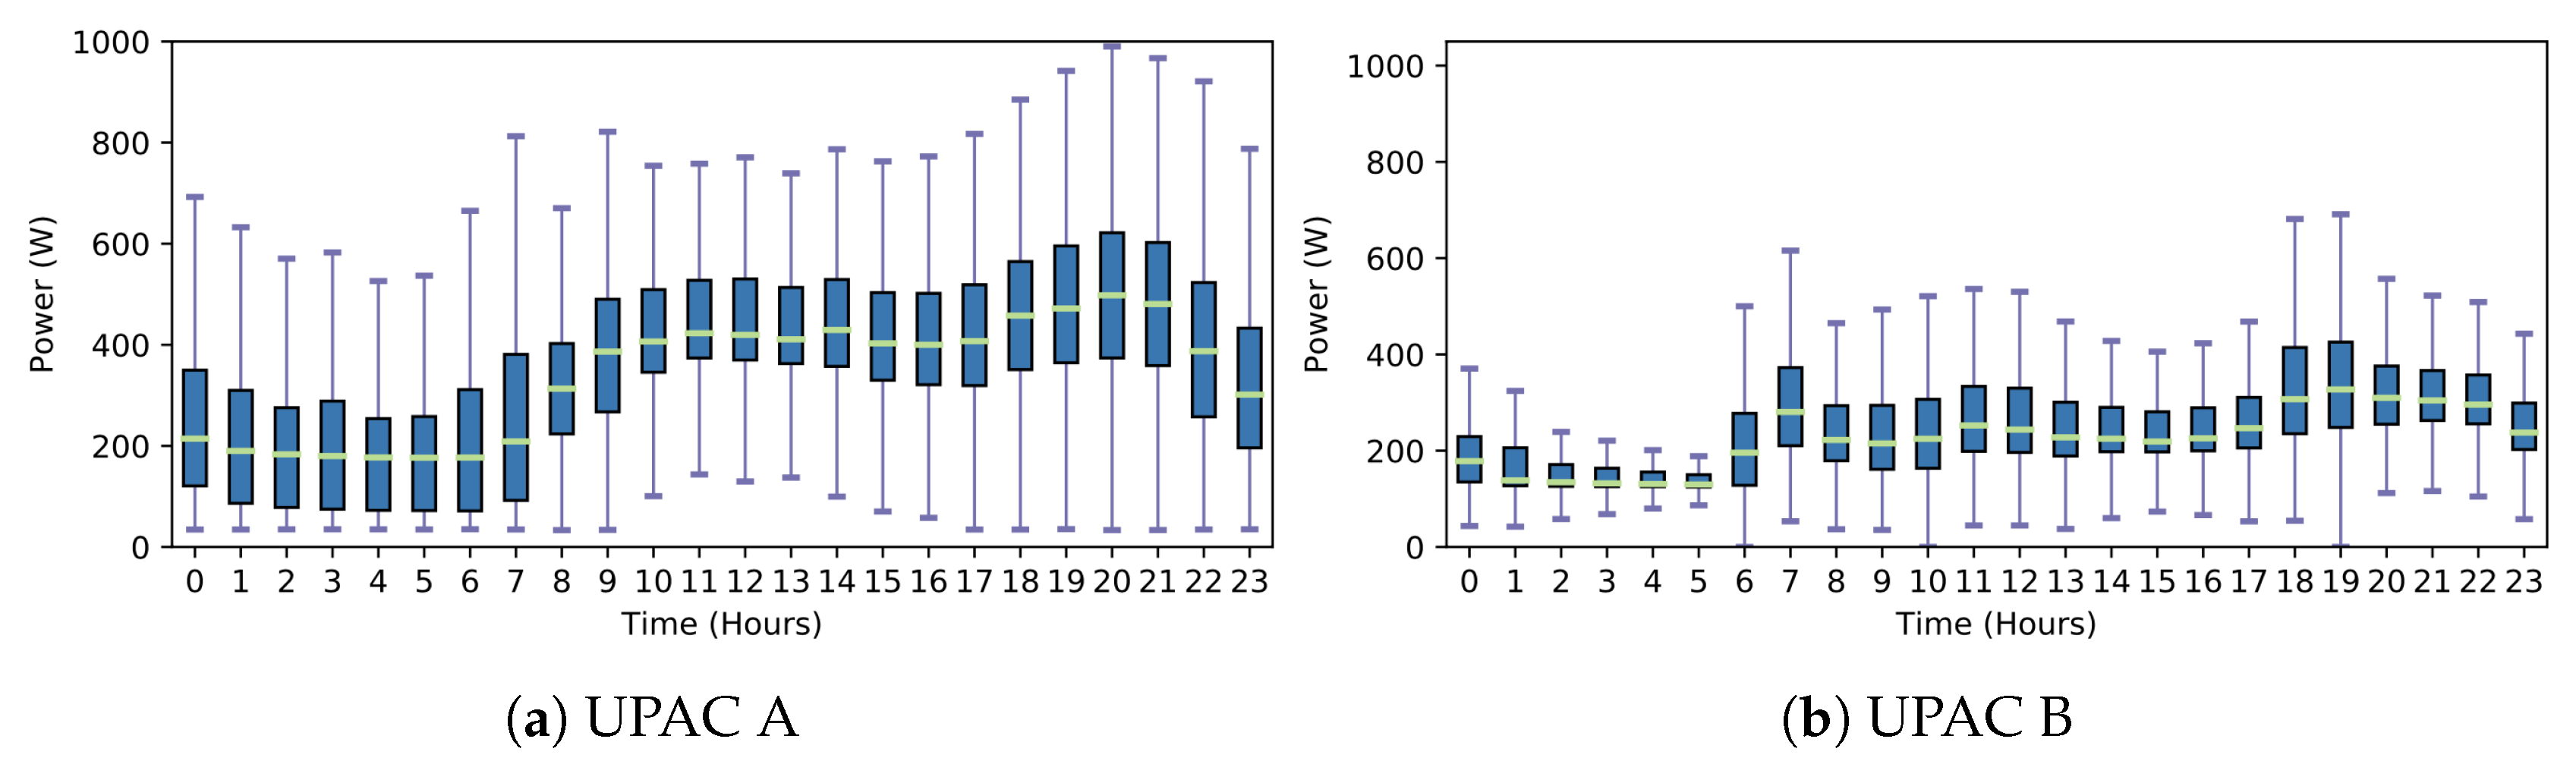
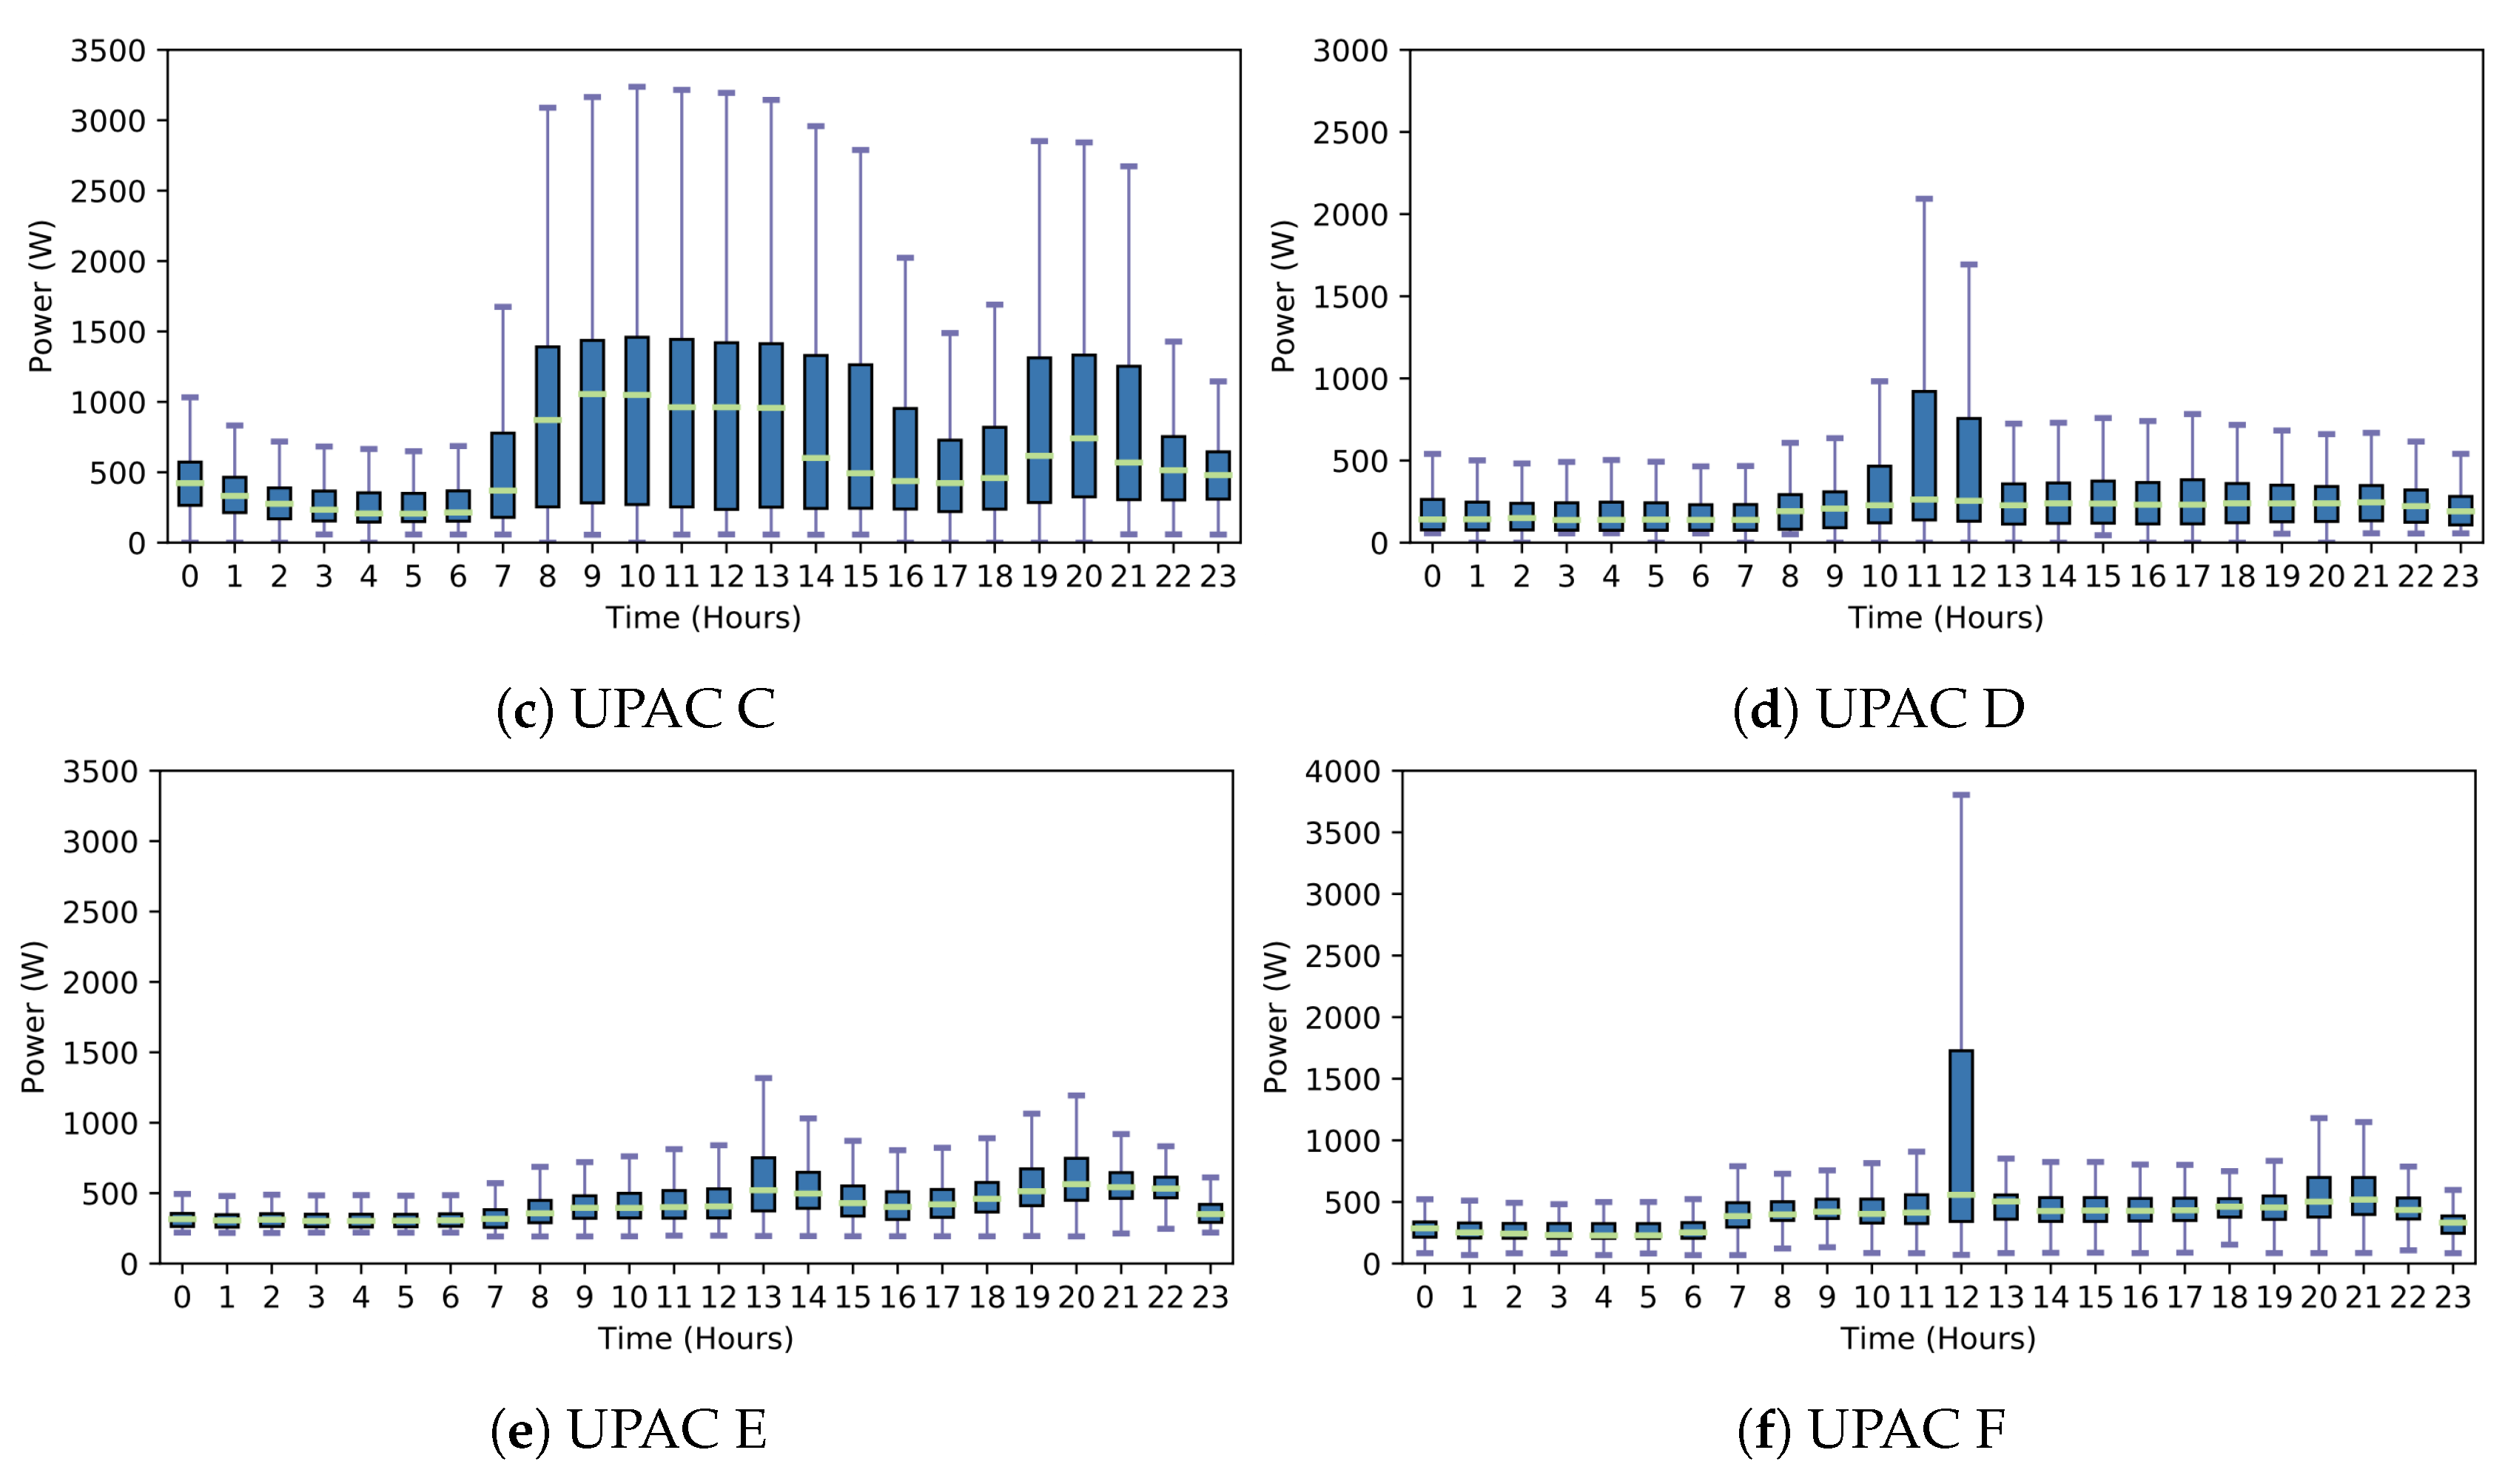
4.2. Data Collection and Baseline Results
This paper uses one year of data from six UPACs. The time-series measurements for solar PV production (
) and power consumption (
) were taken from the metering infrastructure of each UPAC at the rate of one sample per second (1 Hz) and averaged to the rate of one sample per minute (1/60 Hz). The data were collected in the scope of the Horizon 2020 SMILE project (H2020 SMILE,
https://h2020smile.eu), between 2018-10-01 00:00 and 2019-09-30 23:59.
Table 3 shows the details of each UPAC and baseline results computed from the year-long records. The following data is available: Peak Power Contract (PPC), installed solar PV capacity (PV), yearly totals for energy flows (P
G_L, P
PV_Loads, P
PV_Grid), self-consumption (SC), self-sufficiency (SS and best possible SS, i.e., with 100% SC) and total costs considering the single-rate and 2-TOU tariffs (without solar PV and with solar PV). An overview of the daily load profile in terms of active power (Watts) is also provided in
Figure 5.
4.3. Storage Options and Associated Costs
In this work, we consider the BESS systems provided by the combination of the Victron Energy Inverters with the Pylontech lithium batteries (Victron Energy,
https://www.victronenergy.com/live/battery_compatibility:pylontech_phantom). This combination was selected for two reasons: (1) The modular design enables the combination of different inverter sizes and battery capacities. For example, it is possible to increase the nominal capacity by adding up to eight modules of 2.4 kWh without changing the inverter. (2) The degradation characteristics are aligned with our degradation model, i.e., 6000 cycles with 90% DoD (Pylontech,
http://www.pylontech.com.cn/pro_detail.aspx?id=114&cid=23).
The main characteristics and price of the different BESS systems are presented in
Table 4. Note that the C-Rate of the battery modules is 0.5, i.e., it takes 2 h to fully charge or discharge the battery module. Note also that the prices presented do not consider the Value Added Tax (VAT) that may change depending on the country.
With the objective of selecting the best-suited BESSs and control strategies for each UPAC, many inverter/battery combinations were considered. The different combinations considered are presented in
Table 5.
4.4. Storage Control Strategies and Sizing
Two different control strategies are considered in this work: one for the single-rate tariff and another for the 2-TOU tariff. Each strategy was evaluated against several BESS configurations, based on the daily energy needs of each UPAC. To this end, a maximum storage configuration was calculated for each UPAC. After that, all the smaller configurations are also considered in the simulations. The two control strategies and the BESS configurations are described in the following subsections.
4.4.1. Single-Rate Tariff: Greedy
The greedy control algorithm is a standard operation strategy in self-consumption scenarios. It works by determining the residual load (i.e., the difference between production and consumption) and actuating the battery accordingly, i.e. storing excess production until the upper SOC limit is reached or supplying the excess demand from the battery until the lower SOC is reached.
For this algorithm, the maximum inverter size for each UPAC was selected based on the PV installation size. The maximum battery capacity was selected based on the smallest value between the daily average power demand from the grid (P
G_L) and grid injection from the PV (P
PV_G). The maximum battery capacity is given in the number of modules and is calculated using Equation (
2), rounded to the next integer value. MNC refers to the nominal capacity of the battery modules, in this case 2.4 kWh.
Note that this formulation ensures that be battery capacity (after discarding the SOC limits) is never higher than the daily average energy needs, nor higher than the average daily amount of solar PV injected in the grid.
The different storage options considered for each UPAC under this control strategy are listed in
Table 6. The maximum values for the inverter size and battery capacity are underlined.
4.4.2. 2-TOU Tariff: Greedy with Pre-Charge Heuristic
This control algorithm uses the Greedy strategy during peak hours, i.e., from 9 AM to 11 PM. During the off-peak hours, 11 PM to 9 AM, the battery is charged to a pre-calculated SOC and is not allowed to discharge until the peak period starts.
The amount of pre-charge depends on the battery’s capacity and on the electricity demand during the peak periods. It is calculated using Equation (
3), rounded to the next multiple of 5. P
G_L(PH) is the average consumption from the grid during the peak hours (PH), and BNC is the nominal battery capacity in kWh.
The maximum battery capacity was selected based on the daily average grid consumption during the peak-hours. The number of battery modules is given by Equation (
4), rounded to the next integer.
Finally, the feasible inverters were selected based on the maximum number of modules and the amount of time required to achieve the percent pre-charge, considering that the batteries are pre-charged at half of the inverter power, which provides the maximum efficiency.
The different storage options considered for this control strategy are listed in
Table 7. The maximum values for the inverter size and battery capacity are underlined.
Table 8 shows the percent of pre-charge (%PC) and the time required to reach that value in hours (T), for each of the considered BESS combinations. Note that, since the SOC
min is set to 10%, UPACs 6, 9 and 12 cannot pre-charge. Thus, this control strategy behaves similarly to the Greedy, with the difference of using the 2-ToU Tariff.
To summarize this section,
Table 9 lists the different parameters of the simulations and the respective values used in this work.
5. Results and Discussion
This section presents and discusses the obtained results. First, the year-long results are presented to understand the effects of introducing storage in the short-term. The year-long results also serve to establish the baseline from which the ten-year projections are calculated. The ten-year projections enable the assessment of the storage profitability considering the degradation over the years. Finally, a discussion on the proposed value proposition is presented based on the year and ten-year long results.
5.1. Year-Long Results
For this analysis, three types of metrics are employed: (1)
sustainability in the form of increased SC and SS; (2)
economical, measured in total savings in Euros, and the profit per Euro invested; and (3)
technical, in the form of battery cycles and SOH The values of the different performance metrics are presented in
Table 10.
Table 11 shows the hourly median of the SOC for each UPAC and control strategy for selected storage combinations. A heatmap from blue to red indicates the best options for each UPAC (dark blue, best; dark red, worst). The bold face in the SC column indicates the best control strategy.
5.1.1. Self-Consumption and Self-Sufficiency
The results show that reaching 100% is very hard, even with oversized storage, as is the case with UPACs A and B that reach 99% and 93% of SC, respectively, in the greedy control strategy. Naturally, the same is true for SS, where the most pragmatic case is UPAC F. In this case, even with over-sized storage (9.6 kWh), the SS is 99%, for a 66% SC in the greedy battery operation.
Concerning the 2-TOU control strategy, the results show a considerable decrease in the levels of SC and SS across the six UPACs. However, the reasons for this effect differ between smaller and larger UPACs. In the case of the smaller installations (A, B and C), due to the pre-charge operation and low morning consumption, it is very likely to observe a decrease in the SC in the morning since excess production can no longer be stored. Note that, in
Table 10, for pre-charge SOC below 90%, the SC increases. In contrast, when using the greedy strategy, the batteries are fully discharged most of the time (
Table 11). Hence, early morning excess production is stored.
As for larger UPACs (D, E and F), not being able to discharge the battery during off-peak periods implies that the storage is still charged in the morning. Hence, it is not able to accommodate all the excess production. For example, UPAC D tends to start the day with a SOC around 35%.
5.1.2. Energy Bill Reductions Due to Storage
Interestingly, despite the decrease in SC, the bill reductions per kWh in the Greedy with pre-charge heuristic are superior to the ones obtained in greedy strategy.
UPAC A and UPAC C are the most paradigmatic examples of this situation, more than doubling the energy bill’s reductions when using the smallest storage combination (2.4 kWh, 1 kW). However, this happens at the expense of 90% pre-charge, which leads to a considerable drop in the SC. Considering this, UPAC C is a clear case in which the installed solar PV capacity is under-sized. For example, even with a 7.2 kWh (B3 combo) nominal storage capacity, the %PC is set to the maximum SOC allowed (90%).
Concerning the single-rate tariff with greedy control in the larger UPACs, the battery combinations selected by the Equation (
2) achieve the highest SC levels but are also the less profitable concerning the initial investment. Interestingly, in this control strategy, the second smallest combinations (A2 in UPAC D and UPAC E and B3 in UPAC F) are the ones that offer the best trade-offs between SC and the costs of acquiring the storage device.
Another observation is that larger inverters do not add much to the profits independently of the adopted control strategy. This effect is visible in UPAC C (A2 vs. B2), UPAC D (A2 vs. B2, A3 vs. B3), UPAC E (A2 vs. B2, A3 vs. B3) and UPAC F (B4 vs. C4) where storage combos A, B and C have 1, 2.4 and 4 kW inverters, respectively. The reason for this is the relatively low instantaneous power values observed in all UPACs, which are mostly below 1 kW (see
Figure 5). Furthermore, as seen in
Figure 3, larger inverters are less efficient at lower power levels. Therefore, smaller inverters will cover the majority of the situations, making them more profitable.
5.1.3. Battery Cycles and SOH
Concerning the battery cycles, the first observation is the small number of cycles (most of the time below one per day). Ultimately, this means that it is improbable that the limit of 6000 cycles will be reached before the ten-year calendar aging of storage devices.
Furthermore, due to the low number of cycles, the 2-TOU with pre-charge control strategy adds to profitability without significantly compromising the storage device’s longevity. This can be observed from the very similar SOH after one year in both control strategies.
5.2. Long-Term Projections
For the long-term projections, the ten years of calendric life are considered. This is done because, as seen in the previous subsection, the maximum 6000 cycles will not be reached before the ten years considered the storage device’s maximum calendric life.
For these projections, it is assumed that the cost of electricity remains the same (single-rate: 0.1629 €; 2-TOU: 0.0982 €
off-peak and 0.1894 €
peak). The bill reduction after ten years is calculated using Equation (
5), where
is the bill reduction after one year (presented and discussed in the previous sub-section) and the
is the battery SOH at year
t.
For comparison purposes, this work also considers two discounted prices for the BESS, namely 50% and 75%. Finally, the results are evaluated based on two performance indicators: (1) payback time in years (PBT); and (2) balance per Euro invested after ten years (10Y%PEI). The former is given by Equation (
6) and the latter by Equation (
7).
is the initial investment, i.e., acquisition of inverter and battery.
The obtained results are presented in
Table 12. The heatmap from blue to red indicates the best options for each UPAC (dark blue, best; dark red, worst).
As can be observed from the %PEI and Payback Time columns, it is impossible to recover the investment before ten years with the current storage prices. Even with a price discount of 50% (average rate of 256 €/kWh, including the inverter), only the larger UPACs can recover the initial investment and make a small profit. Interestingly, due to its very high net demand, UPAC C already makes some profit in the pre-charge control strategy with a 50% discount rate.
Nevertheless, it is only at a 75% discount price (average price of 128 €/kWh, including the inverter) that storage becomes profitable in all but one case (UPAC A). Naturally, profits are higher for larger UPACs, which also make the initial investments more substantial. For example, in UPAC F, the smallest BESS combination will yield a profit of 239% of the initial investment. That is, for an investment of 374 Euros in Year 1, there would be a profit of 897 euros after ten years.
5.3. Discussion
Overall, from the results obtained, it is clear that, with the present costs of battery storage, it is implausible to make a profit only by increasing self-consumption.
However, it is clear that, in the long run, with the expected drop in storage prices, there is an enormous potential for investments in PV-BESS on Madeira Island. For example, with BESS prices around 250 €/kWh, many combinations are already profitable. This result is well aligned with other works, which suggest that, if the price of storage drops and the buying electricity increases, the payback time will be reduced and profitability reached in many cases [
2,
4,
18,
20,
22].
Furthermore, the low number of cycles is also an indicator that degradation will be mostly calendric. Therefore, even if storage devices do not see an accentuated drop in the cost of acquisition, an extended calendar life would also contribute to making PV-BESS profitable in the long run.
The obtained results also highlight a significant trade-off between the size of storage, control strategy, and profitability. In fact, higher profits happen in the 2-TOU tariff with the smallest storage combo available. This, however, leads to the lowest rates of SC and, in turn, higher levels of renewable energy curtailment. On the other hand, using the greedy strategy, the SC rates will increase with the storage capacity. However, due to the highest initial investment, the profitability drops considerably.
Ultimately, with the tariffs and legislation currently in place on Madeira Island, there is a perverse incentive towards favoring the curtailment of solar PV production over increasing the levels of SC. This result is also aligned with the literature, where it is suggested that the profitability of battery energy storage systems is highly sensitive to the underlying regulation frameworks, which makes investing in storage potentially risky in the long run [
2,
15].
Ultimately, our work suggests that new legislation and price mechanisms must be employed on Madeira Island, such that self-consumption is not just the more sustainable option, but also the most profitable one. For example, a net-metering tariff for excess production would avoid curtailment while still enabling the consumer to select the most profitable control strategy. Another possibility would be a dynamic feed-in tariff for injecting from storage to the grid. This would allow larger storage devices to complete at least one cycle per day, therefore adding to the profitability even in the absence of a sufficiently large solar PV installation.
6. Conclusions and Future Work
This paper presents an economic assessment of solar-powered residential battery energy storage systems on Madeira Island, where only the self-consumption regime is currently allowed. This study’s main objective was to understand to what extent energy storage devices can be profitable under the legislation and energy tariffs currently in place. The assessment was conducted against six local UPACs using year-long solar PV production and electricity demand measurements and two different battery control strategies. Several inverter/battery combinations were considered for each UPAC based on their consumption and production patterns.
The obtained results are in line with many other research works that state that storage for self-consumption only will not be profitable until the price of energy storage devices drops considerably. In our particular case, the energy storage devices only start to be profitable at an average price of 256 €/kWh, including the inverter price.
At this point, it is important to remark that the 10-year projection assumes little change in terms of prosumers behavior as well as of the regulation framework and international markets. For example, sudden increases of domestic demand due to a pandemic situation such as COVID-19, or in the cost of energy from non-renewable energy sources would lead to very interesting trade-offs such as the increase of direct self-consumption (in the case of a pandemic situation), and added value for arbitrage (in the latter situation), which would very likely change the profitability of energy storage devices.
Our results also highlight a significant trade-off among SC, pre-charge and profitability. More precisely, using pre-charge increases the chances of reaching profitability more quickly than a greedy strategy. However, this comes at the cost of a drop in the SC rates and, consequently, increases in the curtailment of solar PV production.
This suggests the need for new legislation that make self-consumption more profitable that the alternatives. Nevertheless, it should be mentioned that any changes in legislation and pricing mechanisms require a deep understanding of the main drivers and barriers to such changes, particularly to what concerns the future adoption by the consumer/prosumers base. For example, while the local DSO already provides semi-flexible energy tariffs (2-TOU and 3-TOU) to regulate the demand and encourage consumption outside the peak hours, the vast majority of the domestic consumers/prosumers still prefer the single-rate tariff which is a major barrier to achieve higher levels of penetration of RES [
27].
In future work, we aim to explore how more advanced storage control strategies can improve storage profitability without compromising self-consumption levels. For example, by introducing day-ahead forecasts, it may be possible to set the pre-charge SOC dynamically, thus avoiding solar PV curtailment in the early morning. Furthermore, a forecast based approach would also enable the possibility of using storage to decrease the PPC, which is another way of lowering the energy bill. For example, changing from a 6.9 kVA PPC to a 5.9 kVA one would reduce the fixed component by around 17 Euros after one year.
Furthermore, we also aim at exploring the value proposition of PV-BESS in LV commercial UPACs such as small restaurants and offices. Initial steps towards this direction are taken in [
28], where it is shown that, compared to domestic PV-BESS installations, the payback time of a small restaurant (yearly consumption around 24 MWh) is at least four times faster. The main reason for this is the simple fact that, due to the high electricity demand throughout the day, it is always possible to pre-charge the battery in the off-peak period and fully discharge it during the restaurant operation hours.


