Featured Application
The tool proposed in this work was conceived in order to serve as a preliminary instrument to size multi-energy rural energy systems, in the context of reaching universal access to energy as part of Sustainable Development Goal 7 (SDG7). In addition to its main purpose, we believe this tool might be of interest in the study of integrated smart energy districts and in general integrated energy systems with high penetration of renewables, where the interaction among different kinds of energy demands is considered.
Abstract
Energy system models for off-grid systems usually tend to focus solely on the provision of electricity for powering simple appliances, thus neglecting more energy-intensive and critical needs, such as water heating. The adoption of a Multi-Energy System (MES) perspective would allow us not only to provide comprehensive solutions addressing all types of energy demand, but also to exploit synergies between the electric and thermal sectors. To this end, we expand an existing open-source micro-grid optimization model with a complementary thermal model. Results show how the latter achieves optimal solutions that are otherwise restricted, allowing for a reduction in the Levelized Cost of Energy (LCOE) of 59% compared to a conventional microgrid, and an increase of reliance on renewable sources of 70%.
1. Introduction
To meet the challenging targets of climate change mitigation and ensuring affordable access to energy to present and future generations, it is imperative to develop innovative sustainable energy strategies addressing all types of energy demands [1,2,3]. Despite the progress experienced in recent years, the International Energy Agency estimates that still 900 million people do not have access to electricity, most of them living in rural areas [4]. The lack of reliable access to electricity is considered a limit on people’s opportunities and quality of life. The role of energy as pivotal to sustainable development is now widely recognized by the international community, as evidenced by the Sustainable Development Goals (SDGs) that include “access to affordable, reliable, sustainable, and modern energy for all” by 2030 as a target in the SDG7. The literature emphasizes that electricity access in rural areas should always be accompanied and sustained by other enabling activities and services to contribute to greater education attainment, enhanced business opportunities, and a higher quality of life [5]. Rural areas are generally sparsely populated, isolated, and characterized by high illiteracy rates, lack of access to healthcare, and lack of a clean water supply, which lead to “standards of living that almost universally lag far behind urban areas” [6]. This situation is even more stressed by the limited progress in rural electrification due to the high cost of grid extension, which is not balanced by gains in local markets [7]. The complexity of the problem becomes even higher if we consider all the activities that involve thermal energy too. Indeed, electric energy accounts only for about 15% of global total final energy consumption, while much larger shares are associated with transport (29%) and heating (52%) needs [1]. Households account for the majority of energy consumed in rural areas—they require energy mainly for cooking, water heating, lighting, and space heating. According to Kaygusuz [8], up to 80–100% of households’ energy consumption is devoted to cooking and water heating that, in cold climates, indirectly can supply also space heating. Although in few emerging countries the situation in the last decades has improved and a general shift to modern energy has been achieved, the rural households often do not benefit from it since modern fuels and the related technologies may have higher capital and maintenance costs [7]. As a consequence, people that live in rural areas are often dependent on solid biomass fuels (SBF) for thermal energy needs, and the use of SBFs increase households’ air pollution, bringing the levels of air quality and thermal comfort under the minimum standard conditions [9,10].
What is more, the smart integration of multiple energy vectors and storage options—usually referred to as the “Multi-Energy System” or “Smart Energy System” approach [2,3]—has been proven to allow for optimal energy system configurations that would remain unexplored within a single-sector domain [11]. Indeed, non-electric storage options are typically cheaper than their electric counterparts, and can be supplied by multiple energy vectors [11,12]. For instance, thermal storage can be fed both by direct heat and by electricity (through heat pumps or resistances), thus ensuring an increased flexibility of the overall system and a significantly higher penetration of renewable sources, or reduction of use of a primary non-renewable energy supply [12,13].
Adopting such a Multi-Energy System (MES) perspective might prove even more important in the context of off-grid areas, where both electric and thermal energy needs are typically satisfied by non-renewable fuels, associated with an unreliable and expensive supply-chain [14]. In such contexts, increasing the penetration of locally-available renewable sources would imply reducing the dependency on external fuel imports and the economic instability associated with price fluctuations. In fact, adoption of micro-grids in rural areas for providing access to electricity [7] is a subject greatly explored in scientific literature [15,16,17,18,19,20,21,22,23,24] and that is becoming a more frequently adopted solution in development projects both financed privately or by international organizations [25,26].
Nevertheless, projects regarding access to energy in off-grid villages usually tend to focus solely on the provision of electric energy for powering simple appliances, thus neglecting other energy needs—such as cooking, space heating and water heating—that are not traditionally satisfied by electricity and that require significantly higher amounts of energy [3,14]. The need for appropriate modeling for the vital purposes of planning and analysis of energy systems comes naturally with the rapid development of technologies and policies [27]. In particular, developing countries request an entirely different approach with respect to industrialized regions when modeling residential energy consumption. First, the socio-economic factors that are driving residential energy use, such as income and household size, are more heterogeneous in developing countries rather than in industrialized ones. Secondly, the future demand profile is affected by different factors and, in developing countries, it is more likely to evolve due to both the ongoing household electrification process and the transition from basic to modern appliances. Thirdly, in developing countries the relationship between economic monetary data and energy data is less obvious as a result of data quality, but also due to the role of the informal economy. Current energy models rarely consider these factors [28].
Despite the abundance of tools for modeling and optimizing off-grid systems, the large majority of them do not allow for an MES perspective, and even when some non-electric energy technologies and loads are allowed, only a restricted and pre-defined set of options is available. This is also owing to the lack of adequate modeling tools allowing the comprehensive analysis of multi-energy vectors and storage options at a village scale. In fact, modeling thermal energy systems for village-scale off-grid contexts requires an increasing effort, in terms of: (i) higher temporal resolution of load curves that may include cooking, space heating, and water heating activities [29]; and (ii) higher spatial resolution and necessity to include topographic constraints for most energy conversion technologies, in the absence of centralized heat distribution networks [3]. Such barriers are exacerbated by the fact that most of these tools are released as closed-source, non-modifiable software, preventing adaptability to the context and to users’ needs, as well as repeatability [30]. This is the case, for example, of the widespread tools HOMER Energy [31], DER-CAM [32], and iHOGA [33,34]. Although these software tools are widely used, as they have the maximum combination of renewable energy systems and perform optimization and sensitivity analysis for off-grid energy systems, they still present strong limitations on control methods, load demand management, and economic planning [21]. Exploration of multi-energy isolated systems has been conducted by Karavas et al. [35,36,37], who explore energy management of autonomous “polygeneration microgrids”, which highlight the economical convenience of adopting these kinds of integrated supply system. As a response to the lack of open-source models for off-grid energy systems optimization, Balderrama et al. recently released the open-source MicroGridsPy, a Python-based modeling framework conceived for the optimization of hybrid electric micro-grids [16]. In this study, we expand MicroGridsPy by integrating it with a novel complementary high-resolution thermal energy system model, including thermal energy conversion technologies, storage options, and back-up systems. The expanded model results in an integrated village-scale MES optimization tool (MESpy), which we apply to generate a set of scenarios for the implementation of a sustainable and resilient energy system for the case of the rural village of Toconao, located in the Atacama Desert in Chile, which is currently totally dependent on imports of diesel-generated electricity and liquid propane gas (LPG) for its energy supply. In particular, we focus on the two most energy-demanding final uses of the village, namely domestic hot water (DHW) and electric appliances for residential, commercial, and institutional uses. Our analysis aims at investigating the potential benefits, in terms of energy cost, overall system efficiency, penetration of renewables and imports dependency, ensured by the integration of the thermal and electric energy systems, compared to scenarios in which all energy needs are satisfied by means of traditional fuels or electricity only.
The remainder of this paper is structured as follows: Section 2 presents the case study, to which we apply our proposed modeling framework as proof of concept, and characterizes the different modeled scenarios; Section 3 presents the modeling approach of the thermal side of the energy system model proposed; the results of the modeling phase are presented and discussed in Section 4; finally, in Section 5 we draw the conclusions deriving from the work.
2. Case Study and Scenario Characterization
In the period of June–July 2017, we conducted a field campaign to assess the baseline energy situation of Toconao. The village population was about 800 inhabitants, grouped into 332 households. It comprised 32 commercial activities—such as restaurants and small grocery stores—a public school, and 6 public offices. Electricity was supplied by diesel-fired generation units from the nearby village of San Pedro de Atacama, yet the cost of electricity tariffs were more than double the national average and the supply was subject to frequent blackouts, typically lasting for several days and necessitating reliance on a 320-kW diesel backup generator. LPG bottles, delivered to the village by trucks on a weekly basis, represent instead the main source for the supply of thermal energy for final uses. As seen for electricity, the gas price is also significantly higher than the national and regional average [38] due to its isolated location. Overall, the village shows a marked dependency on expensive, non-renewable, unreliable, and imported primary energy sources. In addition, it is worth noting that an estimated more than half of the total final energy consumption is due to thermal demand—in accordance with the abovementioned global trend—mostly driven by DHW loads. On the other hand, the area is characterized by a significant solar energy potential due to its latitude and height above mean sea level, with a total annual global horizontal irradiation of 2578 kWh/(m2∙year).
Figure 1 presents a conceptual scheme of the village and the energy carriers considered in this study. Toconao will be considered as an isolated country and the International Energy Agency’s (IEA’s) energy accounting method [39] will be adopted to estimate the Total Primary Energy Supply (TPES) entering the system.
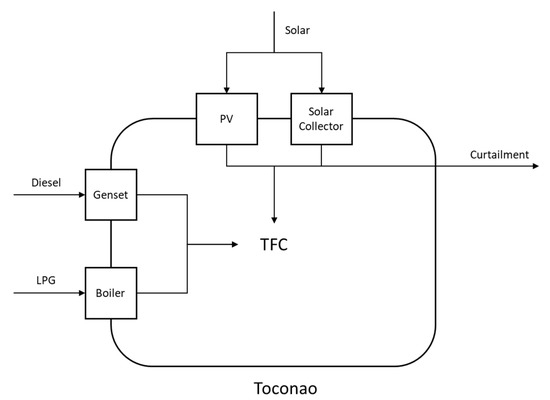
Figure 1.
Conceptual scheme of the village of Toconao for energy accounting purposes.
We propose four configuration scenarios (summarized in Figure 2) to analyze how different energy system architectures may improve the energy cost, the overall energy efficiency of the village, the renewables penetration, and the dependency on import, namely:
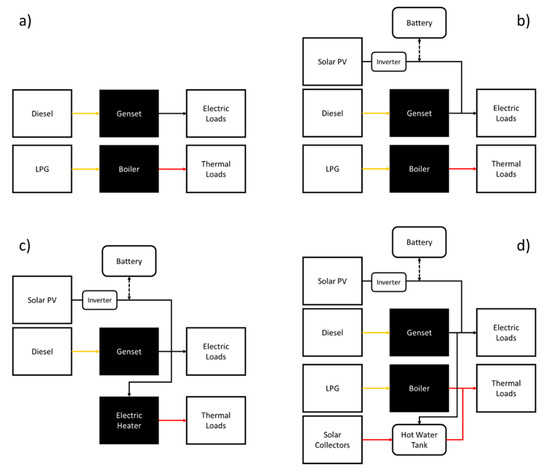
Figure 2.
Schematic summary of the four scenarios considered: (a) traditional energy system; (b) conventional micro-grid; (c) multi-good micro-grid; (d) integrated multi-energy system.
(a) Traditional energy system, in which all main energy needs (electric and DHW) are satisfied by means of the current mix of sources and technologies, i.e., diesel generators and LPG boilers.
(b) Conventional micro-grid, in which a typical hybrid micro-grid (including photovoltaic (PV) panels, batteries, and diesel generators) is installed to only supply purely electric loads, while DHW loads are covered by LPG boilers. This configuration scenario is defined to represent the mainstream strategy adopted in the framework of off-grid projects, which rarely take into account non-electric loads.
(c) Multi-good micro-grid, where the hybrid micro-grid is sized in order to meet all the energy needs of the village, hence including DHW loads, which are in this case supplied by means of electric heaters.
(d) Integrated multi-energy system, where solar thermal collectors, hot-water tanks, and LPG boilers are coupled with the hybrid micro-grid to serve DHW loads. The micro-grid can also interact with the thermal energy system through electric resistance heating elements installed inside hot-water tanks. In this configuration, electricity can be thus stored both directly, in battery banks, and indirectly, in hot-water tanks for thermal use.
It is worth specifying that the possibility of cogeneration from the diesel generators is not taken into account within the scenarios, due to the absence of a centralized heat distribution network and to the low realism of assuming the construction of such an infrastructure in the context of interest.
3. Modeling Approach
3.1. Load Profiles
For the generation of multi-energy load demand profiles we adopted a similar approach to the one used in previous work [40] making use of the open-source tool RAMP [41]. RAMP relies on a high-resolution (1-min time-step) bottom-up stochastic approach that builds on information about appliances’ ownership and time of use collected via interviews in the field. The model is based on the definition of different classes of users, each characterized by a number of individual users and a set of electrical and thermal appliances. Each run of the model computes a one-day load curve by simulating the random variability of the functioning times and absorbed power of each appliance per user; the sum of all the single loads results in the total aggregated demand of the study area. The interested reader can refer to the original RAMP work [41] for a more detailed description of the model.
3.1.1. Electric Load Curves
Electric load profiles are generated based on four different sets of input data, reproducing four specific seasonal behaviors. The data were collected during a field campaign conducted by the authors in the study area (2017), in which specific questionnaires to investigate the ownership and usage patterns of electrical and thermal appliances were administered to the population. The seasonality of the loads refers to dawn and dusk times, which influence the working hours of street lighting, outdoor, and indoor lights. Also, the school follows seasonal behavior and the electric load is considered null during the holiday period (December–February). Moreover, the loads are modeled depending on the day of the week, and, for example, the school is not considered to have any load during the weekends.
The collected data are used to build a table of electricity behavior of the different identified categories of users inside the village, reported in Tables S1 and S2 of the Supplementary Information. For each user, the type and number of owned appliances are identified, and for each appliance its (i) power, (ii) number of daily functioning time windows, (iii) time windows start and end times, (iv) percentage of variability of time windows start and end times, (v) total daily functioning time, (vi) percentage of variability of total daily functioning time, (vii) minimum time the appliance is kept on after a switch-on event, (ix) percentage of occasional use, and (x) weekend or weekday use. Stochastically simulating the energy consumption of each user inside the village based on this information, the aggregated electric load profile is generated. The interested reader can refer to the original work describing the RAMP tool [41] and to a previous work in which the described methodology is adopted and coupled with a mini-grid sizing tool for a case study in Bolivia [40].
3.1.2. Thermal Load Curves
RAMP is specifically designed to generate not only electrical demand profiles but thermal demand profiles as well—DHW needs in this specific case. In order to improve the characterization of the power needed for heating the water for domestic purposes, a modification to RAMP is proposed: according to Fischer et al. [42] the daily groundwater temperature was derived from the daily average ambient temperature through Equation (1).
where:
- is the groundwater temperature;
- is the progressive number of the considered day of the year;
- is the yearly average ambient temperature;
- is the progressive number of the day with the lowest temperature of the year.
Once the daily groundwater temperature is computed, it is possible to calculate the power consumed by the three main tasks identified: showers, handwashing, and dishwashing:
where:
- is the power required to heat the water for the operation of the task;
- is the water mass flow required by the task, retrieved from references [43,44];
- is the water isobaric specific heat;
- is the temperature of the water needed for the specific task, retrieved from references [43,44];
- is the groundwater temperature.
The time series with the powers of the DHW-related tasks are then fed to the RAMP model. The modifications to RAMP are available with the repository of the model [45].
Furthermore, differently from electric loads, thermal loads related to different user classes are not aggregated in a single total load profile. In fact, considering the absence of a centralized heat distribution network, thermal loads need to be spatially bound to the site of consumption. Accordingly, we model a separate thermal load profile for each user class, namely:
- (i)
- commercial activities,
- (ii)
- domestic,
- (iii)
- public offices,
- (iv)
- school.
No seasonality is considered for thermal loads, which are stochastically generated for 365 days based on the same set of input data. Further details about the data and the assumptions made for the creation of electric and thermal loads are provided in Supplementary Information.
3.2. Multi-Energy System
The MESpy model, accessible at the GitHub Repository [45], builds on the existing concept developed by Balderrama et al. [16] for purely electric micro-grids, by adding a complementary thermal energy system model comprising solar thermal energy conversion technologies (flat-plate solar thermal collectors), thermal storage (hot-water tanks) and traditional back-up systems (LPG boilers). Thermal technologies are not connected by any centralized heat distribution network, and thus direct heat consumption remains bound to the site of generation. Nevertheless, the electric and thermal systems are interconnected by means of electric resistance heating elements that are modeled inside hot-water tanks, thus allowing a “smart” electric recharge of the thermal storage that gives rise to a more flexible MES, as shown by the sketch in Figure 3. Such electric resistance heating elements are also interpreted as standalone components to model electric heaters in the multi-good micro-grid configuration. The main inputs and output of MESpy are summarized in Table 1.
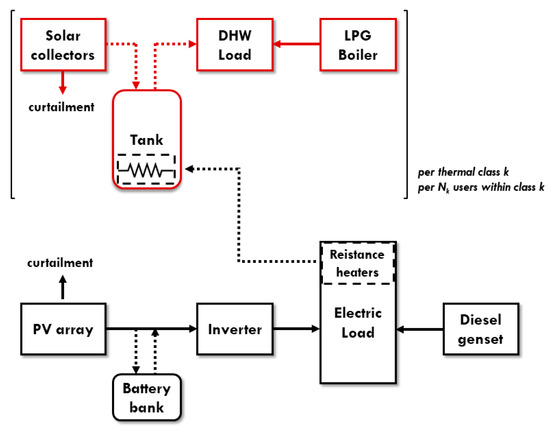
Figure 3.
Schematic representation of the integrated electric and thermal energy system model. The thermal energy system is not a single centralized entity but rather the aggregate of multiple user-scale individual systems, which are modeled for each user within each user class and only connected through the electricity grid, in the absence of a heat distribution network.

Table 1.
Main inputs and outputs of the Multi-Energy System model.
Further details about the specific technical characteristics of the modeled technologies, and about PV panels’ and solar collectors’ outputs, are available in Figure 3.
It is worth noting that, while the electric energy system consists of a single entity, the thermal energy system is composed of multiple user-scale energy systems, which reproduce topographically constrained generation and consumption for each user within each user class. In other terms, the model considers each thermal user class k (as listed above: commercial activities, domestic, public offices, and school) as a separate system consisting of the aggregate of Nk user-scale subsystems (where Nk is the number of users within the k-th class). Indeed, the thermal energy balance (Equation (3)) satisfies independently the thermal demand (in this case DHW only) for each thermal user class k, and for each time step t.
where is the energy supplied by the LPG boilers, the energy supplied by the hot water tank, is the fraction of the excess energy produced by solar collectors that cannot be stored in the tank, and is the accepted fraction of unmet thermal load—which we set at 1% for all the scenarios.
On the electrical side, the energy balance (Equation (4)) includes the energy generated by PV panels () and diesel generators (), the energy flows to and from the battery ( and ), the electric energy that is curtailed (), the energy supplied to the thermal storage through electric resistance heating elements (), and the fraction of accepted unmet load ()—set at 1%, as for thermal loads.
where is the cumulative energy absorbed by the electric resistance heating elements of all n thermal classes, as shown by Equation (5).
As compared to the original MicroGridsPy model, which includes both linear programming (LP) and mixed-integer linear programming (MILP) optimization modes depending on the way the diesel generator is modeled, the novel MESpy model is based uniquely on a LP configuration. This choice is motivated by the necessity to keep the computational time within a reasonable range while we increase the temporal resolution of the model from the original 1 h to the current 1 min.
3.2.1. Electric Components
The equations adopted to model the behavior of the electric components, and thus constraining the variables in Equation (4), are kept identical to those already introduced by Balderrama et al. [16] for the original MicroGridsPy model, in its LP version. The reader is thus referred to the abovementioned study for further details.
3.2.2. Thermal Components
Solar Thermal Collectors
The total thermal energy provided by the solar collectors () for each class k is computed as the energy generated by a single collector ()—which is given as an input to the model—multiplied by the number of solar collectors in the class, .
Further details about the specific flat-plate collector model used as a reference, and about how the collector output is obtained, are provided in Supplementary Information. It is worth noting that is an optimization variable for each class and is not given as an input. Indeed, it is indirectly taken into account in Equation (3), due to its contribution to the definition of (Equation (7)).
Hot-Water Tanks
Hot-water tanks provide an option for thermal energy storage within the model, and can be fed by both solar collectors and electric resistance heating elements. The tanks are represented adopting a fully-mixed (or thermal capacity) model [46]: for each time-step t and for each class k, the thermal energy stored in the tank () is computed based on the balance reported in Equation (7). The latter considers the energy stored in the preceding step (), the energy supplied by solar collectors () and by the electrical resistance (, with = 1), and the energy flow outside the tank (). Energy losses due to the heat transfer between thermal storage and environment are taken into account by means of an efficiency parameter ( = 0.999), following the approach proposed by Duffie and Beckman [47].
A set of constraints is also defined, as shown in Equations (8)–(10). In particular:
- The energy stored in the tank is constrained not to exceed the maximum capacity of the tank, for each class k.
- The energy stored in the tank is constrained to be kept above a minimum value (defined as depth of discharge, ), defined as a percentage of the nominal tank capacity.
- The thermal energy flow out of the tank () is constrained to be lower than the tank maximum power of discharge () multiplied by a delta time () calibrated on the time-step.
It is worth noting that, in opposition to Battery Energy Storage System (BESS), where the depth of discharge is due to the fact that batteries have a minimum level of charge at which they can discharge during the functioning cycle as constrained by electrochemical limitations, in the case of thermal storage the depth of discharge is due to a different phenomenon. The energy contained in the water tank is defined by an energy balance to the mass of water . Following this equation, the level of zero energy corresponds to the tank containing water at ground temperature . Since the user does not desire to use water at ground temperature, but at a minimum temperature , as defined in Section 3.1.2, the minimum level at which the tank can operate is defined by this desired temperature, resulting in the tank depth of discharge.
Electric Resistance Heating Elements
Electric resistance heating elements are modeled inside hot-water tanks to maintain a minimum level of stored thermal energy (i.e., a minimum water temperature) as well as to serve as an additional backup system to satisfy the thermal demand when needed. The decision about the possible switch-on of electric resistances at each time step is a result of the cost-optimization problem, as it is for LPG boilers, optimization of which is considered for each user class independently. The resistance is assumed to have a unitary efficiency () and the energy provided per unit time-step () is constrained to not exceed its nominal capacity (), as shown in Equation (11).
LPG Boilers
LPG boilers act as a backup system connected directly to the thermal load. The thermal energy per unit time-step provided by LPG boilers () is constrained to remain below its nominal capacity value ().
The model also computes the LPG consumption () dividing the energy supplied by the boilers by their nominal efficiency () and the LPG heating value, as shown by Equation (13).
3.2.3. Optimization
The objective function is the minimum total Net Present Cost (NPC) of the energy system, computed in Equation (15).
where is the total investment cost, is the yearly constant cost of the project, is the project lifetime, is the discount rate factor, and is the cost of components replacement (in this case defined for batteries only).
The total investment cost is calculated as the summation of the specific investment costs multiplied by the total installed capacity of each component. The specific costs are provided in Table S1 in the Supplementary Information and are considered as the total installed cost, including hardware costs (component, cabling costs), and installation costs (connection costs including inverters cost if required), per unit of capacity.
The total investment is evaluated by summing the capital costs of all the installed components, computed based on their specific costs (expressed in USD/kW for generation technologies and USD/kWh for storage). Equation (16) reports the detailed calculation of the investment cost, in which represents the percentage of the investment that is financed by a bank (or any another entity).
is calculated as shown by Equation (17), where is the cost of operation and maintenance of the system and is the fixed-rate loan payment, while the other variables represent costs associated with the use of fossil fuels and the cost of losing the unmet load ().
in Equation (18) is computed as per Equation (18), where is the number of years in which the loan has to be paid back and is the interest rate.
The cost of components replacement is finally computed as per Equation (19), where is the number of years after which a battery is replaced.
Based on the NPC, the model also evaluates the Levelized Cost of Energy (LCOE) as in Equation (20),
where is the total energy demand (electric and thermal) of the system.
An overall system efficiency is also computed as per Equation (21),
where is the net (i.e., after subtracting the lost load) total energy demand, and is the total energy supplied by each j-th energy supply technology (such as diesel generators, PV panels, LPG boilers, and solar thermal collectors).
4. Results and Discussion
4.1. Generated Load Profiles
Figure 4 reports four different load profiles, one per each modeled season, of the electric daily load profile of the entire village, generated with a 1-min time-step. The profile shows a peak of about 175 kW in the evening (approximately around 8:00 p.m.).
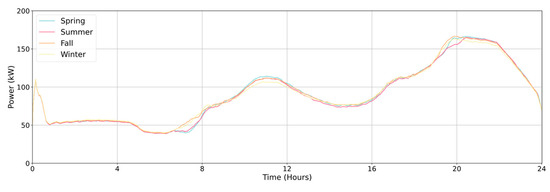
Figure 4.
Total electric load profile in an average day in different seasons.
Thermal loads are represented in Figure 5, disaggregated for user class. As expected, these are characterized by almost-instantaneous significant peaks, especially as regards the school user class, being a single user with several short hot-water needs during the day.
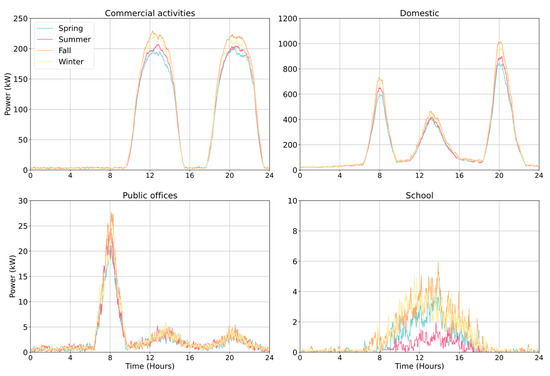
Figure 5.
Thermal load profiles for the four user classes: (top right) domestic; (top left) commercial activities; (bottom left) public offices; and (bottom right) school.
The two modeled energy demands correspond to a Total Final Consumption (TFC) of about 3245 MWh/year, with a share of 25% for electricity and 75% for DHW, in accordance with the literature [8].
4.2. Optimization Results
The MES model provides the optimal energy system configuration for each of the selected scenarios. The results in terms of LCOE, Total Primary Energy Supply (TPES), import dependency and renewables penetration are summarized in Table 2.
Table 2.
Summary of selected indicators for the four proposed scenarios.
All the proposed scenarios result in an improvement of the energy situation of the village as compared to the baseline situation. The conventional micro-grid configuration, in which thermal needs are still constrained to be satisfied by LPG boilers alone, already allows the user to achieve a consistent reduction of TPES and a significative reduction in the LCOE. However, renewables penetration and energy independency are significantly lower than for the integrated multi-energy system case and are achieved at the expense of a higher LCOE. This highlights how focusing solely on electric needs does not allow for the identification of the overall optimal solution. Similarly, the multi-good micro-grid scenario, in which all energy needs (including DHW, through electric heaters) are satisfied by an electric micro-grid, is associated with a lower LCOE value than the conventional microgrid solution, but still far from the results that can be achieved with a fully integrated system. In fact, although the system is in this case characterized by a very high penetration of solar PV panels, the micro-grid size increases significantly as a consequence of the need to manage two different loads with a single and costly storage option: as shown in Table 3, the installed PV capacity is more than four times that of the conventional micro-grid configuration, also the battery bank is almost four-fold and the diesel genset capacity is almost the same size as the baseline case, while it was almost left unused in the conventional microgrid. As expected, this configuration is suboptimal due to the restriction that is derived from the exclusion of the possibility of installing LPG boilers or thermal storage. It also results in far the highest investment cost among the four system configurations considered, confirming its low feasibility in rural contexts.
Table 3.
Summary of installed nominal capacities, total investment, and operations and maintenance (O&M) costs for different energy conversion and storage technologies in the four proposed scenarios.
This result underlines how the idea of satisfying all types of energy demand through electric appliances implies significant complications in terms of system management and dispatch strategy, leading to an unprofitable overreliance on electric storage options and an unrealistic size of installed renewable power. This can be seen in the graphical representation of the electrical dispatch in Figure 6c: the electricity production of the multi-good micro-grid far exceeds the purely electric load, as a relevant excess needs to be redirected to electric heaters in order to also satisfy thermal loads. Conversely, the excess electricity conveyed to thermal loads in the integrated multi-energy system scenario represents only a negligible fraction of the total electricity production, i.e., that needed to compensate losses from the storage tanks.
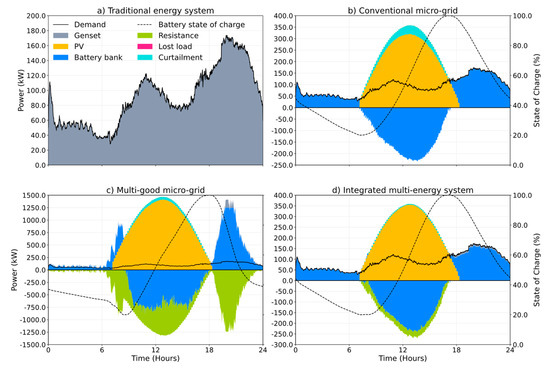
Figure 6.
Electric energy dispatch strategy in the four modeled scenarios, namely: (a) baseline; (b) conventional micro-grid; (c) multi-good micro-grid; (d) integrated multi-energy system. The represented day is 23rd September 2017. Representative days for all the modeled seasons are reported in the Supplementary Information of this work.
The integrated multi-energy system is the configuration allowing for the lowest LCOE, notwithstanding the need to have thermal energy conversion technologies spatially bound to the site of consumption and the subsequent impossibility to exploit economies of scale. This is a result of the combined presence of a second renewable energy conversion technology (solar collectors) and, moreover, of an additional and more cost-effective energy storage option, i.e., hot-water tanks. Figure 7 shows the thermal energy dispatch for representative users within each thermal user class, in the integrated multi-energy system. It is noteworthy how the adoption of solar collectors and hot-water tanks, integrated with the electric resistances, as technology to satisfy the DHW needs, made the thermal side of the system almost energy independent: the proposed system is capable of satisfying the totality of the thermal demand on its own, as it emerges from the low installed capacity of the LPG boilers in Table 3.
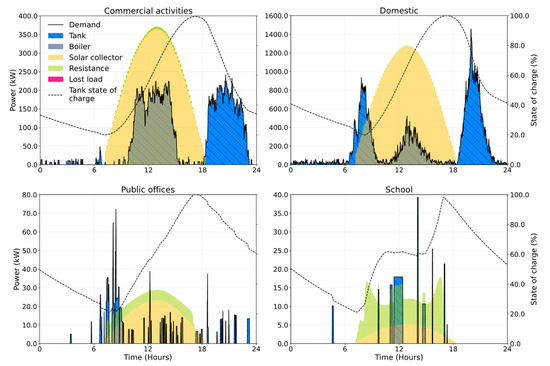
Figure 7.
Example of thermal energy dispatch for representative single users for each of the four modeled user classes. The represented day is 23rd September 2017. Representative days for all the modeled seasons are reported in the Supplementary Information of this work.
This is a consequence of the fact that PV generation follows the same production pattern of solar collectors, bound to the daily solar irradiance profile. If other renewable sources, with a different daily production profile (such as wind), were exploitable, they could potentially further benefit from the presence of thermal storage, which could also be electrically charged and used during morning and evening peaks.
Figure 7 represents the thermal dispatch strategy of the configuration scenario for the integrated multi-energy system, and shows in barred blue the output from the storage tank, fed by both electric resistance and solar collectors, and subject to thermal dispersion towards the environment, as can be deducted from the downward slope of the state of charge during the night. The resistance and the solar collector output energy are plotted in the background, and when they are not satisfying the loads, they are charging the tank, or curtailed. Curtailment is not plotted to avoid an overcrowded plot.
5. Conclusions and Future Work
The study shows that the novel open-source MES optimization tool that we developed, building on the existing MicroGridsPy, effectively allows for the generation and comparison of multiple integrated thermal and electric energy system configurations for off-grid contexts. In particular, the application of the tool to the Chilean village of Toconao confirms how the integration of multiple energy vectors and storage options allows to identify the lowest-cost optimal solutions that remain unreachable within a single-sector perspective. Indeed, both “micro-grid” configurations proposed (conventional and multi-good) face some limitations as compared to the integrated multi-energy system, either in terms of economic viability or technical feasibility.
In fact the conventional micro-grid (b) configuration, in which thermal loads are not involved in the optimization of the new supply technology, and left to be satisfied with the same technology adopted in the traditional energy system (a), lowers the NPC of the project by 15%, mainly by cutting the use of diesel through the 20 years of operation, overcompensating the higher installation cost of the PV technology, but leaves untapped the potential of the integration of the two energy systems.
The multi-good micro-grid (c) represents a first step towards this integration. In this configuration the totality of the thermal load is satisfied by the electric microgrid, by means of electric water heaters. This configuration shows slight improvements in terms of NPC, and hence, of LCOE, showing a further reduction of 8% in the Net Present Cost, meaning 23% less than the traditional energy system (a). While from the point of view of penetration of renewable energy in the system, this configuration with a penetration of 83% results in 60% more solar energy bring used in the system compared with configuration (b).
Reaching the higher level of integration in this work is represented by the multi-energy system (d), configuration in which thermal loads and electrical loads can be satisfied by a completely integrated system, made up of PV panels; battery electric storage system; a back-up diesel generator; thermal solar collectors; a hot-water storage tank, with electric resistances able to heat up the contained water; and back-up LPG boilers. In this configuration is possible to reach a minimum NPC that is 65% lower than the traditional energy system (a), 59% lower than the conventional micro-grid (b), and 54% lower than the multi-good micro-grid (c). What is more, a LCOE of 0.090 USD/kWh and a renewable penetration of 93.7% are reached.
A “Multi-Energy” or “Smart Energy System” perspective is thus critical to achieve overall optimal energy systems configurations, especially in relationship with the inclusion of multiple storage options. Potentially, larger benefits might be achieved in cases where different renewable energy sources can be coupled and where even more energy vectors and storage options can be integrated. Furthermore, the link between the electric and thermal sector is in this case limited to the supply of energy to counterbalance heat losses from thermal storage, but it might be improved by considering the use of heat pumps or combined heat and power (CHP) plants.
It is also worth noting how the focus of the present analysis is the comparison of different energy system scenarios from an overall point of view. As such, it does not aim at accurately reproducing the physical behavior of all the modeled technologies, which may be indeed obtained, if needed, by implementing a MILP logic. We are aware of this limitation and future work is planned to explore the effects of implementing it. For instance, MILP would allow better evaluation of the choice of installing or not installing solar thermal collectors on a given building, by binding the decision to a minimum integer number of kW installed per user type, rather than allowing a linear space of optimization from 0 to infinite that produces less realistic figures (such as having fractions of the unitary nominal collector capacity installed). Also, from a thermodynamic point of view, the modeling of specific components such as the storage tank might be improved, within a MILP domain, by passing from a fully-mixed model to a multi-node or other types of models that allow to take into account stratification, as well as by adopting a temperature-dependent heat loss factor. However, it should be noted that the fully-mixed approach here adopted provides a lower bound of performance and represents hence a conservative approach.
Supplementary Materials
The following are available online at https://www.mdpi.com/2076-3417/10/21/7445/s1, Figure S1: Summer Electric energy dispatch strategy in the four modelled scenarios, Figure S2: Autumn Electric energy dispatch strategy in the four modelled scenarios, Figure S3: Winter Electric energy dispatch strategy in the four modelled scenarios, Figure S4: Summer thermal energy dispatch for representative single users for each of the four modelled user classes, Figure S5: Autumn thermal energy dispatch for representative single users for each of the four modelled user classes, Figure S6: Winter thermal energy dispatch for representative single users for each of the four modelled user classes, Figure S7: Solar thermal collector efficiency curve, as a function of the reduced temperature difference, Table S1: User types and number of users per each type, as defined in RAMP, Table S2: Number of electric appliances and thermal appliances defined in RAMP for each User type, Table S3: Modelling parameters adopted in the four configurations.
Author Contributions
N.S., S.P., and S.L.B.S. conceptualized the methodology; N.S., S.P. and L.R. processed the data and run the analysis; S.Q. and E.C. reviewed the paper; all authors contributed in writing the manuscript. All authors have read and agreed to the published version of the manuscript.
Funding
This research received no external funding.
Acknowledgments
The authors gratefully acknowledge Universidad Tecnica Federico Santa Maria of Chile and professors David Saldivia and Rodrigo Barraza for their support during the data collection process. Special thanks to Francesco Lombardi for the fruitful discussions about the thermal side of the model.
Conflicts of Interest
The authors declare no conflict of interest.
Abbreviations
| MES | Multi-Energy System |
| LPG | Liquid Propane Gas |
| DHW | Domestic Hot Water |
| TPES | Total Primary Energy Supply |
| TFC | Total Final (energy) Consumption |
| NPC | Net Present Cost |
| LCOE | Levelized Cost of Energy |
| LP | Linear Programming |
| MILP | Mixed-Integer Linear Programming |
| BESS | Battery Energy Storage System |
Nomenclature
| Groundwater temperature | K | |
| Progressive number of the considered day of the year | - | |
| Yearly average ambient temperature | K | |
| Progressive number of the day with the lowest temperature of the year | - | |
| Power required to heat the water for the operation of the task | W | |
| Water mass flow required by the task | l/s | |
| Water isobaric specific heat | ||
| Thermal energy demand | Wh | |
| Energy supplied by the boiler | Wh | |
| Energy exiting the hot-water tank | Wh | |
| Fraction of the excess energy produced by solar collectors that cannot be stored in the tank | Wh | |
| Allowed fraction of unmet thermal load | Wh | |
| Electricity demand of the study area | Wh | |
| Energy produced by the PV panels | Wh | |
| Energy produced by the generator | Wh | |
| Flow of energy into the battery | Wh | |
| Flow of energy out of the battery | Wh | |
| Electric energy that is curtailed | Wh | |
| Energy supplied to the thermal storage through electric resistance heating elements | Wh | |
| Cumulative energy absorbed by the electric resistance heating elements of all n thermal classes | Wh | |
| Allowed fraction of unmet electric load | Wh | |
| Total thermal energy provided by the solar collectors | Wh | |
| Energy generated by a single solar collector | Wh | |
| Number of solar collectors in the class | - | |
| Thermal energy stored in the tank at the time step t | Wh | |
| Thermal energy stored in the tank at the timestep t–1 | Wh | |
| Coefficient accounting for energy losses due to the heat transfer between thermal storage and environment | - | |
| Thermal efficiency of the electric resistances | - | |
| Depth of discharge | - | |
| Tank maximum power of discharge | W | |
| LPG consumption | l | |
| Boiler efficiency | - | |
| Lower heating value of the LPG | ||
| Total investment cost | ||
| Yearly constant cost of the project | ||
| Discount rate | - | |
| Interest rate | - | |
| Cost of components replacement | ||
| Number of installed PV panels | - | |
| Capacity of a PV unit | kW | |
| Specific cost of PV unit | $/kW | |
| Capacity of installed battery bank | kWh | |
| Specific cost of battery bank | $/kWh | |
| Capacity of installed generator | kW | |
| Specific cost of generator | $/kW | |
| Number of solar collectors installed | - | |
| Capacity of a solar collector | kW | |
| Specific cost of solar collector | $/kW | |
| Capacity of the installed hot-water tank | kWh | |
| Specific cost of the hot-water tank | $/kWh | |
| Capacity of the installed boiler | kW | |
| Specific cost of the boiler | $/kW | |
| Capacity of the installed electric resistance | kW | |
| Specific cost of the electric resistance | $/kW | |
| Percentage of the investment financed by a bank | - | |
| Cost of operation and maintenance of the system | ||
| Fixed-rate loan payment | ||
| Cost of the used diesel | ||
| Cost of the used LPG | ||
| Cost of the actually unmet load | ||
| Total energy demand (electric and thermal) of the system | kWh | |
| Net (i.e., after subtracting the lost load) total energy demand | kWh | |
| Total energy supplied by each j-th energy supply technology | kWh | |
| Overall system efficiency | - |
References
- Collier, U. Renewable Heat Policies—Delivering Clean Heat Solutions for the Energy Transition; International Energy Agency: Paris, France, 2018. [Google Scholar]
- Lund, H.; Østergaard, P.A.; Connolly, D.; Mathiesen, B.V. Smart energy and smart energy systems. Energy 2017, 137, 556–565. [Google Scholar] [CrossRef]
- Mancarella, P. MES ( multi-energy systems): An overview of concepts and evaluation models. Energy 2014, 65, 1–17. [Google Scholar] [CrossRef]
- International Energy Agency. World Energy Outlook 2018; Organisation for Economic Co-Operation and Development (OECD): Paris, France, 2018. [Google Scholar]
- Riva, F.; Ahlborg, H.; Hartvigsson, E.; Pachauri, S.; Colombo, E. Electricity access and rural development: Review of complex socio-economic dynamics and casual diagrams for more appropriate energy modelling. Energy Sustain. Dev. 2018, 43, 203–223. [Google Scholar] [CrossRef]
- Sahn, D.; Stifel, D. Urban-Rural Inequality in Living Standards in Africa. J. Afr. Econ. 2003, 12, 564–597. [Google Scholar] [CrossRef]
- Mandelli, S.; Barbieri, J.; Mereu, R.; Colombo, E. Off-grid systems for rural electrification in developing countries: Definitions, classification and a comprehensive literature review. Renew. Sustain. Energy. Rev. 2016, 58, 1621–1646. [Google Scholar] [CrossRef]
- Kaygusuz, K. Energy services and energy poverty for sustainable rural development. Renew. Sustain. Energy Rev. 2011, 15, 936–947. [Google Scholar] [CrossRef]
- Ravindra, K.; Agarwal, N.; Kaur-Sidhu, M.; Mor, S. Appraisal of thermal comfort in rural household kitchens of Punjab, India and adaptation strategies for better health. Environ. Int. 2019, 124, 431–440. [Google Scholar] [CrossRef]
- WHO. Household Air Pollution and Health; WHO: Geneva, Switzerland, 2018. [Google Scholar]
- Mathiesen, B.V.; Lund, H.; Connolly, D.; Wenzel, H.; Ostergaard, P.A.; Moller, B.; Nielsen, S.; Ridjan, I.; Karnoe, P.; Sperling, K.; et al. Smart Energy Systems for coherent 100% renewable energy and transport solutions. Appl. Energy 2015, 145, 139–154. [Google Scholar] [CrossRef]
- Lund, H.; Østergaard, P.A.; Connolly, D.; Ridjan, I.; Mathiesen, B.V.; Hvelplund, F. Energy Storage and Smart Energy Systems. Int. J. Sustain. Energy Plan. Manag. 2016, 11, 3–14. [Google Scholar] [CrossRef]
- Good, N.; Mancarella, P. Flexibility in Multi-Energy Communities with Electrical and Thermal Storage: A Stochastic, Robust Approach for Multi-Service Demand Response. IEEE Trans. Smart Grid 2017, 10, 503–513. [Google Scholar] [CrossRef]
- International Energy Agency. Energy Access Outlook 2017—From Poverty to Prosperit; International Energy Agency: Paris, France, 2017. [Google Scholar]
- Moretti, L.; Astolfi, M.; Vergara, C.; Macchi, E.; Pérez-Arriaga, J.I.; Manzolini, G. A design and dispatch optimization algorithm based on mixed integer linear programming for rural electrification. Appl. Energy 2019, 234, 1104–1121. [Google Scholar] [CrossRef]
- Balderrama, S.; Lombardi, F.; Riva, F.; Canedo, W.; Colombo, E.; Quoilin, S. A two-stage linear programming optimization framework for isolated hybrid microgrids in a rural context: The case study of the “El Espino” community. Energy 2019, 188, 116073. [Google Scholar] [CrossRef]
- Ciller, P.; De Cuadra, F.; Lumbreras, S. Optimizing Off-Grid Generation in Large-Scale Electrification-Planning Problems: A Direct-Search Approach. Energies 2019, 12, 4634. [Google Scholar] [CrossRef]
- Hirsch, A.; Parag, Y.; Guerrero, J. Microgrids: A review of technologies, key drivers, and outstanding issues. Renew. Sustain. Energy Rev. 2018, 90, 402–411. [Google Scholar] [CrossRef]
- Peters, J.; Sievert, M.; Toman, M.A. Rural electrification through mini-grids: Challenges ahead. Energy Policy 2019, 132, 27–31. [Google Scholar] [CrossRef]
- Balderrama, J.G.P.; Subieta, S.B.; Lombardi, F.; Stevanato, N.; Sahlberg, A.; Howells, M.; Colombo, E.; Quoilin, S. Incorporating high-resolution demand and techno-economic optimization to evaluate micro-grids into the Open Source Spatial Electrification Tool (OnSSET). Energy Sustain. Dev. 2020, 56, 98–118. [Google Scholar] [CrossRef]
- Sinha, S.; Chandel, S. Review of software tools for hybrid renewable energy systems. Renew. Sustain. Energy Rev. 2014, 32, 192–205. [Google Scholar] [CrossRef]
- Stevanato, N.; Lombardi, F.; Guidicini, G.; Rinaldi, L.; Balderrama, S.L.; Pavičević, M.; Quoilin, S.; Colombo, E. Long-term sizing of rural microgrids: Accounting for load evolution through multi-step investment plan and stochastic optimization. Energy Sustain. Dev. 2020, 58, 16–29. [Google Scholar] [CrossRef]
- Zhao, B.; Zhang, X.; Li, P.; Wang, K.; Xue, M.; Wang, C. Optimal sizing, operating strategy and operational experience of a stand-alone microgrid on Dongfushan Island. Appl. Energy 2014, 113, 1656–1666. [Google Scholar] [CrossRef]
- Díaz, P.; Arias, C.; Pena, R.; Sandoval, D. FAR from the grid: A rural electrification field study. Renew. Energy 2010, 35, 2829–2834. [Google Scholar] [CrossRef]
- Energy Sector Management Assistance Program. Mini Grids for Half a Billion People: Market Outlook and Handbook for Decision Makers; ESMAP Technical Report 014/19 2019; The World Bank: Washington, DC, USA, 2019. [Google Scholar]
- International Renewable Energy Agency (IRENA). Policies and Regulations for Renewable Mini-Grids; International Renewable Energy Agency: Abu Dhabi, UAE, 2018. [Google Scholar]
- Mendes, G.; Ioakimidis, C.; Ferrão, P. On the planning and analysis of Integrated Community Energy Systems: A review and survey of available tools. Renew. Sustain. Energy Rev. 2011, 15, 4836–4854. [Google Scholar] [CrossRef]
- Van Ruijven, B.J.; Van Vuuren, D.P.; De Vries, B.J.; Isaac, M.; Van Der Sluijs, J.P.; Lucas, P.L.; Balachandra, P. Model projections for household energy use in India. Energy Policy 2011, 39, 7747–7761. [Google Scholar] [CrossRef]
- McKenna, E.; Thomson, M. High-resolution stochastic integrated thermal–electrical domestic demand model. Appl. Energy 2016, 165, 445–461. [Google Scholar] [CrossRef]
- Pfenninger, S.; Decarolis, J.; Hirth, L.; Quoilin, S.; Staffell, I. The importance of open data and software: Is energy research lagging behind? Energy Policy 2017, 101, 211–215. [Google Scholar] [CrossRef]
- HOMER Energy LLC. HOMER Energy n.d. Available online: https://www.homerenergy.com/ (accessed on 25 September 2020).
- Mashayekh, S.; Stadler, M.; Cardoso, G.; Heleno, M. A mixed integer linear programming approach for optimal DER portfolio, sizing, and placement in multi-energy microgrids. Appl. Energy 2017, 187, 154–168. [Google Scholar] [CrossRef]
- Dufo-López, R.; Bernal-Agustín, J.L.; Yusta-Loyo, J.M.; Domínguez-Navarro, J.A.; Ramírez-Rosado, I.J.; Lujano, J.; Aso, I. Multi-objective optimization minimizing cost and life cycle emissions of stand-alone PV–wind–diesel systems with batteries storage. Appl. Energy 2011, 88, 4033–4041. [Google Scholar] [CrossRef]
- Dufo-López, R.; Cristóbal-Monreal, I.R.; Yusta, J.M. Stochastic-heuristic methodology for the optimisation of components and control variables of PV-wind-diesel-battery stand-alone systems. Renew. Energy 2016, 99, 919–935. [Google Scholar] [CrossRef]
- Karavas, C.-S.; Kyriakarakos, G.; Arvanitis, K.G.; Papadakis, G. A multi-agent decentralized energy management system based on distributed intelligence for the design and control of autonomous polygeneration microgrids. Energy Convers. Manag. 2015, 103, 166–179. [Google Scholar] [CrossRef]
- Karavas, C.-S.; Arvanitis, K.; Papadakis, G. A Game Theory Approach to Multi-Agent Decentralized Energy Management of Autonomous Polygeneration Microgrids. Energies 2017, 10, 1756. [Google Scholar] [CrossRef]
- Karavas, C.-S.; Arvanitis, K.; Kyriakarakos, G.; Piromalis, D.D.; Papadakis, G. A novel autonomous PV powered desalination system based on a DC microgrid concept incorporating short-term energy storage. Sol. Energy 2018, 159, 947–961. [Google Scholar] [CrossRef]
- Ministerio de Energía. Anuario Estadístico de Energía 2018; CNE: Santiago, Chile, 2018.
- International Energy Agency (IEA). Energy Statistics Manual; International Energy Agency: Paris, France, 2005. [Google Scholar] [CrossRef]
- Stevanato, N.; Lombardi, F.; Colmbo, E.; Balderrama, S.; Quoilin, S. Two-Stage Stochastic Sizing of a Rural Micro-Grid Based on Stochastic Load Generation. In Proceedings of the 13th IEEE PowerTech Conference, Milan, Italy, 23–27 June 2019; pp. 1–6. [Google Scholar] [CrossRef]
- Lombardi, F.; Balderrama, S.; Quoilin, S.; Colombo, E. Generating high-resolution multi-energy load profiles for remote areas with an open-source stochastic model. Energy 2019, 177, 433–444. [Google Scholar] [CrossRef]
- Fischer, D.; Wolf, T.; Scherer, J.; Wille-Haussmann, B. A stochastic bottom-up model for space heating and domestic hot water load profiles for German households. Energy Build. 2016, 124, 120–128. [Google Scholar] [CrossRef]
- Caleffi, M. Produzione di acqua calda ad accumulo. In Idraulica; Caleffi: Novara, Italy, 1999; Volume 16. [Google Scholar]
- ASHRAE. 2015 ASHRAE Handbook–Heating, Ventilation and Air-Conditioning Applications; ASHRAE: Peachtree Corners, GA, USA, 2015. [Google Scholar]
- Stevanato, N.; Pistolese, S.; Lombardi, F.; Rinaldi, L. Multi-Energy Systems Py. 2020. Available online: https://github.com/Stevogallo/MicroGridsPy-MultiEnergy_Paper (accessed on 25 September 2020).
- Dumont, O.; Carmo, C.; Dickes, R.; Emelines, G.; Quoilin, S.; Lemort, V. Hot water tanks : How to select the optimal modelling approach? In Clima 2016; Heiselberg, P.K., Ed.; Aalborg University: Aalborg, Denmark, 2016. [Google Scholar]
- Duffie, J.A.; Beckman, W.A. Solar Engineering of Thermal Processes; Wiley: Hoboken, NJ, USA, 2013. [Google Scholar]
Publisher’s Note: MDPI stays neutral with regard to jurisdictional claims in published maps and institutional affiliations. |
© 2020 by the authors. Licensee MDPI, Basel, Switzerland. This article is an open access article distributed under the terms and conditions of the Creative Commons Attribution (CC BY) license (http://creativecommons.org/licenses/by/4.0/).