Article

The Analytical Prediction of Thermal Distribution and Defect Generation of Inconel 718 by Selective Laser Melting

1
Department of Mechanical Engineering, North China Electric Power University, Baoding 071000, China
2
Science and Technology on Plasma Dynamics Laboratory, Air Force Engineering University, Xi’an 710038, China
3
School of Mechanical Engineering, Dalian University of Technology, Dalian 116024, China
*
Author to whom correspondence should be addressed.
Appl. Sci. 2020, 10(20), 7300; https://doi.org/10.3390/app10207300
Submission received: 21 September 2020 / Revised: 14 October 2020 / Accepted: 16 October 2020 / Published: 19 October 2020

Abstract

:
In selective laser melting, the rapid change of the temperature field caused by the rapid movement of the laser causes the instability of the melt pool flow, resulting in a generation of defects, such as lack of fusion, keyholing and balling effect, which greatly affect the performance of parts. In order to fully understand the temperature distribution and defect generation process of selective laser melting (SLM), experimental research, numerical simulation and analytical methods are mainly applied. The analytical method is suitable for the determination of the optimal process parameters because it is simple and consumes fewer resources. In a simulation, the absorptivity of the material is usually regarded as a constant, but experimental studies have shown that absorptivity is related to temperature, laser power, scanning speed, layer thickness and other process parameters. Considering the dynamics of thermal physical properties of Inconel 718, an improved analytical method was proposed and successfully applied to thermal analysis and the prediction of melt pool size. By comparing with the results of finite element simulation, experiment and other analytical solutions, the ease of use and effectiveness of the method are verified. Based on the prediction of the melt pool and the criterion of internal defects, the combination of process parameters that produce internal defects is calculated, which will make it possible to quickly obtain ideal process parameters.

1. Introduction

Selective laser melting (SLM) is one of the important additive manufacturing technologies for metals. It can realize the forming of parts with complex structures through layer-by-layer powder spreading, laser beam melting and solidification [1]. In the performance evaluation of metal additive manufacturing products, internal quality, surface quality, internal stress and forming dimensional accuracy are very important indicators. However, the characteristics of organization and defects are different from traditional metal parts, traditional methods for predicting and detecting internal defects of metal parts cannot be applied to metal additive manufacturing parts. At present, additive manufacturing still has great challenges in terms of stability and consistency. Therefore, how to obtain defect-free high-quality parts is a major technical challenge. Experimental and numerical simulation research methods have been used by many researchers to discuss defect forming mechanism, prediction methods and control strategies.
A very complicated thermal physical interaction process is contained in the SLM process. Understanding the characteristics of a temperature field is very helpful for selecting reasonable process parameters to control the forming quality of the material. However, due to the very small size of the powders and the very short phase transition time, it is difficult to obtain a better analysis and observation effect of the process by simple experimental methods. In order to ensure the printing quality, it is a very effective method to use numerical simulation analysis methods to observe the configuration and temperature field of the melt pool and optimize process parameters.
The size of the melt pool is very important for the forming of the alloy. During the processing of SLM, the laser will quickly melt the metal powder into liquid metal to form a melt pool. If the scanning heat input parameters are set improperly, defects such as pores will appear in the final formed part, and the shape and flow of the melt pool are closely related to the setting of the process parameters. The appropriate melt pool size can largely reduce the occurrence of defects in formed parts. For modelling the melt pool, computational fluid dynamics (CFD) is the most widely used method, in which finite element method (FEM) [2] or finite volume method (FVM) [3] approaches are applied [4]. Zhang Liang et al. [5] found that the increase in laser power or the decrease in scanning rate will cause the temperature in the melt pool to increase, and the size of the melt pool will increase accordingly by combining simulation and experiment. In the SLM process, the surface tension caused by the temperature gradient has an important influence on the shape distribution and evolution of the melt pool. Zhang et al. [6] established a three-dimensional finite element model of SLM IN718 and found that the Marangoni effect driven by surface tension makes the fluid in the melt pool mainly convection outward. Yuan et al. [7] found that when the laser scanning speed (the laser power is 200 W, laser beam radius is 35 μm) is above 1.3 m/s, the melt pool is in an unstable state and a large number of ball defects will be generated. In the interval of 0.8 m/s–1.3 m/s, the melt pool is in a transitional state, and it is prone to necking defects. When the speed drops to the interval of 0.3 m/s–0.8 m/s, the melt pool is in a stable state and has a concave feature. Yuan and Chen et al. [8] analyzed the influence of recoil pressure under different laser parameters on the temperature field and velocity field of the melt pool. Taking 316 L stainless steel powder as the study object, through numerical simulation and experimental research, it is finally found that during the laser scanning process, the surface tension and recoil pressure have reached a dynamic balance, and the depression produced by the melt pool will be continuously filled. When the energy density of the laser is constant, as the scanning speed increases, the depression of the melt pool will be deeper. When the scanning speed of the laser is constant, the depression will be deeper as the power increases. The size of the melt pool along the scanning direction is mainly determined by the scanning speed, and too much depression can cause abnormal flow of nearby solution, thereby increasing the tendency of pore defects.
Other than the CFD method, lattice Boltzmann method (LBM) and smooth particle hydrodynamics (SPH) have been applied to simulate the melt pool. Liu et al. [9] used the SPH method to establish a model considering the surface tension to observe the configuration of the melt pool. It is found that under the influence of surface tension, the longitudinal state of the melt pool changes longitudinally along the solidification track of the melt pool, and the curve is wavy. In LBM, fictive fluid particles are created at a lattice of locations which can track collisions and movement. However, there have been few applications of LBM [10] and SPH [11] to simulate the melt pool of additive manufacturing (AM) process because of lacking mature commercial software.
Recently, many analytical solutions [12,13,14] were presented to simulate the temperature distribution and melt pool in order to optimize processing parameters and predict the part quality. Since many process parameters will affect the quality of SLM formed parts, the researchers proposed that the density of parts can be characterized by a parameter of energy density. The advantage of using energy density is that it includes parameters, such as laser power, scanning speed, layer thickness, and hatching distance, making performance evaluation and prediction easier. However, recent studies have shown that the energy density method has drawbacks [15]. For the same energy density, it may come from different parameter combinations of laser power and scanning speed, so the quality of the parts obtained is obviously different. In numerical and analytical models used to simulate a melt pool, absorptivity was usually assumed to be constant. Considering variation of the absorptivity in the process of SLM, Du [16] calculated the absorptivity of AlSi10Mg according to the Hagen–Ruben relationship and applied temperature-based absorptivity to FE simulation. However, it has not been applied in any analytical method. Although both of these two methods can predict the melt pool, the FE method takes a long time to obtain the calculation results. It is suitable for academic research on scientific issues and is not suitable for industrial field applications that require quick prediction. Therefore, the study of analytical methods with higher prediction accuracy has more important practical value. In this paper, we studied the absorptivity calculation of In718 material. Moreover, we recommend to determine absorptivity according to the experimental method proposed by Ye [17]. As the composition of the IN718 material is more complex and the powders provided by different manufacturers have certain differences when predicting the optimal process parameters, process engineers should use the analytical method proposed in this article according to the experimental results of the powder used based on the method proposed by Ye [17].
In this paper, a numerical analysis method for predicting the melt pool and defects of metal additive manufacturing is proposed. Compared with other numerical simulation methods, it is easier to operate and can quickly propose optimized process parameters. In this method, considering the actual situation of IN718’s absorptivity related to temperature, laser power, scanning speed, layer thickness and other process parameters, a modified analytical solution is presented to overcome the disadvantage of existing method which viewed absorptivity as a constant, and compare it with other numerical simulation methods and experimental results for validation. By analyzing of temperature field distribution, melt pool characteristics, and then the generation of defects can be predicted.

2. Analytical Solution

2.1. Analytical Model

An analytical solution is easier and faster in completing an analysis than a numerical simulation analysis method. Due to the substantial similarity between the welding process and the SLM forming process, many researchers have adopted Rosenthal’s equation [18] in analytical analysis. This equation assumes that the laser beam is a point light source, only considers heat conduction, ignores heat loss and does not consider the powder layer.
T = T 0 + A P 2 π k r exp [ u ( ξ + r ) 2 α ]
where T 0 is the temperature at locations far from melt pool, A is the absorptivity of material, P is the laser power, k is thermal conductivity, u is the laser speed, α is thermal diffusivity. The size and shape of the melt pool is defined by ξ and r .
Tang [19] presented the estimation equation of the melt pool width for materials with low thermal diffusivity (such as In718) by deriving from Rosenthal’s equation.
W 8 π e · A P ρ C p u ( T m T 0 )  
where ρ is density, C p is specific heat, W is the width of melt pool, T m is the melting temperature.
However, Gaussian surface heat source is often used as a high-energy laser beam for calculation and analysis in SLM calculation and simulation. Gladush [20] derive a new calculation equation by introducing the Gaussian distribution, and Rubenchik [21] simplified it by normalizing.
q ( r ) = 2 A P π a 2 exp ( 2 r 2 a 2 )  
T = A P π k D π 0 e x p [ z 2 4 D s y 2 + ( x s ) 2 ( 4 D s + a 2 ) ] ( 4 D s + a 2 ) s d s
where r is the distance from any point in the laser spot coverage area to the spot center (m) and a is the laser spot radius (m).
g = T T s ; T s = A P π ρ C p α u a 3 ; p = α u a ; x = x a ; y = y a ; z = z ( α a u ) 0.5 ; t = s ( a / u )
g = 0 e x p [ z 2 4 t y 2 + ( x t ) 2 ( 4 p t + 1 ) ] ( 4 p t + 1 ) t d t
According to the above equation [15], the thermal history can be calculated. Moreover, the melt pool configuration and size can be calculated by replace T with T m .

2.2. Absorptivity of IN718

Inconel 718 (hereinafter referred to as IN718) alloy is a precipitation hardening nickel-based zinc oxide alloy rich in Cr and Fe elements, which is known for its high tensile strength, fatigue strength and fracture strength at high temperature [22]. Due to its excellent performance, it can be widely used in various high-demand occasions, such as engine turbine blades, aerospace structural parts and chemical equipment [23].
Because SLM is a thermally driven process, an accurate laser-material absorptivity is required for predictive modeling. From the existing literature, we can find that the reported absorptivity of In718 has a large difference, with a value between 0.3 and 0.87. In order to simplify the calculation, many mathematical models approximated absorptivity as a constant [24]. However, the latest research found that absorptivity is related to the morphology and temperature of the melt pool. The approximation of the temperature-dependent absorptivity can be derived [25,26], which is the function of the laser wavelength and the electrical resistivity.
A 0.365 · ( ρ e t λ ) 1 2 0.0667 · ( ρ e t λ ) + 0.006 · ( ρ e t λ ) 3 2
where ρ e t is electrical resistivity of In718. The electrical resistivity is temperature dependent, the relation between electrical resistivity and temperature is as following, which is shown in Figure 1. λ is the wavelength. Here, λ = 1080   nm is assumed.
ρ e t = { 1.105 · 10 6 + 2.617 · 10 10 · T ,   T < 1123 K 1.341 · 10 6 + 5.182 · 10 11 · T ,   1123 K < T T s 4.511 · 10 7 + 6.341 · 10 10 · T ,   T s < T T l 1.260 · 10 6 + 1.317 · 10 10 · T ,   T l < T
J.C. Ye [17] found that the absorptivity was affected by laser power, scanning speed, powder layer thickness and laser beam radius. They demonstrated that absorptivity can be presented as universal functions of the normalized enthalpy and thermal diffusion length. In the transition and keyhole regimes, it can be expressed as the following exponential function:
A e = 0.70 ( 1 e 0.66 β A m L t h * )
where A e is effective absorptivity, β A m is normalized enthalpy that is defined as the ratio of the absorbed laser energy density to the volumetric melting enthalpy, L t h * is normalized thermal diffusion length.
β A m = A m P π H m α u a 3
L t h * = ( α a / u ) / a
where A m is the minimum absorptivity, H m equals to ρ C p T m .

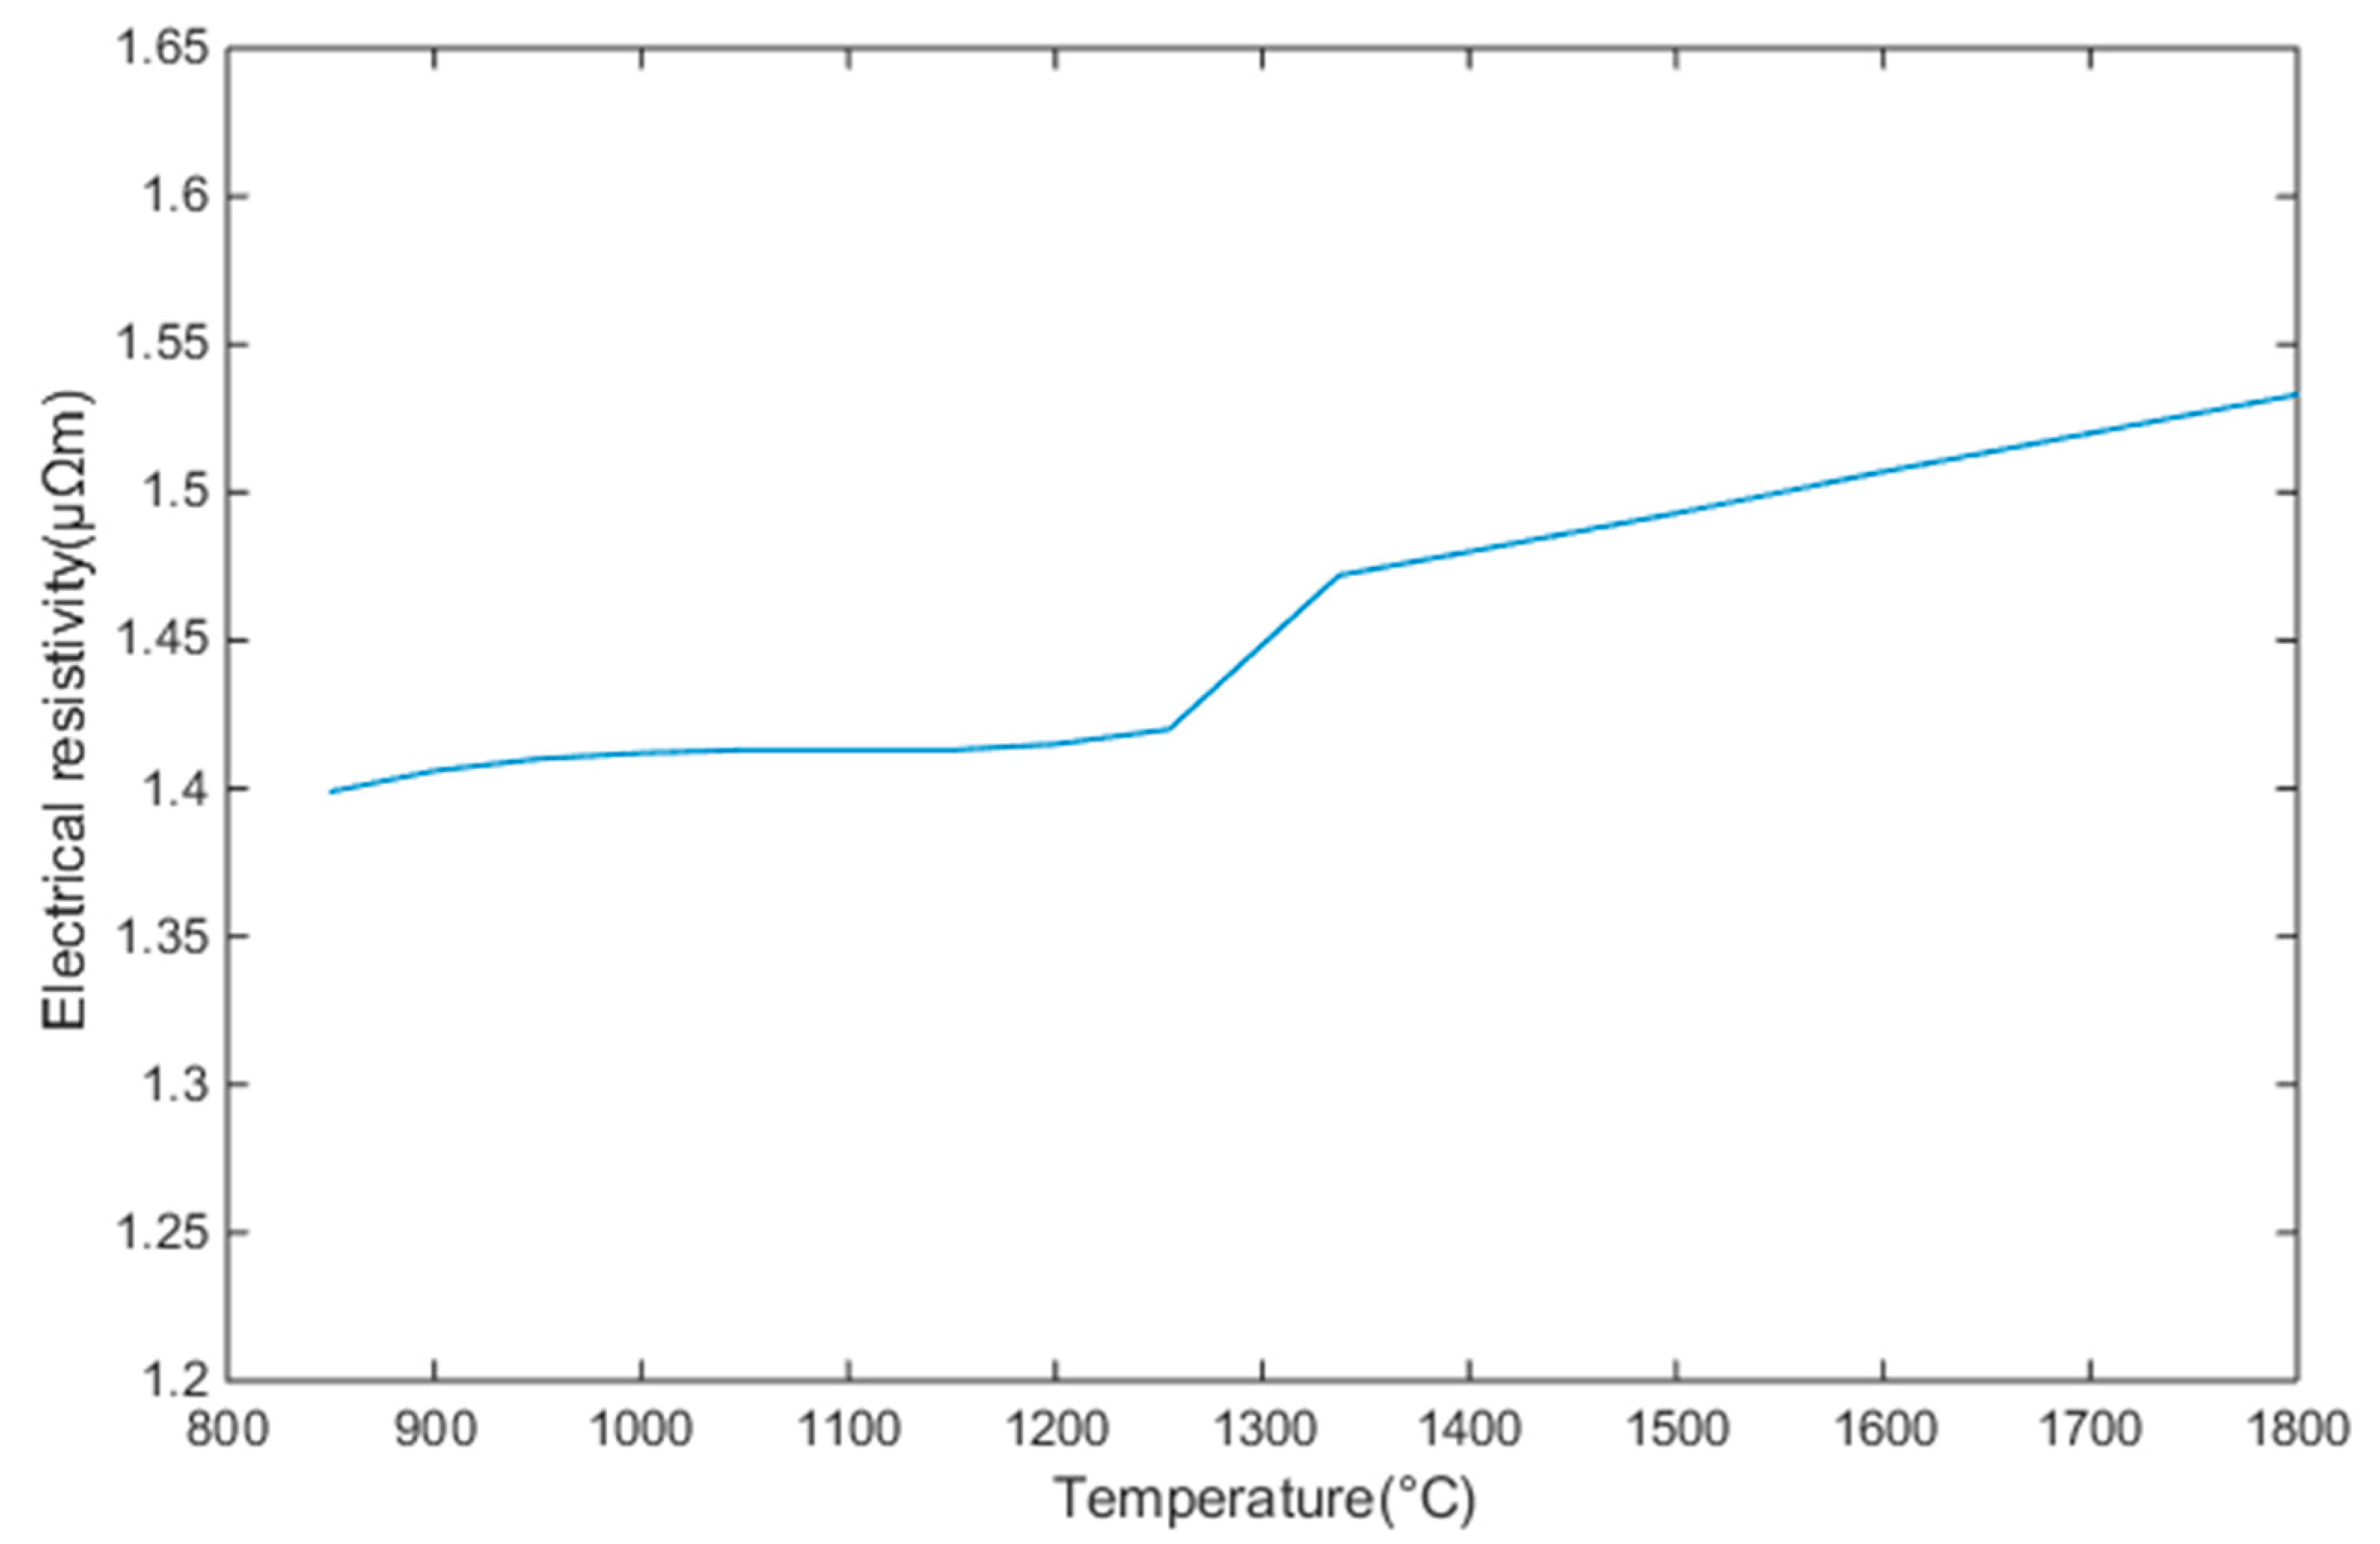
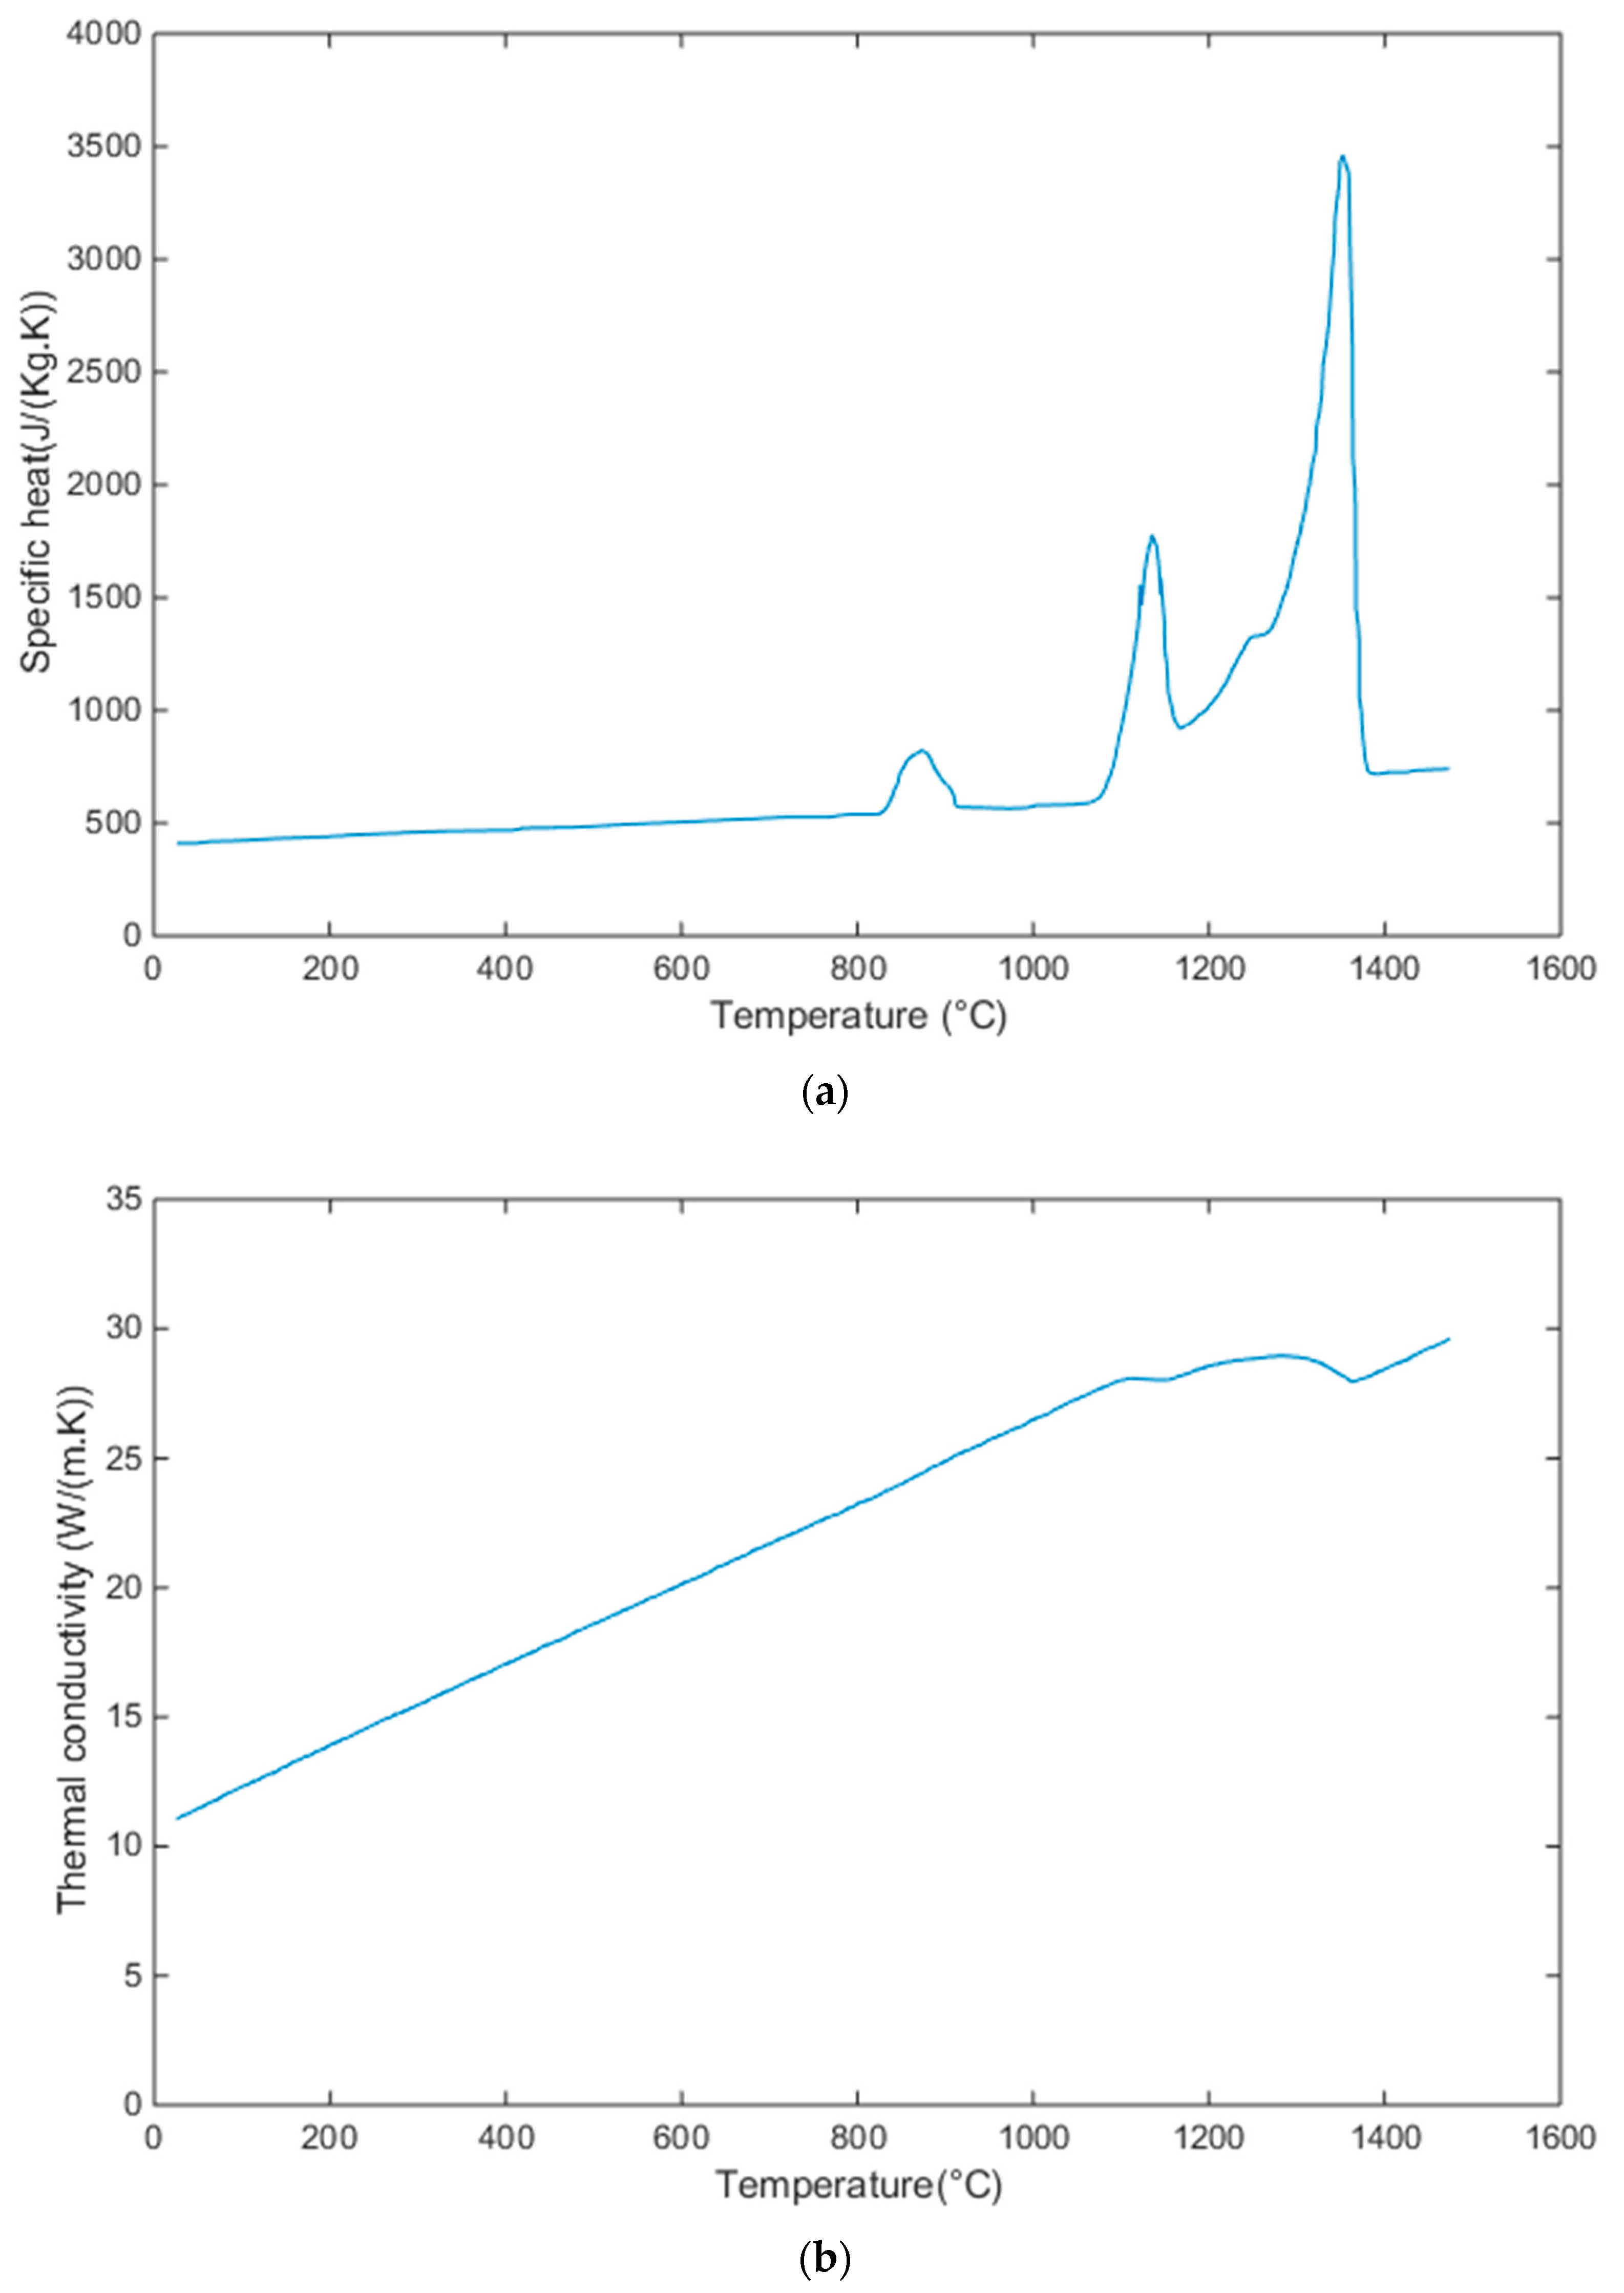
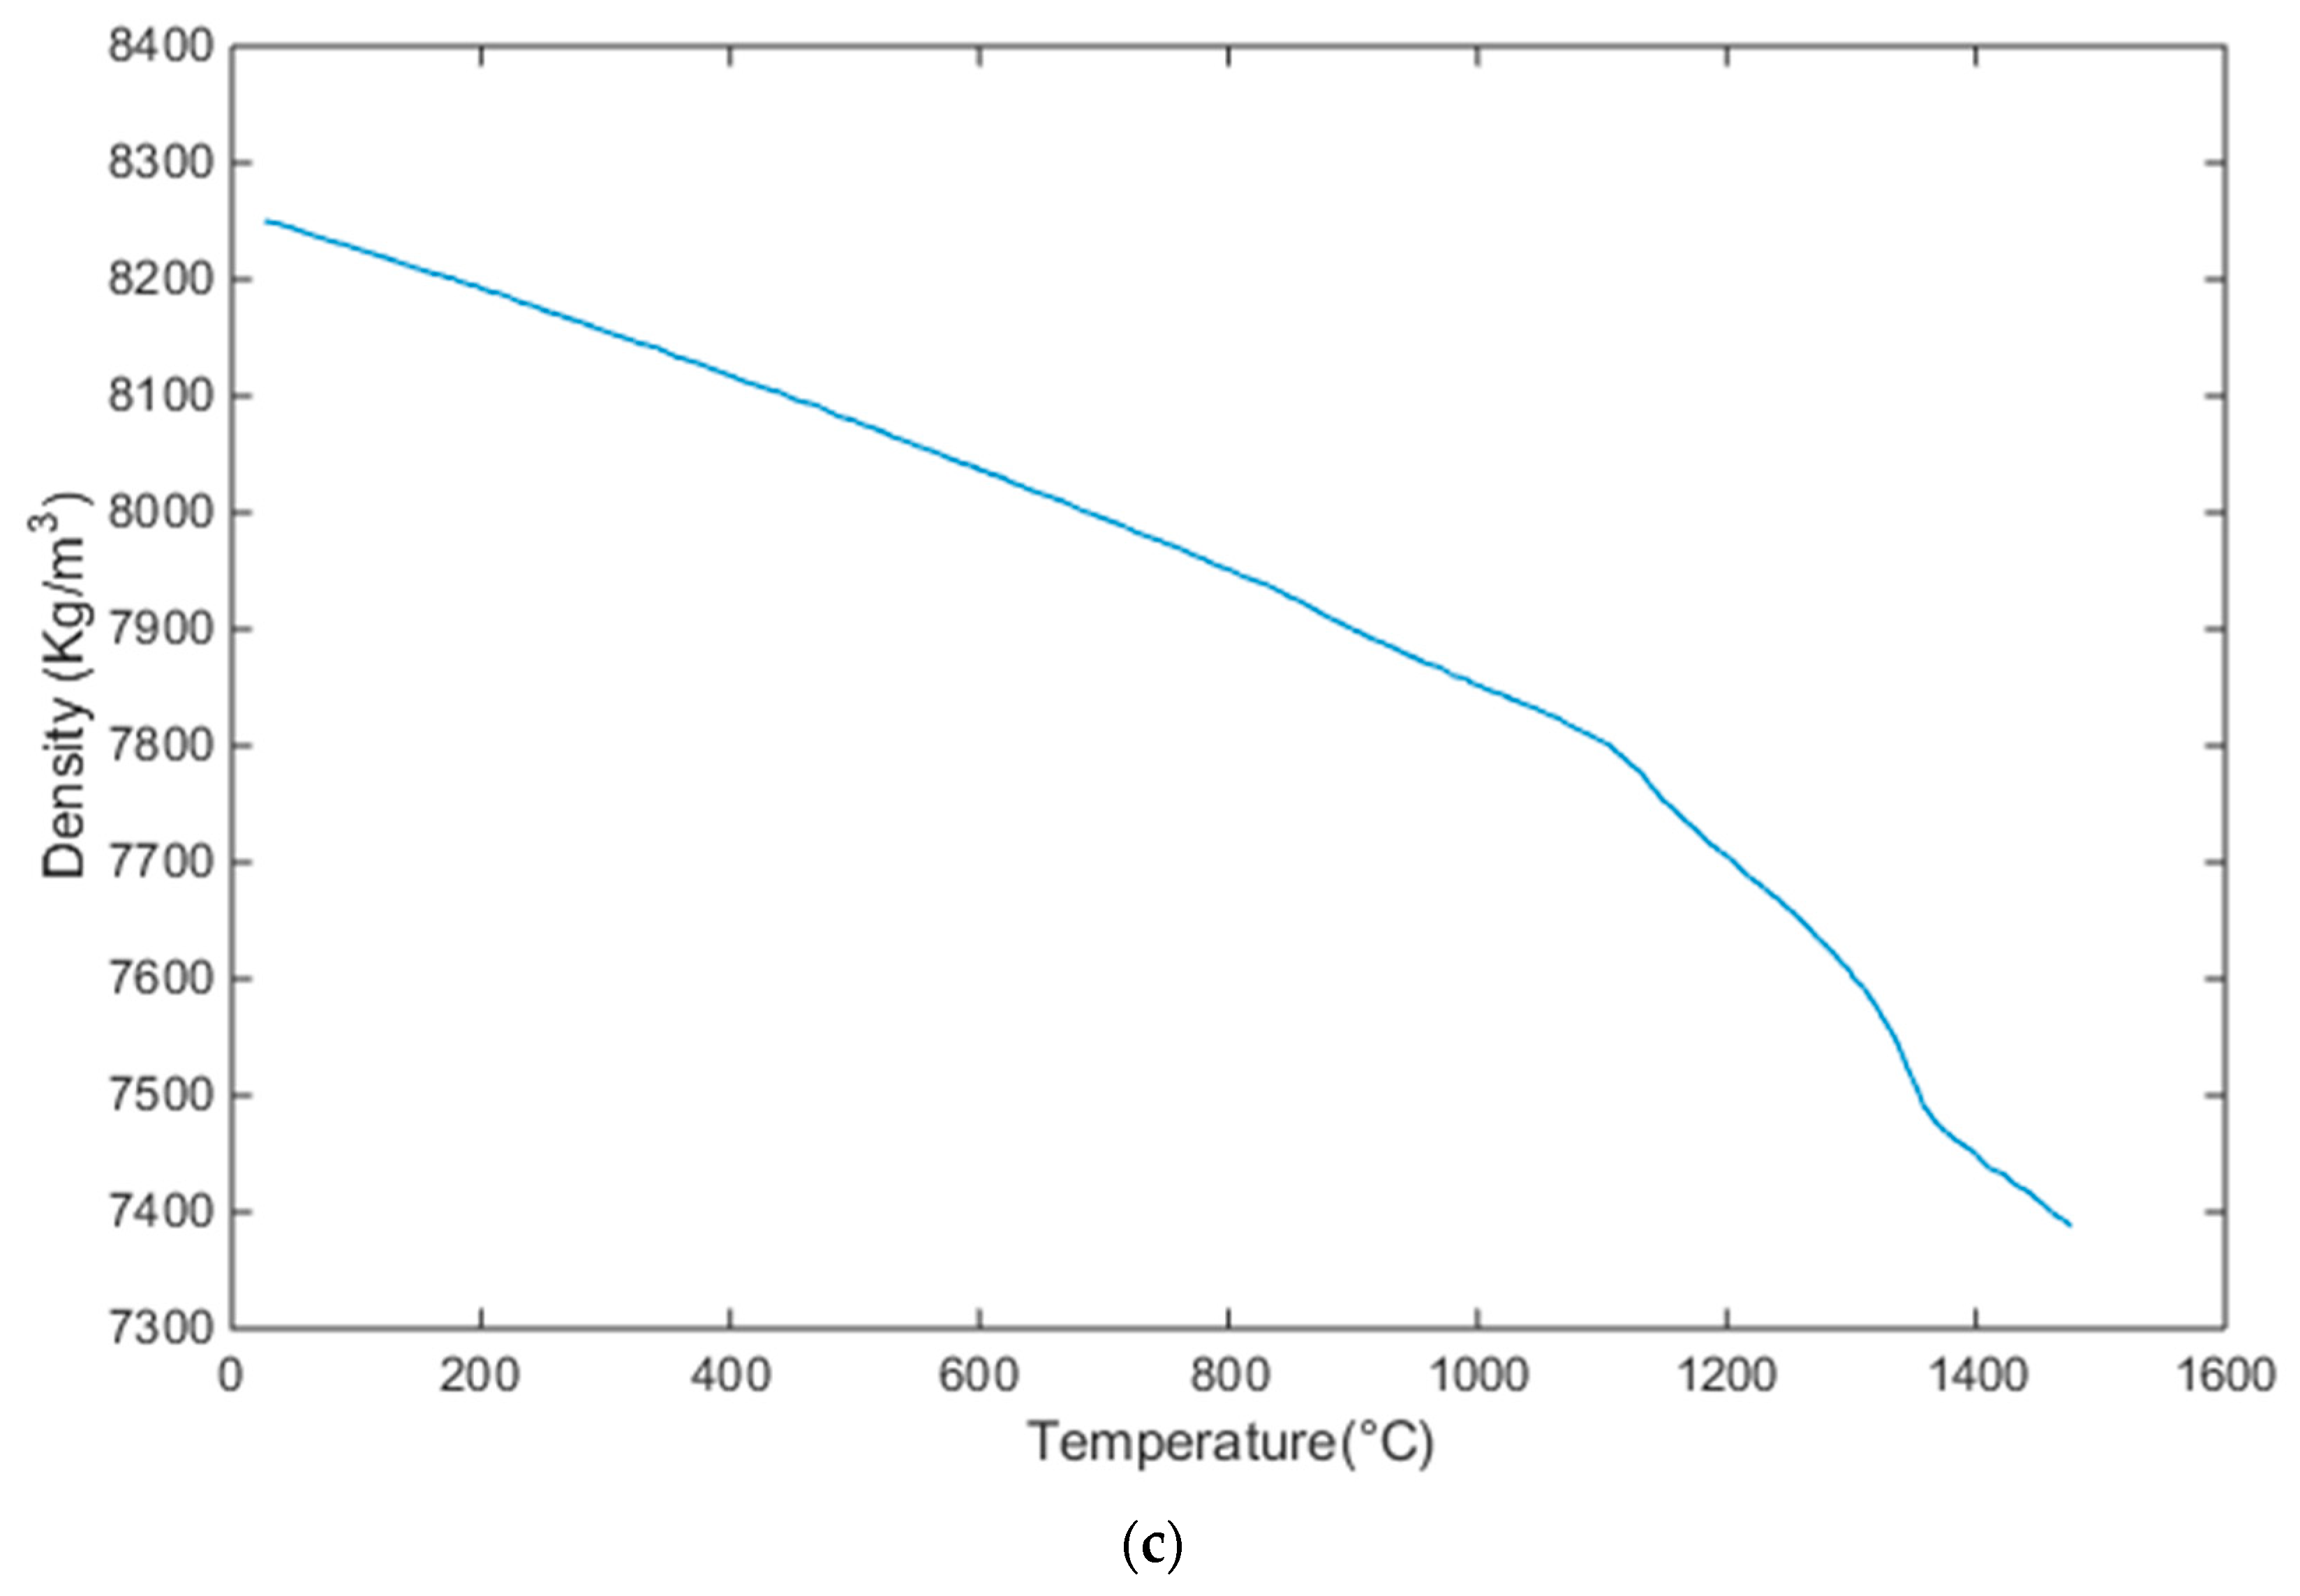
2.3. Material Properties

The thermal physical properties of In718 is shown in Figure 2 [27]. The thermal conductivity of the powder bed has a great influence on the distribution of the temperature field, but due to the existence of voids between the powder particles, the thermal conductivity of the powder material is very complicated and it is very difficult to accurately measure. When analyzing the temperature field of SLM through numerical simulation, it is difficult to define the function of thermal conductivity of powder with temperature, so it is generally regarded as a constant to simplify the calculation. When SLM uses numerical simulation analysis, if the model does not require high material accuracy, the thermal conductivity of the powder bed can be converted to 1% of the bulk metal [27], or it can be estimated based on calculation models. At present, the calculation models for powder thermal conductivity include Sih model and Gusarov model [28].

3. Numerical Simulation (FE)

In order to validate the result of above analytical solution, finite element (FE) simulation results and experimental data are used to compare. In this section, the three-dimensional FE model was used to simulate the temperature evolution during the SLM process of In718. Heat conduction, Gaussian surface heat source and latent heat of phase change were considered. A commercial software, ANSYS, is used to implement the numerical simulation.

3.1. Heat Conduction Equation

The SLM process is very complicated because the instantaneous local heating of the laser beam source causes a sudden temperature variation. The material undergoes a process of melting and solidification in a short time, and the physical properties of the material are constantly changing with the temperature. Therefore, the SLM is a typical inhomogeneous transient heat conduction process. Its heat conduction equation is [29]:
ρ c p T t = x ( k T x ) + y ( k T y ) + z ( k T z ) + Q
where t is the heat transfer time (s), ρ is the material density (kg/m3), c p is the material density (kg/m3), k is the thermal conductivity (W/(m·K)) and Q is the internal heat source strength (J/m3), T is the temperature field distribution function (K).

3.2. Heat Source Model

For the analysis of transient temperature field in numerical simulation, the widely used heat source models are mainly divided into surface heat source and bulk heat source models. The surface heat source model is that the laser beam loads energy on the surface of the powder layer in the form of heat flux, and the heat is transferred to the inside of the powder layer and the substrate in the form of heat conduction. Common surface heat source models include Gaussian surface heat source models and ray tracing models. At present, in the numerical simulation of the temperature field of parts formed by SLM, Gaussian surface heat source is often used as a high-energy laser beam for calculation and analysis [30].
The model formula of Gaussian heat source is as follows:
q ( r ) = 2 A P π a 2 exp ( 2 r 2 a 2 )
where P is the laser power (W), A is the absorption rate of the laser beam by the material, r is the distance from any point in the laser spot coverage area to the spot center (m) and a is the laser spot radius (m).

3.3. Latent Heat Treatment

In the SLM process, due to large temperature gradient, the material will undergo a change in organization and state (phase change). In this process, energy will be absorbed or released, which is the latent heat of phase change. The latent heat of phase change has a very important influence on the size and configuration of the melt pool and the distribution of the temperature field. Therefore, when performing finite element simulation, the issue of latent heat of phase change must be considered to avoid too much deviation between the simulation results of the temperature field and the actual.
In this simulation, enthalpy method is applied to deal with latent heat, which reflects the change of latent heat during the phase change process by defining the material’s value. The formula is as follows:
H = ρ   c ( T ) d T
The formula expresses the integral of the product of the density and specific heat of the material with respect to the temperature, where H is the enthalpy value of enthalpy in J/m3 and ρ and c are the density (kg/m3) and specific heat (J/(kg·K)). According to the enthalpy method, when the temperature does not exceed the melting point of the powder, the enthalpy formula is the product of density, specific heat and temperature and the part that exceeds the melting point needs to add the product of density and latent heat of fusion.

4. Results Discussion

4.1. The Sensitivity of Thermal Prediction to Absorptivity

The temperature field distribution of the melt pool is a very important parameter, and the SLM process mechanism can be further explored and understood by studying the evolution law of the temperature field to provide help for optimizing the process and improving the forming quality. Compared with traditional numerical simulation and experimental research, the analytical method consumes less resources, and can obtain the temperature field distribution of the SLM process at a faster speed, and then obtain the optimized process parameters. The absorptivity for IN718 has been reported as constant by some researchers, which varies from 0.3 to 0.87. It can be found from the description in Section 2.2 that the absorptivity is temperature-dependent. In order to illustrate the influence of absorptivity value on the analysis results, analytical calculations were carried out and the results are shown in Figure 3. Here, A = 0.3 (the minimum value can be found in literature), A = 0.87 (the maximum value can be found in literature), A = 0.5 (the medium value can be found in literature), A (calculation by Equations (5) and (6) at room temperature).
From Figure 3 and Figure A1, Figure A2, Figure A3 and Figure A4 in Appendix A, we can find that the geometry of melt pool is significantly affected by absorptivity. When A is 0.3, the width, length and depth of the molten pool are 145 μm, 375 μm, and 130 μm, respectively. However, when A is 0.87, the width, length and depth of the molten pool are 200 μm, 1150 μm and 265 μm, respectively. Therefore, we can see that the higher the absorptivity, the larger the size of the molten pool can be obtained. It can be seen from Equation (2) that the width of the molten pool is proportional to the square root of the absorbed energy and it is also proportional to the square root of absorptivity. So the absorptivity cannot be considered as constant. As the composition of IN718 material is more complicated, the IN718 powder produced by different manufacturers has certain differences, so the absorptivity should also be different. It is recommended that when using analytical methods to predict the temperature field distribution of the melt pool, the measurement method proposed by Ye [17] be used to measure the electrical resistivity of the raw materials used in AM processing. Then, absorptivity can be computed by Equation (5), thus the prediction of temperature field distribution of melt pool can be obtained by Equation (4).

4.2. The Dimension of Melt Pool from Experiment, FE and Analytical Solution

In order to validate the analytical result, the width and depth of the melt pool is predicted by FE, analytical solution proposed in this paper, and analytical solution by Rosenthal equation, which are compared with the experimental data published from Sadowski [12]. Usually, heat input or energy density is used to analyze the influence of process parameters on the size of the melt pool, but it can be found that the same heat input or energy density can be obtained from different process parameter combinations. Therefore, in order to provide process designers with the optimal process parameters required for printing, we separately discuss the influence of laser power and scanning speed on the size of the molten pool.
The size of the melt pool is affected by laser power and scanning speed. The effect of laser power on the size of the melt pool is analyzed. In an FE simulation, process parameters are set (the laser scanning speed is set to 1000 mm/s, the substrate preheating temperature is set to 80 degrees Celsius, the layer thickness is set to 40 μm and the hatch spacing is 0.1 mm), the laser power is 50 W, 100 W, 150 W, 200 W, 300 W, respectively. The effect of laser power on the dimension of the melt pool is shown in the Figure 4.
It can be found from Figure 4 that the analytical method proposed in this paper is more consistent with the experimental results and FE simulation results. At the same time, it can be found that with the increase of laser power, the width of the melt pool obtained through Rosenthal equation and FE simulation is smaller than the analytical method proposed in this paper. Because the point source is used as a heat source and the temperature dependence of the material, surface convection and radiation are ignored in the Rosenthal equation, so radiation loss is completely ignored, the width of the melt pool predicted by the Rosenthal equation is overestimated. However, for the FE model established in this paper, the influence of the top surface radiation is considered.
h r a d = ε σ ( T 2 + T 2 ) ( T + T )
where h r a d is the heart transfer coefficient for radiation, σ is the Stefan–Boltzmann constant, ε is the emissivity. In the FE modeling, the radiative losses are overestimated because the convection of the melt pool is neglected, so the melt pool predicted by FE modeling is narrower.
In addition, it can be found from the figure that under the condition of a certain scanning speed, as the laser power increases, the deviation between the Rosenthal equation simulation results, the numerical simulation results and the experimental values gradually increases. However, the error between the analytical method proposed in this paper and the experimental results is significantly smaller than other methods, so it can be used to predict the size of the molten pool in the keyholing area. When the energy deposited in the powder layer is high enough, the evaporation of the liquid metal creates cavity in the molten area, resulting in a narrow and elongated molten pool. We know that input energy can be defined as the ratio of input power to scanning speed.
E = P v
It can be seen from Figure 5 that the Rosenthal equation calculation results and the FE simulation results have large errors with the experimental results at higher heat input. Therefore, these methods are obviously not suitable for predicting the situation when the laser power is too large or the scanning speed is lower. However, by the analytical method with temperature-dependent absorptivity, the prediction accuracy in this area is obviously higher.
It can be seen from Figure 6 that, as the laser scanning speed increases, the length of the melt pool increases from 0.336 mm at 600 mm/s to 0.476 mm at 2500 mm/s. However, the depth and width of the melt pool are reduced. The width of the melt pool is reduced from 0.14 mm to 0.084 mm and the depth of the melt pool is reduced from 0.06 mm to 0.028 mm. It can be seen that when the laser power is constant, due to the increase of the laser scanning speed, the action time of the laser at one point becomes smaller, which causes the dimension of the melt pool to decrease.
Khairallah [24] proposed that presintering can be used to minimize the effect of spatter. The preheating of the substrate will increase T 0 in Equation (1). Based on the calculation results, it can be found that pre-sintering can increase the size of the molten pool and more easily cause the existence of keyhole defects. Therefore, in order to improve the quality of additive manufacturing parts, the temperature of the substrate can be calculated based on this model.

4.3. The Defect Prediction by Analytical Solution

During selective laser melting, various process parameters have a great influence on the microstructure and mechanical properties of the parts, which in turn leads to internal defects such as lack of fusion, keyholing and balling effect. The defects produced in the process will cause porosity which will have a greater impact on mechanical properties and fatigue performance of parts [31,32]. Therefore, how to predict and evaluate the possibility of the above-mentioned defects under a certain combination of process parameters is an important issue in production decision-making. Here, according to the evaluation criteria of defects, the calculation results of the analytical method proposed in this paper are used to predict the relationship between process parameters and defects.
When melt pool does not sufficiently cover powder layer, it will result in lack of fusion. So the criteria for lack of fusion presented by Tang [19] can be used.
( H w ) 2 + ( L d ) 2 1
where H is hatch spacing, w is the width of melt pool, L is the powder layer thickness and d is the depth of melt pool. With high energy deposited on powder, the metals vaporized will cause cavity in melted region, so the melt pool is narrow and elongate. For keyholing, the criterion is as following [33].
Δ H h s > π T b T m
where Δ H is energy distributed in unit volume, h s is enthalpy of melting, T b is boiling temperature and T m is melting temperature. Balling can cause high surface roughness and porosity, it can be determined by the following equation [34].
π w l > 1
Based on the melt pool size predicted from analytical solution and the criterion Equation (8) for lack of fusion, Figure 7 showed the calculation result. From this figure, we can get the optimal process parameters to avoid lack of fusion.
Based on the criterion of defects, the keyholing, lack of fusion and balling effect can be predicted by the estimation of melt pool and thermal distribution. From Figure 8, it can be found that the forming quality is different under the different combination of laser power and scanning speed. Moreover, the process parameters which will avoid the defects generation can be suggested by Figure 8.

5. Conclusions

For selective laser melting technology of metals, the process parameters, including laser power, scanning speed, powder layer thickness and hatch spacing have an important influence on the performance of metal parts. For the additive manufacturing of metal parts, how to quickly and accurately select the reasonable process parameters, avoid the generation of internal defects and obtain the best performance is an urgent problem to be solved at present. In view of the shortcomings of traditional performance prediction methods, considering the dynamics of the parameter value of absorptivity, which has an important impact on the prediction results, verification with numerical simulation and experimental results proves the feasibility and effectiveness of the proposed analytical method.
(1)
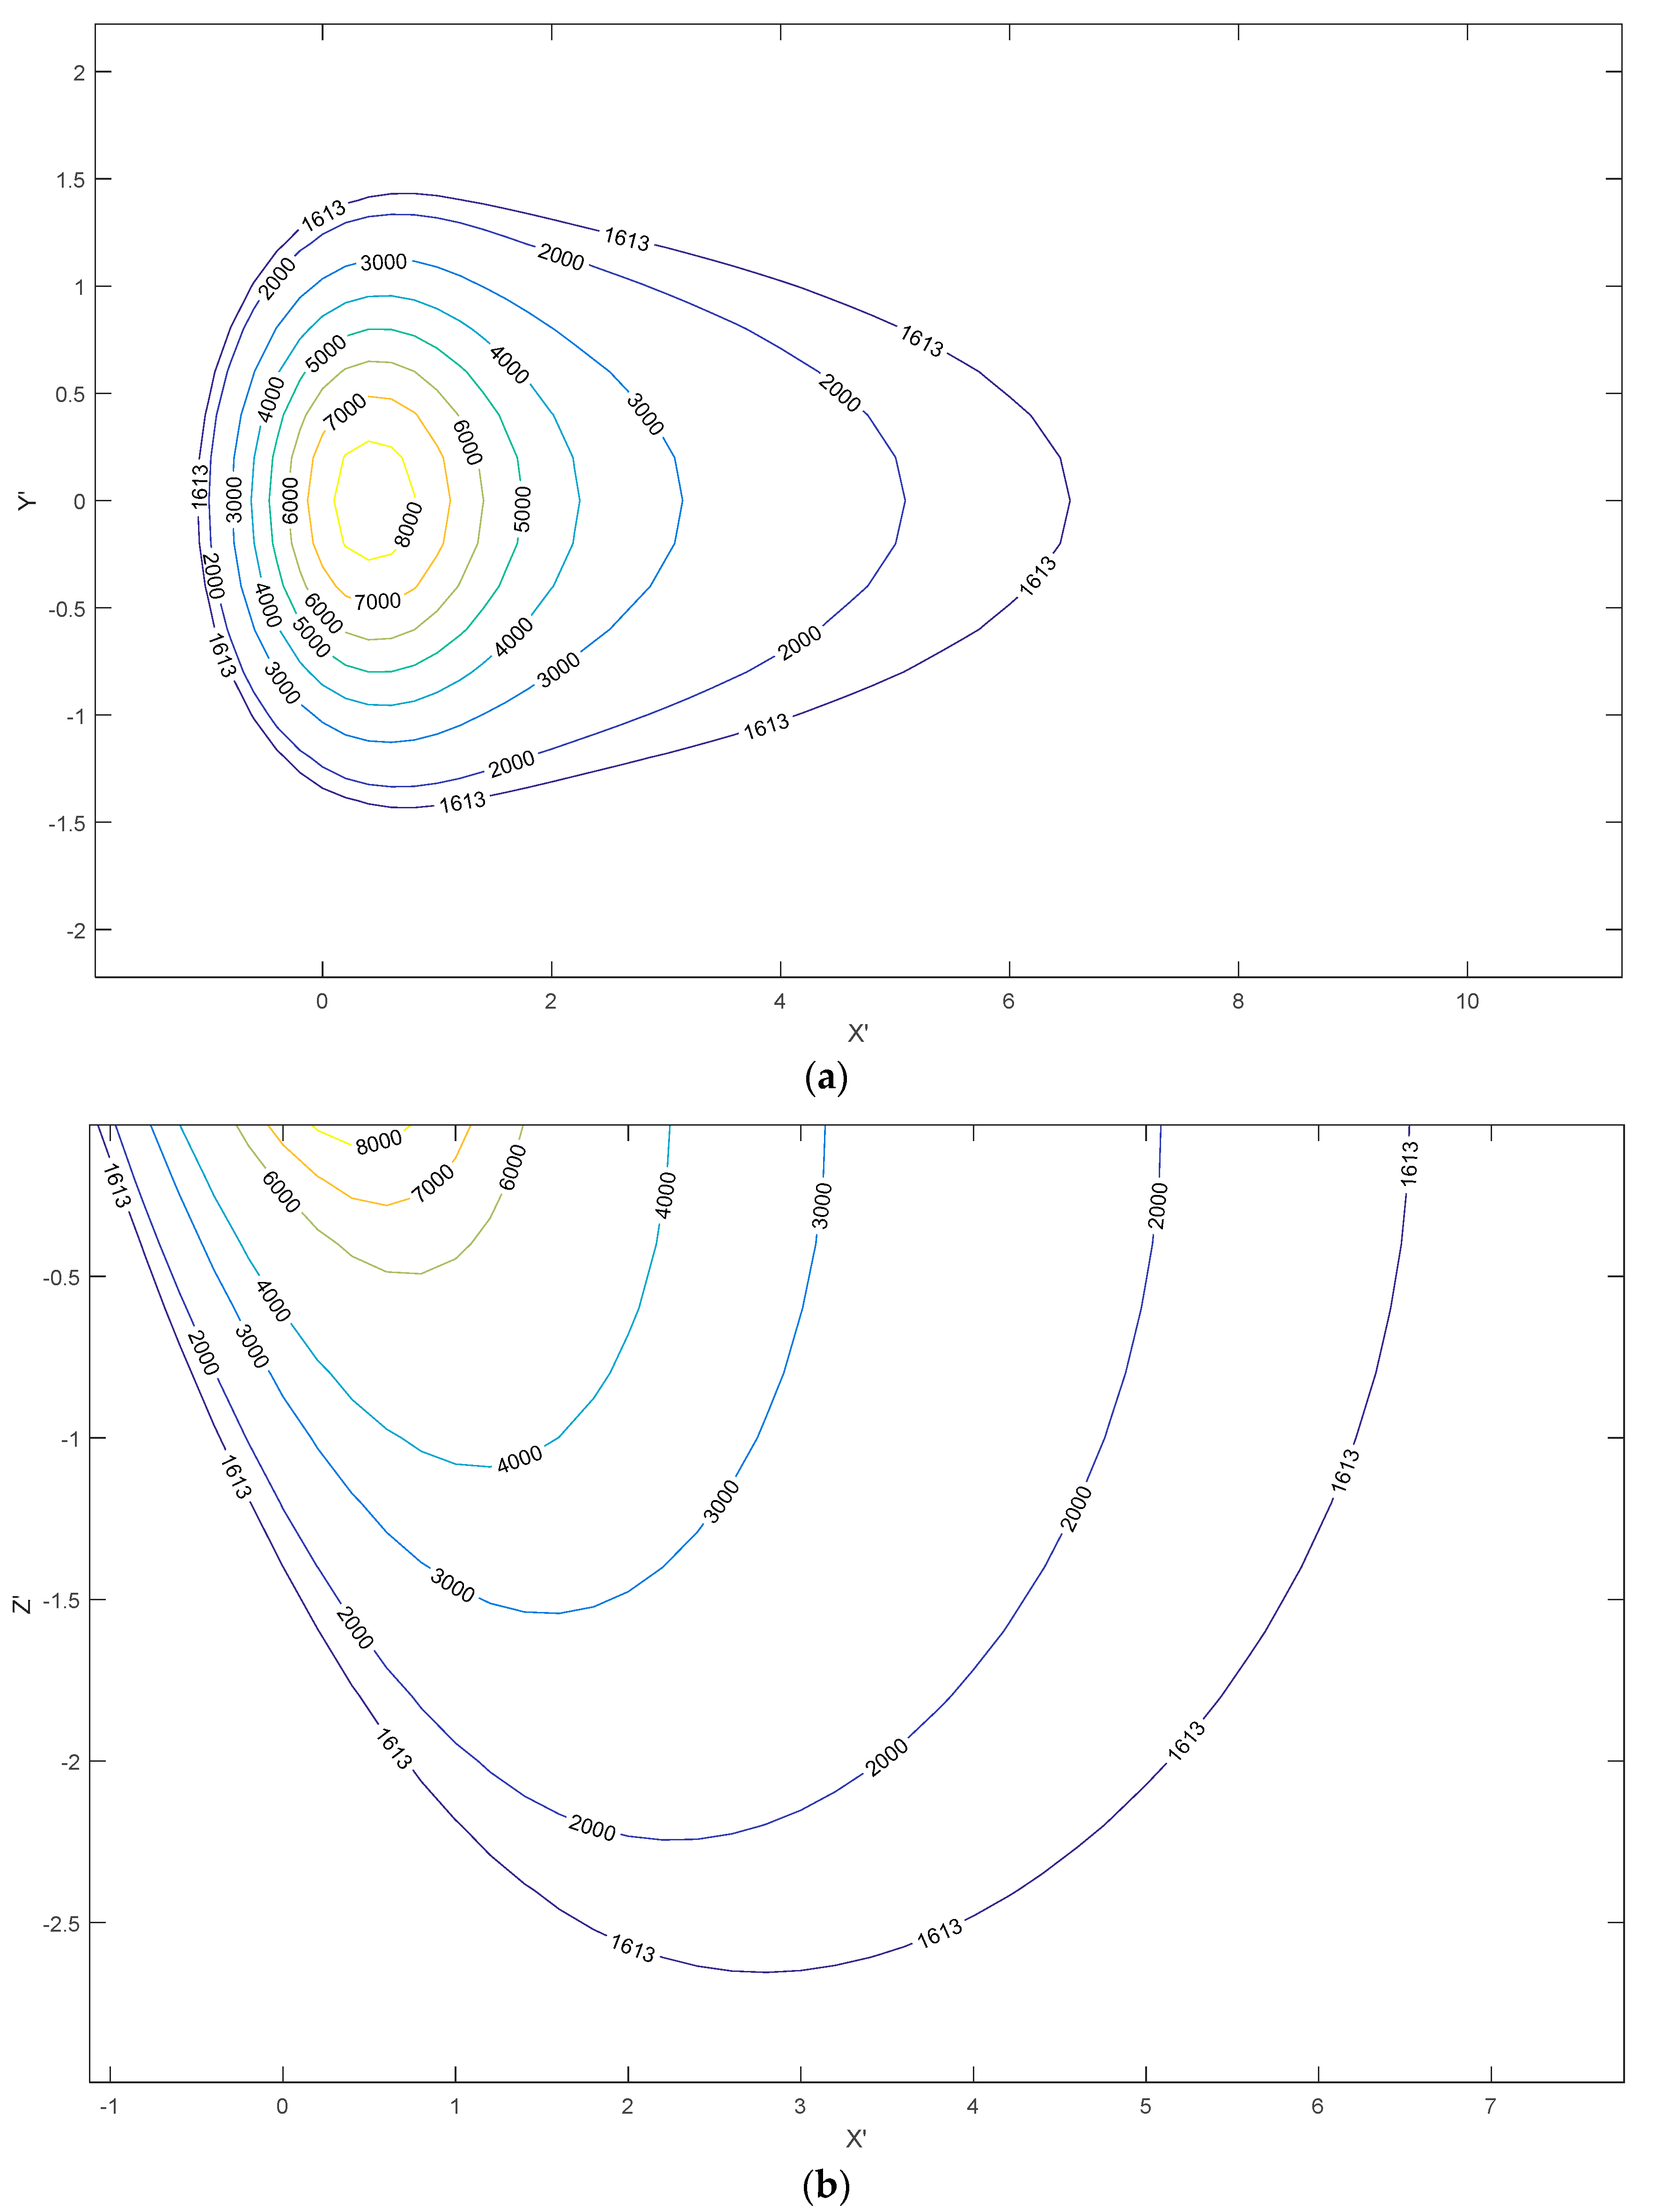
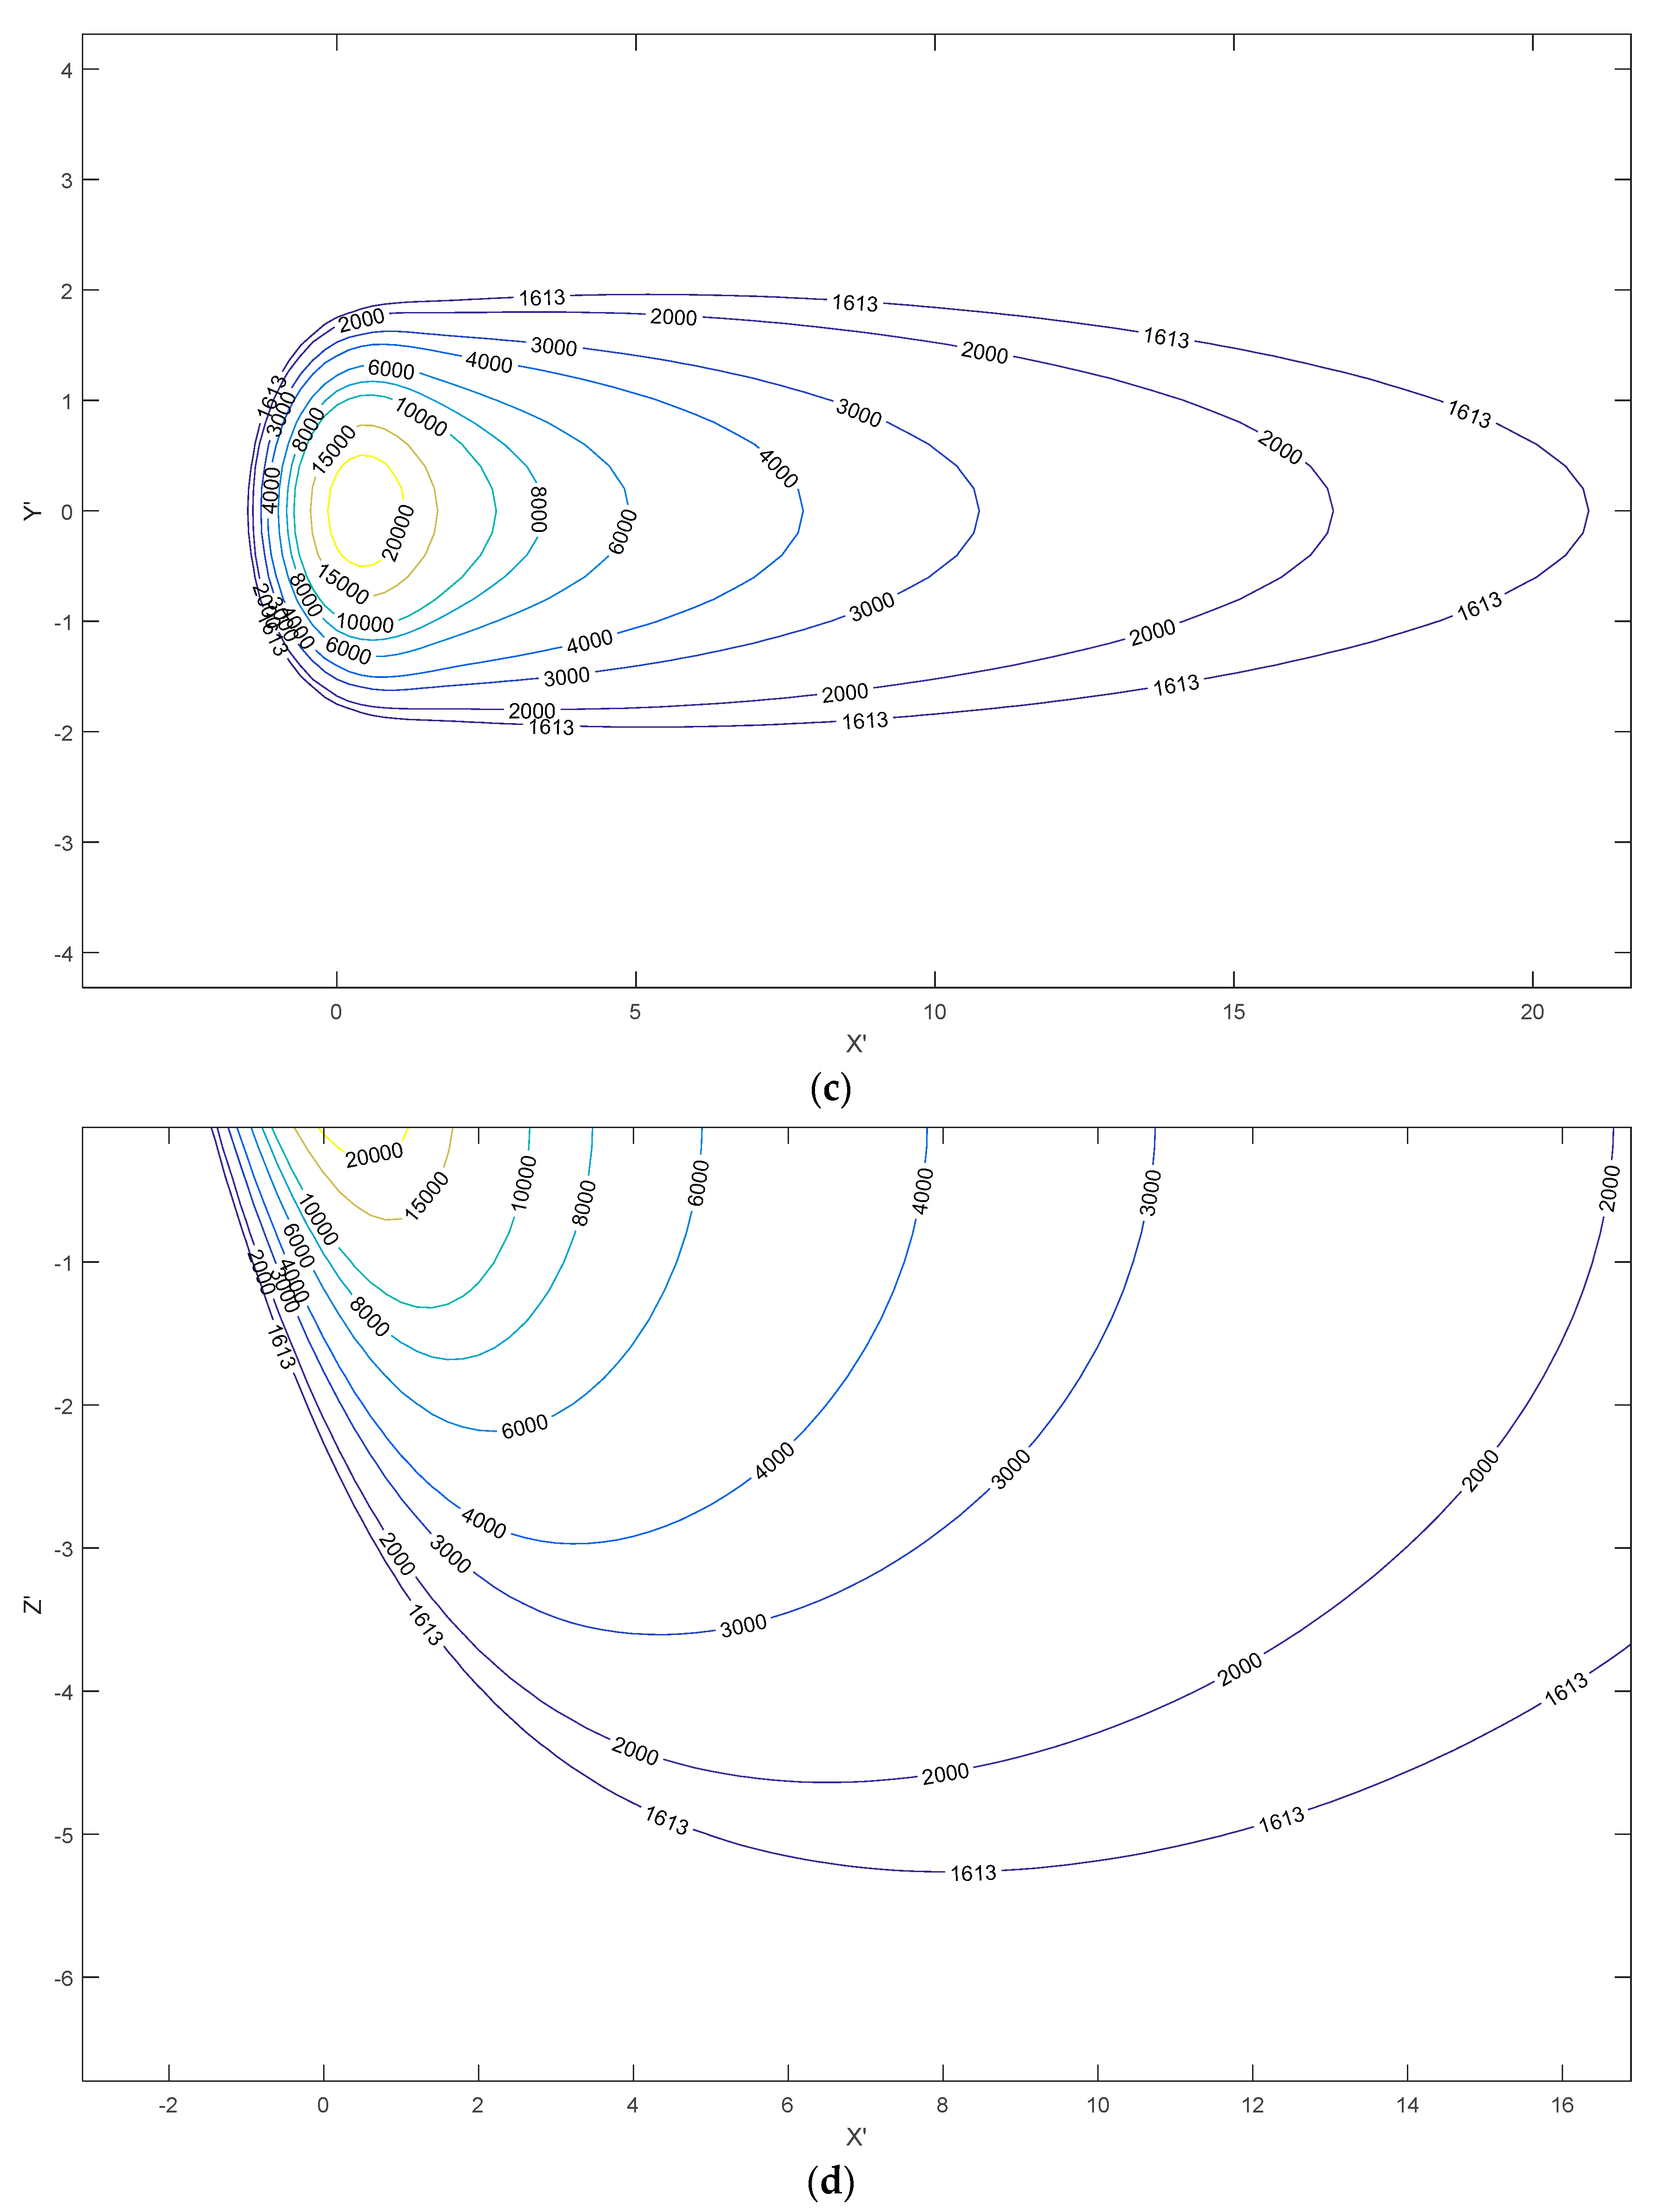
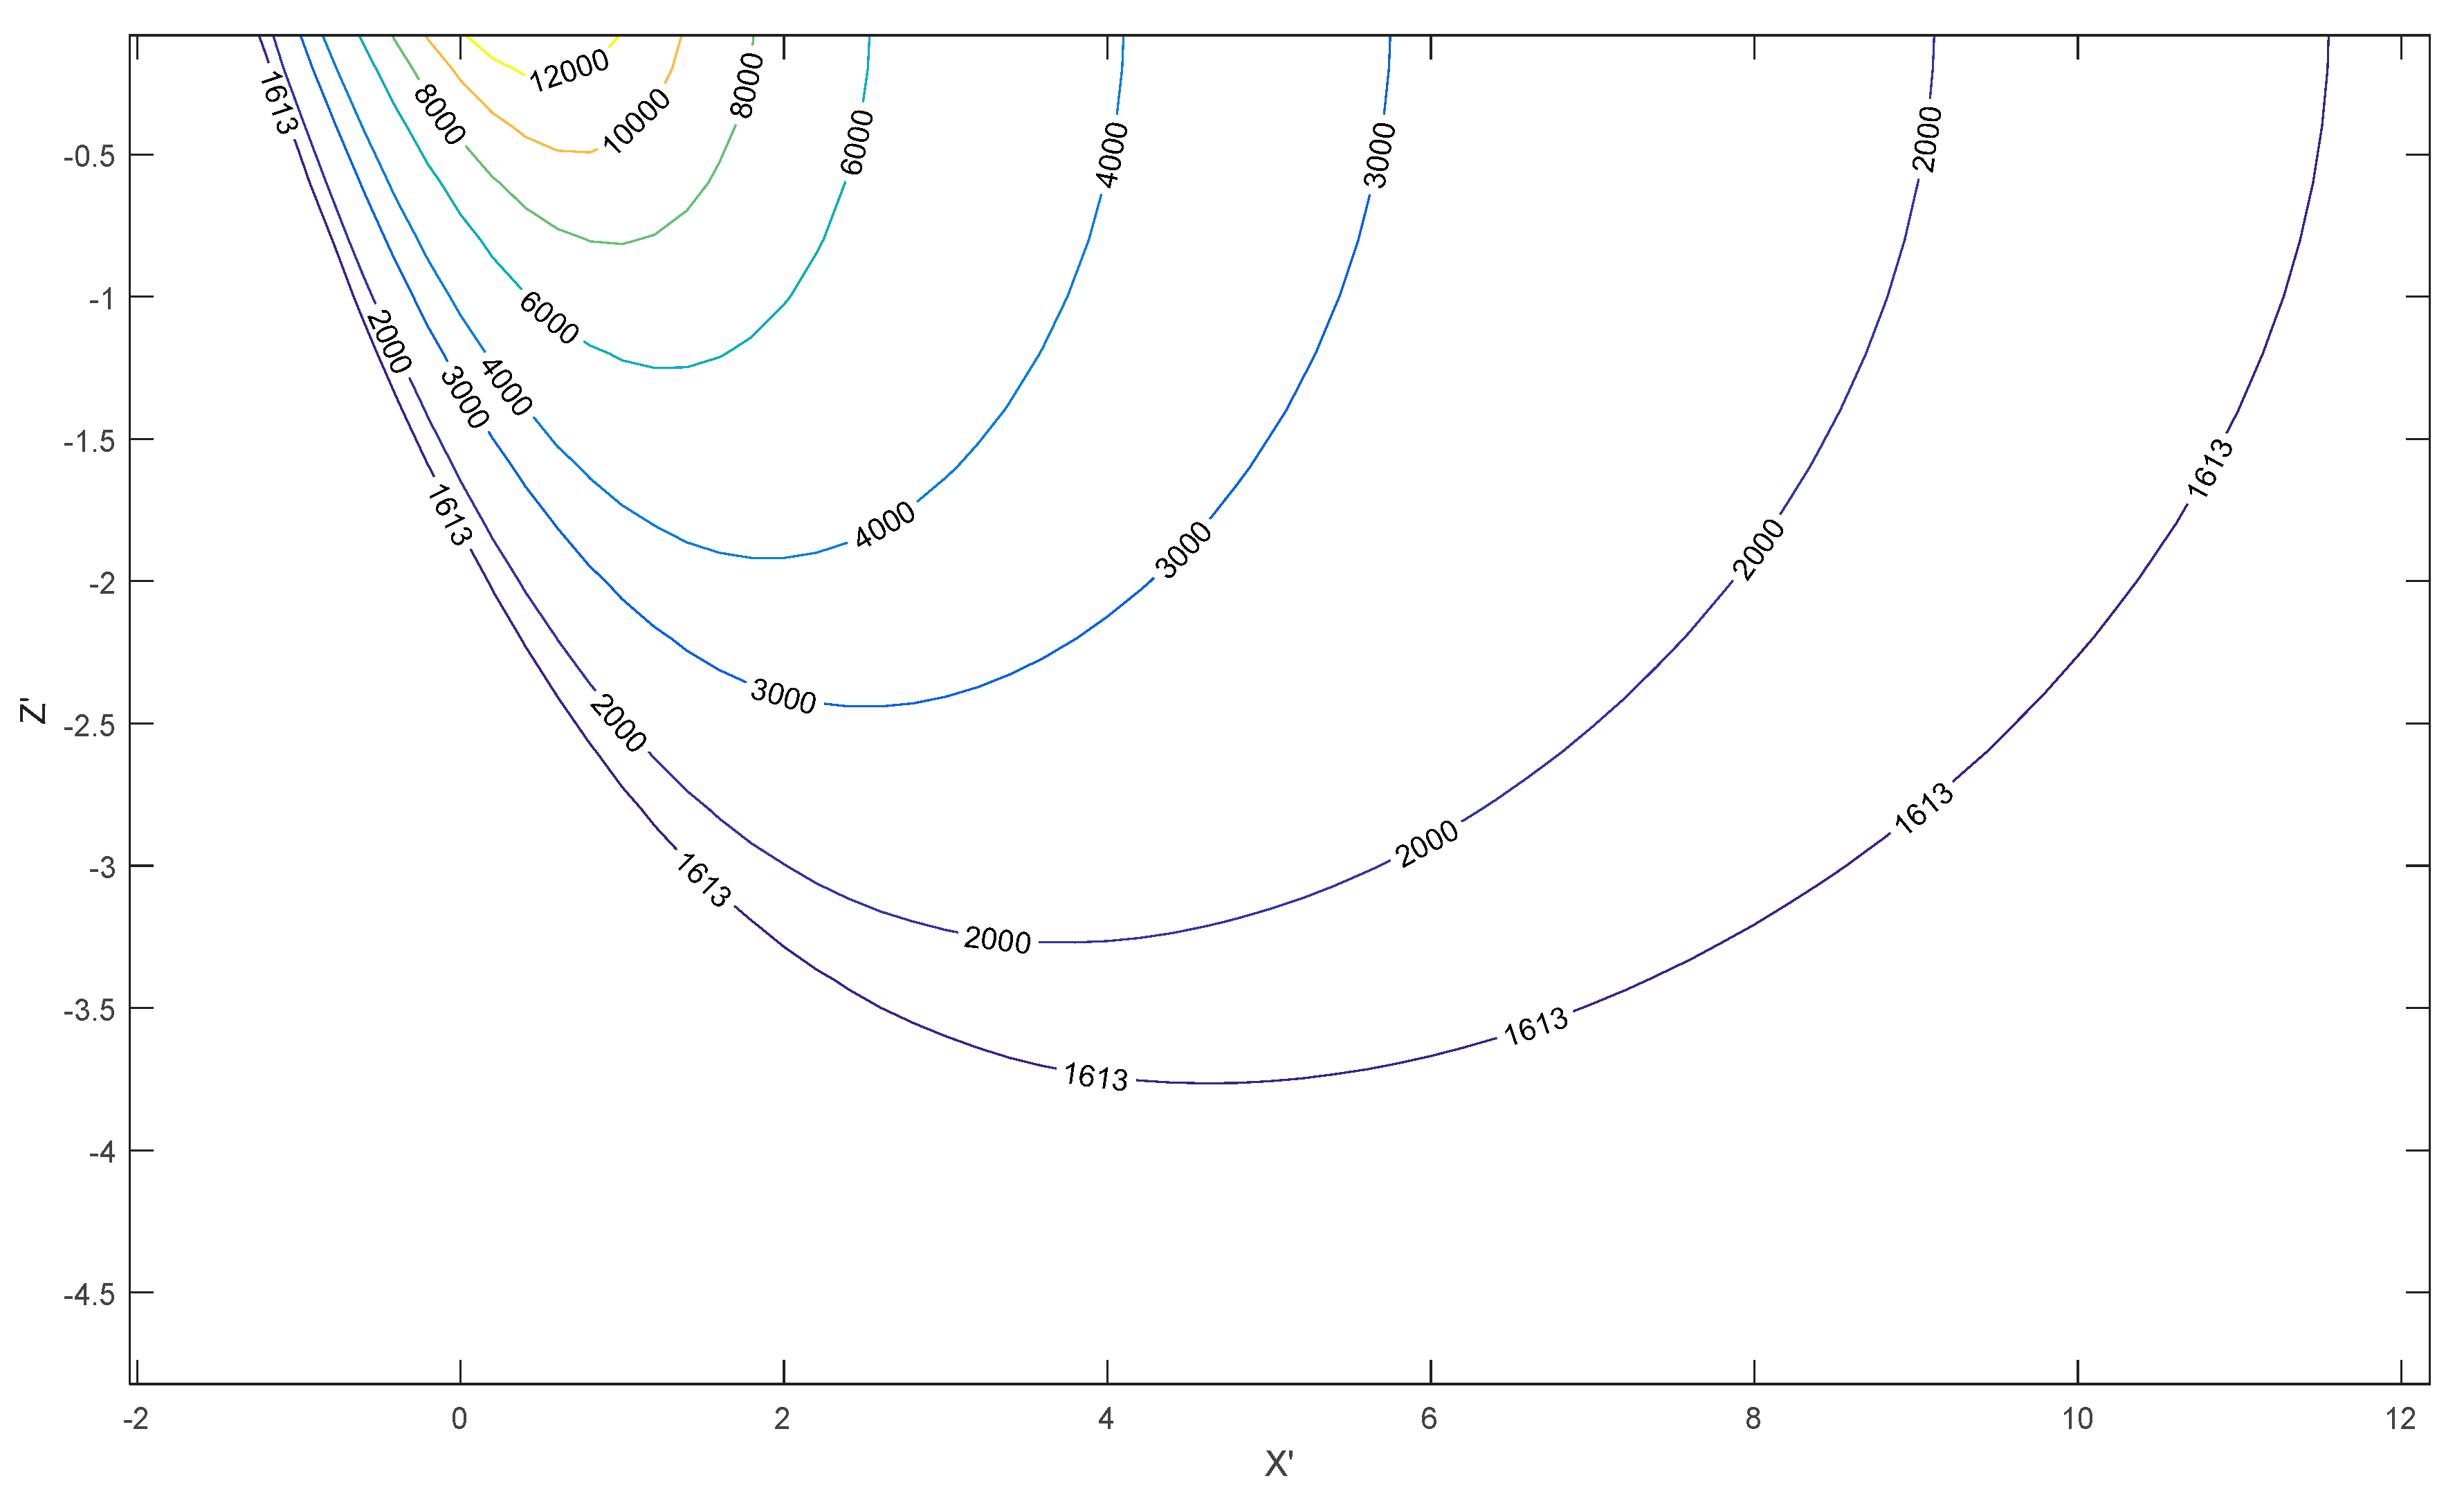
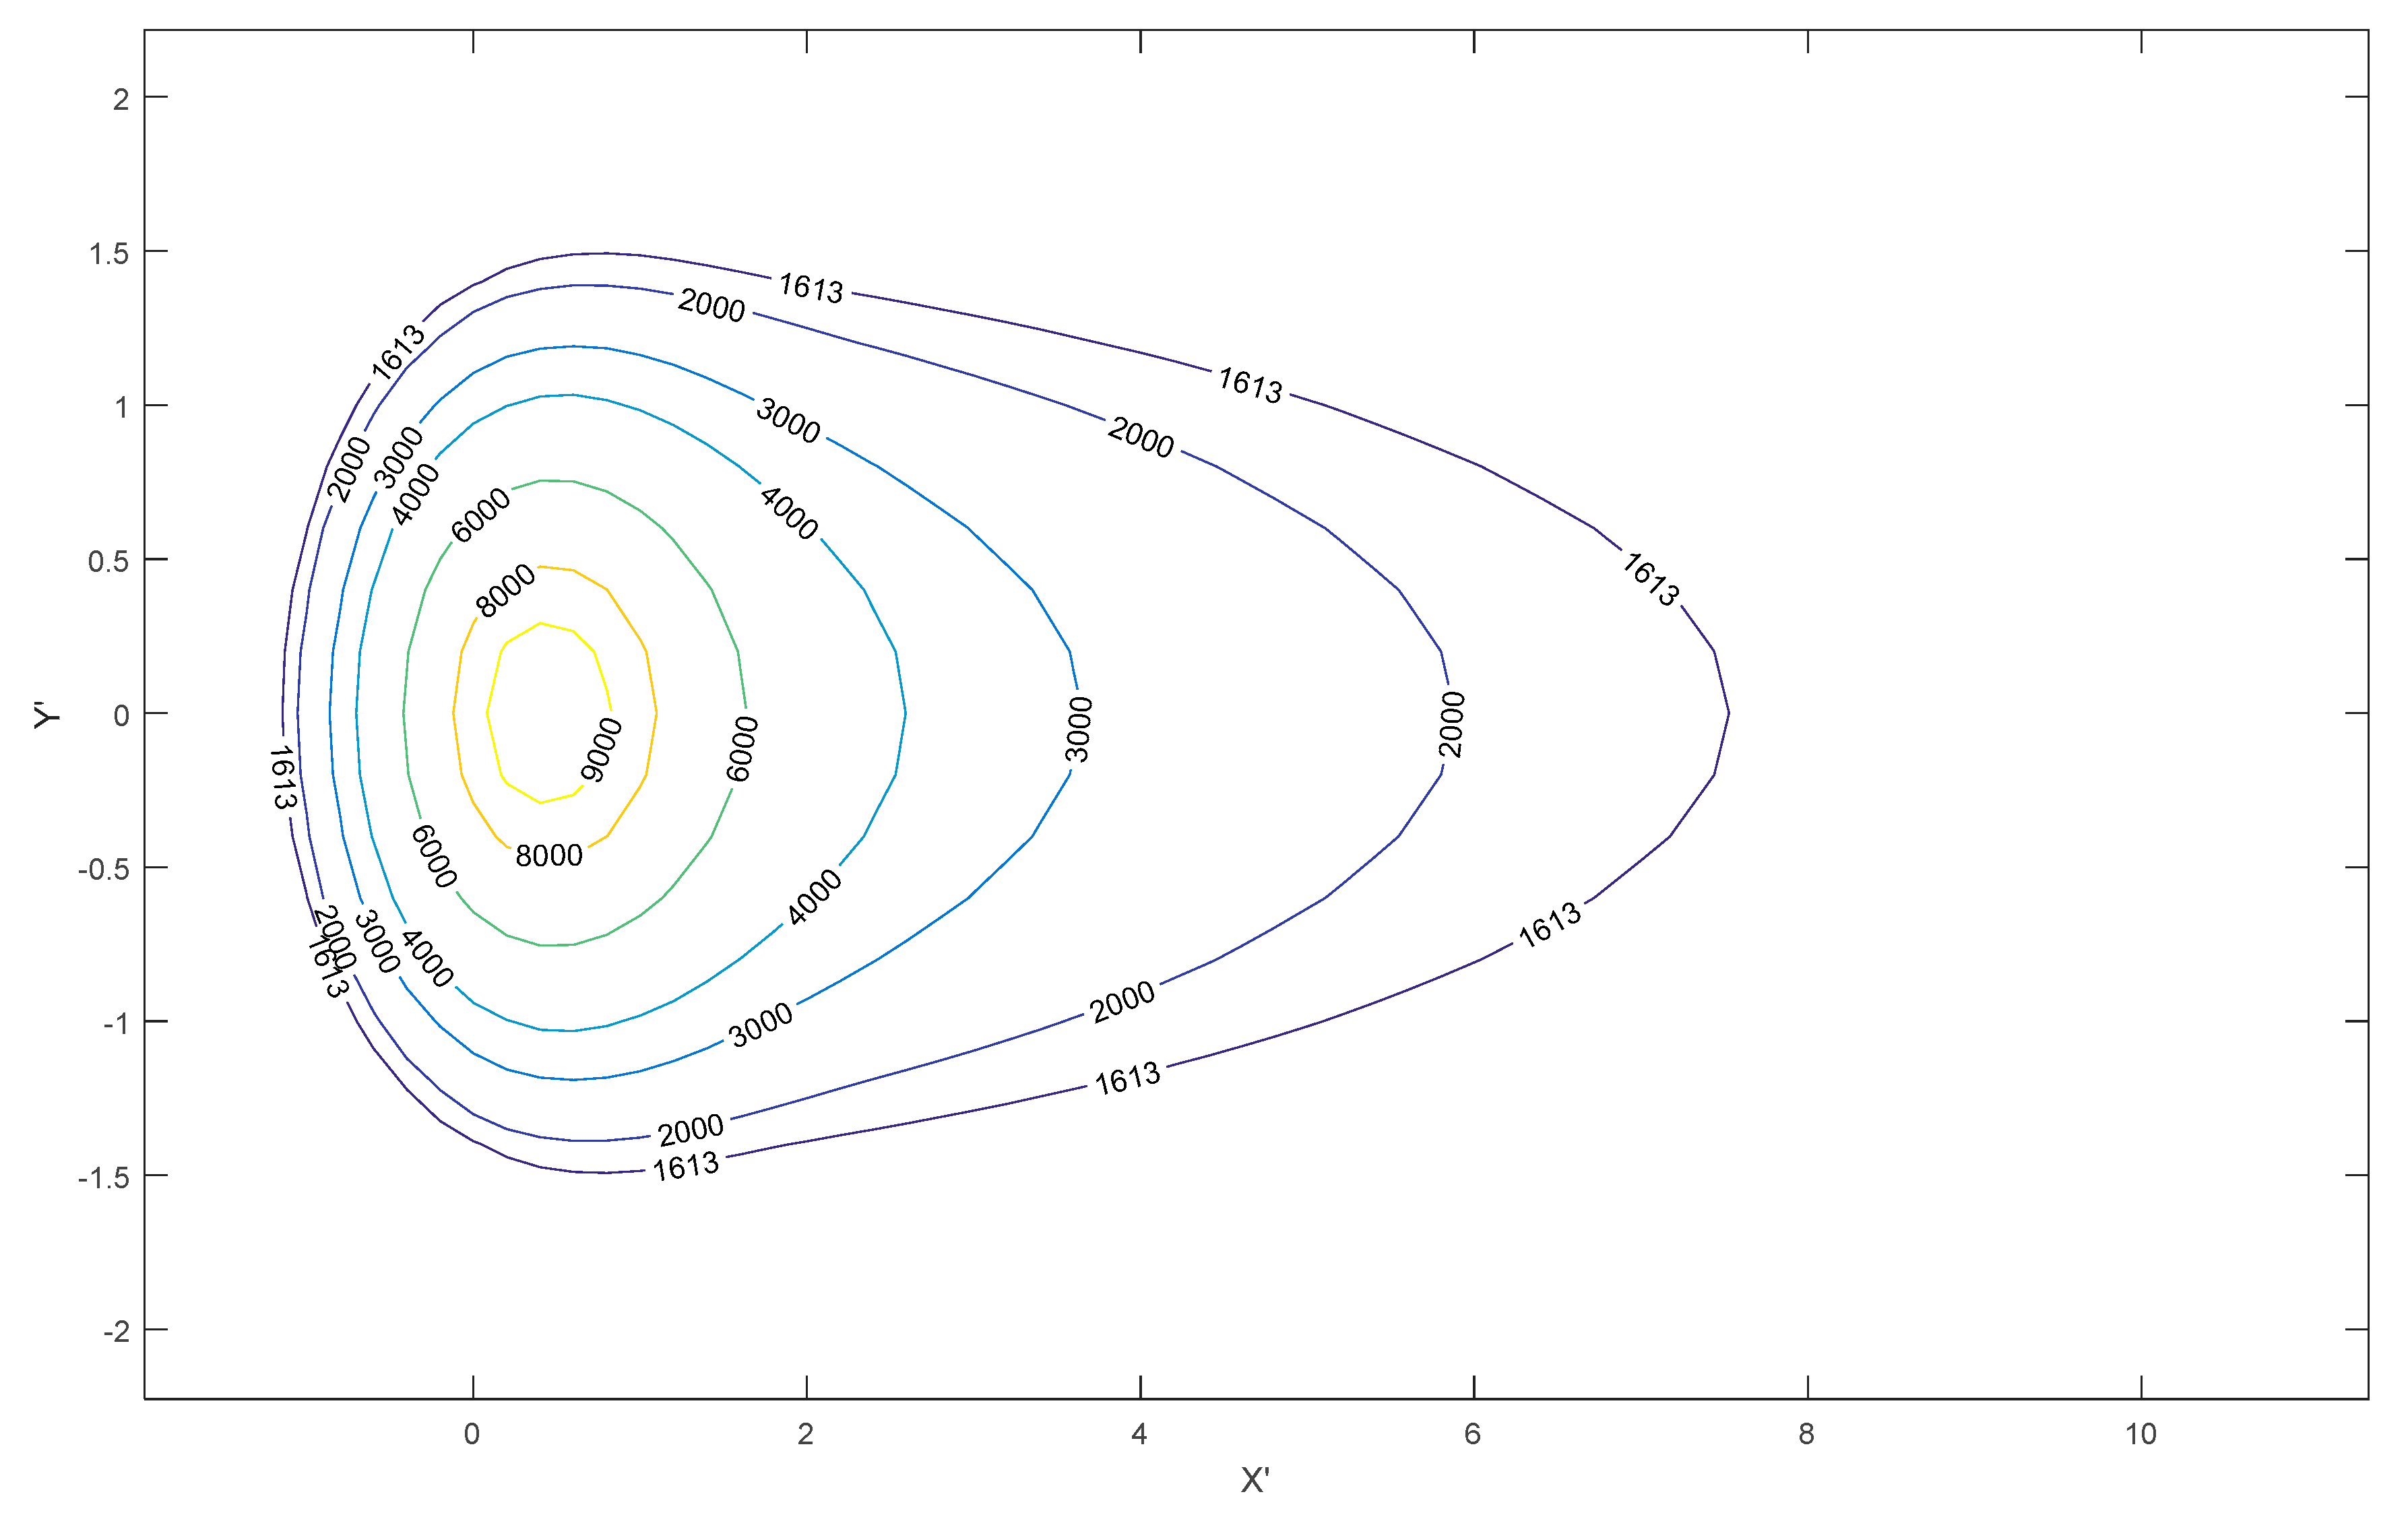
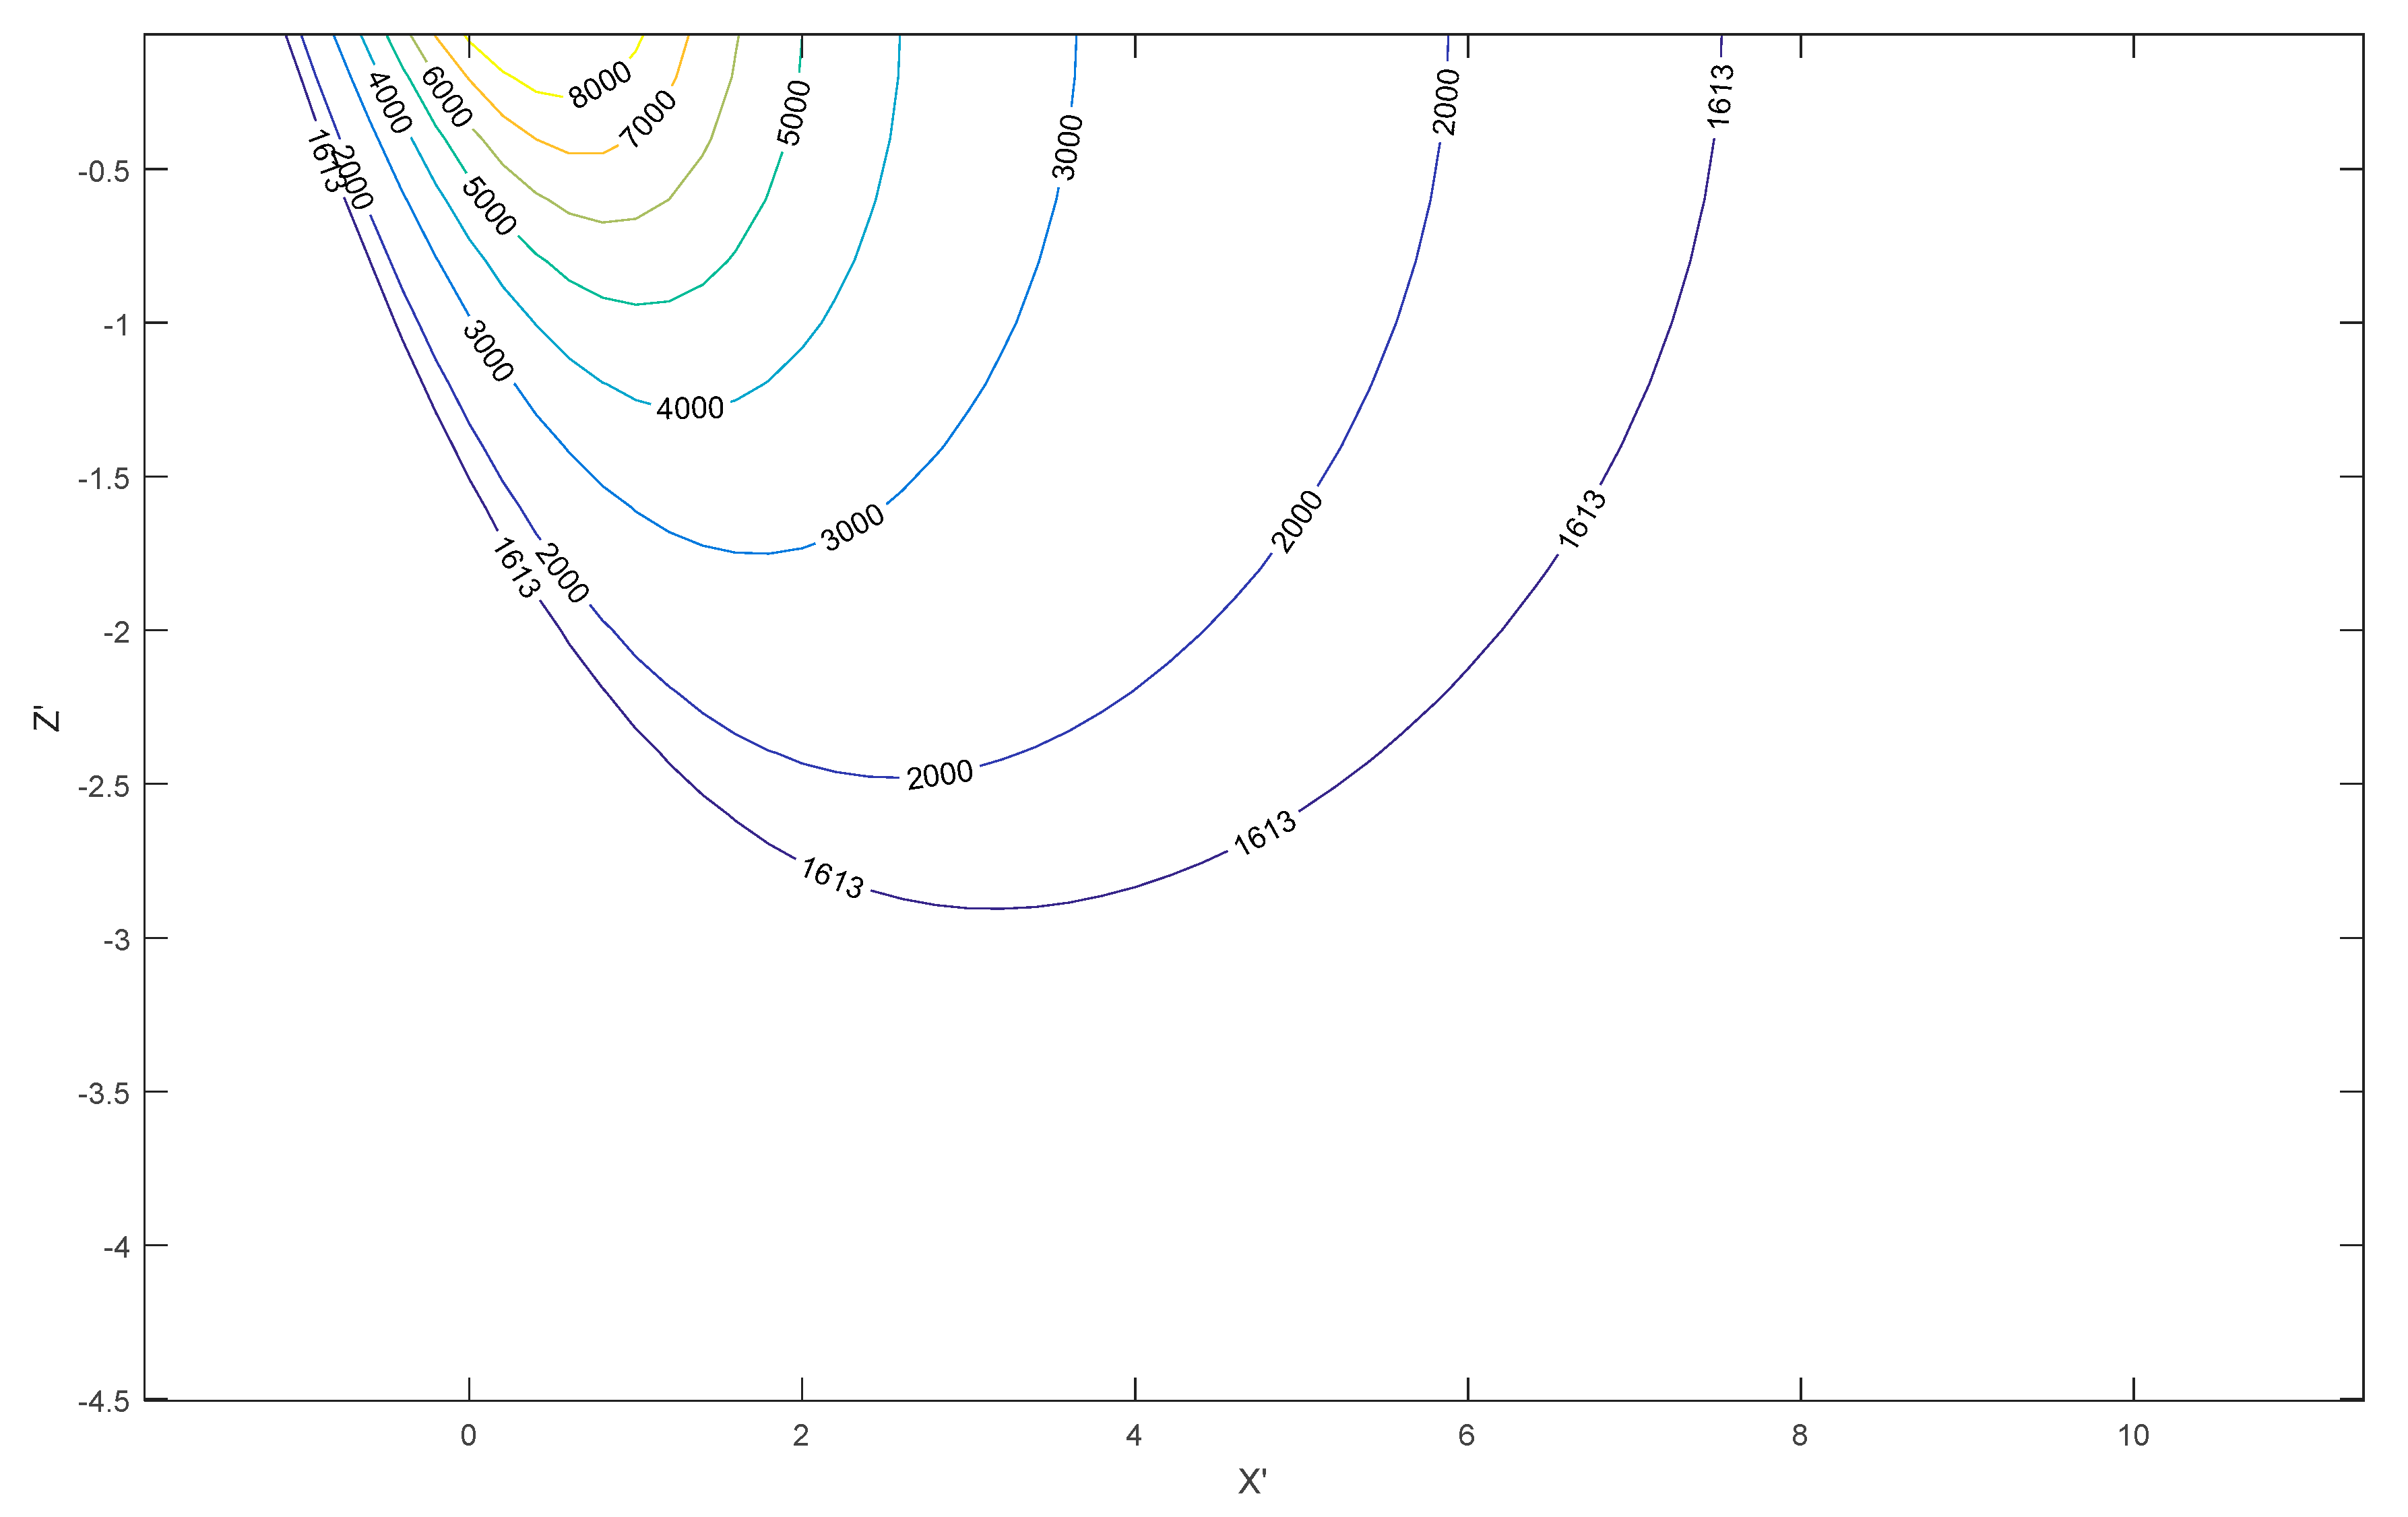
Through the analysis of the four cases (A = 0.3, A = 0.5, A = 0.87 and of A calculated by the formula proposed in this paper), the temperature field distribution is calculated by the analytical solution presented in this paper. From the geometry of the melt pool, it can be seen that absorptivity has a significant effect on the melt pool configuration. Therefore, when performing thermal analysis, absorptivity cannot be regarded as a fixed value, but an experiment should be performed on absorptivity of the material to be printed. Based on the calculation of the obtained absorptivity, ideal process parameters will be quickly computed by the analytical solution, which can provide suggestions for production process engineers.
(2)
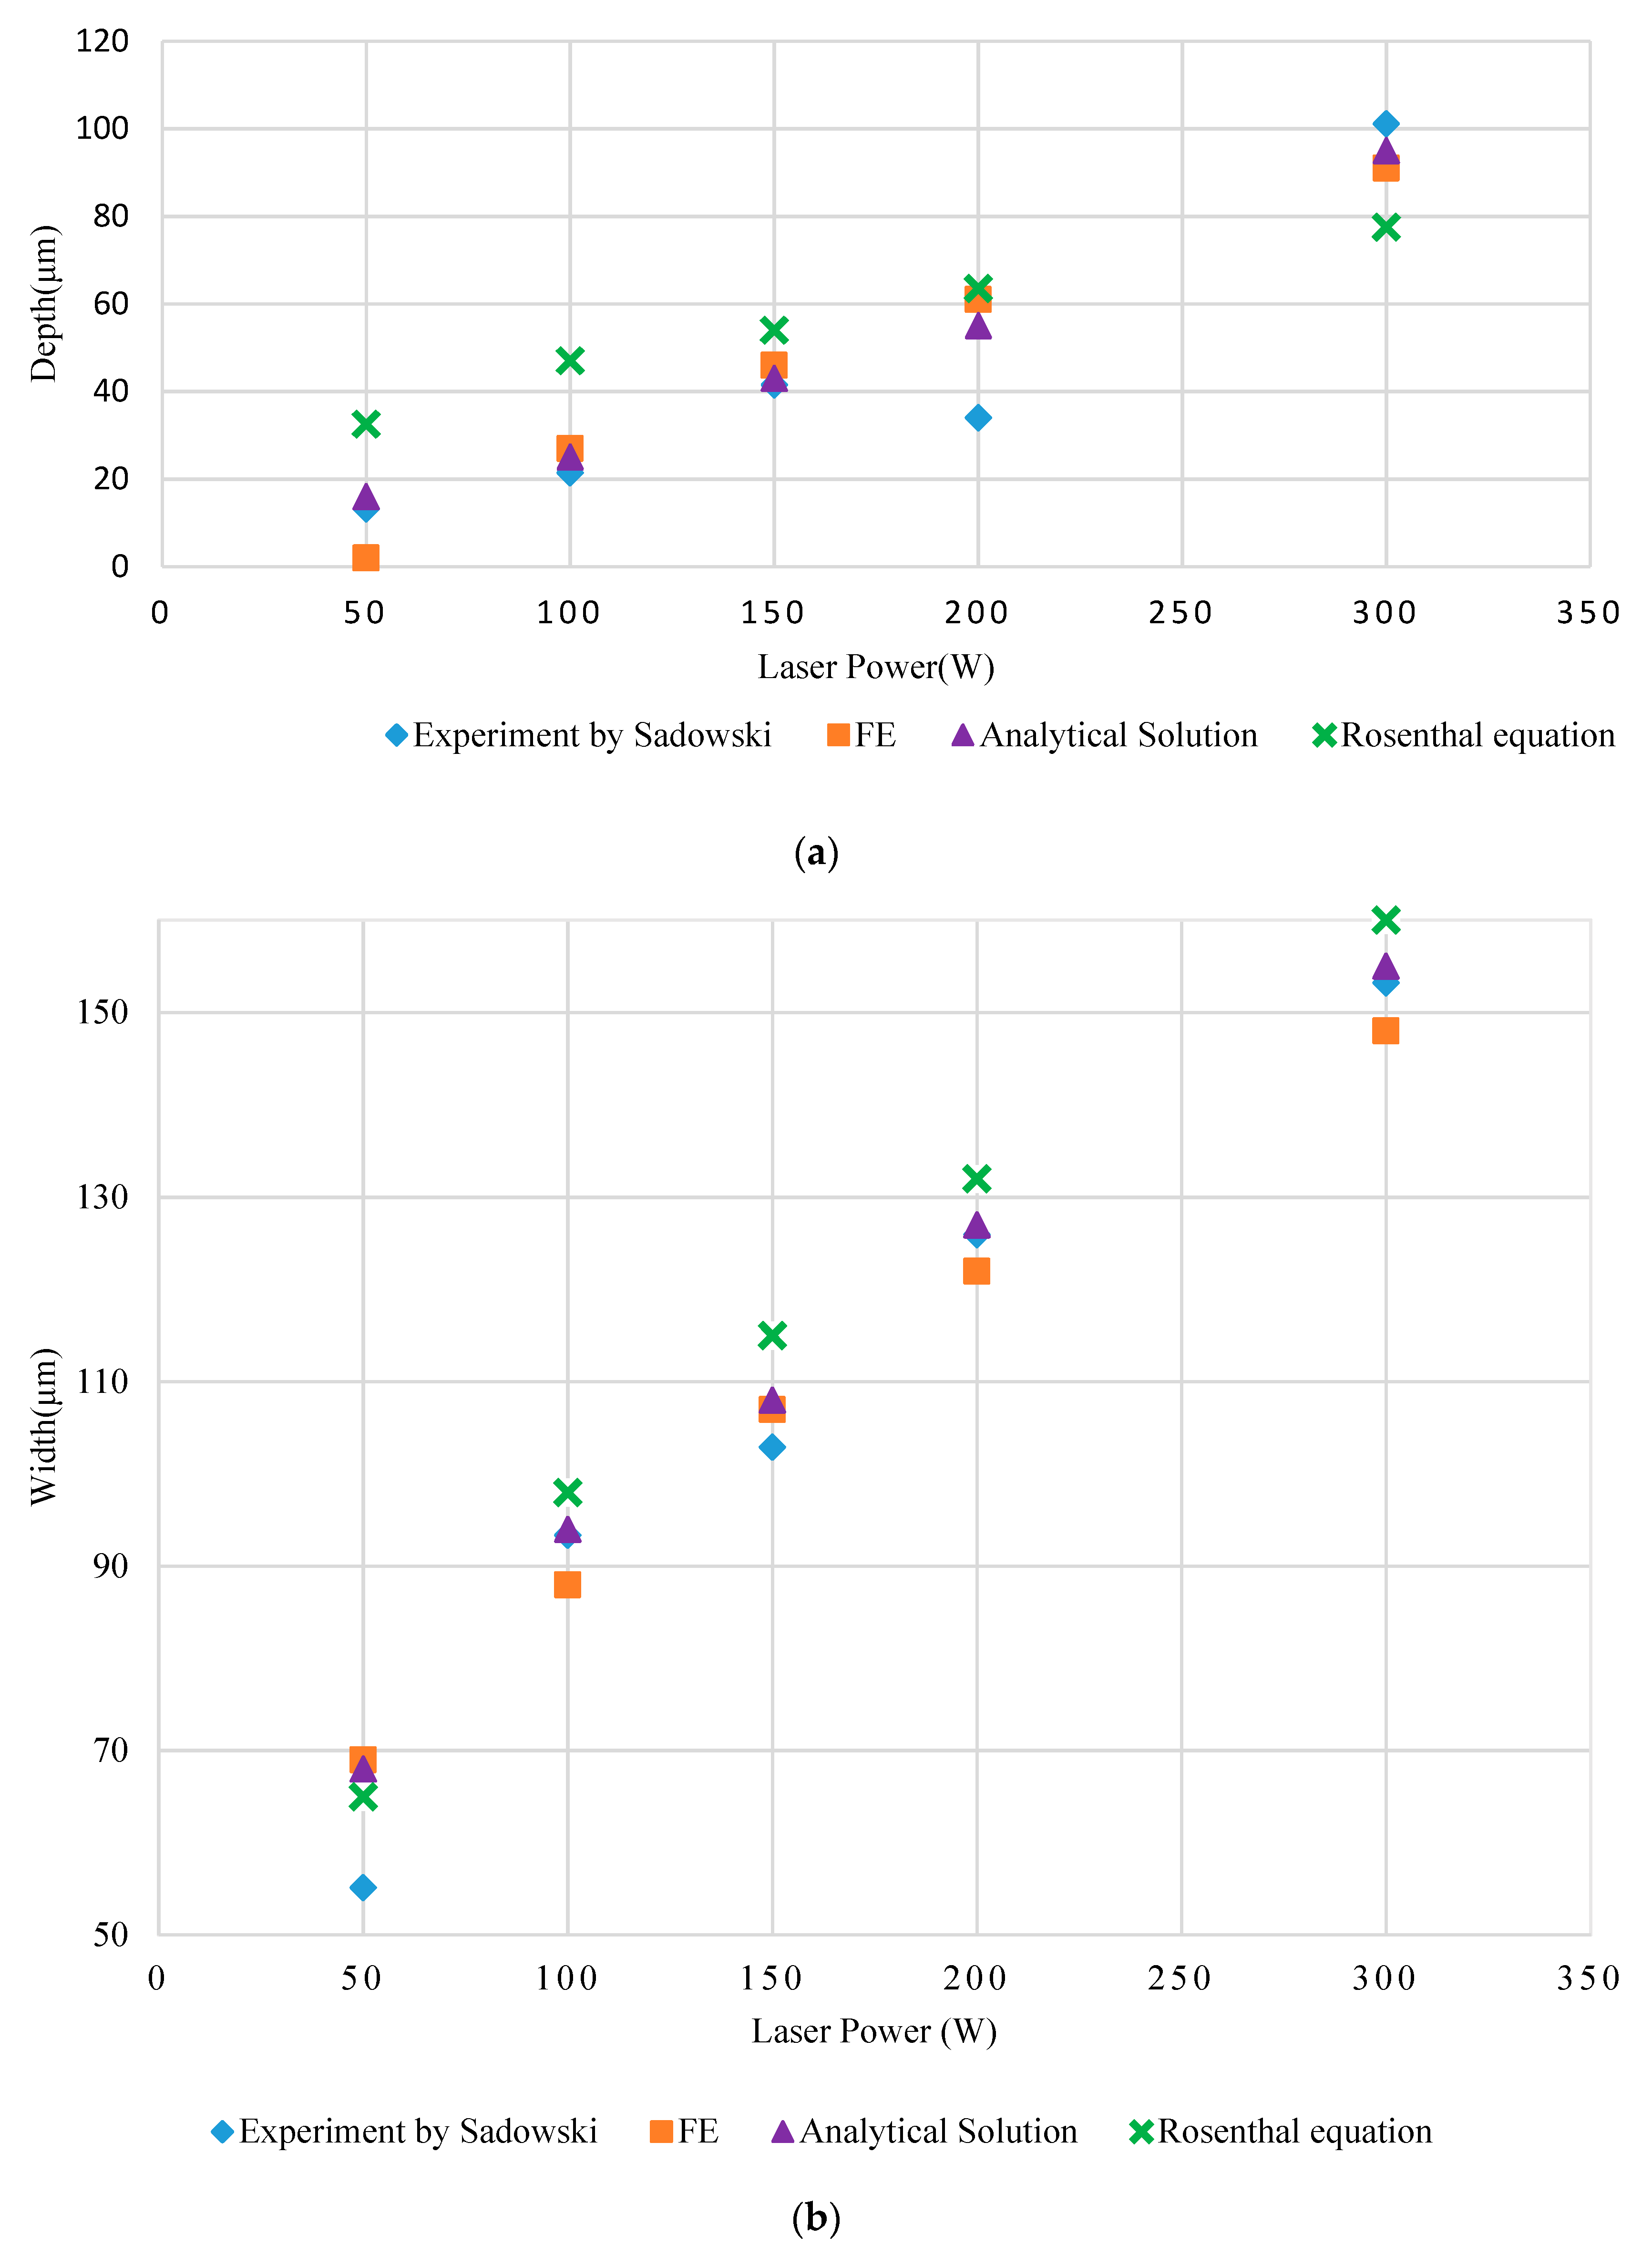
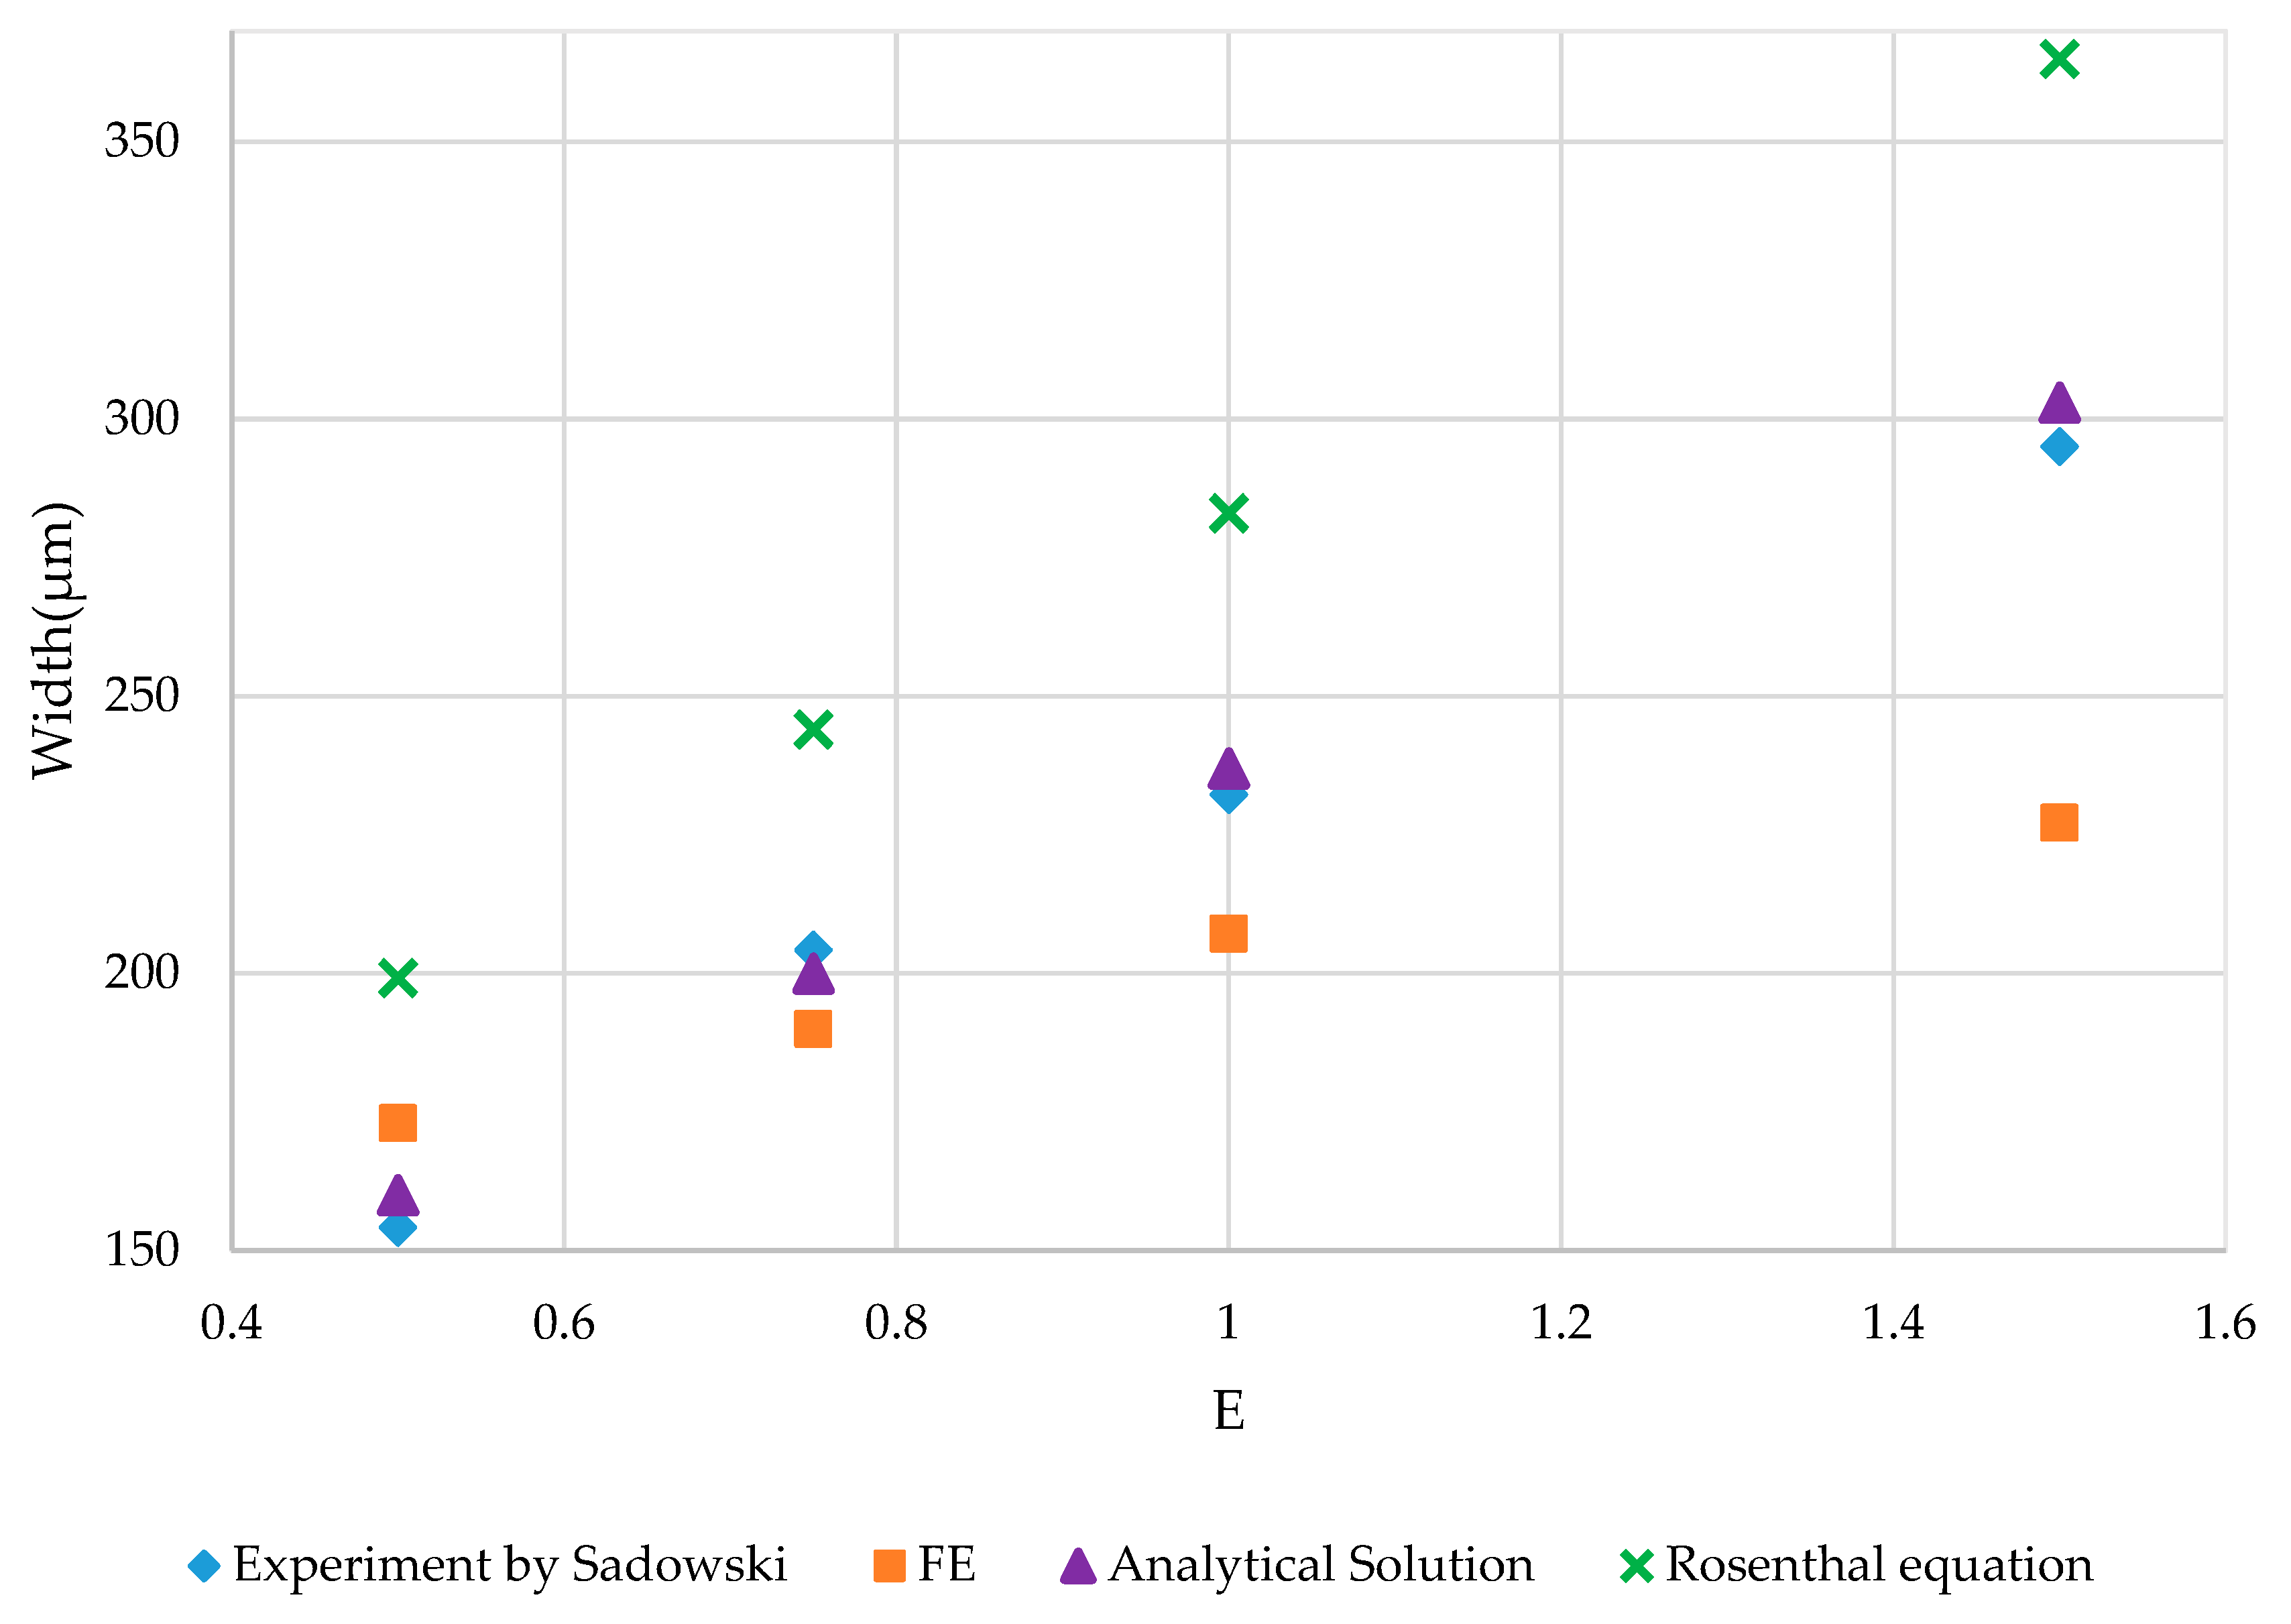
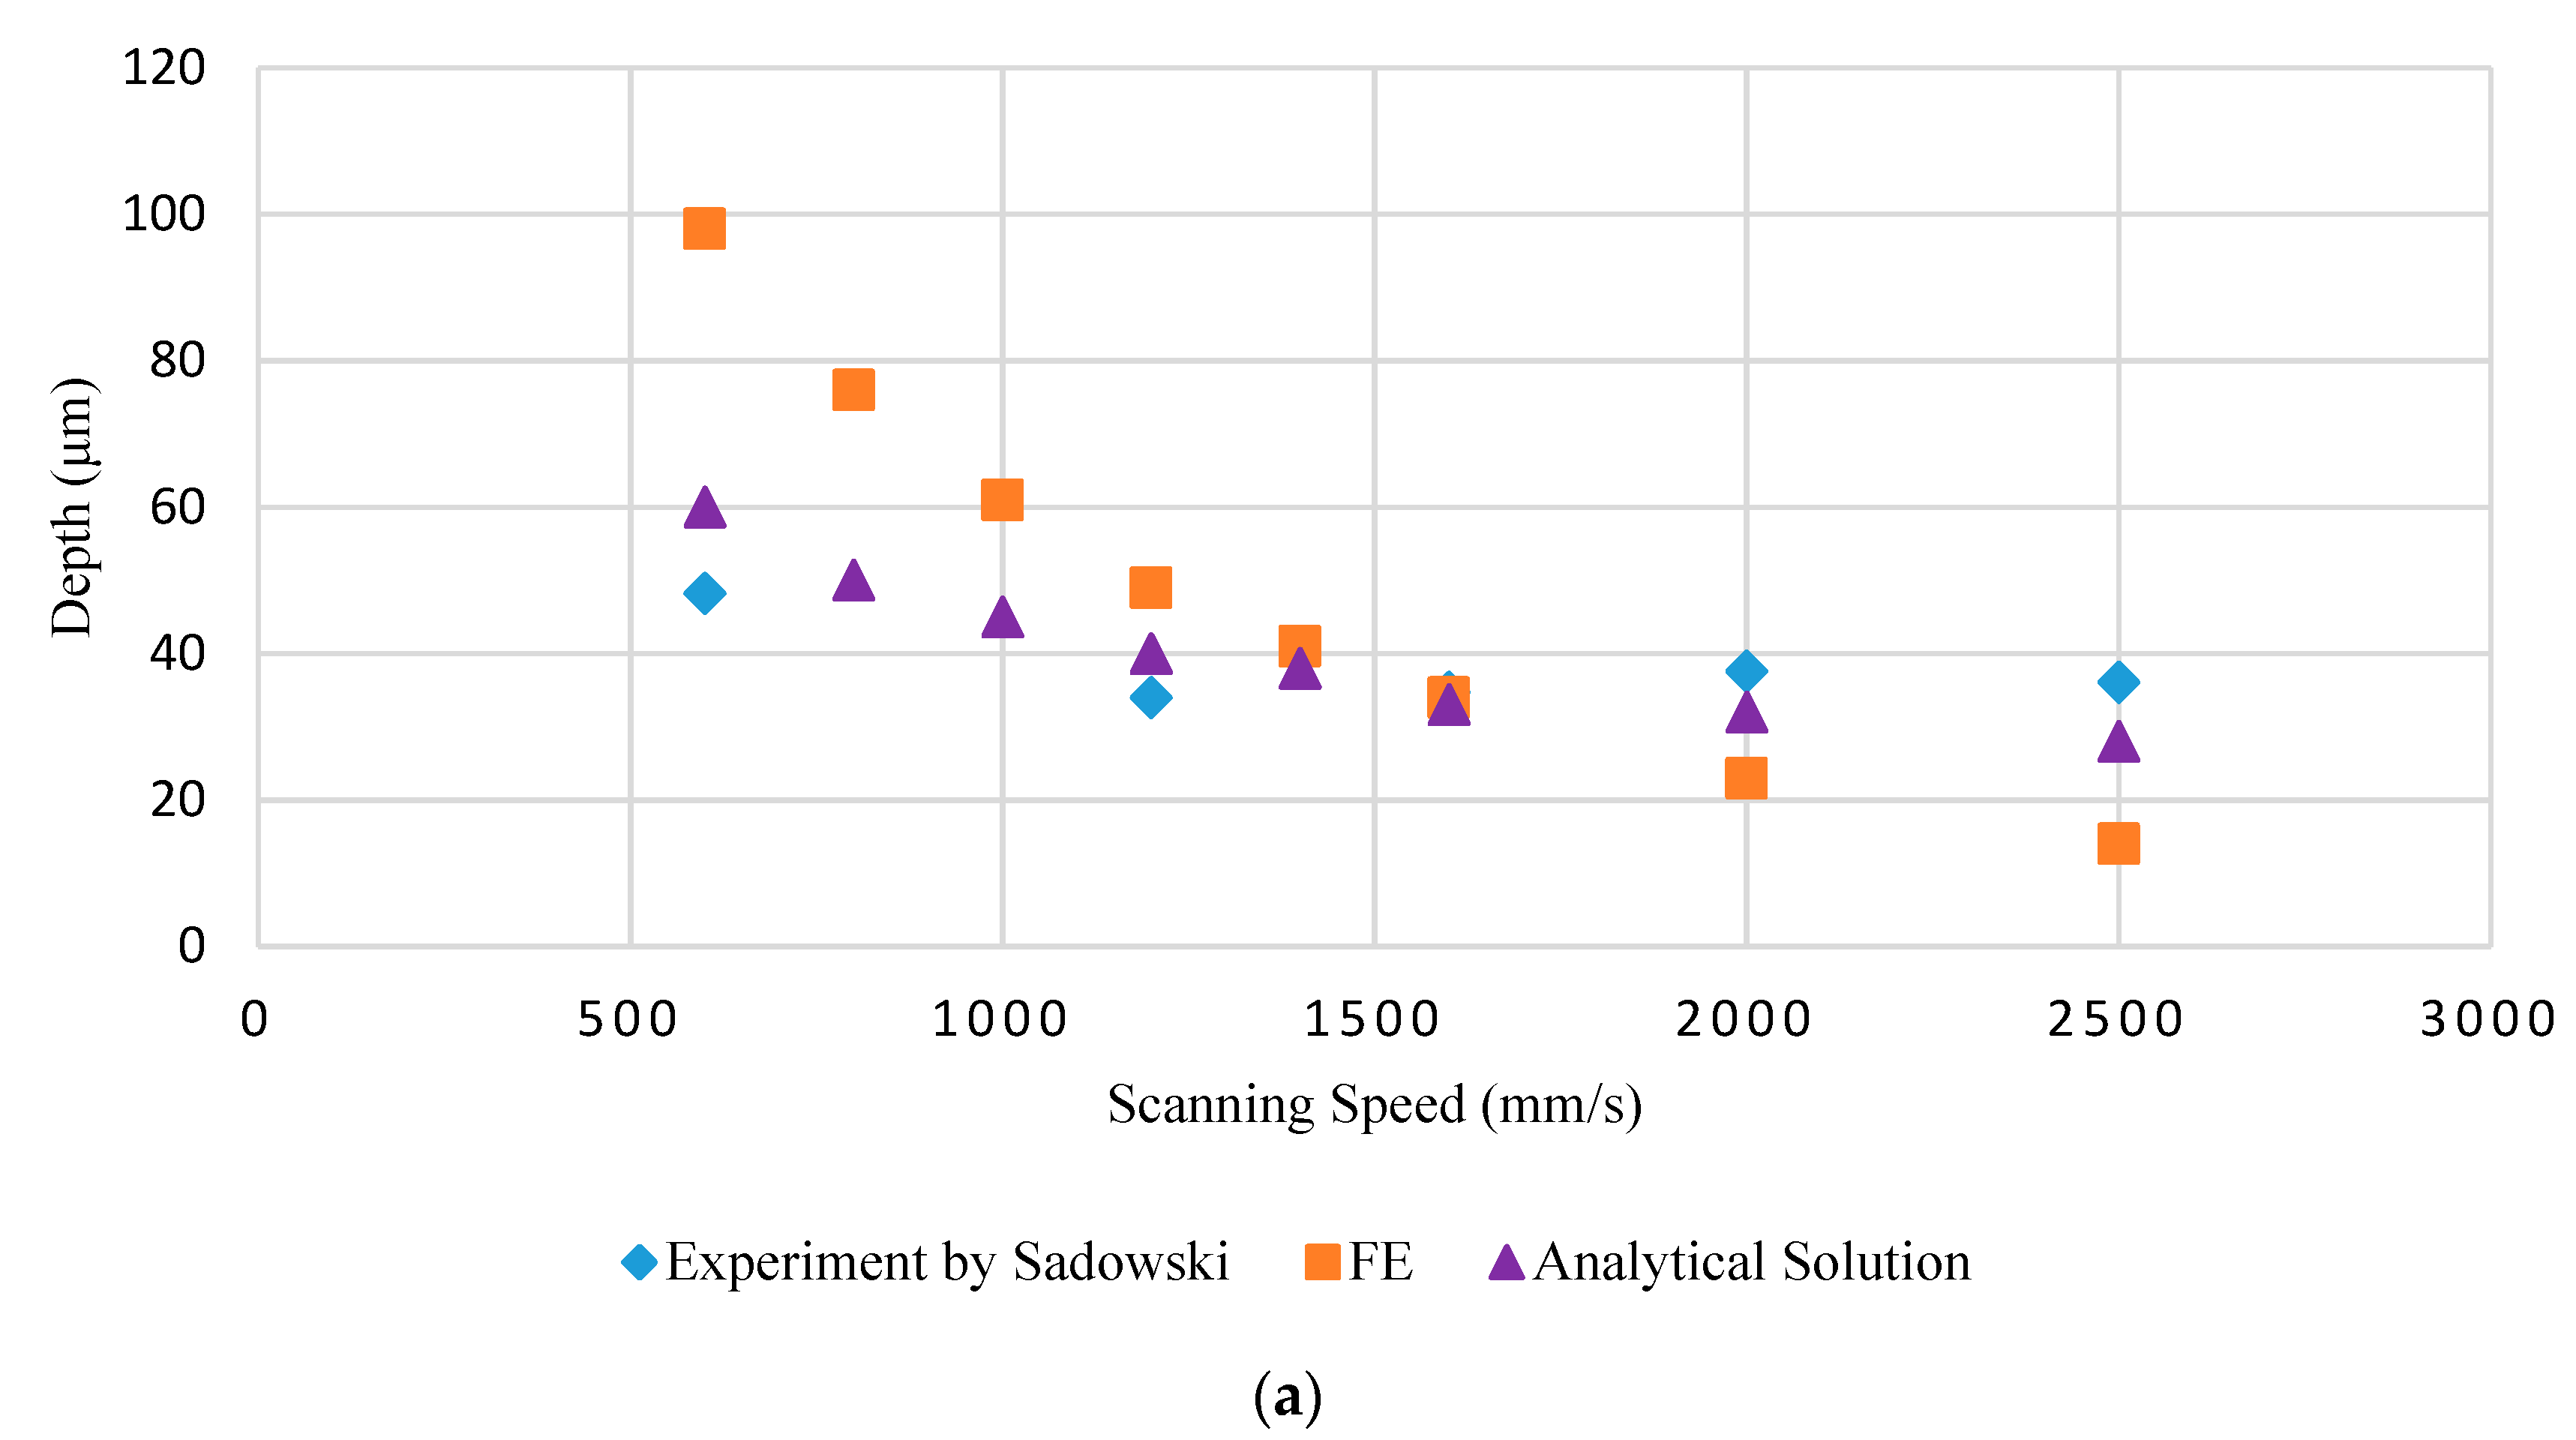
By comparing the analytical method, the experiment and the FE simulation, the results show that the analytical method for the prediction of the melt pool size is more consistent with the experimental results. Further, this method can quickly and accurately predict the thermal distribution of AM parts.
(3)
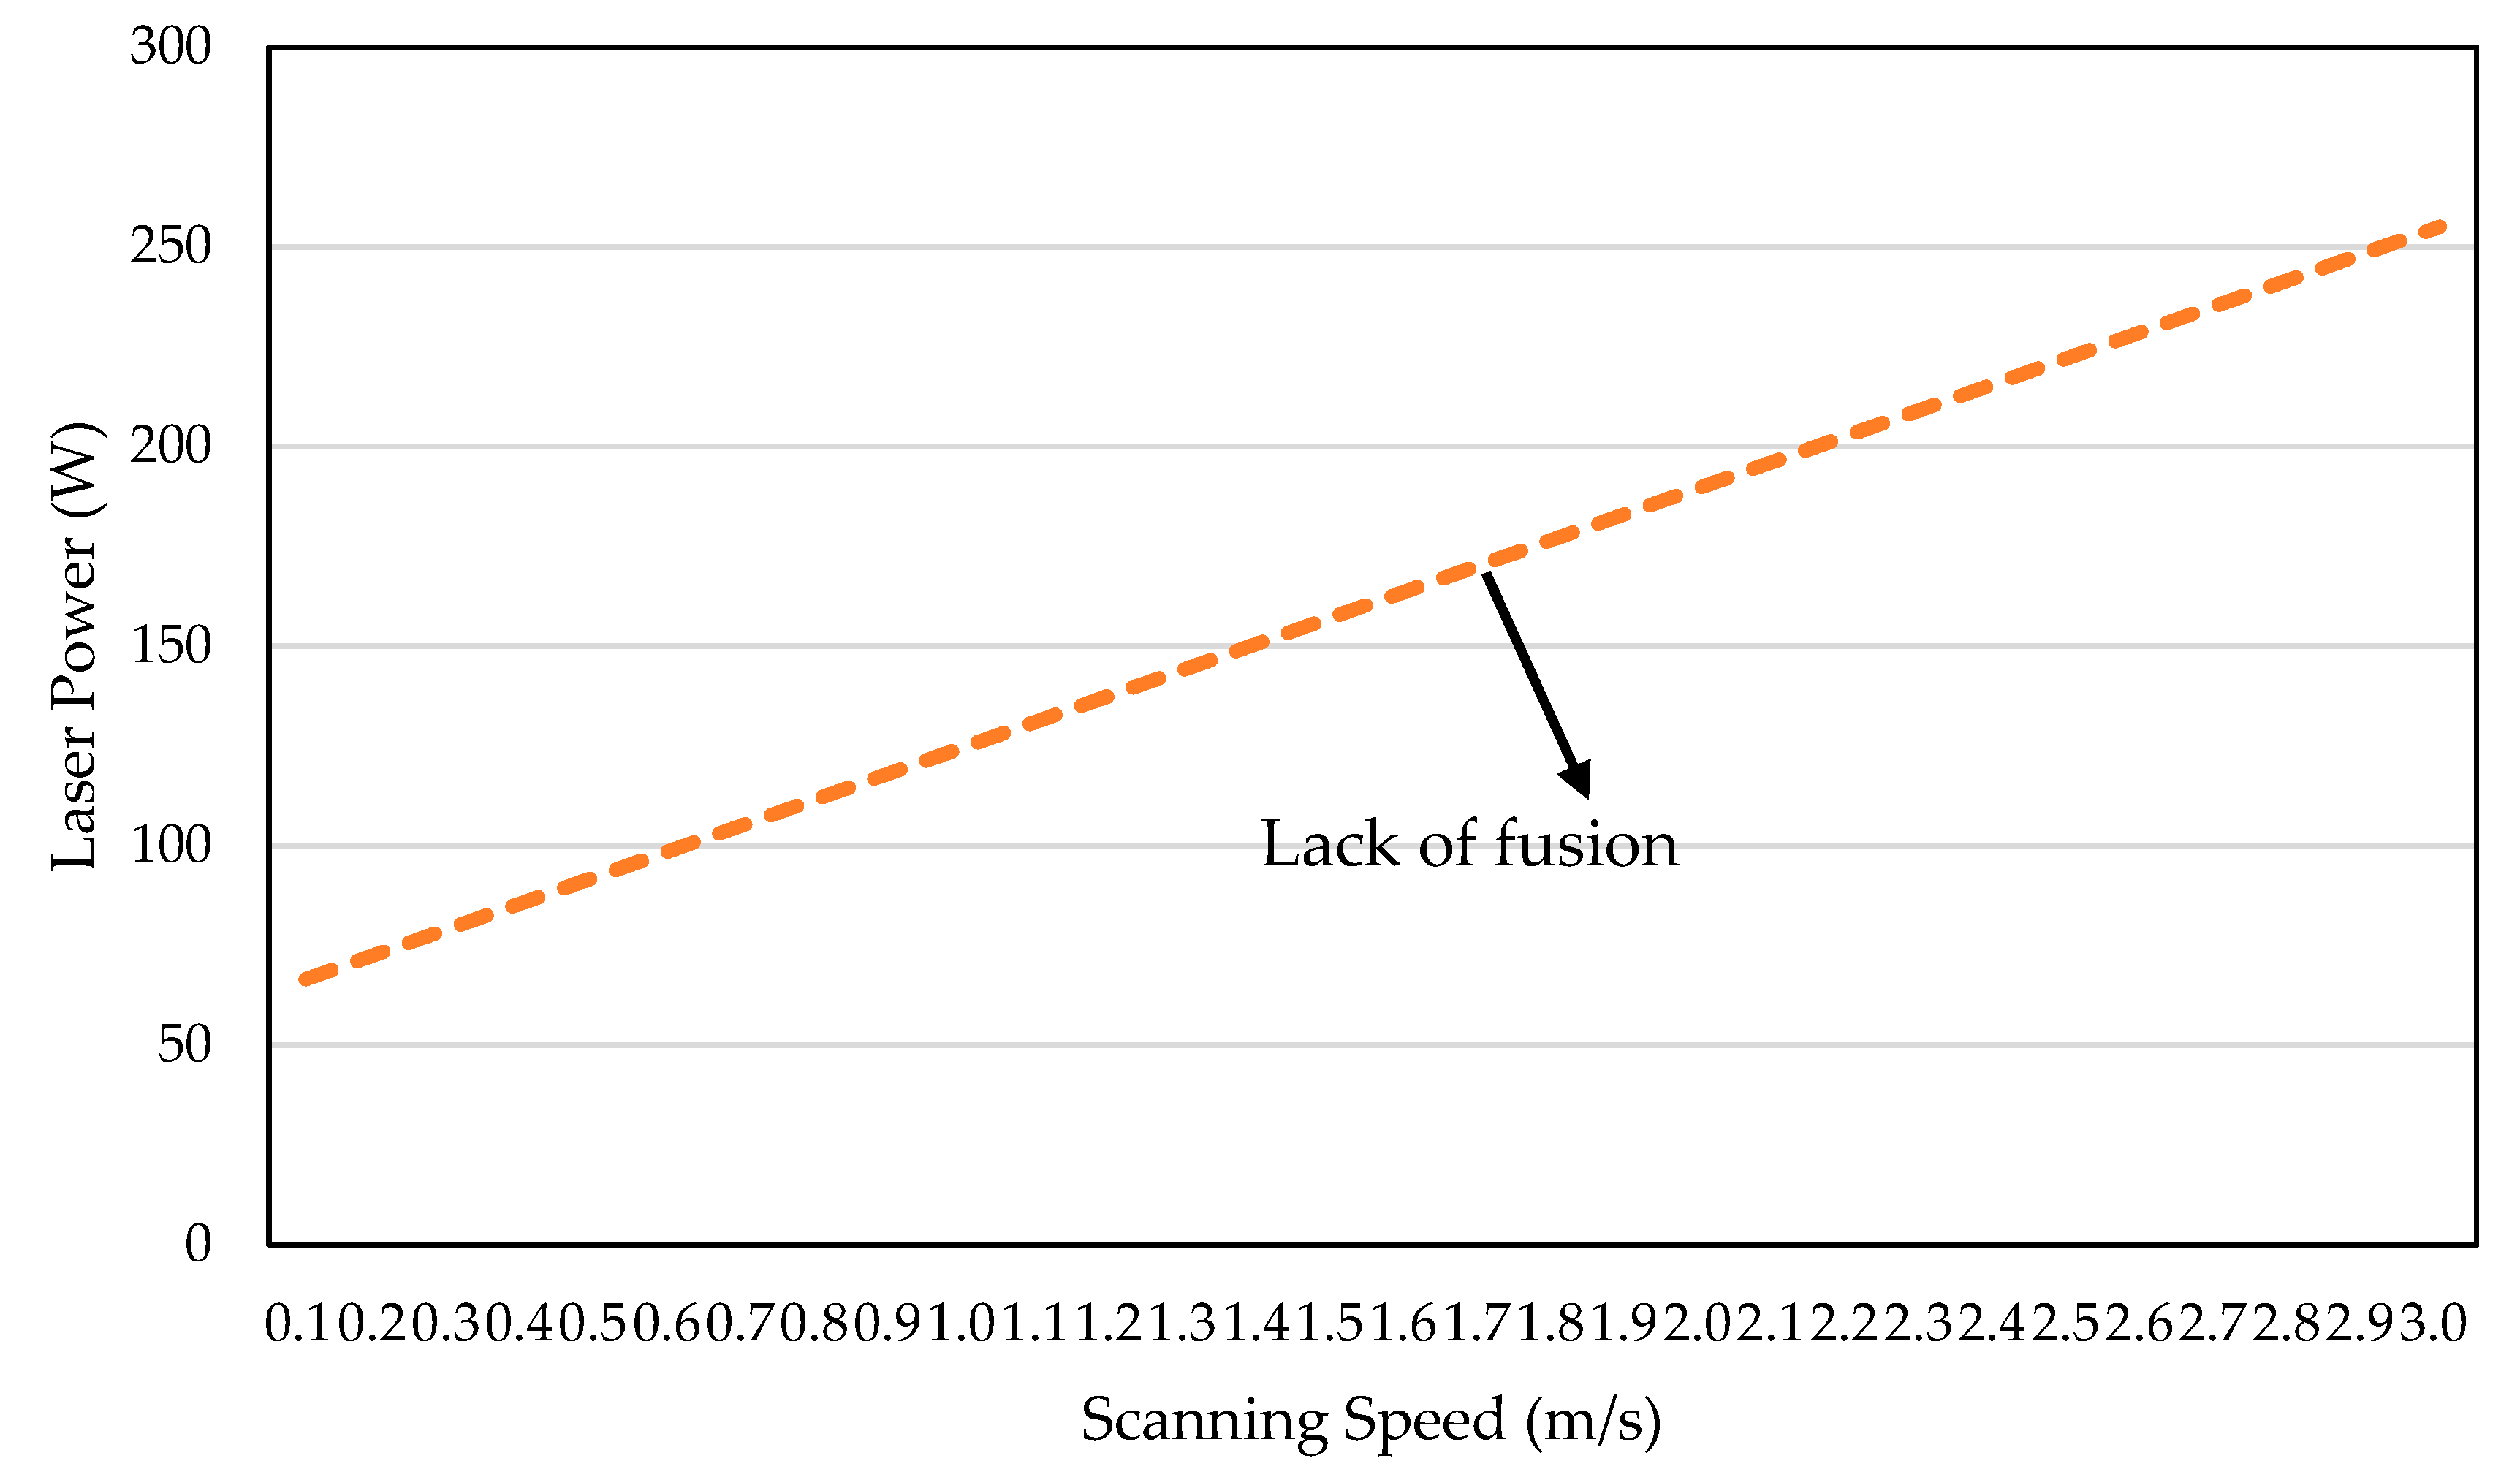
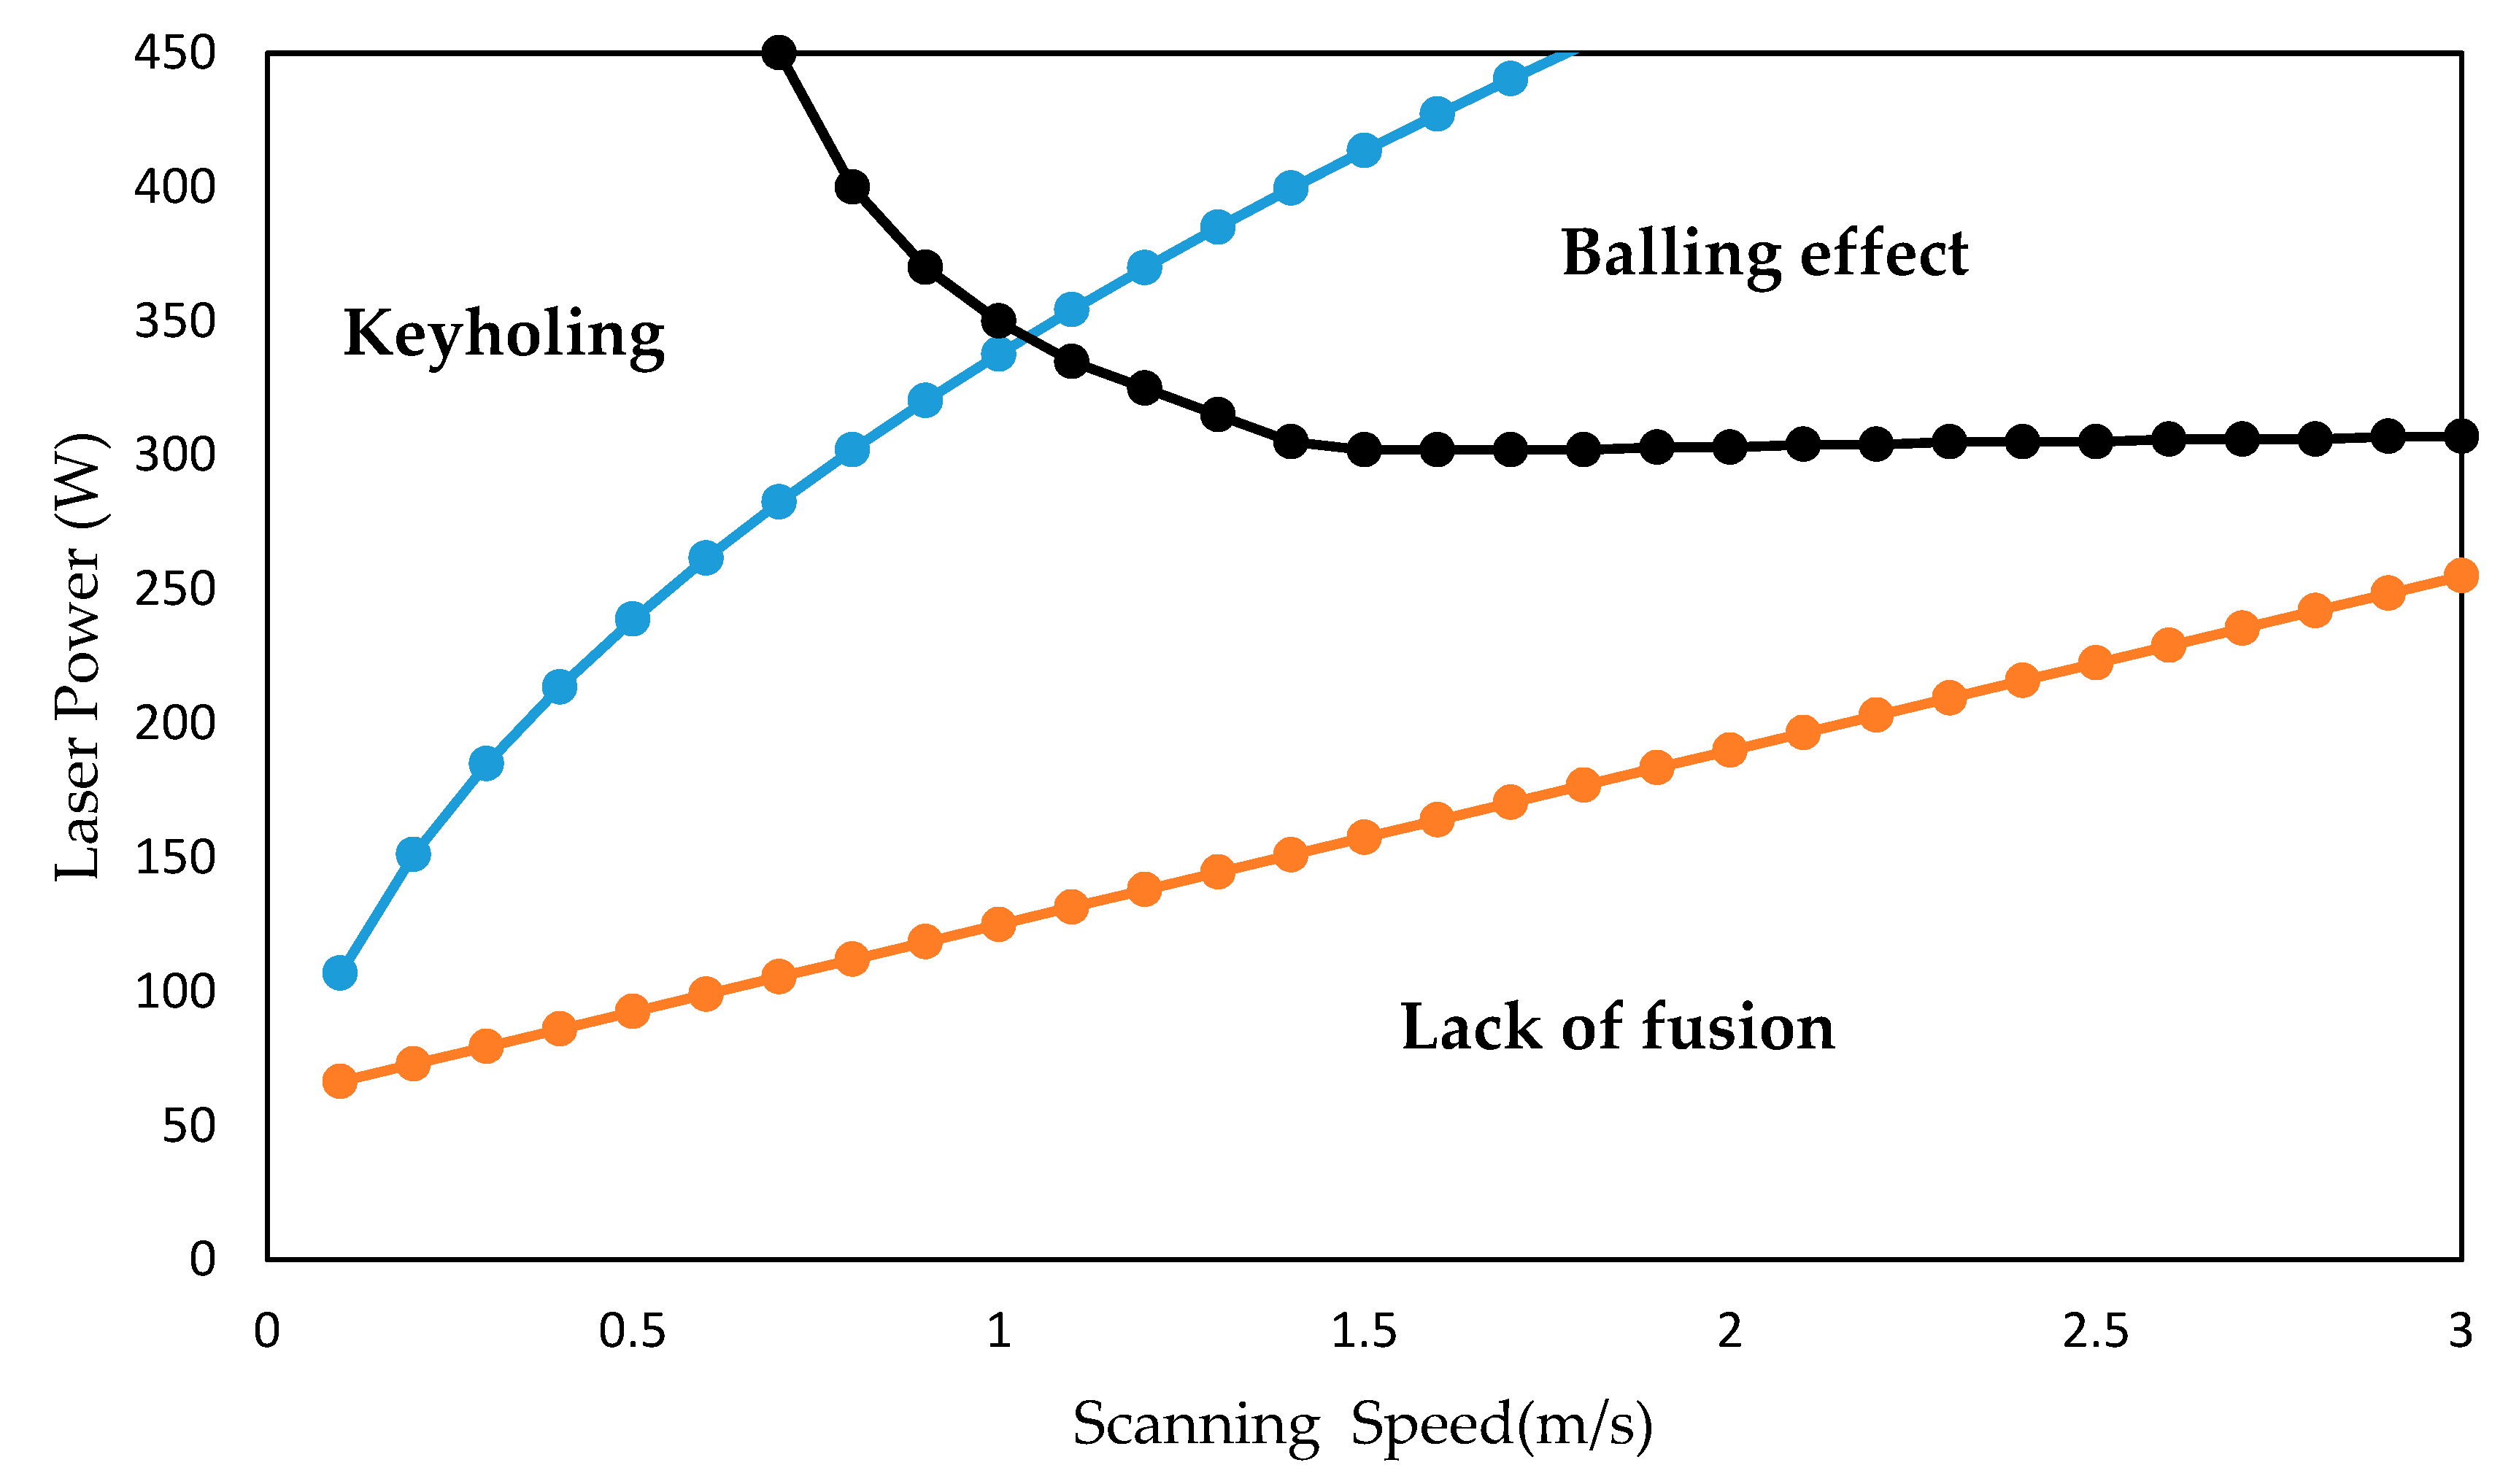
The analytical method is successfully applied to the prediction of the internal defects of the In718 by SLM, combined with the criteria of lack of fusion, keyholing and balling, the regime of the internal defects under different combinations of laser power and scanning speed is calculated, so as to obtain an ideal process parameter combination to avoid defects.
(4)
For the prediction of the keyholing regime, further in-depth discussions are still needed. In addition, the influence of the powder layer and hatching distance on the temperature field and the characteristics of the molten pool needs to be considered in the future.

Author Contributions

Methodology, H.Y. and S.W.; validation, Z.L.; investigation, S.W.; writing—original draft preparation, Z.L.; writing—review and editing, H.Y.; funding acquisition, H.Y. All authors have read and agreed to the published version of the manuscript.

Funding

This research was funded by Science and Technology Foundation of State Key Laboratory (Grant No. 9100419010) and Fundamental Research Funds for the Central Universities (Grant No. 2017MS150).

Conflicts of Interest

The authors declare no conflict of interest.

Appendix A

Figure A1. Melt pool temperature contour at top view for In718 with a laser power of 100 W, scanning speed of 1 mm/s, laser spot radius of 50 μm and A = 0.5.
Applsci 10 07300 g0a1
Figure A2. Melt pool temperature contour at longitudinal view for In718 with a laser power of 100 W, scanning speed of 1 mm/s, laser spot radius of 50 μm and A = 0.5.
Applsci 10 07300 g0a2
Figure A3. Melt pool temperature contour at top view for In718 with a laser power of 100 W, scanning speed of 1 mm/s, laser spot radius of 50 μm and absorptivity at room temperature.
Applsci 10 07300 g0a3
Figure A4. Melt pool temperature contour at longitudinal view for In718 with a laser power of 100 W, scanning speed of 1 mm/s, laser spot radius of 50 μm and absorptivity at room temperature.
Applsci 10 07300 g0a4

References

  1. Wang, Z.; Wang, X.; Xie, R.; Zhou, X. Research on the pore defects of Inconel 718 alloy formed by selective laser melting. Surf. Technol. 2020, 5, 1–8. [Google Scholar]
  2. Zienkiewicz, O.; Taylor, R.; Zhu, J. The Finite Element Method: Its Basis and Fundamentals; Elsevier BV: Amsterdam, The Netherlands, 2013. [Google Scholar]
  3. Ferziger, P.J.H.; Perić, M. Computational Methods for Fluid Dynamics; Springer Science and Business Media LLC: Berlin/Heidelberg, Germany, 2002. [Google Scholar]
  4. Cook, P.S.; Murphy, A.B. Simulation of melt pool behaviour during additive manufacturing: Underlying physics and progress. Addit. Manuf. 2020, 31, 100909. [Google Scholar] [CrossRef]
  5. Zhang, L.; Wu, W.; Lu, L. Influence of Laser Selective Melting Heat Input Parameters on Temperature Field of Inconel 718 Alloy. J. Mater. Eng. 2018, 46, 29–35. [Google Scholar]
  6. Zhang, D.; Zhang, P.; Liu, Z.; Feng, Z.; Wang, C.; Guo, Y. Thermofluid field of molten pool and its effects during selective laser melting (SLM) of Inconel 718 alloy. Addit. Manuf. 2018, 21, 567–578. [Google Scholar] [CrossRef]
  7. Yuan, W.; Chen, H.; Cheng, T.; Wei, Q. Effects of laser scanning speeds on different states of the molten pool during selective laser melting: Simulation and experiment. Mater. Des. 2020, 189, 108542. [Google Scholar] [CrossRef]
  8. Weihao, Y.; Hui, C.; Qingsong, W. The Role of Recoil Pressure in Thermodynamic Behaviors of Molten Pool during Selective Laser Melting. Chin. J. Mech. Eng. 2020, 56, 213–219. [Google Scholar] [CrossRef]
  9. Liu, S.; Liu, J.; Chen, J.; Liu, X. Influence of surface tension on the molten pool morphology in laser melting. Int. J. Therm. Sci. 2019, 146, 106075. [Google Scholar] [CrossRef]
  10. Körner, C.; Attar, E.; Heinl, P. Mesoscopic simulation of selective beam melting processes. J. Mater. Process. Technol. 2011, 211, 978–987. [Google Scholar] [CrossRef]
  11. Russell, M.; Souto-Iglesias, A.; Zohdi, T.I. Numerical simulation of Laser Fusion Additive Manufacturing processes using the SPH method. Comput. Methods Appl. Mech. Eng. 2018, 341, 163–187. [Google Scholar] [CrossRef]
  12. Sadowski, M.; Ladani, L.; Brindley, W.; Romano, J. Optimizing quality of additively manufactured Inconel 718 using powder bed laser melting process. Addit. Manuf. 2016, 11, 60–70. [Google Scholar] [CrossRef]
  13. Promoppatum, P.; Onler, R.; Yao, S.-C. Numerical and experimental investigations of micro and macro characteristics of direct metal laser sintered Ti-6Al-4V products. J. Mater. Process. Technol. 2017, 240, 262–273. [Google Scholar] [CrossRef]
  14. Casalino, G.; Campanelli, S.L.; Contuzzi, N.; Ludovico, A.D. Experimental investigation and statistical optimization of the selective laser melting process of a maraging steel. Opt. Laser Technol. 2015, 65, 151–158. [Google Scholar] [CrossRef]
  15. Promoppatum, P.; Yao, S.-C. Analytical evaluation of defect generation for selective laser melting of metals. Int. J. Adv. Manuf. Technol. 2019, 103, 1185–1198. [Google Scholar] [CrossRef]
  16. Du, Y.; You, X.; Qiao, F.; Guo, L.; Liu, Z. A model for predicting the temperature field during selective laser melting. Results Phys. 2019, 12, 52–60. [Google Scholar] [CrossRef]
  17. Ye, J.; Khairallah, S.A.; Rubenchik, A.M.; Crumb, M.F.; Guss, G.; Belak, J.; Matthews, M.J. Energy Coupling Mechanisms and Scaling Behavior Associated with Laser Powder Bed Fusion Additive Manufacturing. Adv. Eng. Mater. 2019, 21, 1900185. [Google Scholar] [CrossRef]
  18. Rosenthal, D. Mathematical theory of heat distribution during welding and cutting. Weld. J. 1941, 20, 220–234. [Google Scholar]
  19. Tang, M.; Pistorius, P.C.; Beuth, J.L. Prediction of lack-of-fusion porosity for powder bed fusion. Addit. Manuf. 2017, 14, 39–48. [Google Scholar] [CrossRef]
  20. Gladush, G.G.; Smurov, I. Physics of Laser Materials Processing; Springer Science and Business Media LLC: Berlin/Heidelberg, Germany, 2011. [Google Scholar]
  21. Rubenchik, A.; King, W.E.; Wu, S.S. Scaling laws for the additive manufacturing. J. Mater. Process. Technol. 2018, 257, 234–243. [Google Scholar] [CrossRef]
  22. Yang, Q.; Wei, Y.; Gao, P. Research progress of metal additive manufacturing technology and its special materials. Mater. Rep. 2016, 1, 26–28. [Google Scholar]
  23. Wang, D.; Qian, Z.; Dou, W.; Yang, R. Research progress of laser selective melting forming of high temperature nickel-based alloys. Aeronaut. Manuf. Technol. 2018, 61, 49–60. [Google Scholar]
  24. Khairallah, S.A.; Martin, A.A.; Lee, J.R.; Guss, G.; Calta, N.P.; Hammons, J.A.; Nielsen, M.H.; Chaput, K.; Schwalbach, E.; Shah, M.N.; et al. Controlling interdependent meso-nanosecond dynamics and defect generation in metal 3D printing. Science 2020, 368, 660–665. [Google Scholar] [CrossRef] [PubMed]
  25. Bass, M. Lasers for Laser Materials Processing; Elsevier BV: Amsterdam, The Netherlands, 1983; Volume 3, pp. 1–14. [Google Scholar]
  26. Weirather, J.; Rozov, V.; Wille, M.; Schuler, P.; Seidel, C.; Adams, N.A.; Zaeh, M.F. A Smoothed Particle Hydrodynamics Model for Laser Beam Melting of Ni-based Alloy 718. Comput. Math. Appl. 2019, 78, 2377–2394. [Google Scholar] [CrossRef]
  27. Wang, J. Research on Laser Melting Temperature Field and Micro Melt Pool Heat Transfer of Inconel 718 Alloy; Harbin Institute of Technology: Harbin, China, 2016. [Google Scholar]
  28. Gao, W.; Zhang, Y.; Ramanujan, D.; Ramani, K.; Chen, Y.; Williams, C.B.; Wang, C.C.; Shin, Y.C.; Zhang, S.; Zavattieri, P.D. The status, challenges, and future of additive manufacturing in engineering. Comput. Des. 2015, 69, 65–89. [Google Scholar] [CrossRef]
  29. Hussein, A.; Hao, L.; Yan, C.; Everson, R. Finite element simulation of the temperature and stress fields in single layers built without-support in selective laser melting. Mater. Des. 2013, 52, 638–647. [Google Scholar] [CrossRef]
  30. Zhou, Q. Research on Calculation Method of Transient Temperature Field in Selective Laser Melting Forming Process. Master’s Thesis, Harbin Engineering University, Harbin, China, 2017. [Google Scholar]
  31. Kasperovich, G.; Haubrich, J.; Gussone, J.; Requena, G. Correlation between porosity and processing parameters in TiAl6V4 produced by selective laser melting. Mater. Des. 2016, 105, 160–170. [Google Scholar] [CrossRef] [Green Version]
  32. Hosseini, E.; Popovich, V. A review of mechanical properties of additively manufactured Inconel 718. Addit. Manuf. 2019, 30, 100877. [Google Scholar] [CrossRef]
  33. King, W.E.; Barth, H.D.; Castillo, V.M.; Gallegos, G.F.; Gibbs, J.W.; Hahn, D.E.; Kamath, C.; Rubenchik, A.M. Observation of keyhole-mode laser melting in laser powder-bed fusion additive manufacturing. J. Mater. Process. Technol. 2014, 214, 2915–2925. [Google Scholar] [CrossRef]
  34. Yadroitsev, I.; Gusarov, A.; Yadroitsava, I.; Smurov, I. Single track formation in selective laser melting of metal powders. J. Mater. Process. Technol. 2010, 210, 1624–1631. [Google Scholar] [CrossRef]
Figure 1. The relationship between electrical resistivity and temperature.
Applsci 10 07300 g001
Figure 2. Thermophysical properties for In718 [27]. (a) Specific heat, (b) thermal conductivity, (c) density.
Applsci 10 07300 g002aApplsci 10 07300 g002b
Figure 3. Melt pool temperature contour at top view and longitudinal view for In718 with a laser power of 100 w, scanning speed of 1 mm/s, laser spot radius of 50 μm and different absorptivity ((a,b) A = 0.3, (c,d) A = 0.87).
Applsci 10 07300 g003aApplsci 10 07300 g003b
Figure 4. The dimension of melt pool of In718 by selective laser melting (SLM) processing at different laser power from the experiment by Sadowski [12], the finite element (FE) modeling and the analytical solution (equation from this paper and the Rosenthal equation). (a) Depth of melt pool, (b) width of melt pool.
Applsci 10 07300 g004
Figure 5. The dimension of melt pool of In718 by SLM processing at high heat input from experiment by Sadowski [12], FE modeling and analytical solution (equation from this paper and Rosenthal equation).
Applsci 10 07300 g005
Figure 6. Melt pool depth and length of In718 by SLM processing at different scanning speed from experiment, FE modeling and analytical solution (laser power is 200 W). (a) Depth of melt pool, (b) length of melt pool.
Applsci 10 07300 g006aApplsci 10 07300 g006b
Figure 7. The calculation of Equation (15) for In718 (H is 100 μm and L is 40 μm).
Applsci 10 07300 g007
Figure 8. The effect of laser power and scanning speed on defects of In718 by SLM.
Applsci 10 07300 g008
Publisher’s Note: MDPI stays neutral with regard to jurisdictional claims in published maps and institutional affiliations.

