Essential Oil Quality and Purity Evaluation via FT-IR Spectroscopy and Pattern Recognition Techniques

 ,
, 
Abstract
1. Introduction
2. Materials and Methods
2.1. Samples
2.2. ATR-FTIR-Spectroscopy
2.3. Principal Component Analysis
3. Results
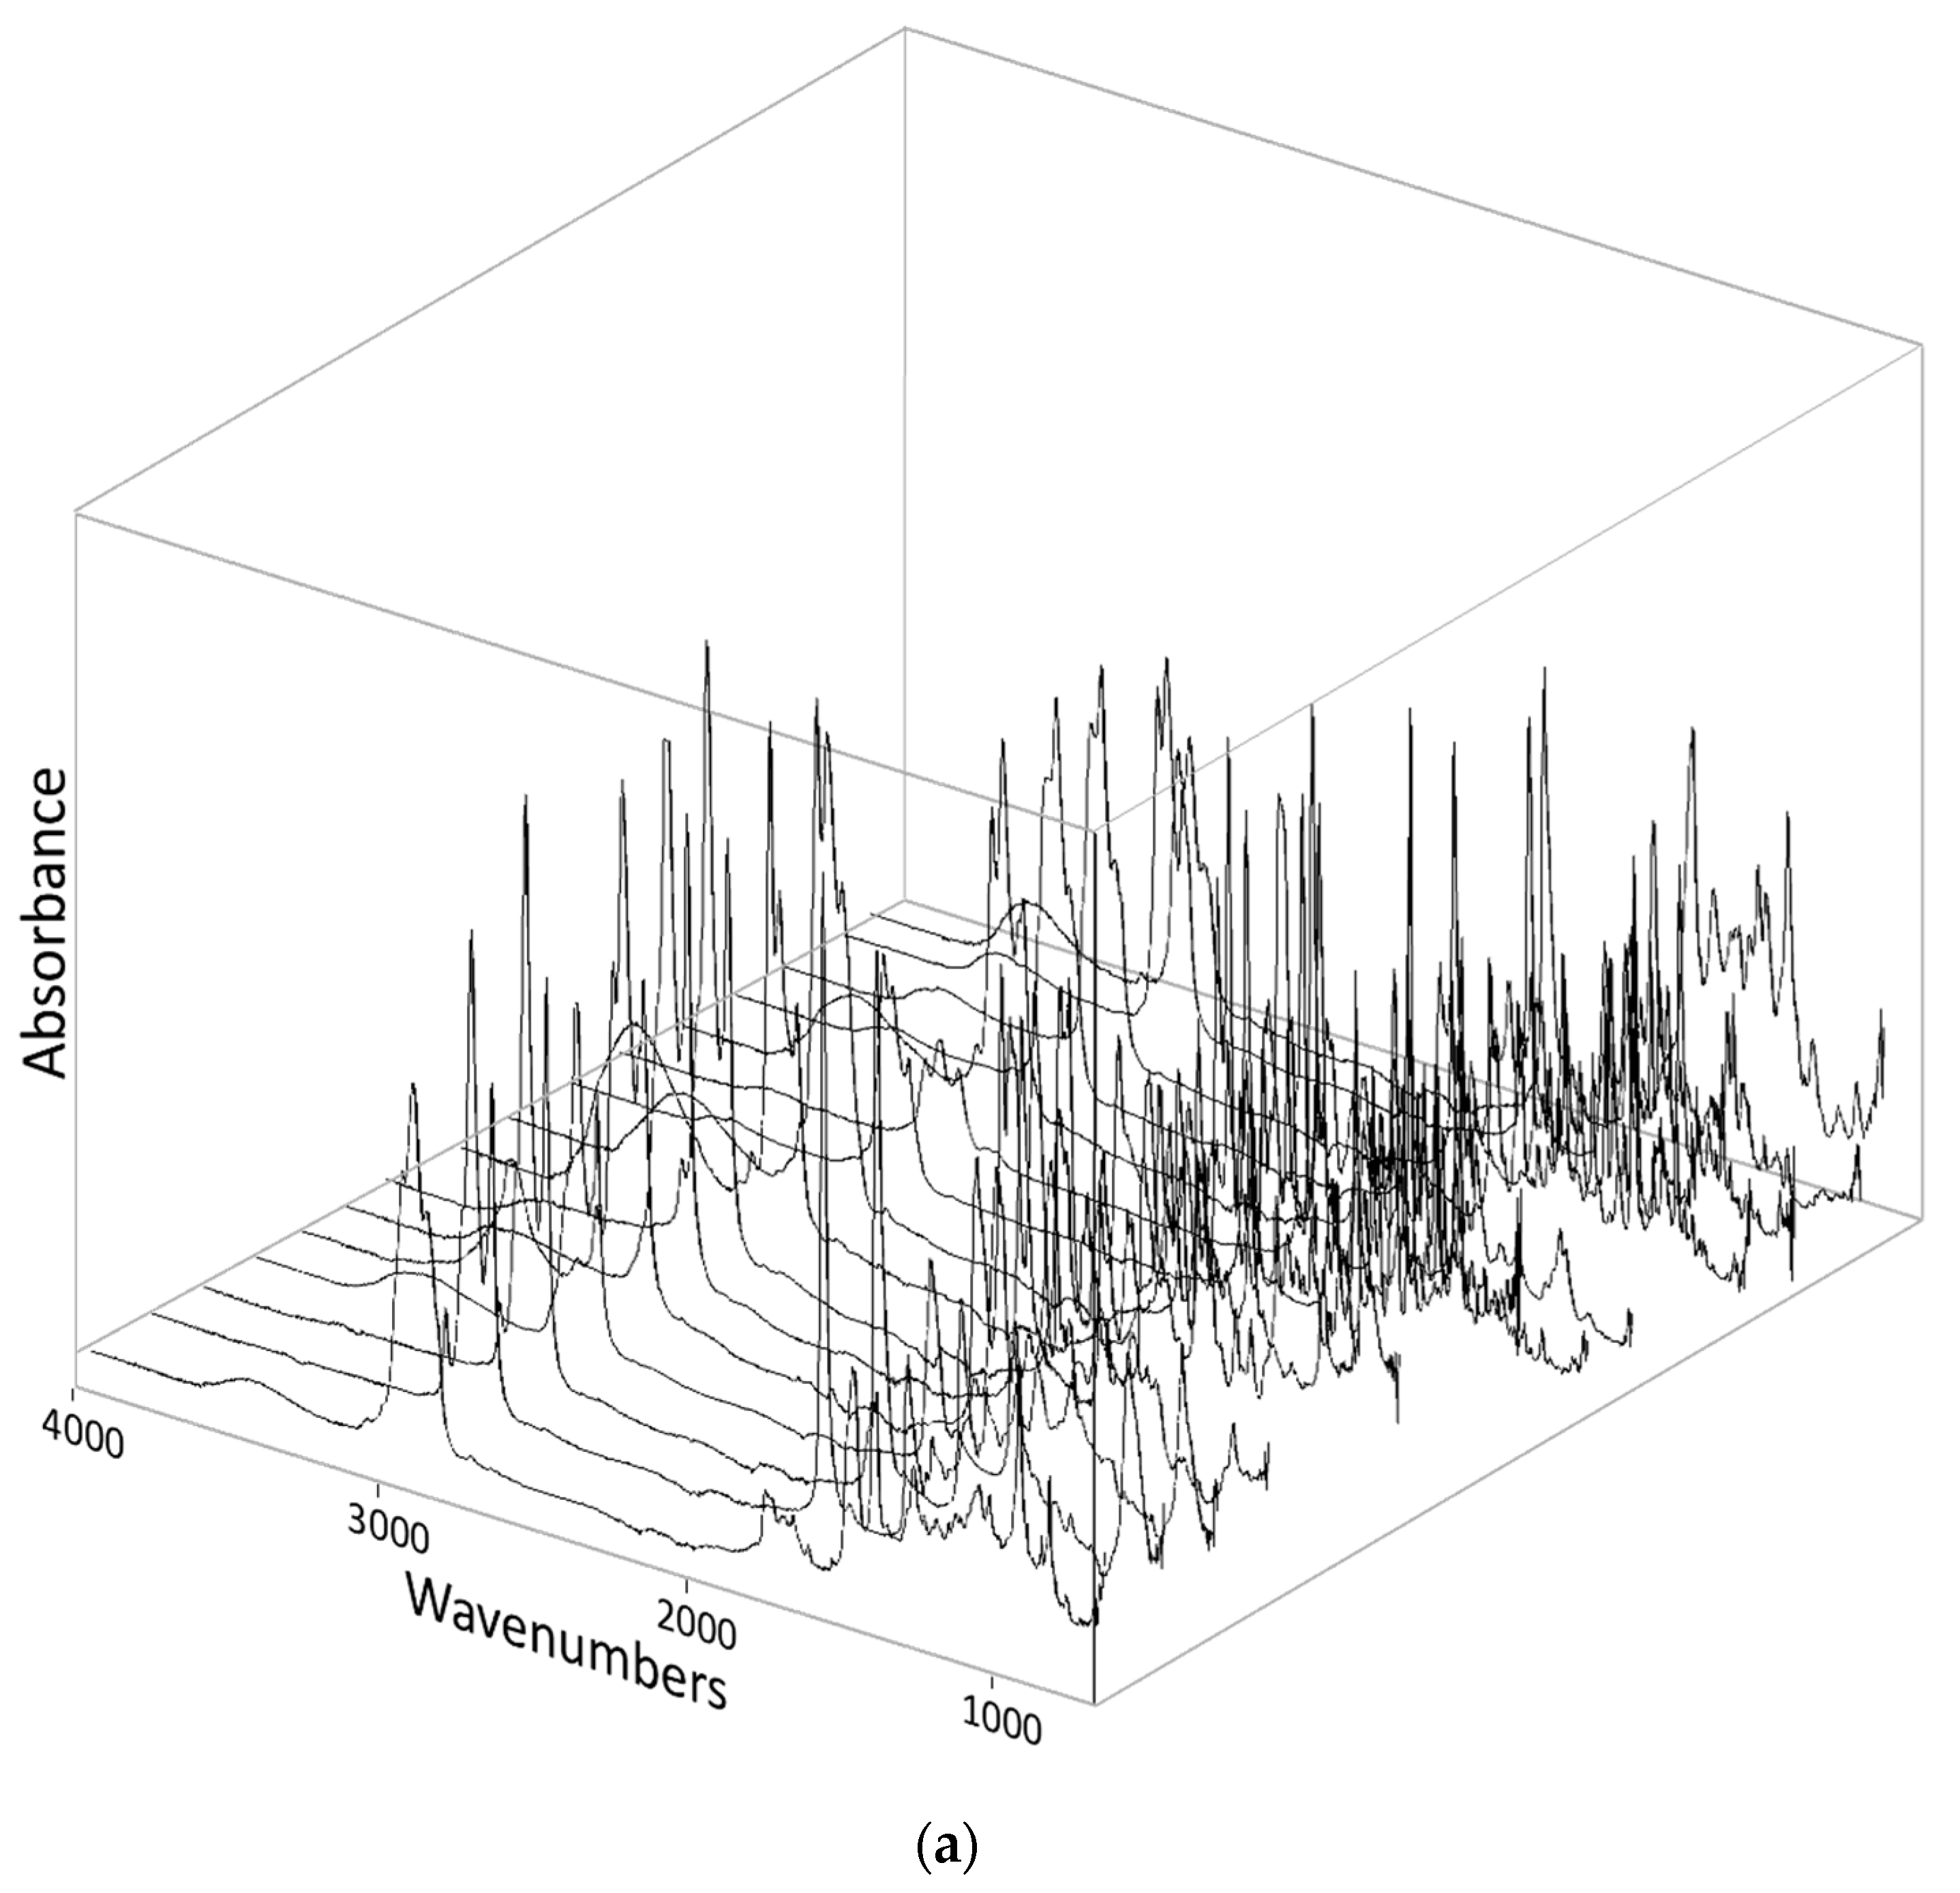
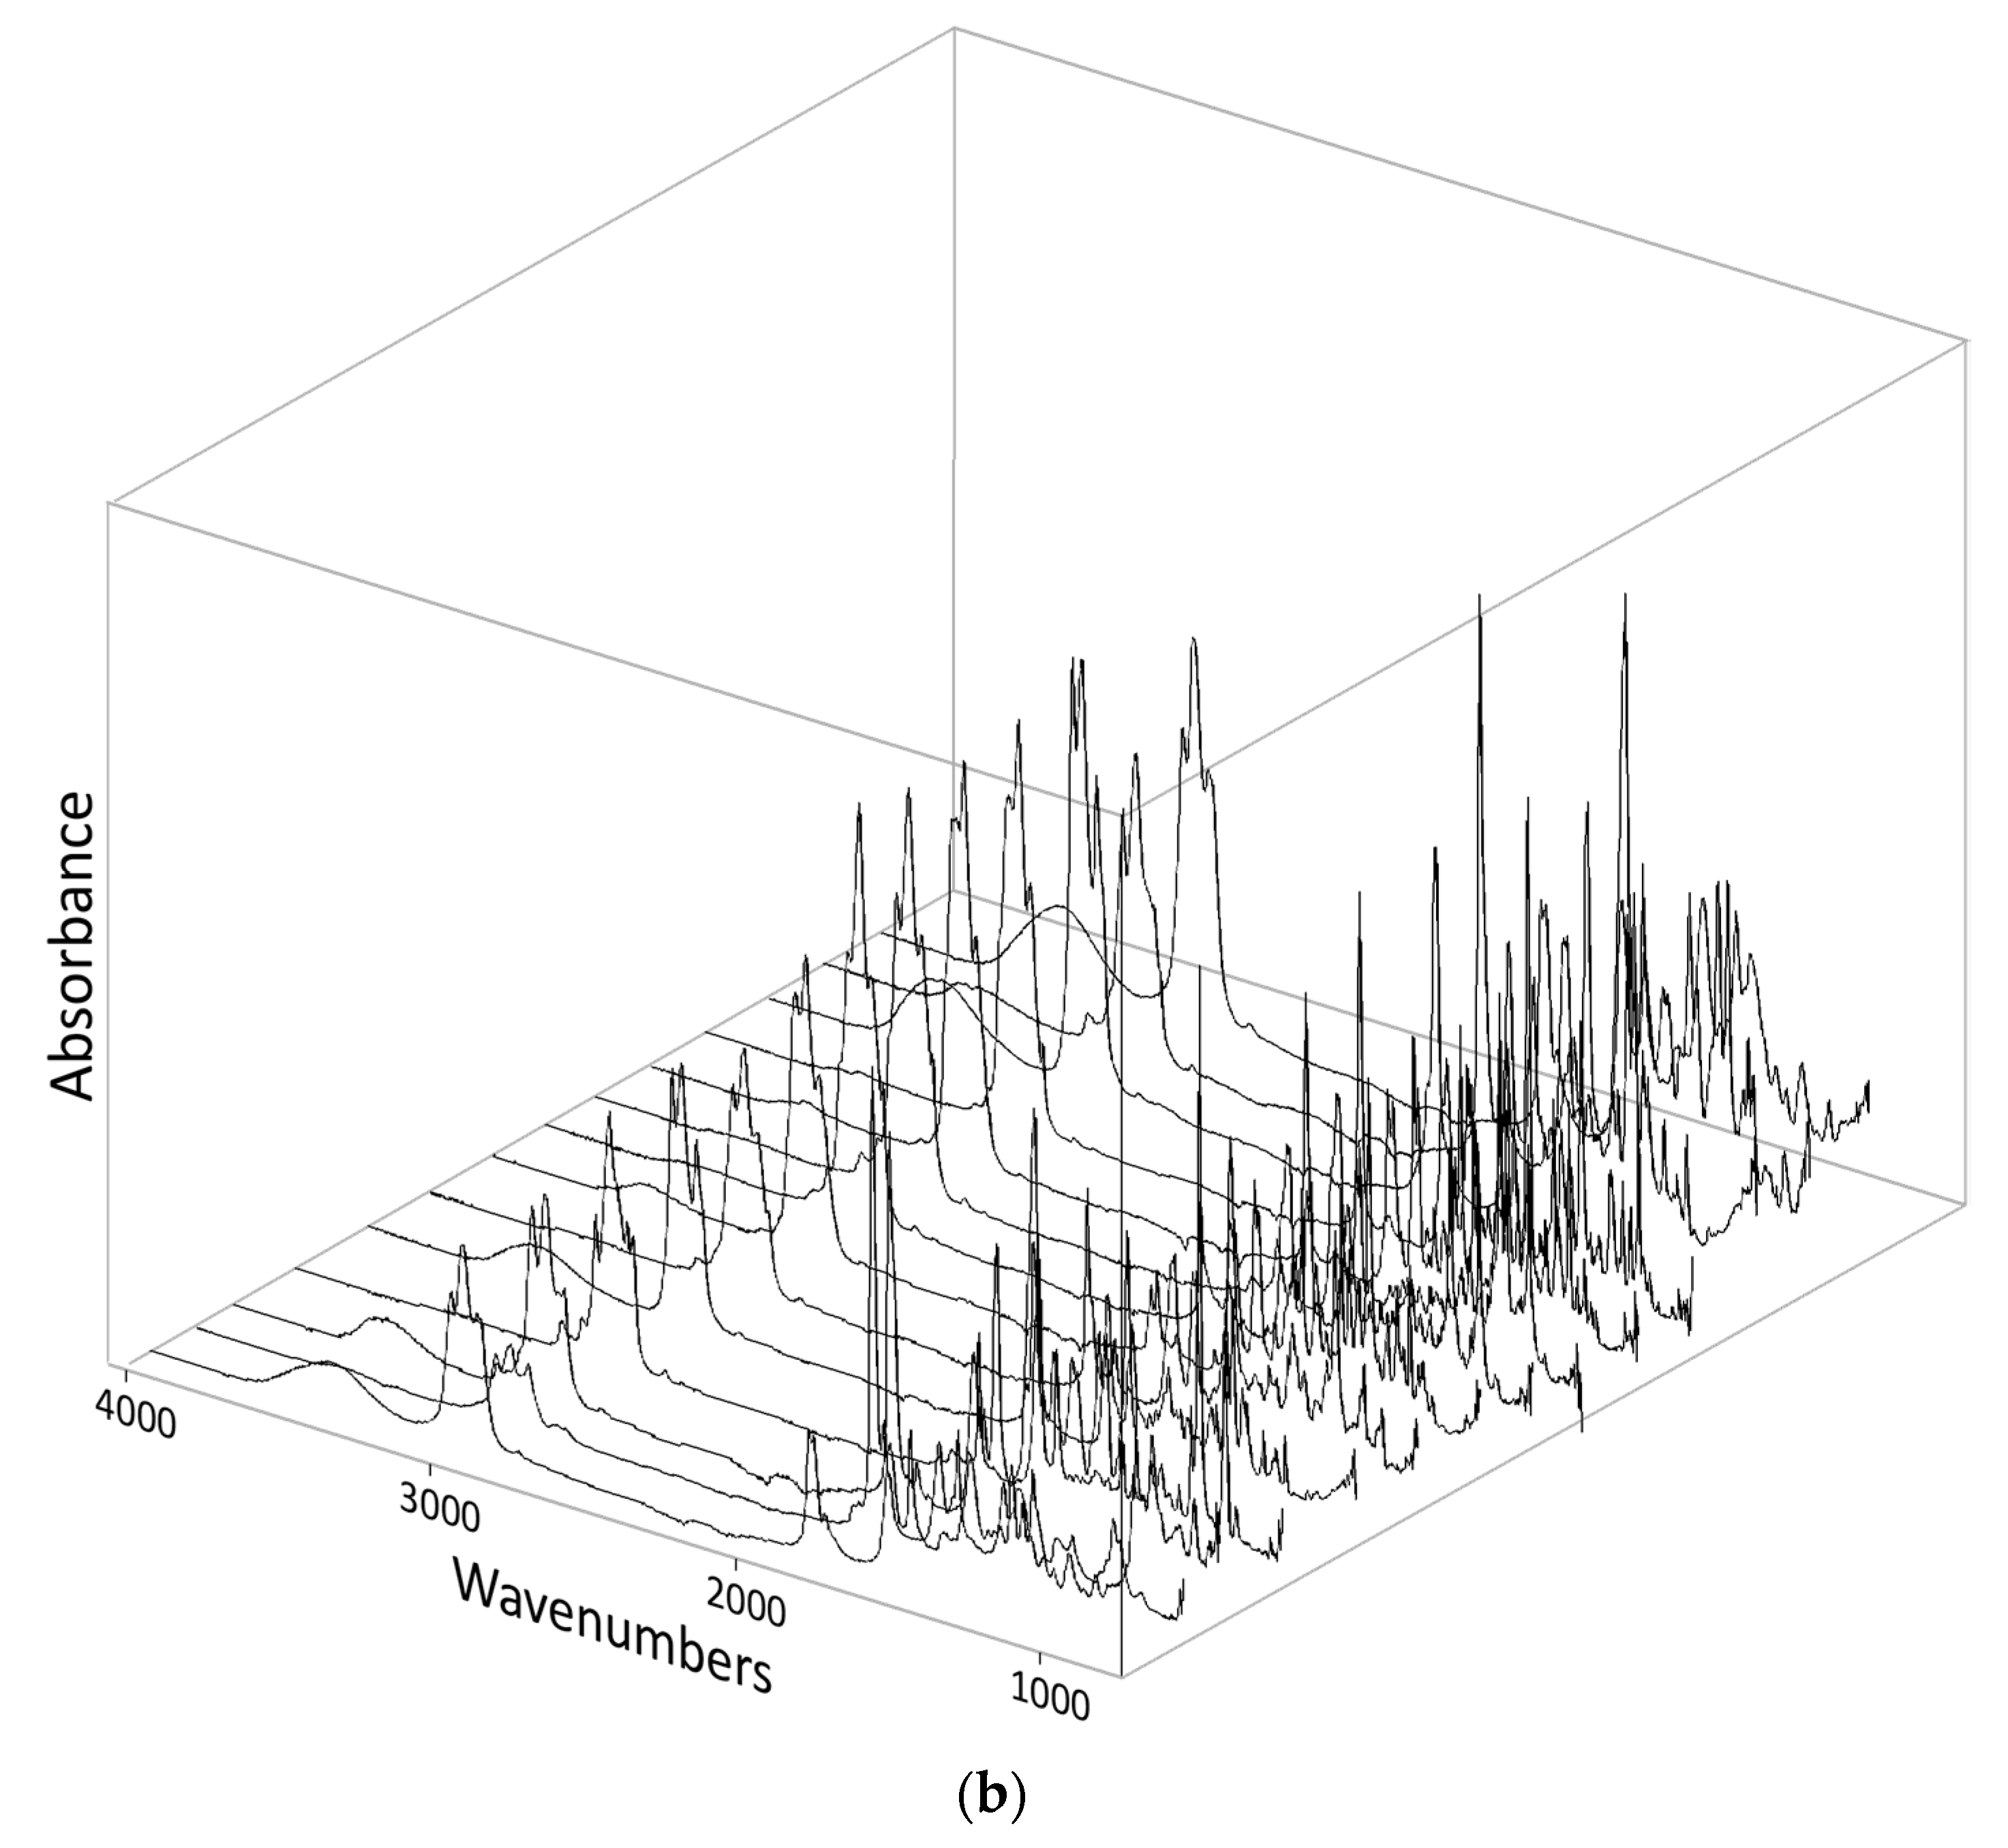
3.1. ATR-FTIR Spectrometry
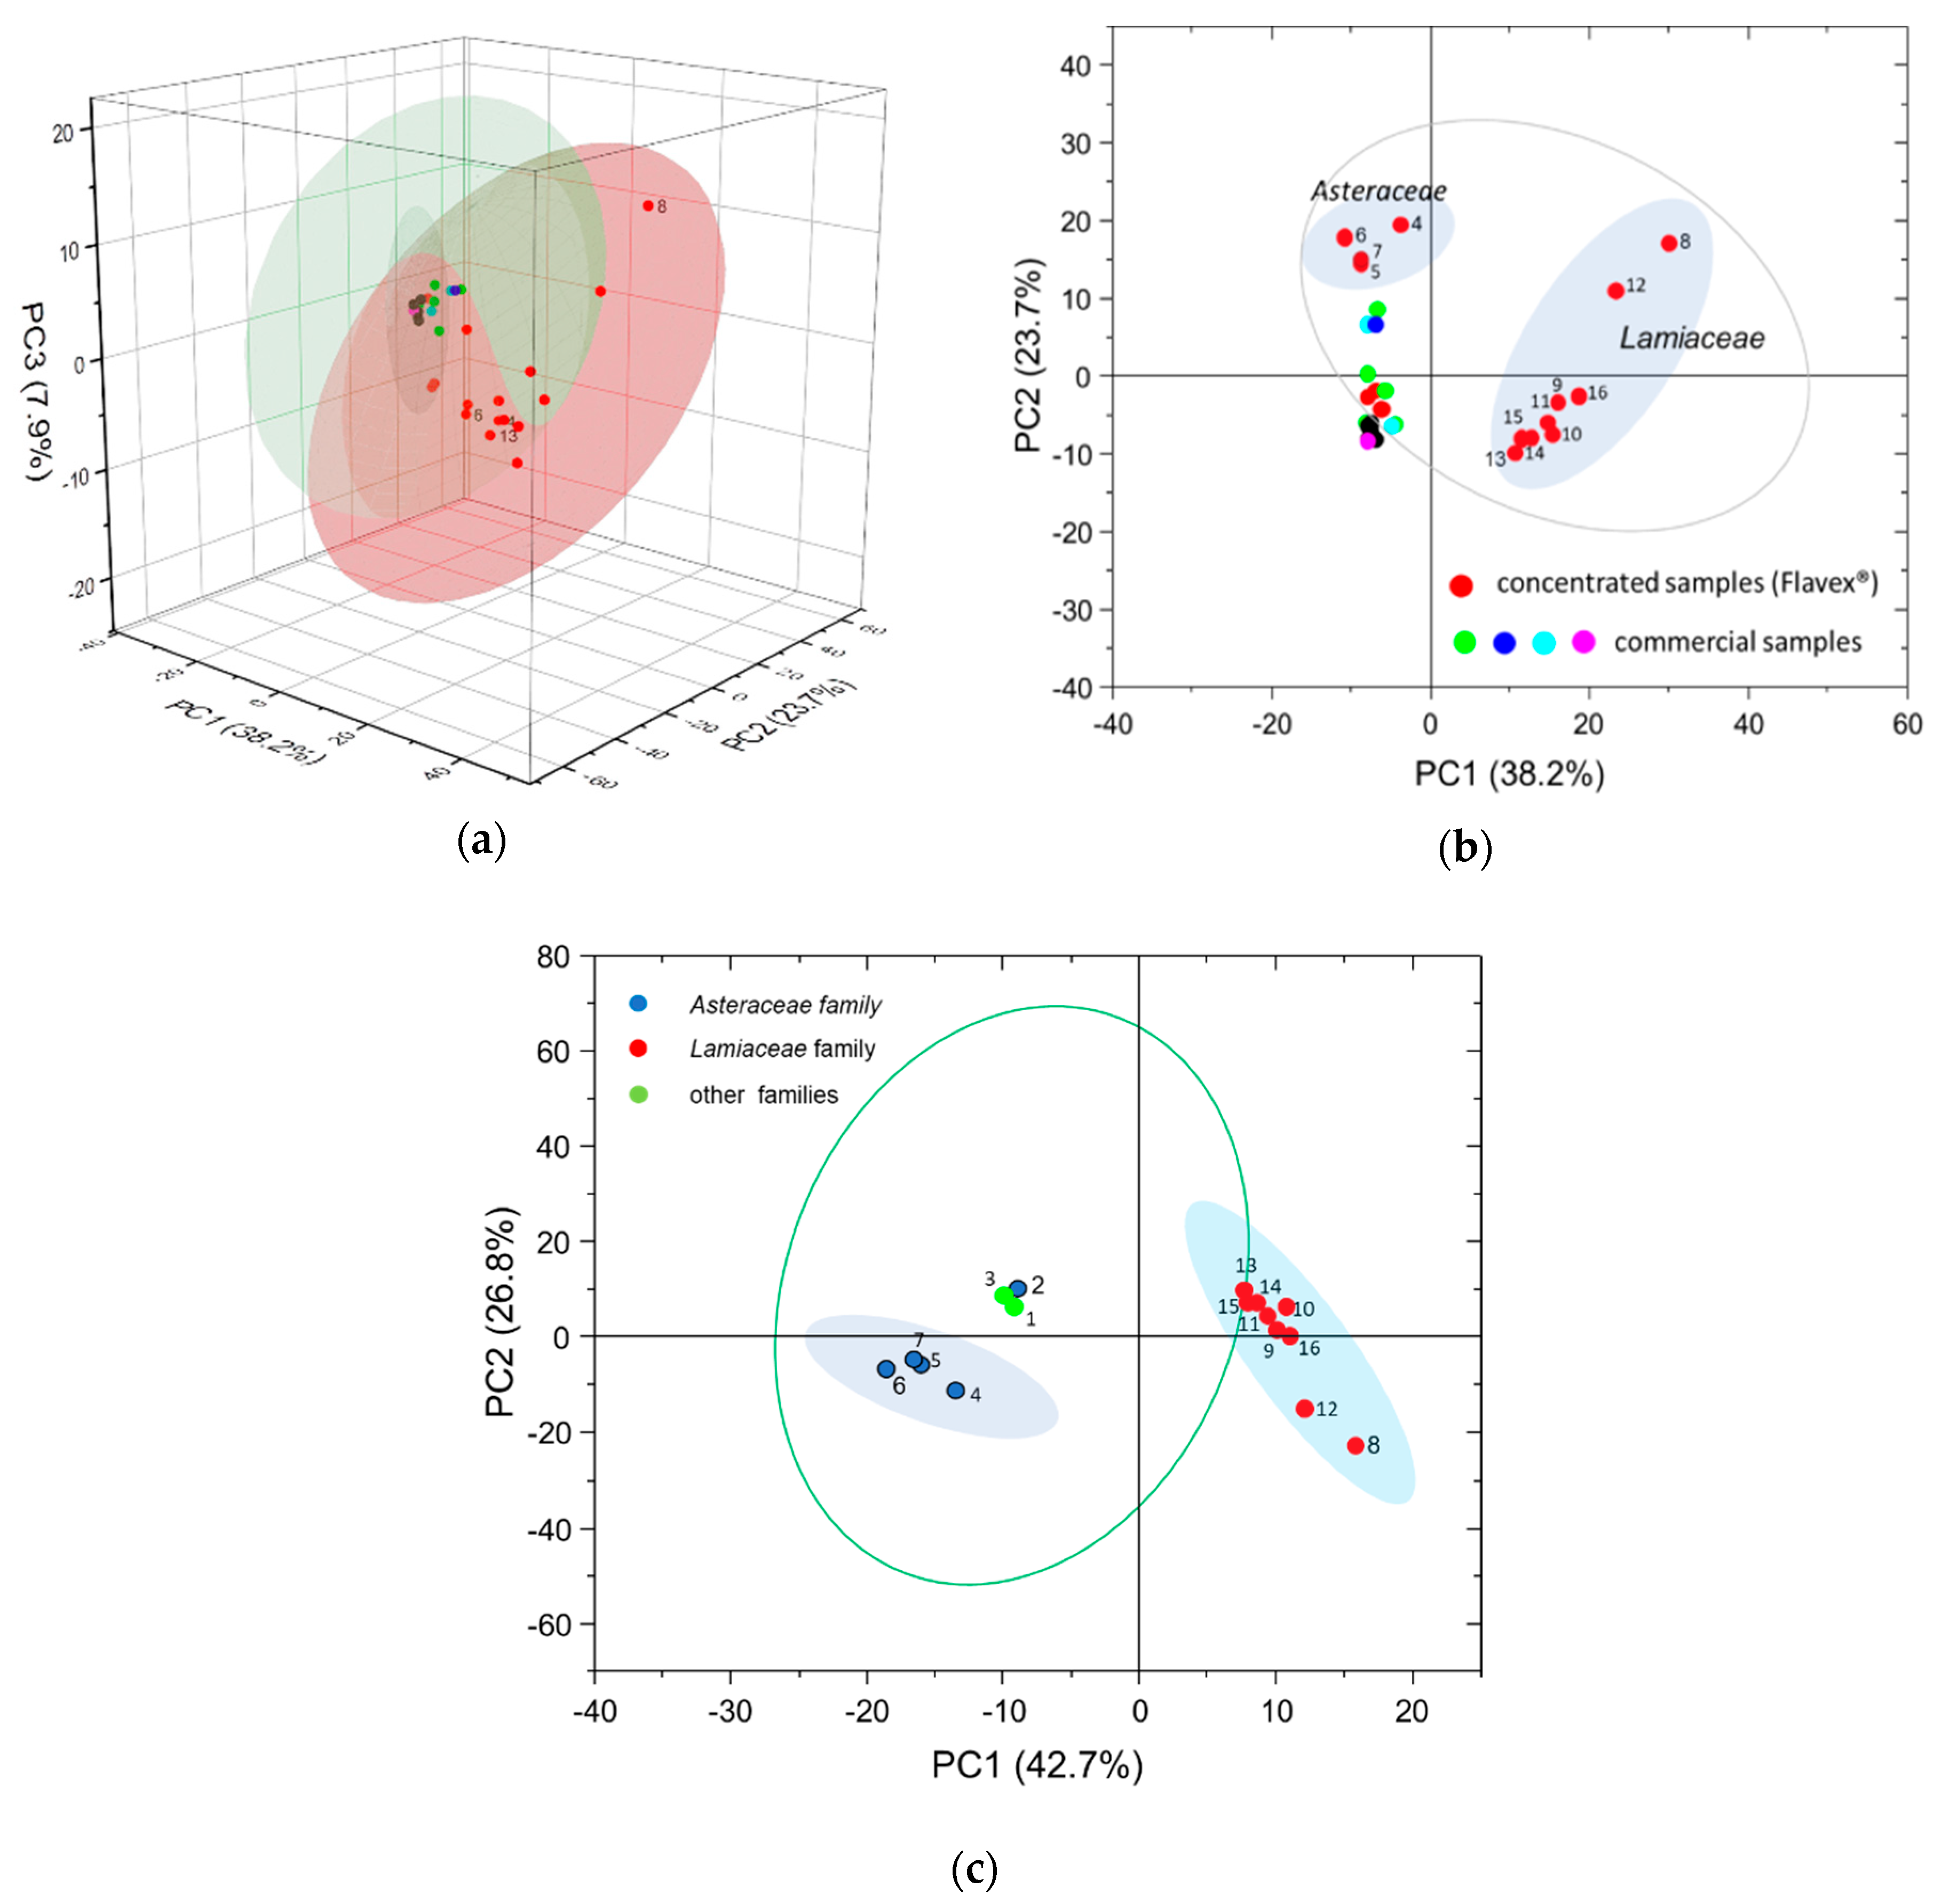
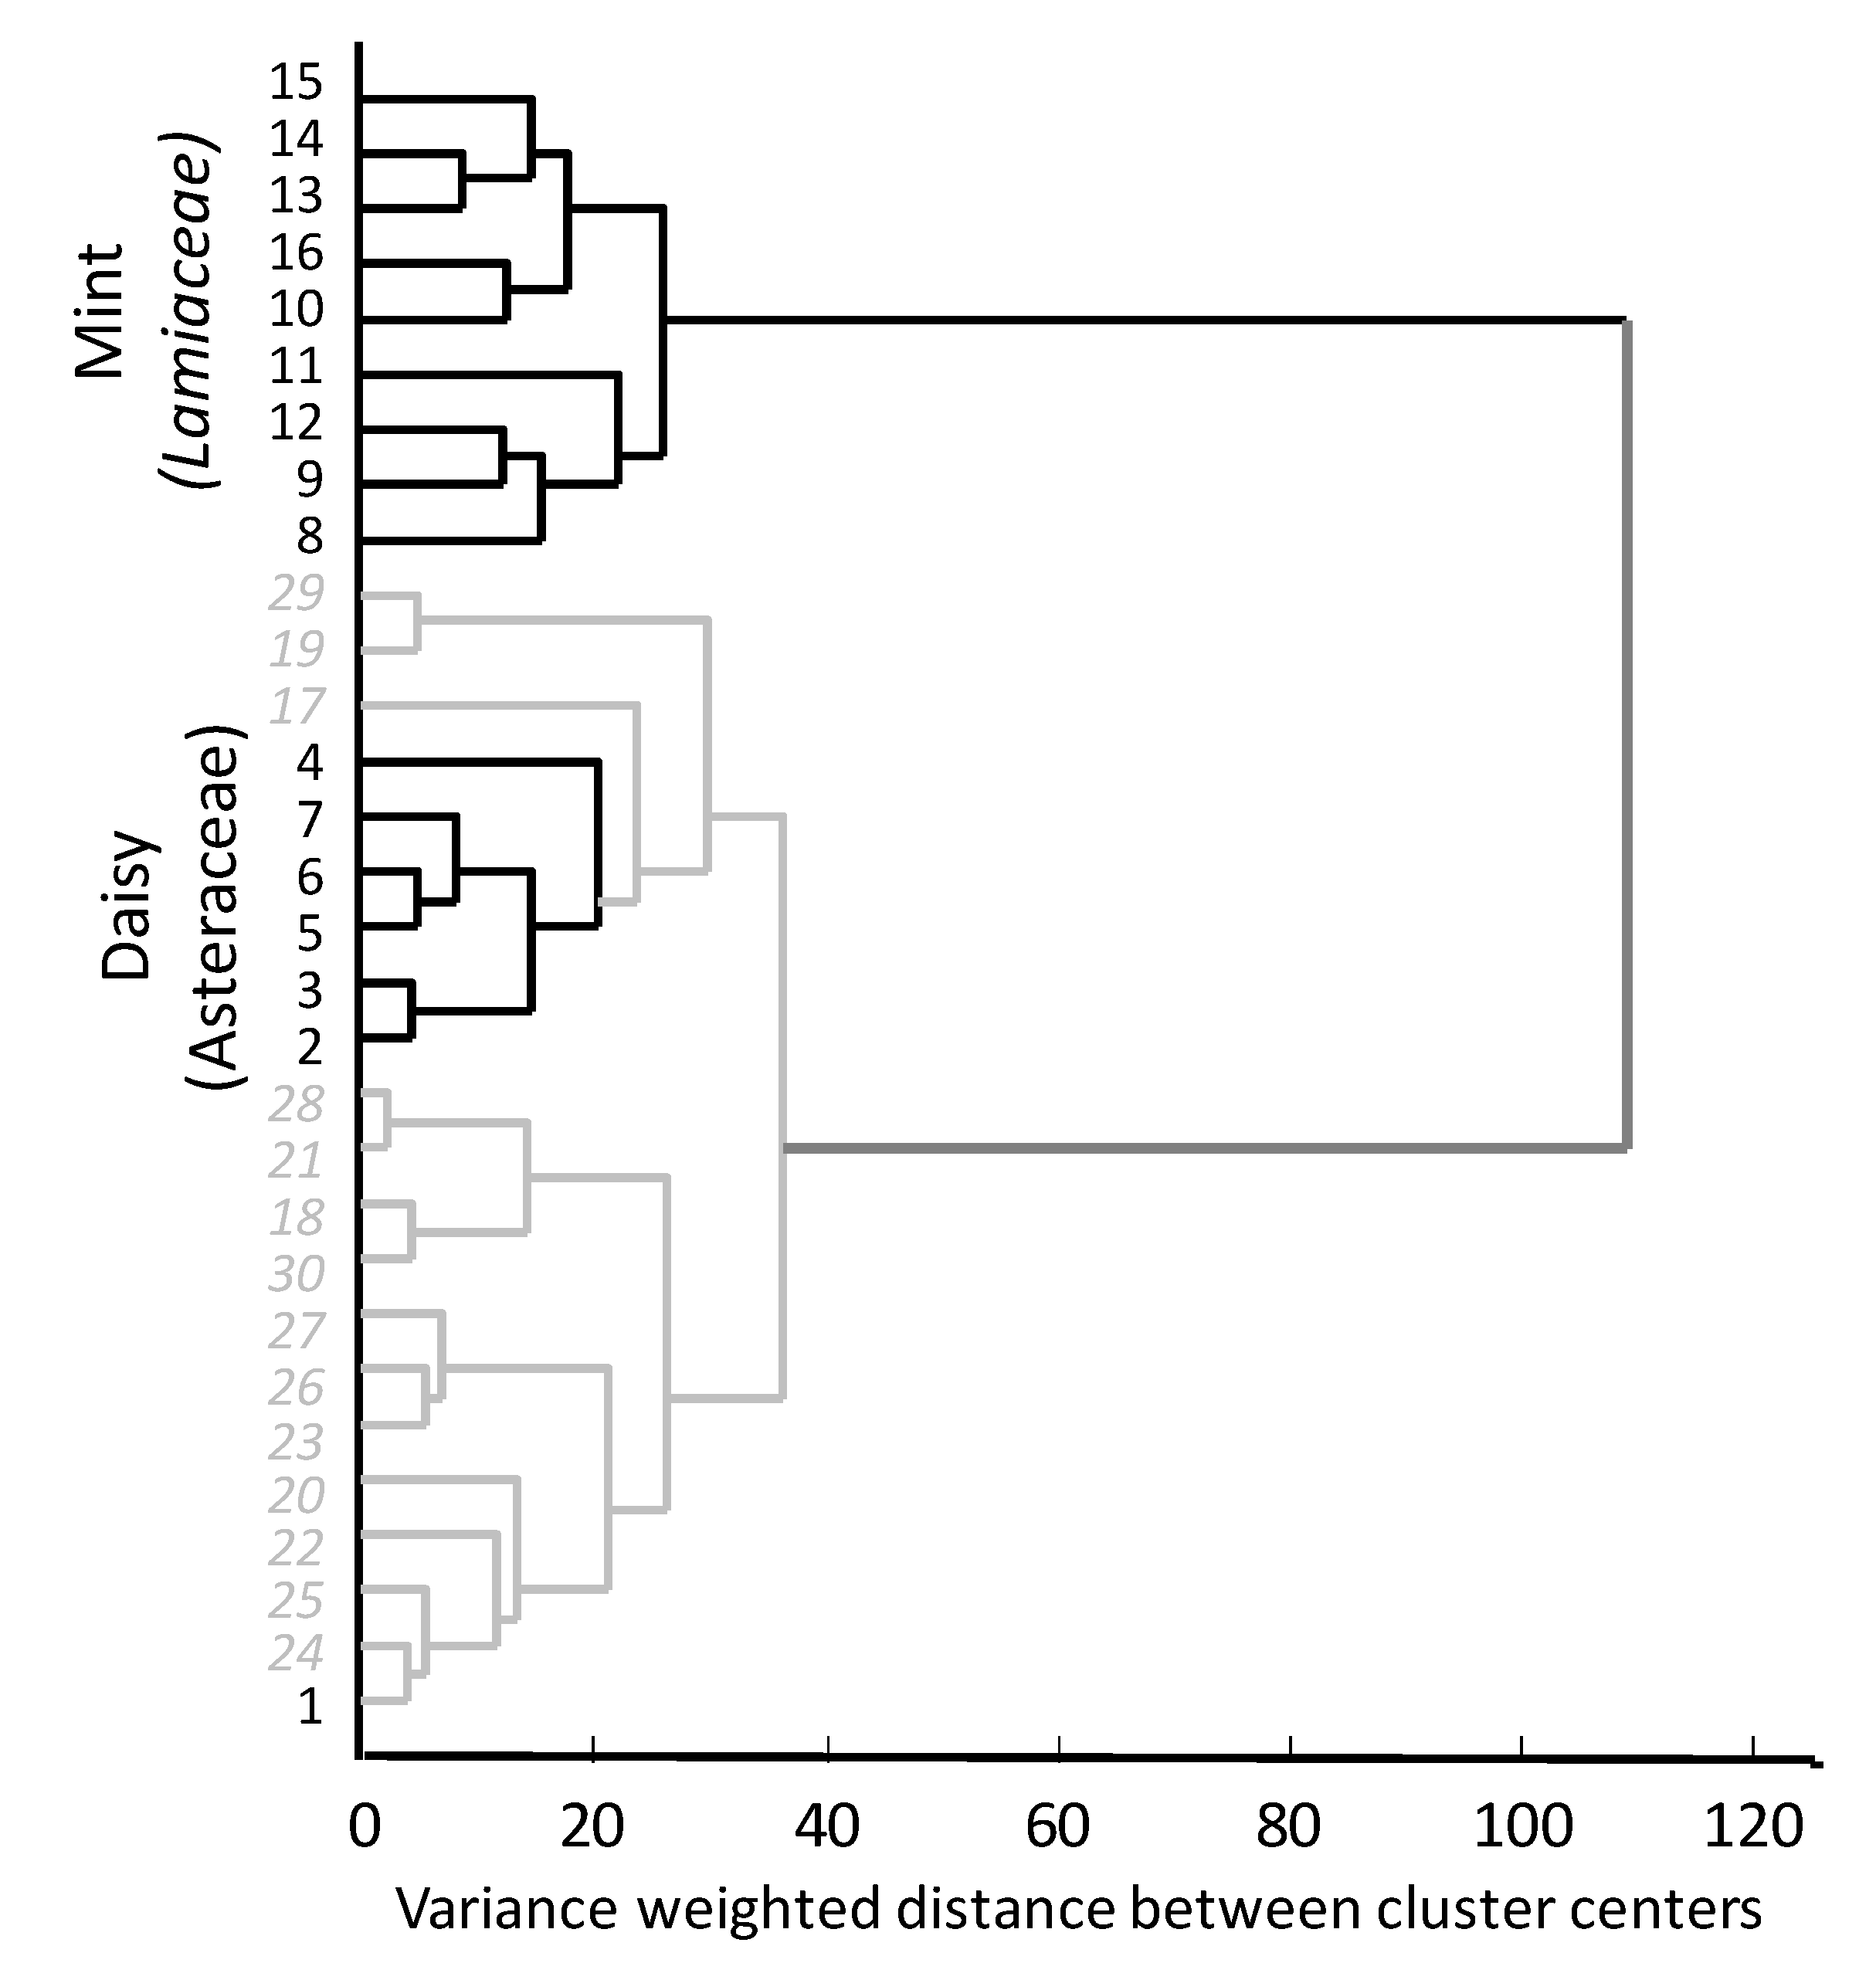
3.2. Principal Components Analysis and Cluster Analysis
4. Discussion
5. Conclusions
Author Contributions
Funding
Acknowledgments
Conflicts of Interest
References
- Agatonovic-Kustrin, S.; Chan, C.K.Y.; Gegechkori, V.; Morton, D.W. Models for skin and brain penetration of major components from essential oils used in aromatherapy for dementia patients. J. Biomol. Struct. Dyn. 2020, 38, 2402–2411. [Google Scholar] [CrossRef] [PubMed]
- Agatonovic-Kustrin, S.; Kustrin, E.; Gegechkori, V.; Morton, D.W. Anxiolytic Terpenoids and Aromatherapy for Anxiety and Depression. In Reviews on New Drug Targets in Age-Related Disorders; Guest, P.C., Ed.; Springer: Cham, Switzerland, 2020; Volume 1260, pp. 283–296. [Google Scholar]
- Agatonovic-Kustrin, S.; Kustrin, E.; Morton, D.W. Essential oils and functional herbs for healthy aging. Neural Regen. Res. 2019, 14, 441–445. [Google Scholar] [CrossRef] [PubMed]
- Bounaas, K.; Bouzidi, N.; Daghbouche, Y.; Garrigues, S.; de la Guardia, M.; El Hattab, M. Essential oil counterfeit identification through middle infrared spectroscopy. Microchem. J. 2018, 139, 347–356. [Google Scholar] [CrossRef]
- FDA. Economically Motivated Adulteration; Public Meeting; Request for Comment. Fed. Regist. 2009, 74, 15497–15499. [Google Scholar]
- Blomberg, J.; Schoenmakers, P.J.; Brinkman, U.A.T. Gas chromatographic methods for oil analysis. J. Chomatogr. A 2002, 972, 137–173. [Google Scholar] [CrossRef]
- Lim Ah Tock, M.J.; Kamatou, G.P.P.; Combrinck, S.; Sandasi, M.; Viljoen, A.M. A chemometric assessment of essential oil variation of three Salvia species indigenous to South Africa. Phytochemistry 2020, 172, 112249. [Google Scholar] [CrossRef]
- Morlock, G.E.; Meyer, S.; Zimmermann, B.F.; Roussel, J.-M. High-performance thin-layer chromatography analysis of steviol glycosides in Stevia formulations and sugar-free food products, and benchmarking with (ultra) high-performance liquid chromatography. J. Chromatogr. A 2014, 1350, 102–111. [Google Scholar] [CrossRef]
- Salghi, R.; Armbruster, W.; Schwack, W. Detection of argan oil adulteration with vegetable oils by high-performance liquid chromatography–evaporative light scattering detection. Food Chem. 2014, 153, 387–392. [Google Scholar] [CrossRef]
- Tan, Z.; Reyes-Suarez, E.; Indrasena, W.; Kralovec, J.A. Novel approach to study fish oil oxidation using 1H nuclear magnetic resonance spectroscopy. J. Funct. Foods 2017, 36, 310–316. [Google Scholar] [CrossRef]
- Apetrei, I.M.; Apetrei, C. Detection of virgin olive oil adulteration using a voltammetric e-tongue. Comput. Electron. Agric. 2014, 108, 148–154. [Google Scholar] [CrossRef]
- Nowak, A.; Kalemba, D.; Piotrowska, M.; Czyźowska, A. Effects of thyme (Thymus vulgaris L.) and rosemary (Rosmarinus officinalis L.) essential oils on growth of Brochothrix thermosphacta. Afr. J. Microbiol. Res. 2013, 7, 3396–3404. [Google Scholar]
- Sun, D.-W. Infrared Spectroscopy for Food Quality Analysis and Control; Academic Press: Cambridge, MA, USA, 2009. [Google Scholar]
- Baranska, M.; Schulz, H.; Reitzenstein, S.; Uhlemann, U.; Strehle, M.A.; Krüger, H.; Quilitzsch, R.; Foley, W.; Popp, J. Vibrational spectroscopic studies to acquire a quality control method of Eucalyptus essential oils. Biopolymers 2005, 78, 237–248. [Google Scholar] [CrossRef]
- Coates, J. Interpretation of Infrared Spectra, a Practical Approach. In Encyclopedia of Analytical Chemistry: Applications, Theory and Instrumentation; John Wiley & Sons, Ltd.: Chichester, NY, USA, 2006. [Google Scholar]
- Sasidharan, S.; Chen, Y.; Saravanan, D.; Sundram, K.M.; Latha, L.Y. Extraction, isolation and characterization of bioactive compounds from plants’ extracts. Afr. J. Tradit. Complement. Altern. Med. 2011, 8, 1–10. [Google Scholar] [CrossRef] [PubMed]
- Woodcock, T.; Downey, G.; Kelly, J.D.; O’Donnell, C. Geographical classification of honey samples by near-infrared spectroscopy: A feasibility study. J. Agric. Food Chem. 2007, 55, 9128–9134. [Google Scholar] [CrossRef] [PubMed]
- Agatonovic-Kustrin, S.; Milojković-Opsenica, D.; Morton, D.W.; Ristivojević, P. Chemometric characterization of wines according to their HPTLC fingerprints. Eur. Food Res. Technol. 2017, 243, 659–667. [Google Scholar] [CrossRef]
- Agatonovic-Kustrin, S.; Morton, D.W.; Ristivojević, P. Assessment of antioxidant activity in Victorian marine algal extracts using high performance thin-layer chromatography and multivariate analysis. J. Chomatogr. A 2016, 1468, 228–235. [Google Scholar] [CrossRef]
- Joudi, L.; Bibalani, G.H. Exploration of medicinal species of Fabaceae, Lamiaceae and Asteraceae families in Ilkhji region, eastern Azerbaijan Province (Northwestern Iran). J. Med. Plants Res. 2010, 4, 1081–1084. [Google Scholar]
- García-Risco, M.R.; Mouhid, L.; Salas-Pérez, L.; López-Padilla, A.; Santoyo, S.; Jaime, L.; de Molina, A.R.; Reglero, G.; Fornari, T. Biological activities of Asteraceae (Achillea millefolium and Calendula officinalis) and Lamiaceae (Melissa officinalis and Origanum majorana) plant extracts. Plant Foods Hum. Nutr. 2017, 72, 96–102. [Google Scholar] [CrossRef] [PubMed]
- Rummens, F.H.A. A Study in Monoterpene Chemistry by Physical Methods. Ph.D. Thesis, Technische Hogeschool Eindhoven, Eindhoven, The Netherlands, 1963. [Google Scholar]
- Oliveira, R.N.; Mancini, M.C.; Oliveira, F.C.S.d.; Passos, T.M.; Quilty, B.; Thiré, R.M.d.S.M.; McGuinness, G.B. FTIR analysis and quantification of phenols and flavonoids of five commercially available plants extracts used in wound healing. Matéria (Rio de Janeiro) 2016, 21, 767–779. [Google Scholar] [CrossRef]
- Stashenko, E.E.; Martínez, J.R. Sampling flower scent for chromatographic analysis. J. Sep. Sci. 2008, 31, 2022–2031. [Google Scholar] [CrossRef]
- Gudi, G.; Krahmer, A.; Kruger, H.; Schulz, H. Attenuated Total Reflectance-Fourier Transform Infrared Spectroscopy on intact dried Leaves of sage (Salvia officinalis L.): Accelerated chemotaxonomic discrimination and analysis of essential oil composition. J. Agric. Food Chem. 2015, 63, 8743–8750. [Google Scholar] [CrossRef]
- Da Costa, S.B.; Duarte, C.; Bourbon, A.I.; Pinheiro, A.C.; Serra, A.T.; Martins, M.M.; Januário, M.I.N.; Vicente, A.A.; Delgadillo, I.; Duarte, C. Effect of the matrix system in the delivery and in vitro bioactivity of microencapsulated Oregano essential oil. J. Food Eng. 2012, 110, 190–199. [Google Scholar] [CrossRef]
- Valderrama, A.C.S.; De, G.C.R. Traceability of active compounds of essential oils in antimicrobial food packaging using a chemometric method by ATR-FTIR. Am. J. Anal. Chem. 2017, 8, 80292. [Google Scholar] [CrossRef]
- Stanojevic, L.P.; Marjanovic-Balaban, Z.R.; Kalaba, V.D.; Stanojevic, J.S.; Cvetkovic, D.J. Chemical composition, antioxidant and antimicrobial activity of chamomile flowers essential oil (Matricaria chamomilla L.). J. Essent. Oil Bear. Plants 2016, 19, 2017–2028. [Google Scholar] [CrossRef]
- Bendini, A.; Cerretani, L.; Di Virgilio, F.; Belloni, P.; Bonoli-Carbognin, M.; Lercker, G. Preliminary evaluation of the application of the FTIR spectroscopy to control the geographic origin and quality of virgin olive oils. J. Food Qual. 2007, 30, 424–437. [Google Scholar] [CrossRef]


| Sample No | Extract | Species | Family |
|---|---|---|---|
| 1 | Frankincense carteri resin extract | Boswellia carteri | Burseraceae |
| 2 | Evening primrose seed extract | Oenothera biennis | Primulaceae |
| 3 | Arnica flower extract | Arnica montana | Asteraceae |
| 4 | Echinacea root extract | Echinacea purpurea | Asteraceae |
| 5 | Marigold flower extract | Calendula officinalis | Asteraceae |
| 6 | Tagetes flower extract | Tagetes erecta/Tagetes patula | Asteraceae |
| 7 | Chamomile flowers and flowering shoots extract | Chamomilla recutita | Asteraceae |
| 8 | Oregano phenol type leaf extract | Origanum vulgare | Lamiaceae |
| 9 | Oregano terpineol type leaf extract | Origanum vulgare | Lamiaceae |
| 10 | Sage leaf extract | Salvia officinalis | Lamiaceae |
| 11 | Lemon myrtle leaf extract | Backhousia citriodora | Lamiaceae |
| 12 | Thyme leaf extract | Thymus vulgaris | Lamiaceae |
| 13 | Rosemary extract, cineole type, and leaf extract | Rosmarinus officinalis | Lamiaceae |
| 14 | Rosemary plus, leaf extract | Rosmarinus officinalis | Lamiaceae |
| 15 | Peppermint leaf extract | Mentha piperita | Lamiaceae |
| 16 | Lavender flower extract | Lavandula angustifolia | Lamiaceae |
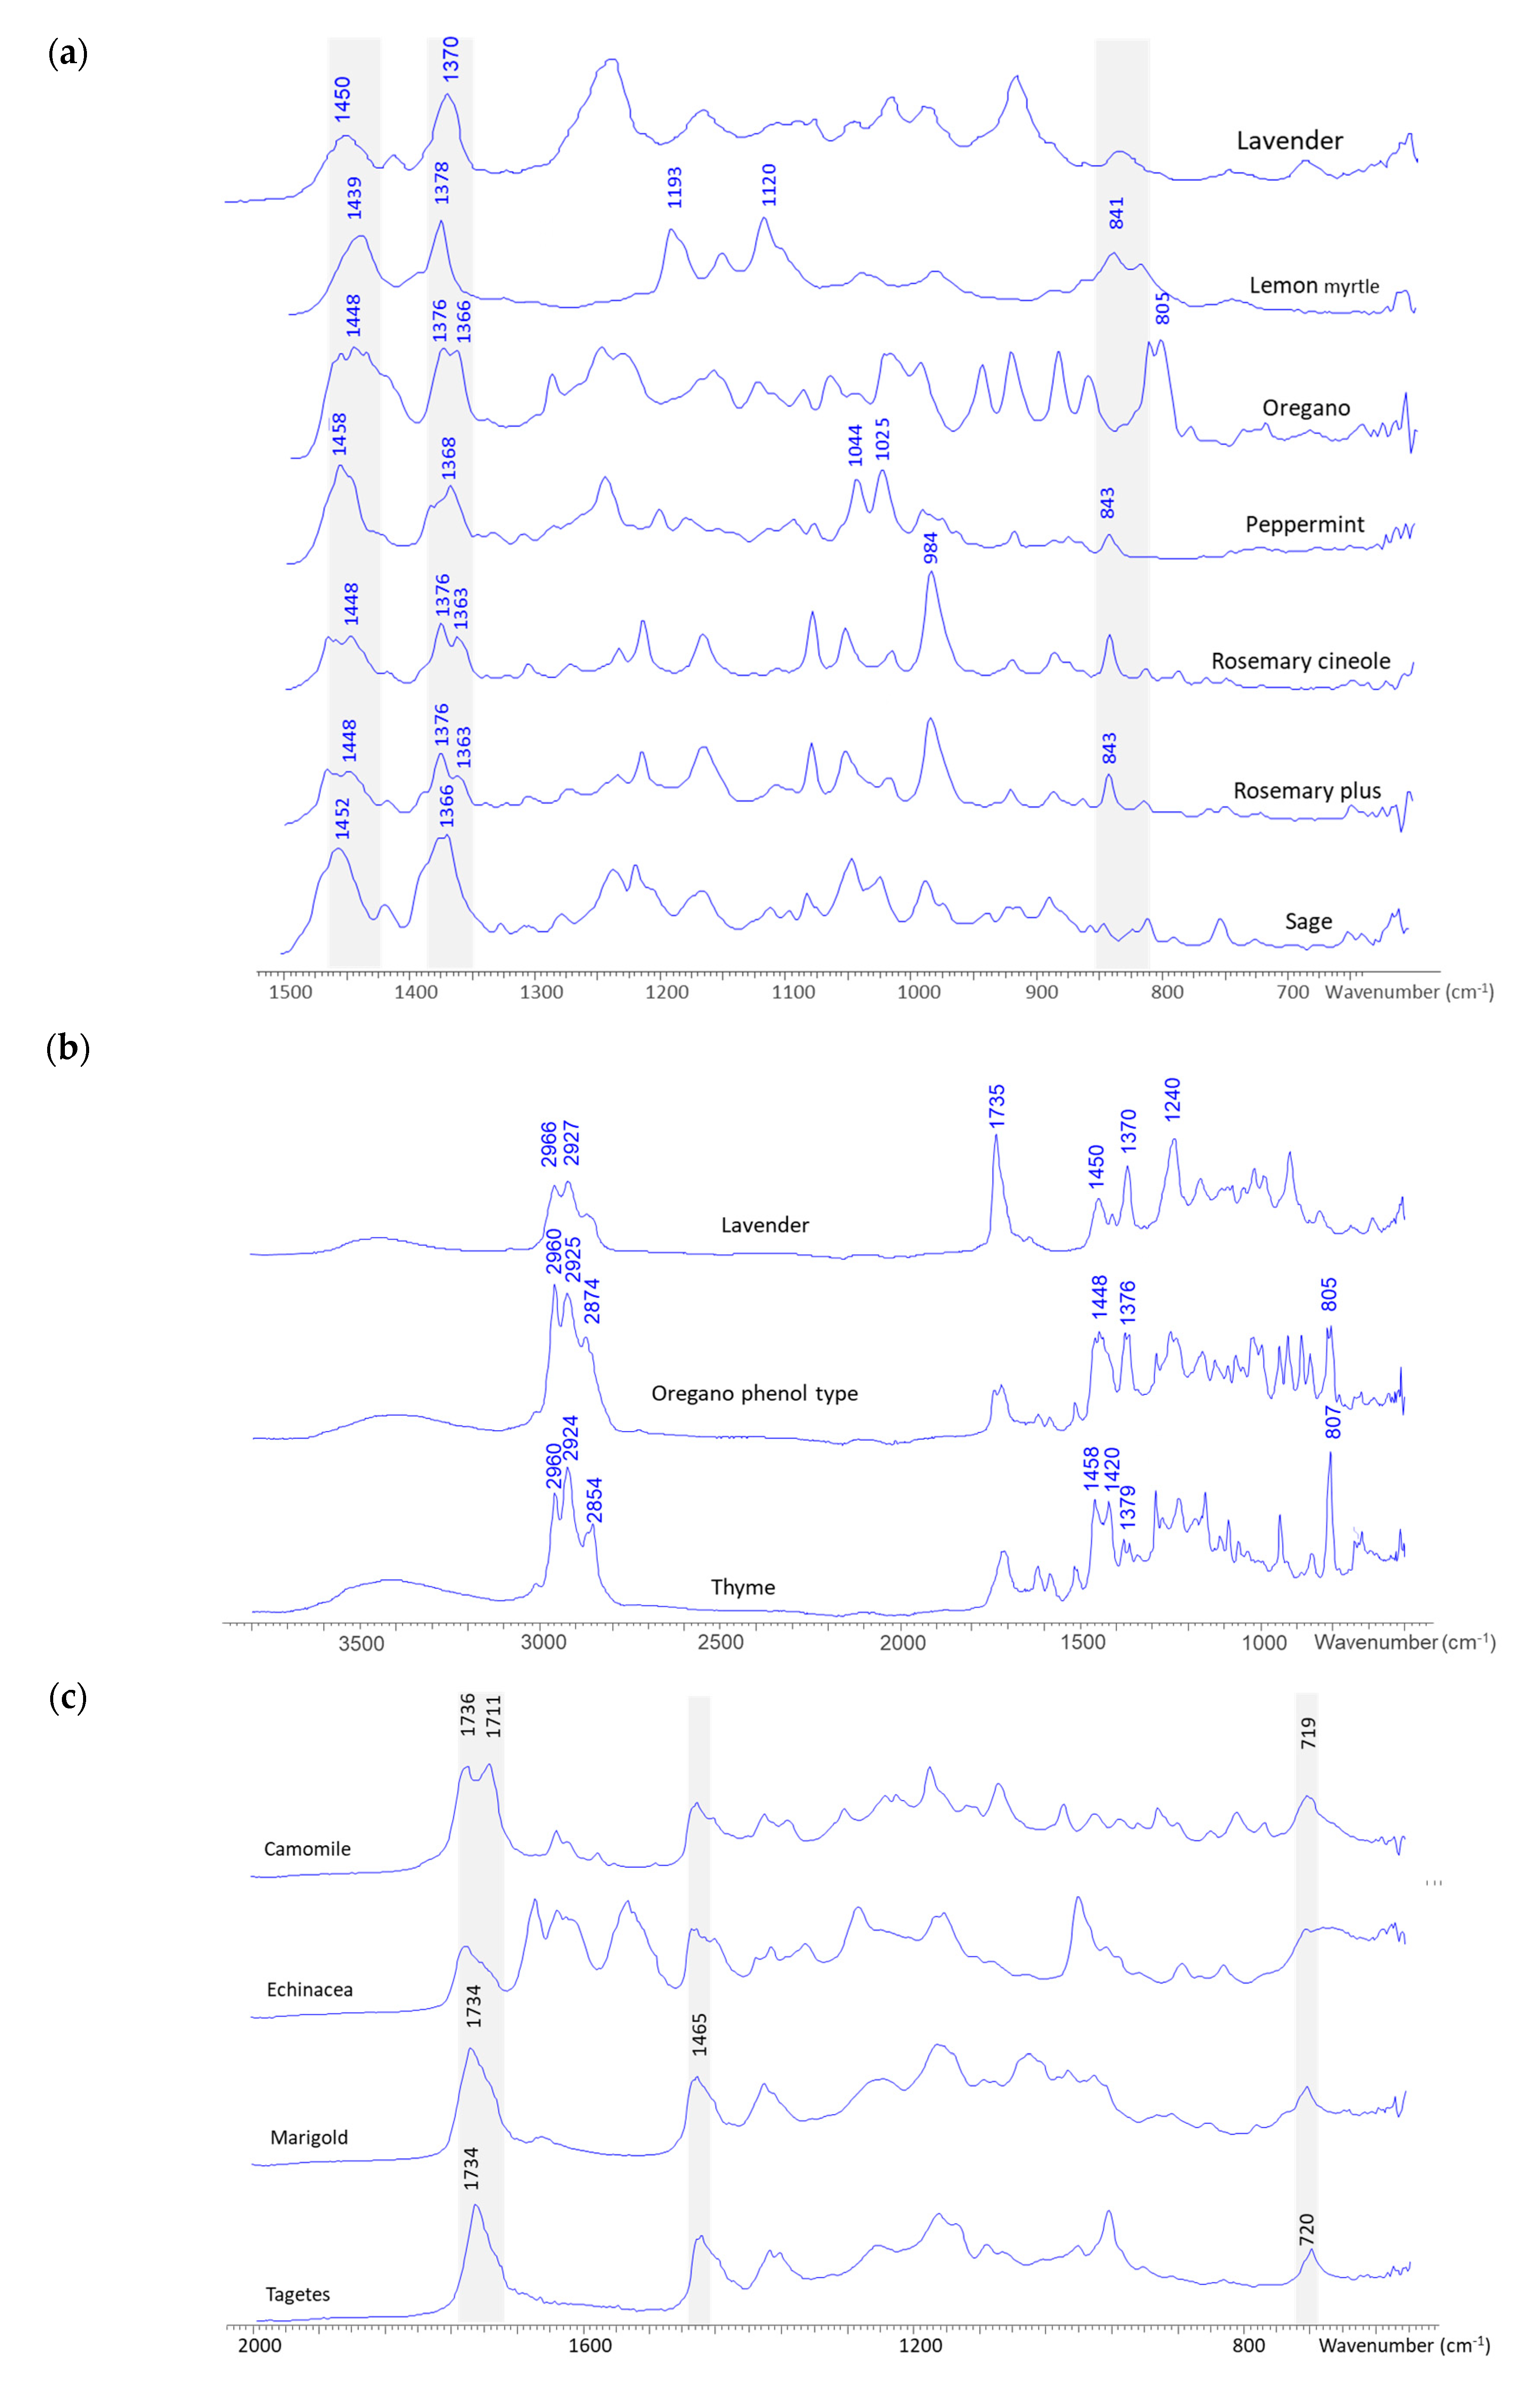
| Family | Species | ATR-IR Peaks | Compound Assignment |
|---|---|---|---|
| Lamiaceae family cluster | Oregano (terpineol type), sage, lemon myrtle, rosemary (cineol type), rosemary plus, peppermint and lavender | ~1375 and 1450 cm−1 | =CH2 in plane deformation at 1420 cm−1 (presence of =CH2 group will increase intensity of the peaks from 1330–1410 cm−1 for some terpenes) [22]. Peak at ~1450 cm−1 is a result of overlap of CH2 deformation and asymmetrical CH3 deformation (intensity of this peak is proportional to the number of CH2 and CH3 groups present) |
| 3400–3500 cm−1 (broad band) | Lamiaceae family plant extracts have a higher content of phenolics (and flavonoids). | ||
| 842 cm−1 (shifted to 862 cm−1 in oregano) | Weak skeletal vibration for isopropyl (R1R2C=CHR3 out-of-plane deformation of non-strained, weakly strained (cyclohexene derivatives) and strongly strained systems); key characteristic peak for carvacrol occurs at 862 cm−1 | ||
| 1635–1650 cm−1 (low intensity peaks) | Vibration for RHC=CH2 (linalool and linalool acetate). | ||
| 1745 cm−1 | Carbonyl stretching from α-thujone and camphor (sage essential oil) | ||
| Oregano (phenol type), thyme | 1458 and 1380 cm−1 | Double bands at 1370 and 1380 cm−1 from isopropyl groups (tetrahydrolinalool, tetrahydrogeraniol and their acetates), gem dimethyl (>C(CH3)2) in α- and β-pinene band at 1385 cm−1 could be related to bending symmetric CH3(CO) vibration of 1,8-cineole | |
| ~810 cm−1 | C-H out-of-plane bending for carvacrol (oregano); ring vibration of thymol is seen at 807 cm−1, while for carvacrol this corresponding signal appears at 811 cm−1 | ||
| Asteraceae family cluster | Echinacea, marigold, tagetes and chamomile | 1733 cm−1 | Carbonyl stretching (chamomile has a double C = O band at 1711 and 1735 cm−1; this band is smaller in intensity for echinacea). |
| 850-920 cm−1 | Methylene =CH2 out-of-plane deformation (β-pinene absorbs at 875 cm−1 due to the strained ring structure with an exocyclic =CH2 group). This band indicates the presence of myrcene in chamomile (high intensity due to the conjugation with the vinyl group) | ||
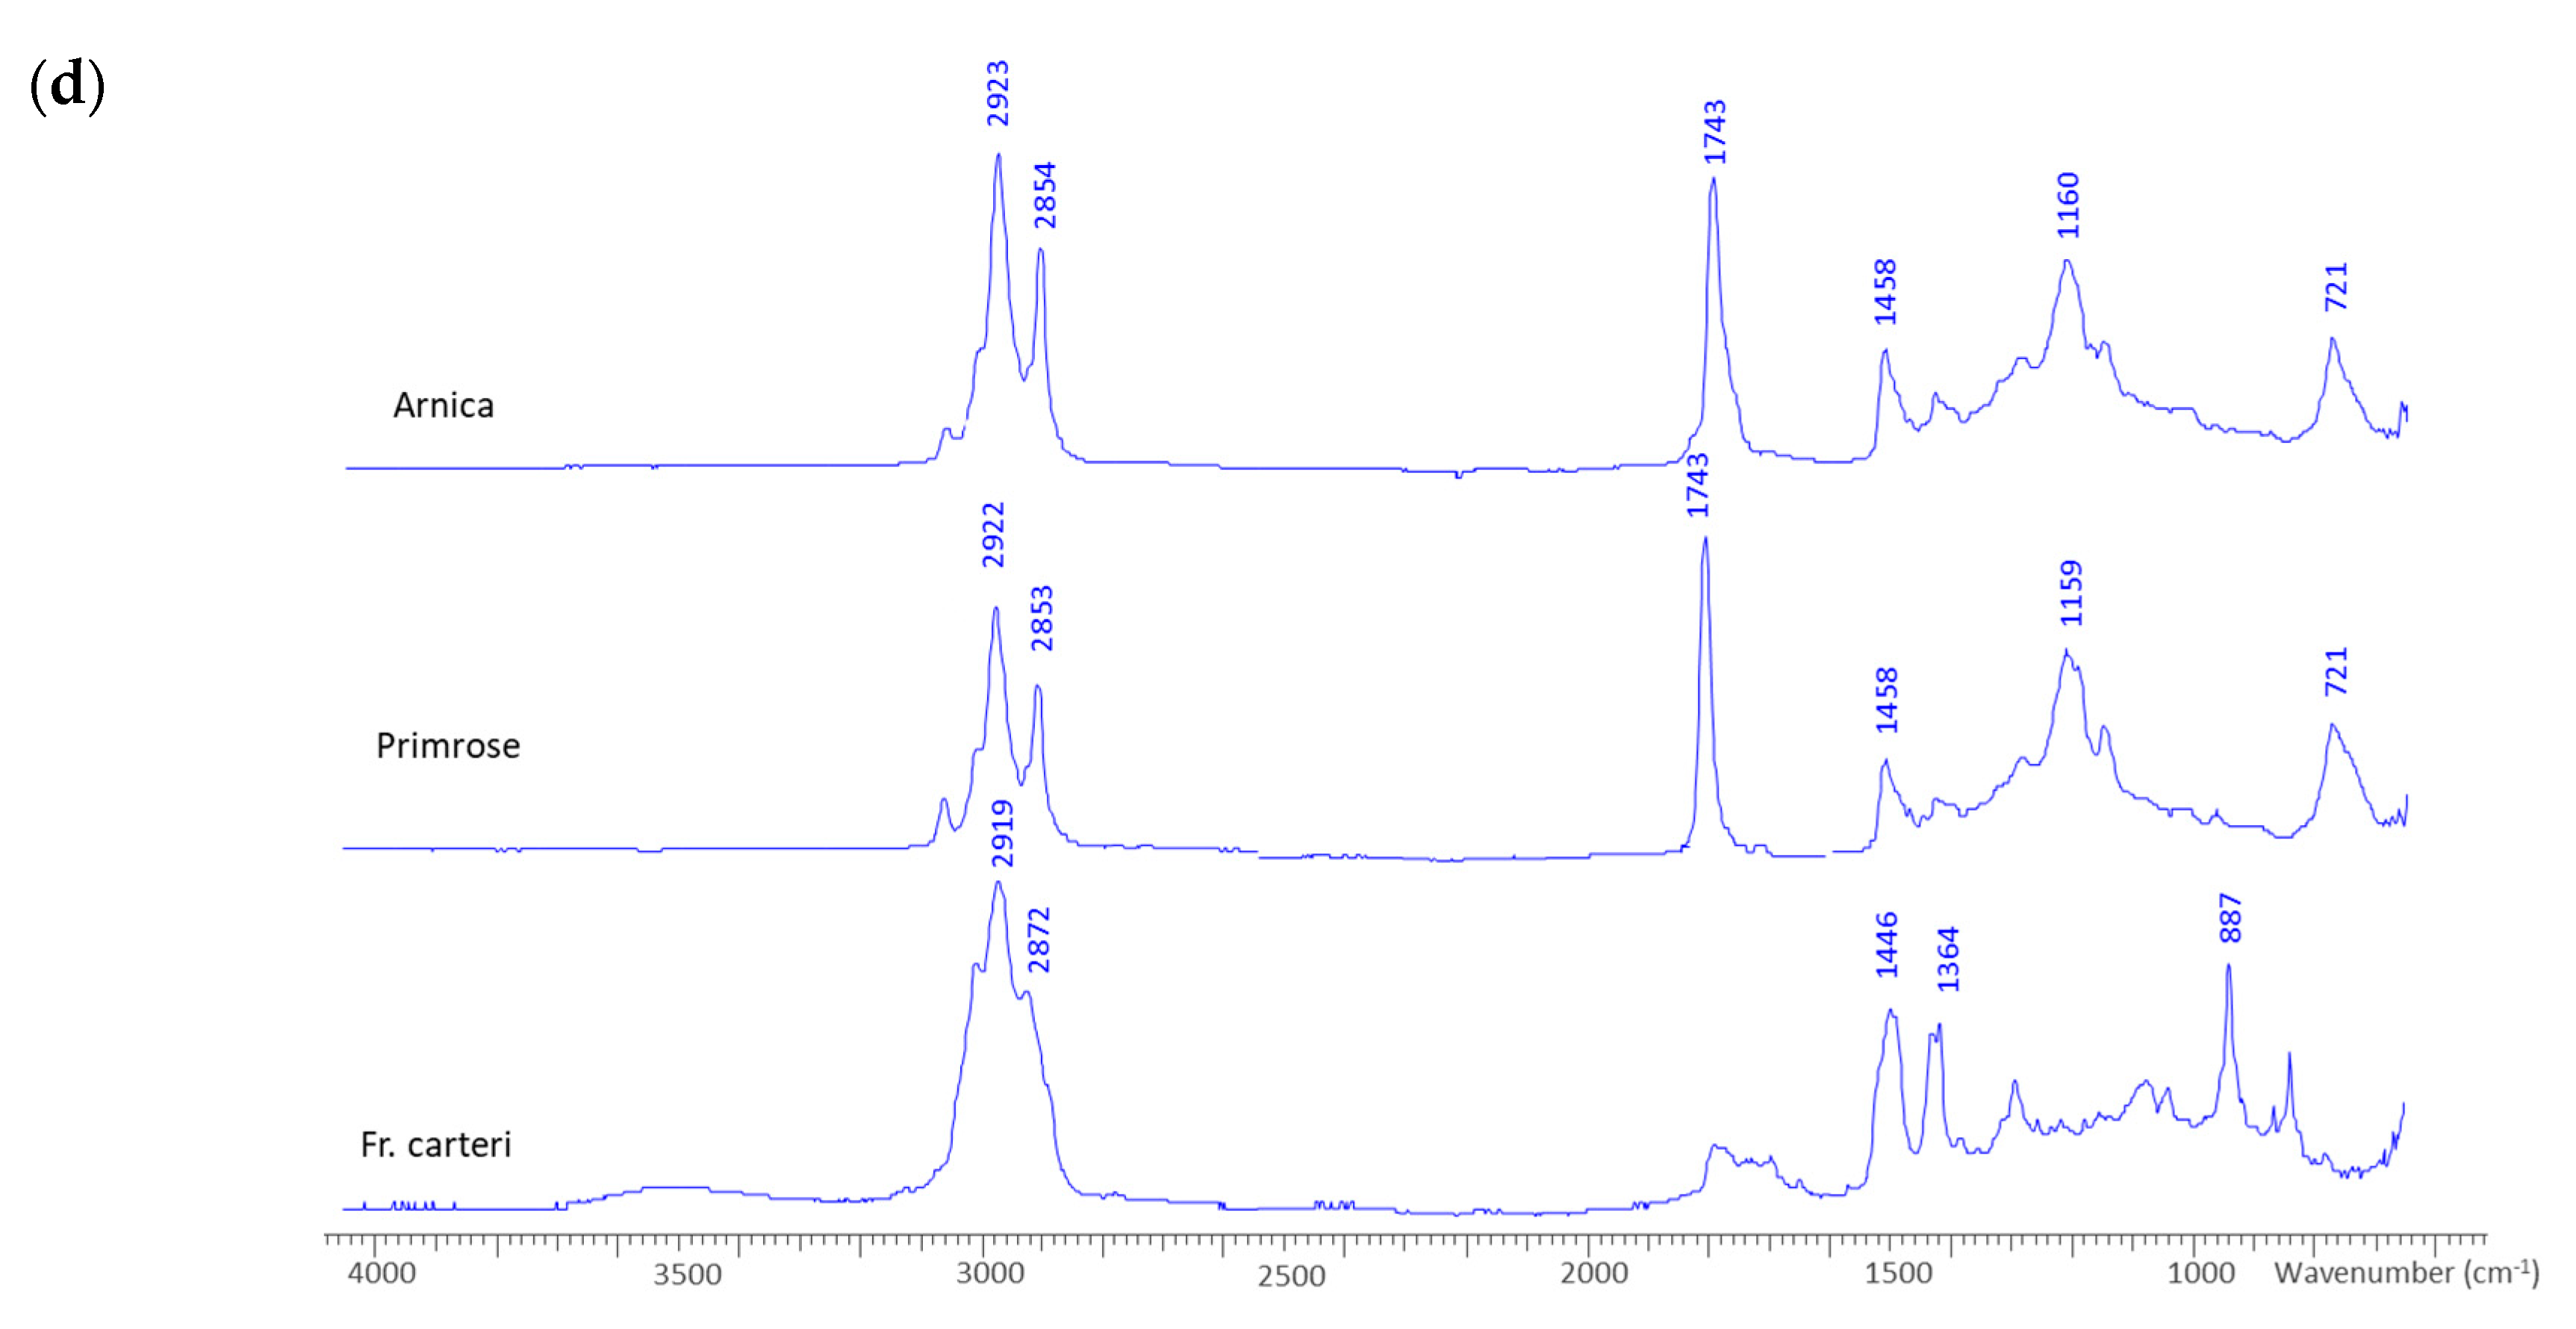
| Mixed cluster | Arnica, primrose and frankincense | 1159 cm−1 | Stretching of C-O and bending of C-OH due to the presence of lipids and alcohol groups in unsaturated fatty acids (primrose), diterpene alcohols (frankincense) and triterpenediol esters (arnidiol/faradiol) in arnica |
| 1743 cm−1 | Carbonyl stretching |
Publisher’s Note: MDPI stays neutral with regard to jurisdictional claims in published maps and institutional affiliations. |
© 2020 by the authors. Licensee MDPI, Basel, Switzerland. This article is an open access article distributed under the terms and conditions of the Creative Commons Attribution (CC BY) license (http://creativecommons.org/licenses/by/4.0/).
Share and Cite
Agatonovic-Kustrin, S.; Ristivojevic, P.; Gegechkori, V.; Litvinova, T.M.; W. Morton, D. Essential Oil Quality and Purity Evaluation via FT-IR Spectroscopy and Pattern Recognition Techniques. Appl. Sci. 2020, 10, 7294. https://doi.org/10.3390/app10207294
Agatonovic-Kustrin S, Ristivojevic P, Gegechkori V, Litvinova TM, W. Morton D. Essential Oil Quality and Purity Evaluation via FT-IR Spectroscopy and Pattern Recognition Techniques. Applied Sciences. 2020; 10(20):7294. https://doi.org/10.3390/app10207294
Chicago/Turabian StyleAgatonovic-Kustrin, Snezana, Petar Ristivojevic, Vladimir Gegechkori, Tatiana M. Litvinova, and David W. Morton. 2020. "Essential Oil Quality and Purity Evaluation via FT-IR Spectroscopy and Pattern Recognition Techniques" Applied Sciences 10, no. 20: 7294. https://doi.org/10.3390/app10207294
APA StyleAgatonovic-Kustrin, S., Ristivojevic, P., Gegechkori, V., Litvinova, T. M., & W. Morton, D. (2020). Essential Oil Quality and Purity Evaluation via FT-IR Spectroscopy and Pattern Recognition Techniques. Applied Sciences, 10(20), 7294. https://doi.org/10.3390/app10207294